Article

Integrated Omics-Based Discovery of Bioactive Halogenated Metabolites from the Deep-Sea Streptomyces sp. B188M101

by
Emmanuel Tope Oluwabusola
1,*,†,
Stephen A. Jackson
2,3,†,
Cristina Brunati
4,
Stefanie Gackstatter
5,
Hannah Vedder
6,
Marianna Iorio
4,
Gargee Chawande
2,
Lekha Menon Margassery
2,
Giang-Son Nguyen
7,
David J. Clarke
2,
Rainer Ebel
1,
Marcel Jaspars
1 and
Alan D. W. Dobson
2,3
1
Marine Biodiscovery Centre, Department of Chemistry, University of Aberdeen, Aberdeen AB24 3FX, UK
2
School of Microbiology, University College Cork, College Road, T12 K8AF Cork, Ireland
3
Sustainability Institute, University College Cork, Lee Road, T23 XE10 Cork, Ireland
4
NAICONS, viale Ortles 22/4, 20139 Milan, Italy
5
Interfaculty Institute of Biochemistry, University of Tübingen, 72076 Tübingen, Germany
6
Department of Pharmacy, Philipps University Marburg, 35043 Marburg, Germany
7
Department of Biotechnology and Nanomedicine, SINTEF Industry, 7034 Trondheim, Norway
*
Author to whom correspondence should be addressed.
These authors contributed equally to this work.
Mar. Drugs 2025, 23(9), 362; https://doi.org/10.3390/md23090362
Submission received: 16 August 2025 / Revised: 5 September 2025 / Accepted: 17 September 2025 / Published: 19 September 2025

Abstract

Using the one-strain-many-compounds (OSMAC) culturing approach, metabolomic studies, and bioassay-guided purification, we have isolated and characterised three new chlorinated natural products, agelolines B-D (13), together with two known compounds, ageloline A (4) and gausemycin A (5), which have been identified by high-resolution mass spectrometry and 1D and 2D NMR analyses. The preliminary evaluation of three small-scale extracts (M400, R358 and SGG) against the fish pathogen, Aeromonas salmonicida subsp. achromogenes KELDUR265-87, showed that the R358 extract displayed significant activity. Furthermore, the natural products (15) were evaluated against the fish pathogen Aeromonas salmonicida and human pathogens (Stenotrophomonas maltophilia L2125, Staphylococcus aureus ATCC6538P, and S. pneumoniae L44) using a serial dilution assay. Compound 3 displayed activity against Staphylococcus aureus ATCC6538P, S. maltophilia L2125, and S. pneumoniae L44 with MIC values of 6, 32, and 64 µg/mL, respectively. Interestingly, only gausemycin A (5) exhibited considerable inhibition against A. salmonicida with an MIC value of 32 µg/mL, and the activity increased by two-fold when supplemented with 0.45 mM calcium salt, while 2 and 4 showed moderate inhibition against S. maltophilia L2125. The biosynthetic pathways of compounds 14 were proposed. This is the first report of specific inhibition of A. salmonicida by 5.

Graphical Abstract

1. Introduction

Aquaculture is one of the fastest growing food production systems within the agrifood sector, with a 54% increase in production over the period 2010–2019, reaching levels of 94 million tonnes of seafood in 2022 [1], and it continues to be an important source of food for the world’s population [2]. The global aquaculture market was valued at USD 311.1 billion in 2023 and is projected to increase to USD 573.7 billion by 2035 at a 5.2% compound annual growth rate [3]. With the ongoing increase in food consumption globally, aquaculture will continue to play an important role as a food source and in doing so help with global food security, while addressing nutritional deficiencies and malnutrition challenges against the backdrop of an escalating world population [2]. One of the main challenges facing the aquaculture industry, particularly as it intensifies, is controlling a number of diseases caused by pathogenic bacteria, which can result in significant economic damage due to morbidity and death, which in 2014 was estimated to be in the region of USD 6 billion annually [4].
In this context, Aeromonas salmonicida (Family Aeromonadaceae, Phylum Pseudomonadota) is an important fish pathogen that constitutes the only known non-motile species in its genus, which comprises five subspecies which cause typical (subsp. salmonicida) or atypical (subsp. achromogenes, subsp. masoucida, subsp. pectinolytica, and subsp. smithia) furunculosis, soft tissue rot, fin rot, and haemorrhagic septicaemia in salmonid fish [5].
Antibiotics are commonly used in the aquaculture sector to treat fish during disease outbreaks, but their efficacy is often undermined due to the target bacteria developing antibiotic resistance resulting from the frequent use of these antibiotics and their subsequent persistence in the aquatic environment [6]. For example, the plasmidome of A. salmonicida is known to contain plasmids conferring resistance against chloramphenicol, spectinomycin, streptomycin, sulfonamides, tetracycline, mercury, and quaternary ammonium compounds [7,8]. A recent genomic-based study of A. salmonicida GMT3 further highlights the antibiotic resistance characteristics of the strain with genes potentially involved in resistance to quinolones, ampicillin, streptogramin, chloramphenicol, and polymyxin, together with genes encoding efflux pump systems [9]. Aeromonas spp. are also known to be able to transfer antibiotic resistance genes in different environmental ecosystems, and to survive as biofilms on biotic or abiotic surfaces, thereby facilitating the exchange in antimicrobial resistance genes within these ecosystems [10].
Thus, a more sustainable control strategy to protect fish from these disease outbreaks is required. In this respect the introduction or augmentation of beneficial microbes and their use in aquaculture as probiotics is considered an extremely promising approach to reduce fish diseases [11,12,13]. A stable and resilient microbiome is intimately involved in helping maintain overall good fish health by assisting the fish host in its defence against colonization and infection by pathogens. Specific microbes, or microbial consortia, and their metabolites are known to protect fish against these pathogens by enhancing stress resistance and immunity [12,14,15]. In particular a number of actinobacterial-based probiotics have been successfully employed in aquaculture systems, including Streptomyces strains [16], with for example S. panacagri and S. floculus being reported to display antagonistic activity against Vibrio harveyi, V. parahaemolyticus, and V. vulnificus [17].
Recent years have seen technological advances in areas such as high-throughput screening, genomics, and associated bioinformatics, as well as metabolomics and related chemoinformatics, which have accelerated the discovery, dereplication, and further characterisation of marine natural products [18,19]. The integration of these technologies, such as with the Paired Omics Data Platform [20] and with such tools as FERMO [21] and nanoRAPIDS [22], has streamlined the integration of complementary workflows, making detailed characterisations of the biosynthetic routes and structural characteristics of the chemical entities responsible for observed bioactivities much easier. The integration of high-throughput metabolomics and genomic sequencing has allowed for the targeted prioritisation of novel metabolites while linking this novel chemistry to their biosynthetic gene clusters from large libraries of bacteria [23,24] and fungi [25]. These studies have enabled the discovery of the anti-cancer peptide tambromycin, produced by Streptomyces spp. from a collection of actinomycetes, and also the discovery of 20 members of a new class of non-ribosomal peptides produced by Micromonospora spp. [24].
In an effort to identify a marine-derived antibiotic that may be useful in preventing the growth of various fish pathogens, we isolated Streptomyces sp. B188M101 from the deep-sea sponge Lissodendoryx diversichela [26]. In the fermentation process of the isolated bacterial strain, an OSMAC (one-strain-many-compounds) strategy was adopted to enhance production of unique secondary metabolites with the aim of expressing cryptic genes by altering the media composition of the culture broth [27,28,29,30]. The carbon and nitrogen sources, including the salt content of the growth media composition, were considered in particular in the selection of the three media (R358, M400, and SGG) in the fermentation process. We report here on the use of metabolomic studies and bioassay-guided isolation in the identification of a unique and bioactive extract that led to the discovery of three new chlorinated natural products and the first report of a gausemycin-type compound with growth inhibition activity against the gram-negative fish pathogen, A. salmonicida.

2. Results and Discussion

2.1. Non-Targeted Multivariate Analysis of OSMAC Extracts

Streptomyces strain B188M101 was fermented in different growth media (SGG, M400, and R358) and in three biological replicates together with their respective process blanks. An untargeted metabolomic study was employed to determine the best culture media suitable for the growth and elicitation of uncommon bioactive secondary metabolites from the actinobacterial strain [31,32]. Hence, the extracts obtained were subjected to comparative metabolomic studies to uncover extracts with unique chemical diversity and specificity. Understanding the chemical space in an LC-MS dataset of a microorganism fermented under different conditions requires specialized unsupervised learning techniques: principal component analysis (PCA) [33,34], one-factor statistical analysis, including ANOVA, and the use of a Hierarchical Clustering Dendrogram [33,35].
The centroided raw data of positive mode ionisation of each extract generated from high-resolution Orbitrap IQ-X mass spectroscopy (Thermo Scientific, Waltham, MA, USA) was converted to the mzML format and further pre-processed on the MZmine software version 4.2.0 to produce feature peak lists and intensity data required for metaboAnalyst software version 6.0. Precursor mass ions from the UPLC solvent and media blanks were removed from the sample data before downstream analysis to prevent distortion of the results.
Of the 1508 molecular ion peaks obtained with an average of 167.8 peaks per sample, a total of 63.45% missing values were detected, resulting in a wide variability of metabolites amongst the extract datasets to be compared; this is a common occurrence in untargeted LC-MS data, in this case, due to the chemical diversity.
The principal component analysis (PCA) plot is displayed in Figure 1A clearly shows the relationship between the three extracts based on chemical profile similarity [36]. The first principal component (PC1) that covers the largest variance in the dataset followed by the second principal component (PC2), orthogonal to PC1 with 61.3% and 13.3%, confirmed the extent of the shared secondary metabolite distribution amongst the three extracts. However, the R358 extract was an outlier compared to the SGG and M400 extracts, being located at a distant quadrant from the respective two clusters.
The results show a low p-value of 0.0045 in comparison with the software default setting p-value of 0.05, indicating strong evidence that the variation is statistically significant. The extract datasets were further analysed using a Hierarchical Clustering Dendrogram, which as previously mentioned is another unsupervised technique used to perform exploratory data analysis (EDA) that allows for in-depth understanding of skewed data by identifying the main features which can be visualised in dendrogram formation, that is, a binary merge tree [37,38,39]. The R358 metabolites appear as a distinct cluster from the other two extract metabolites, supporting the variation observed in the two-dimensional space established by the PCA score plot (Figure 1A). Thus, it appears that the Streptomyces B188M101 produced shared groups of metabolites when fermented in SGG and M400 media.

2.2. Preliminary Disc Diffusion Assays

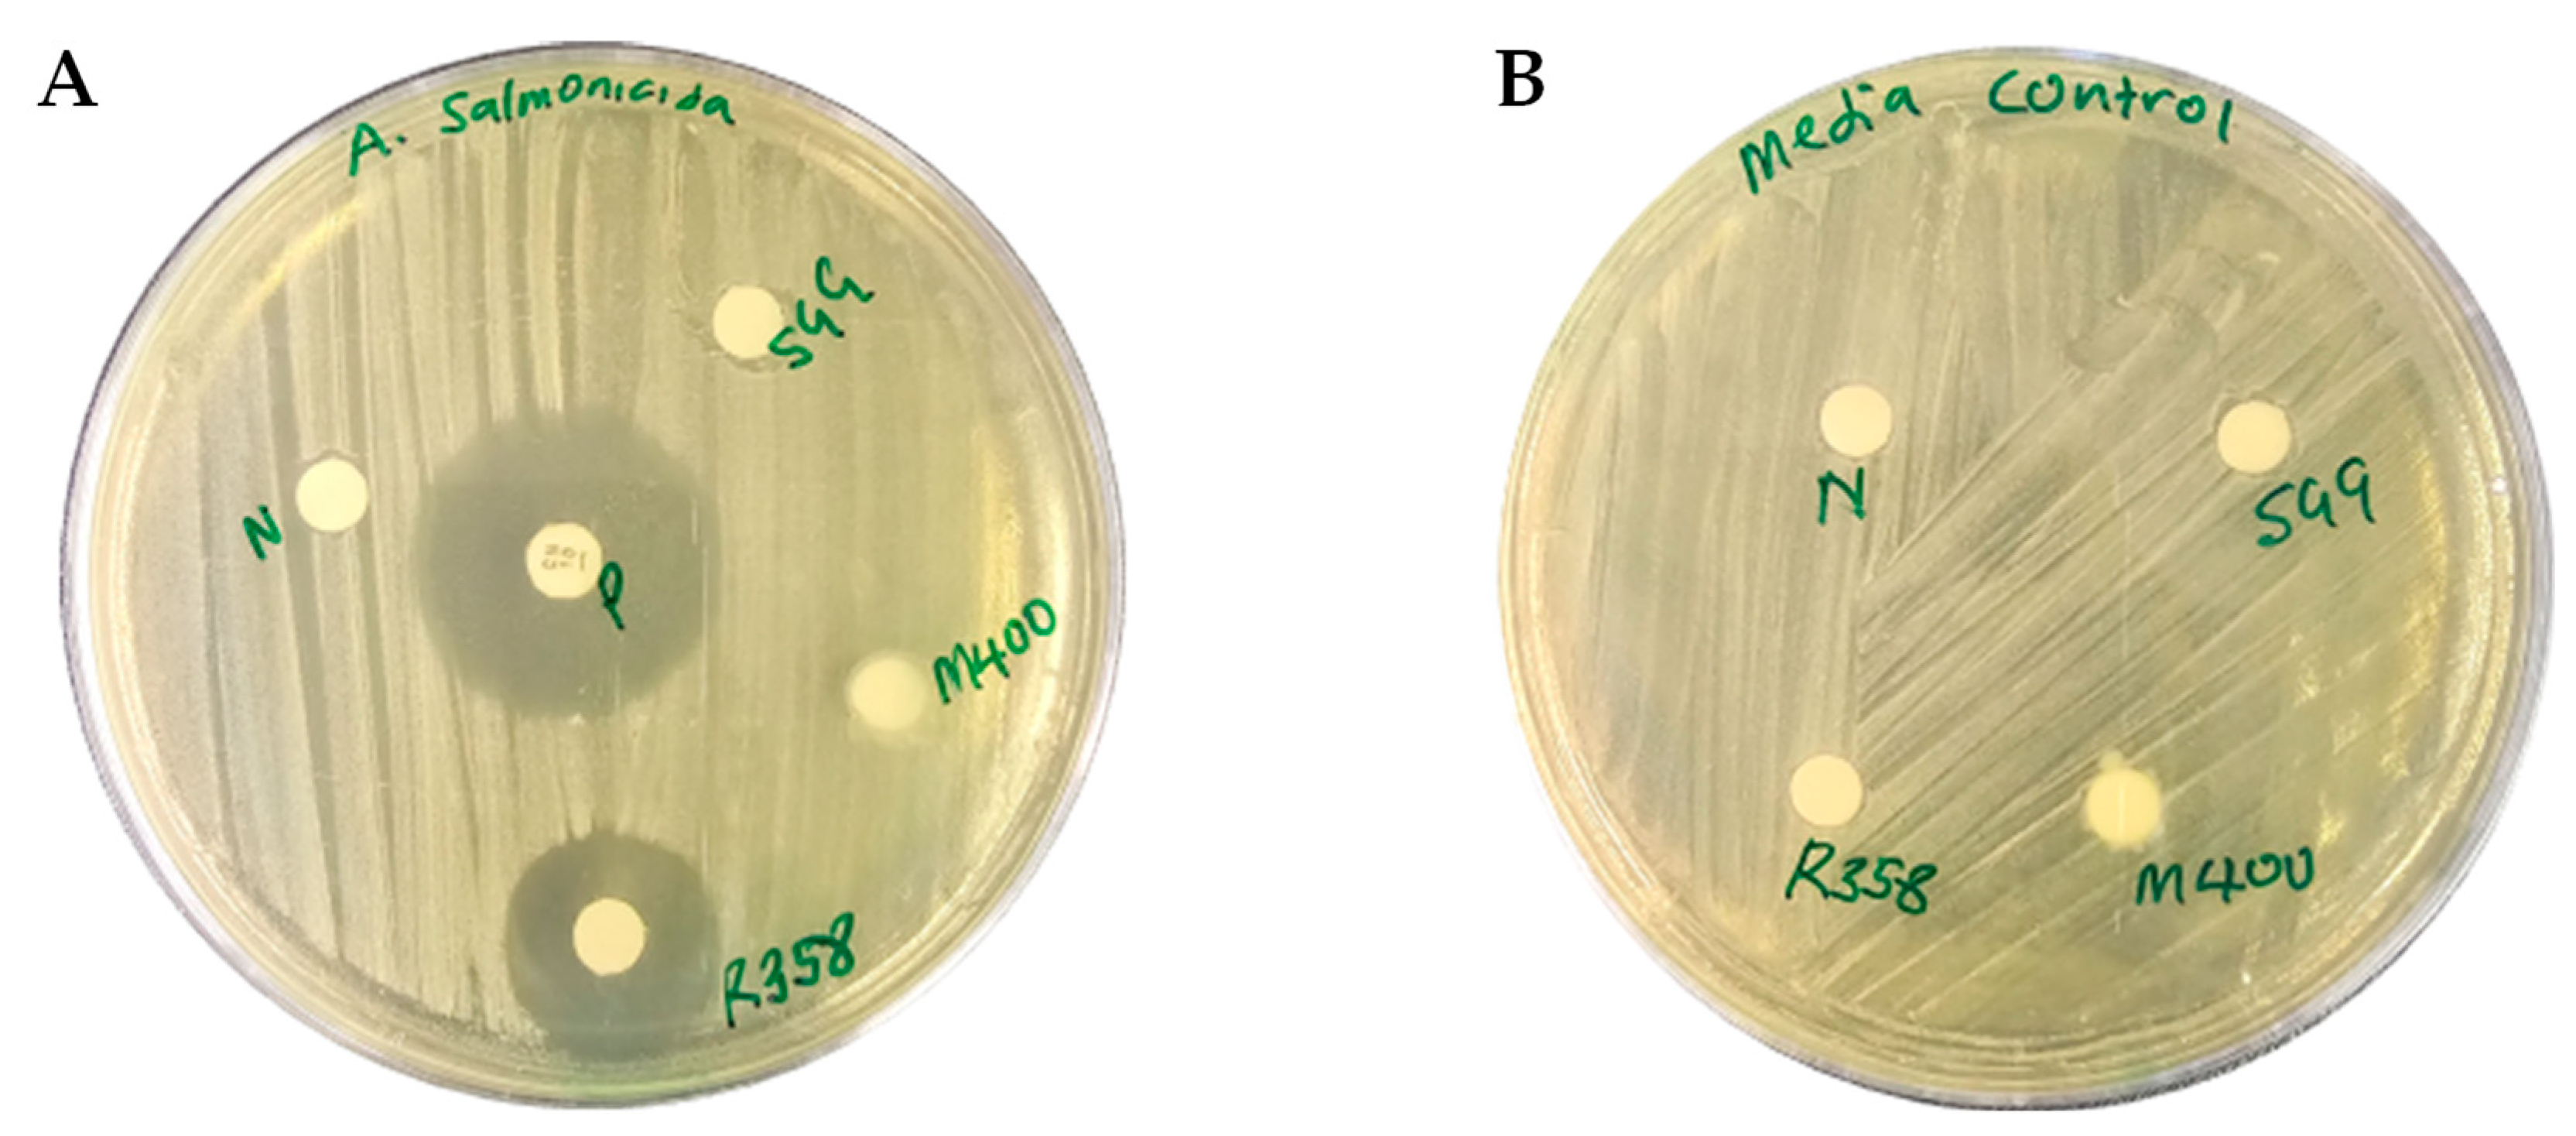
The M400, R358, and SGG extracts were screened against Aeromonas salmonicida, using a disc diffusion assay following a previously described method [40]. Following 24 h of incubation, significant inhibition was observed from the R358 extract at a concentration of 8 mg/mL with a zone of inhibition of 20 mm which was comparable to the 30 mm zone of inhibition observed from the broad-spectrum antibiotic gentamicin tested at 10 µg (Figure 2A). No activity was observed from the M400 or SGG extracts (Figure 2A) or from the media control discs (Figure 2B).

2.3. Chemoinformatic Feature-Based Molecular Networking and Database Dereplication Analysis

Both the one-factor-statistical analysis and disc diffusion assay with A. salmonicida established that the R358 extract contained bioactive secondary metabolites. Thus, we subsequently subjected the LC-MS/MS ESI-Orbitrap data of the three extracts to feature-based molecular networking (FBMN) [41] analysis. FBMN is a computational method that bridges mass spectrometry data processing tools for LC-MS/MS and molecular networking analysis on the Global Natural Products Social Networking (GNPS) site and was employed here to investigate the molecular ecosystem and annotate new compounds in the crude extracts SGG, R358, and M400 by visualising the entire integrated features of the metabolomes. This type of bioinformatic technique mainly utilises the mass fragmentation information of the node (mass peak) in each dataset to determine their spectrum and feature similarity, hence, organising the family of molecules in clusters. The raw files of the Orbitrap MS were converted to mzML format using MSConvert software [42], followed by pre-processing with MZmine 4.2.0 version to create a quantitative MS1 file and MGF files of fragment ions [43]. The results of the analysis are publicly available at https://gnps.ucsd.edu/ProteoSAFe/result.jsp?task=a5069300445a407d90c4b80162125c2c&view=download_cytoscape_data, accessed on 23 May 2025. Analysis of the GNPS data on Cytoscape 3.10.0 [44,45] showed 596 molecular features arranged in clusters and singletons after removal of features (1285 nodes) belonging to SGG, R358, and M400 media controls (Figure 3A).
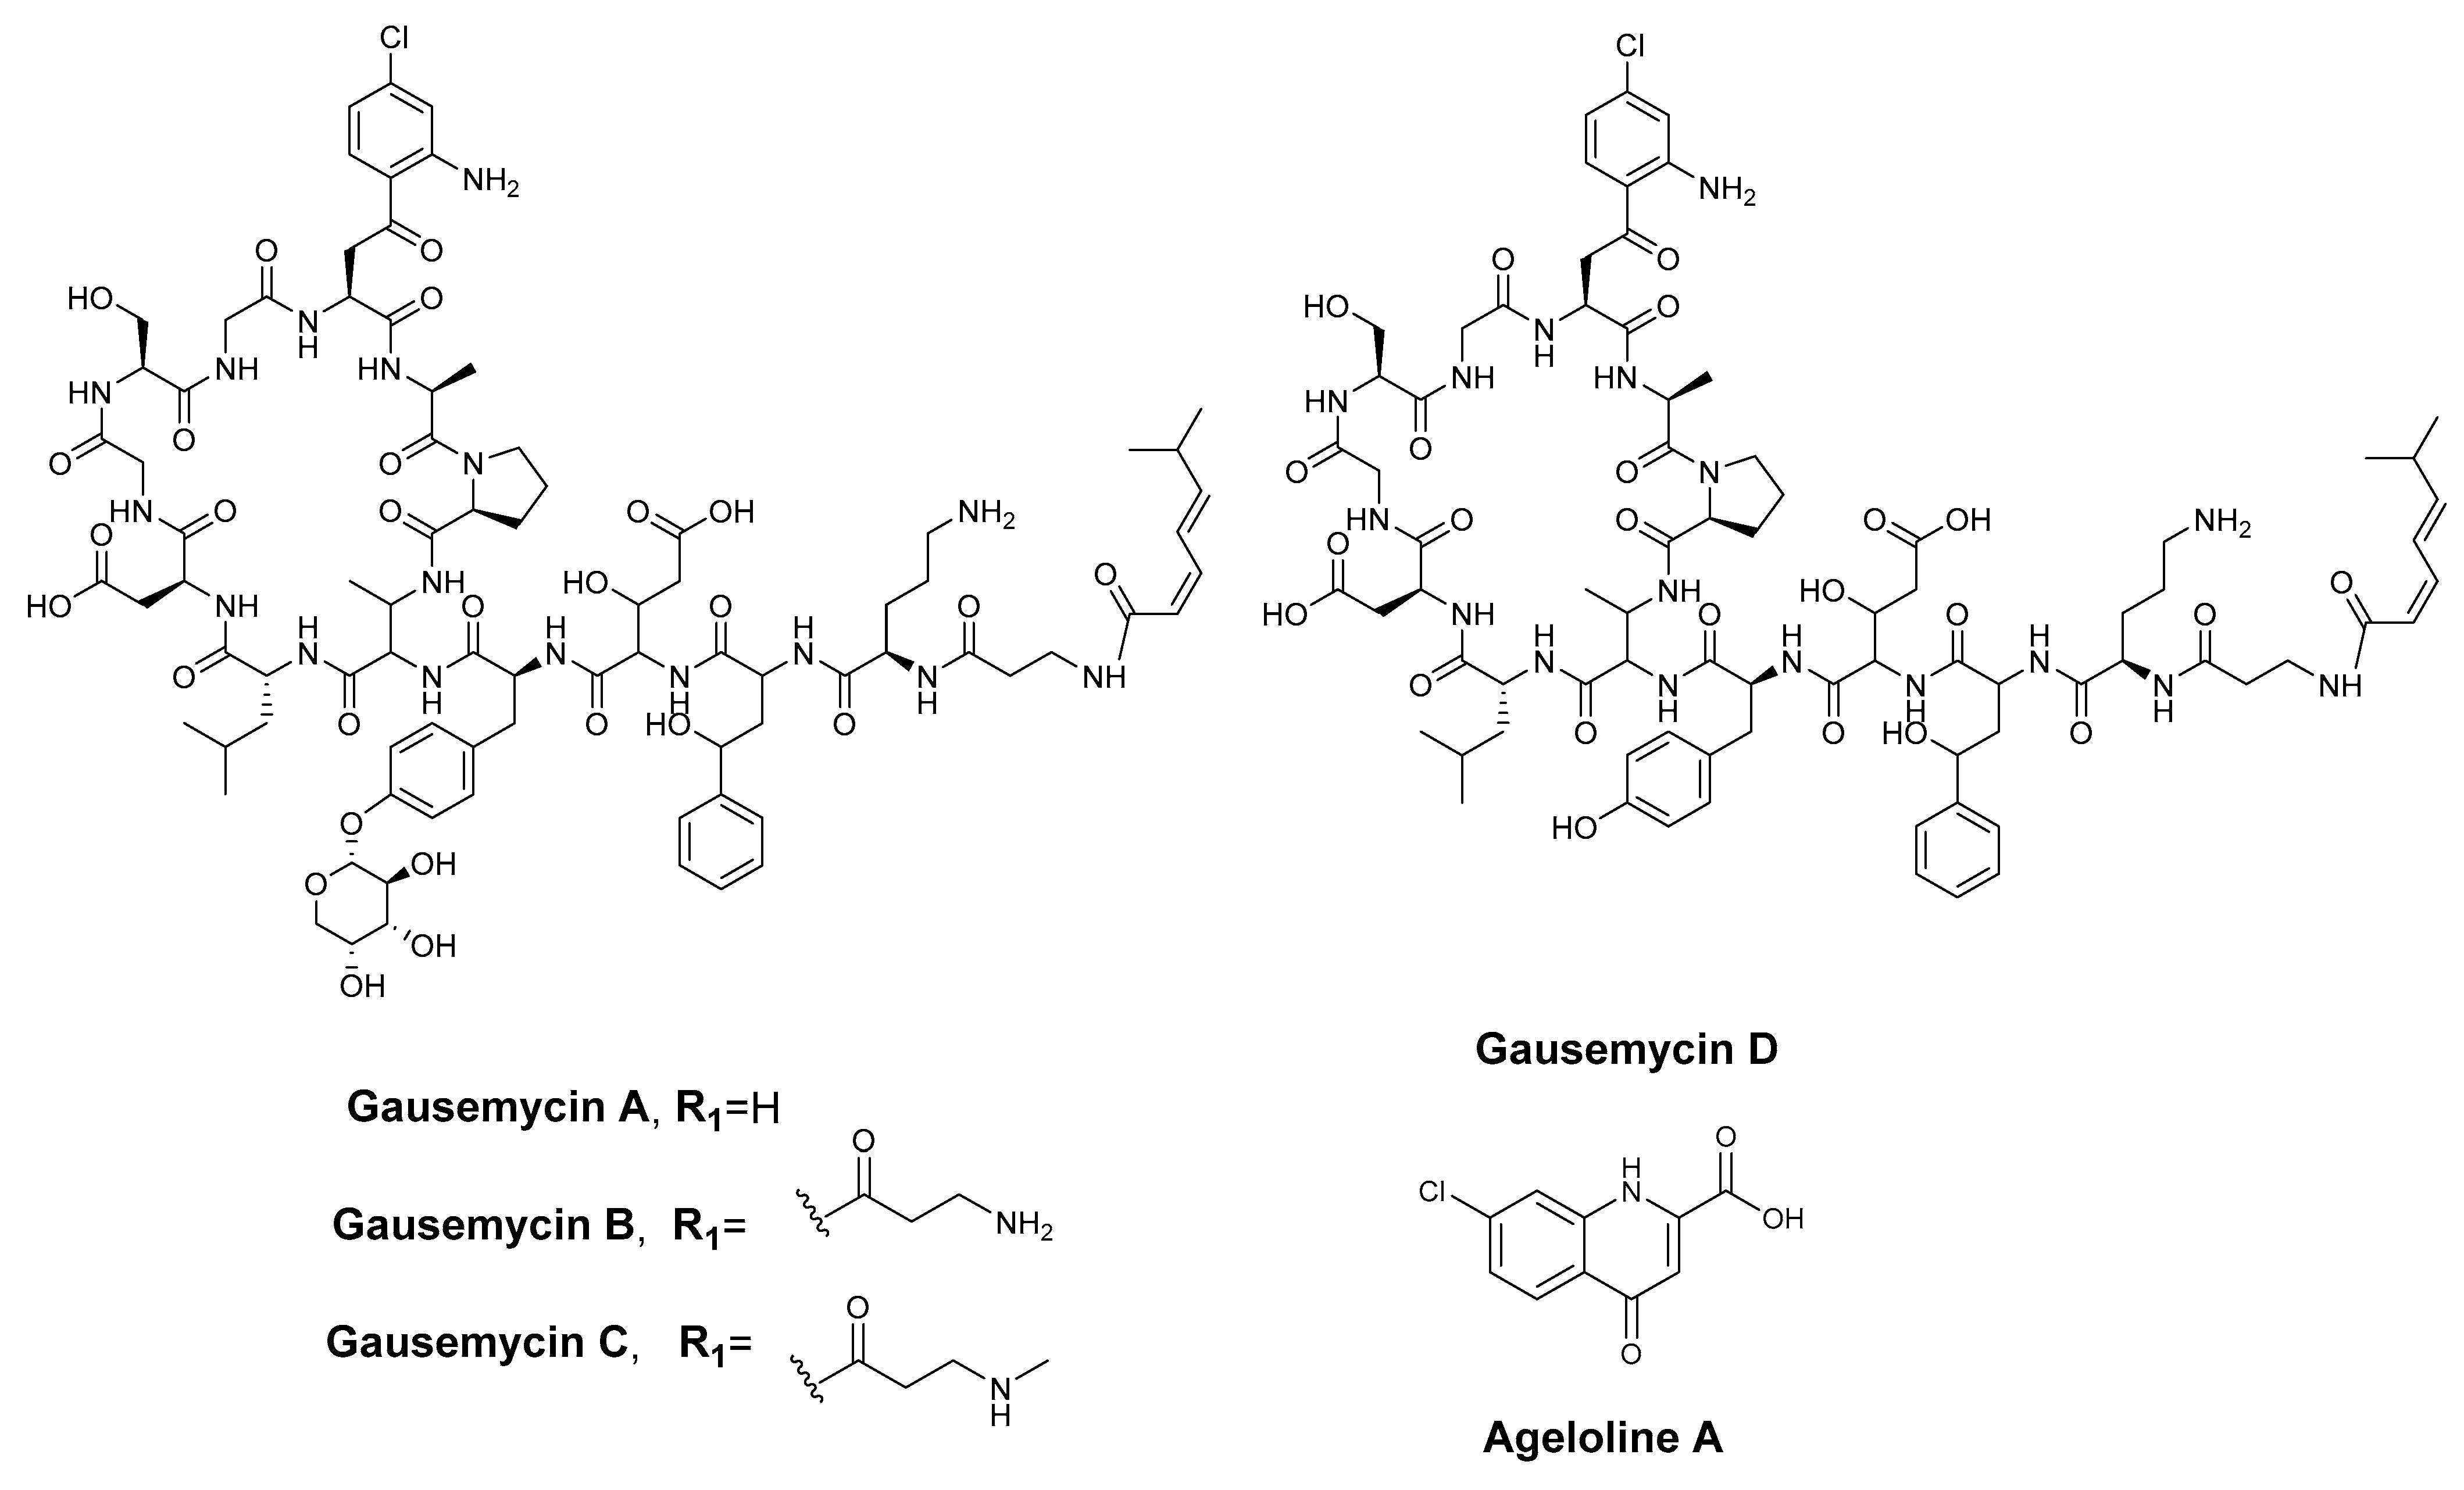
It is worth noting that 15 of the 31 molecular clusters that contained two or more features in the molecular network were specific to the R358 extract. The remaining clusters consisted of features found in either M400 or SGG extracts, further corroborating the chemical variation observed using the multivariance one-factor analysis (Figure 1). The natural product database search on the GNPS website (GNPS; http://gnps.ucsd.edu; accessed on 14 June 2025) of the identified features detected in the molecular network clusters (Figure 3A) did not show any potential match. Hence, manual dereplication processing using the Thermo Scientific FreeStyle™ 1.8 SP2 QF1 (Thermo Scientific, Waltham, MA, USA) was utilised to analyse the MS spectrum of the R358 extract and chemically profile the precursor ions at m/z for each base peak organised according to their retention time. Also, molecular formulae in accordance with the mass isotopic pattern matching [46], theoretical mass, and mass error within 3 ppm mass accuracy were established [47,48]. The dereplication of the distinctive clusters gave 23 new molecular features whose elemental compositions were consistent with chlorinated isotopic signatures and intense doubly charged base peaks (Table S1 and Figure 3B). In addition, 24 putative new non-halogenated molecules (see Table S1) and 4 known gausemycins A–D derivatives [49,50] and ageloline A [51] (see Table S1 and Figure 4) were annotated following an assessment of both the accurate exact masses and the corresponding molecular formulae on the natural product databases in combination with MS/MS fragmentation analysis.
Earlier work on these natural lipoglycopeptides led to the isolation of gausemycin A and B from the fermentation broth of Streptomyces sp. INA-Ac-5812 [49]. Other minor analogues, C–F, were subsequently isolated and structurally elucidated from the same bacterial strain [50]. According to the high-resolution Orbitrap IQ-X ESI-MS, doubly charged intense precursor ion peaks at m/z 923.9016, 959.4201, 966.4280, and 857.8801(M+2H)2+ corresponding to molecular formulae of C84H118ClO28N17, C87H123ClO29N18, C88H125ClO29N18, and C79H110ClO24N17, were attributed, respectively, to gausemycins A–D [49,50]. Their structural scaffold consisted of a cyclic core and a tail which were made up of amino acids sequences and non-proteogenic amino acids, 2-amino-4-hydroxy-4-phenylbutyric acid (Ahpb), 2,3-diaminobutyric acid (Dab), chlorinated L-4-chlorokynurenine (ClKyn), and sugar moieties (Figure 4).
A detailed MS2 analysis of gausemycin A (m/z 1846.7936, [M+H]+) was performed using high-energy collisional dissociation (HCD), selected due to the presence of a cyclic core that is less amenable to fragmentation via low-energy collision-induced dissociation (CID). The resulting fragmentation spectra revealed characteristic b- and y-ions corresponding to the N- and C-terminal regions, respectively. Fragment ions of both lower and higher m/z values were observed, representing sequences from the linear tail region as well as the cyclic core structure of gausemycin A. A detailed explanation as to the MS/MS fragmentation of gausemycin A is provided in the supplementary information (Figures S1 and S2).
Gausemycin B and C whose molecular ions were deduced as m/z 1917.8325 and 1931.8458, with respective intense doubly charge ions at 966.42587 and 959.4201[M+2H]+2, differ from gausemycin A by 71.0487 and 87.0487 Da, confirming the addition of β-alanine and methyl-β-alanine as previously reported [50] and corroborated by the MS/MS fragmentation analysis (Figures S3 and S4). The absence of sugar moieties in the MS/MS fragments of gausemycin D (m/z 1714.7521 [M+H]+1) showed it was consistent with the reported data [50]. The variation amongst known compound structures of gausemycins has been established to exist in the fatty acid chain and the attachment of amino acid building blocks on the amine functionality of ornithine at the tail region [49,50]. For instance, the molecular ions observed at m/z 864.8885 were dereplicated as putative new congeners of gausemycin D, corresponding to the deduced molecular formula C80H112ClO24N17 (Table S1 and Figure S5). The mass difference of 14.0176 Da relative to gausemycin D, supported by MS/MS experiments, suggests the direct incorporation of monomethyl on the ornithine side-chain amine group (Figure S6). This interpretation is further corroborated by the clustering of molecular ions in the molecular networking analysis (Figure 3). Additionally, fragment ion analysis of doubly charged molecular ions at m/z 930.9088 and 973.4351, corresponding to molecular formulas C85H120ClO28 N17 and C89H127ClO29N18 (Table S1, and Figures S7 and S9), revealed structural features consistent with gausemycin A. However, these respective analogues exhibited additional modifications, specifically monomethyl and dimethyl-β-alanine substituents on the ornithine amine group (Figures S8 and S10). Recent findings provide mechanistic insights into the biosynthetic pathway by which non-standard residues, such as ornithine, are methylated through methyltransferase domains embedded within non-ribosomal peptide synthetase (NRPS) systems [52,53,54]. While this dereplication process has revealed the presence of several previously uncharacterised molecules within the R358 extract, the present study is now directed towards their targeted isolation and comprehensive structural characterisation.

2.4. Isolation and Structure Elucidation of New Chlorinated Compounds

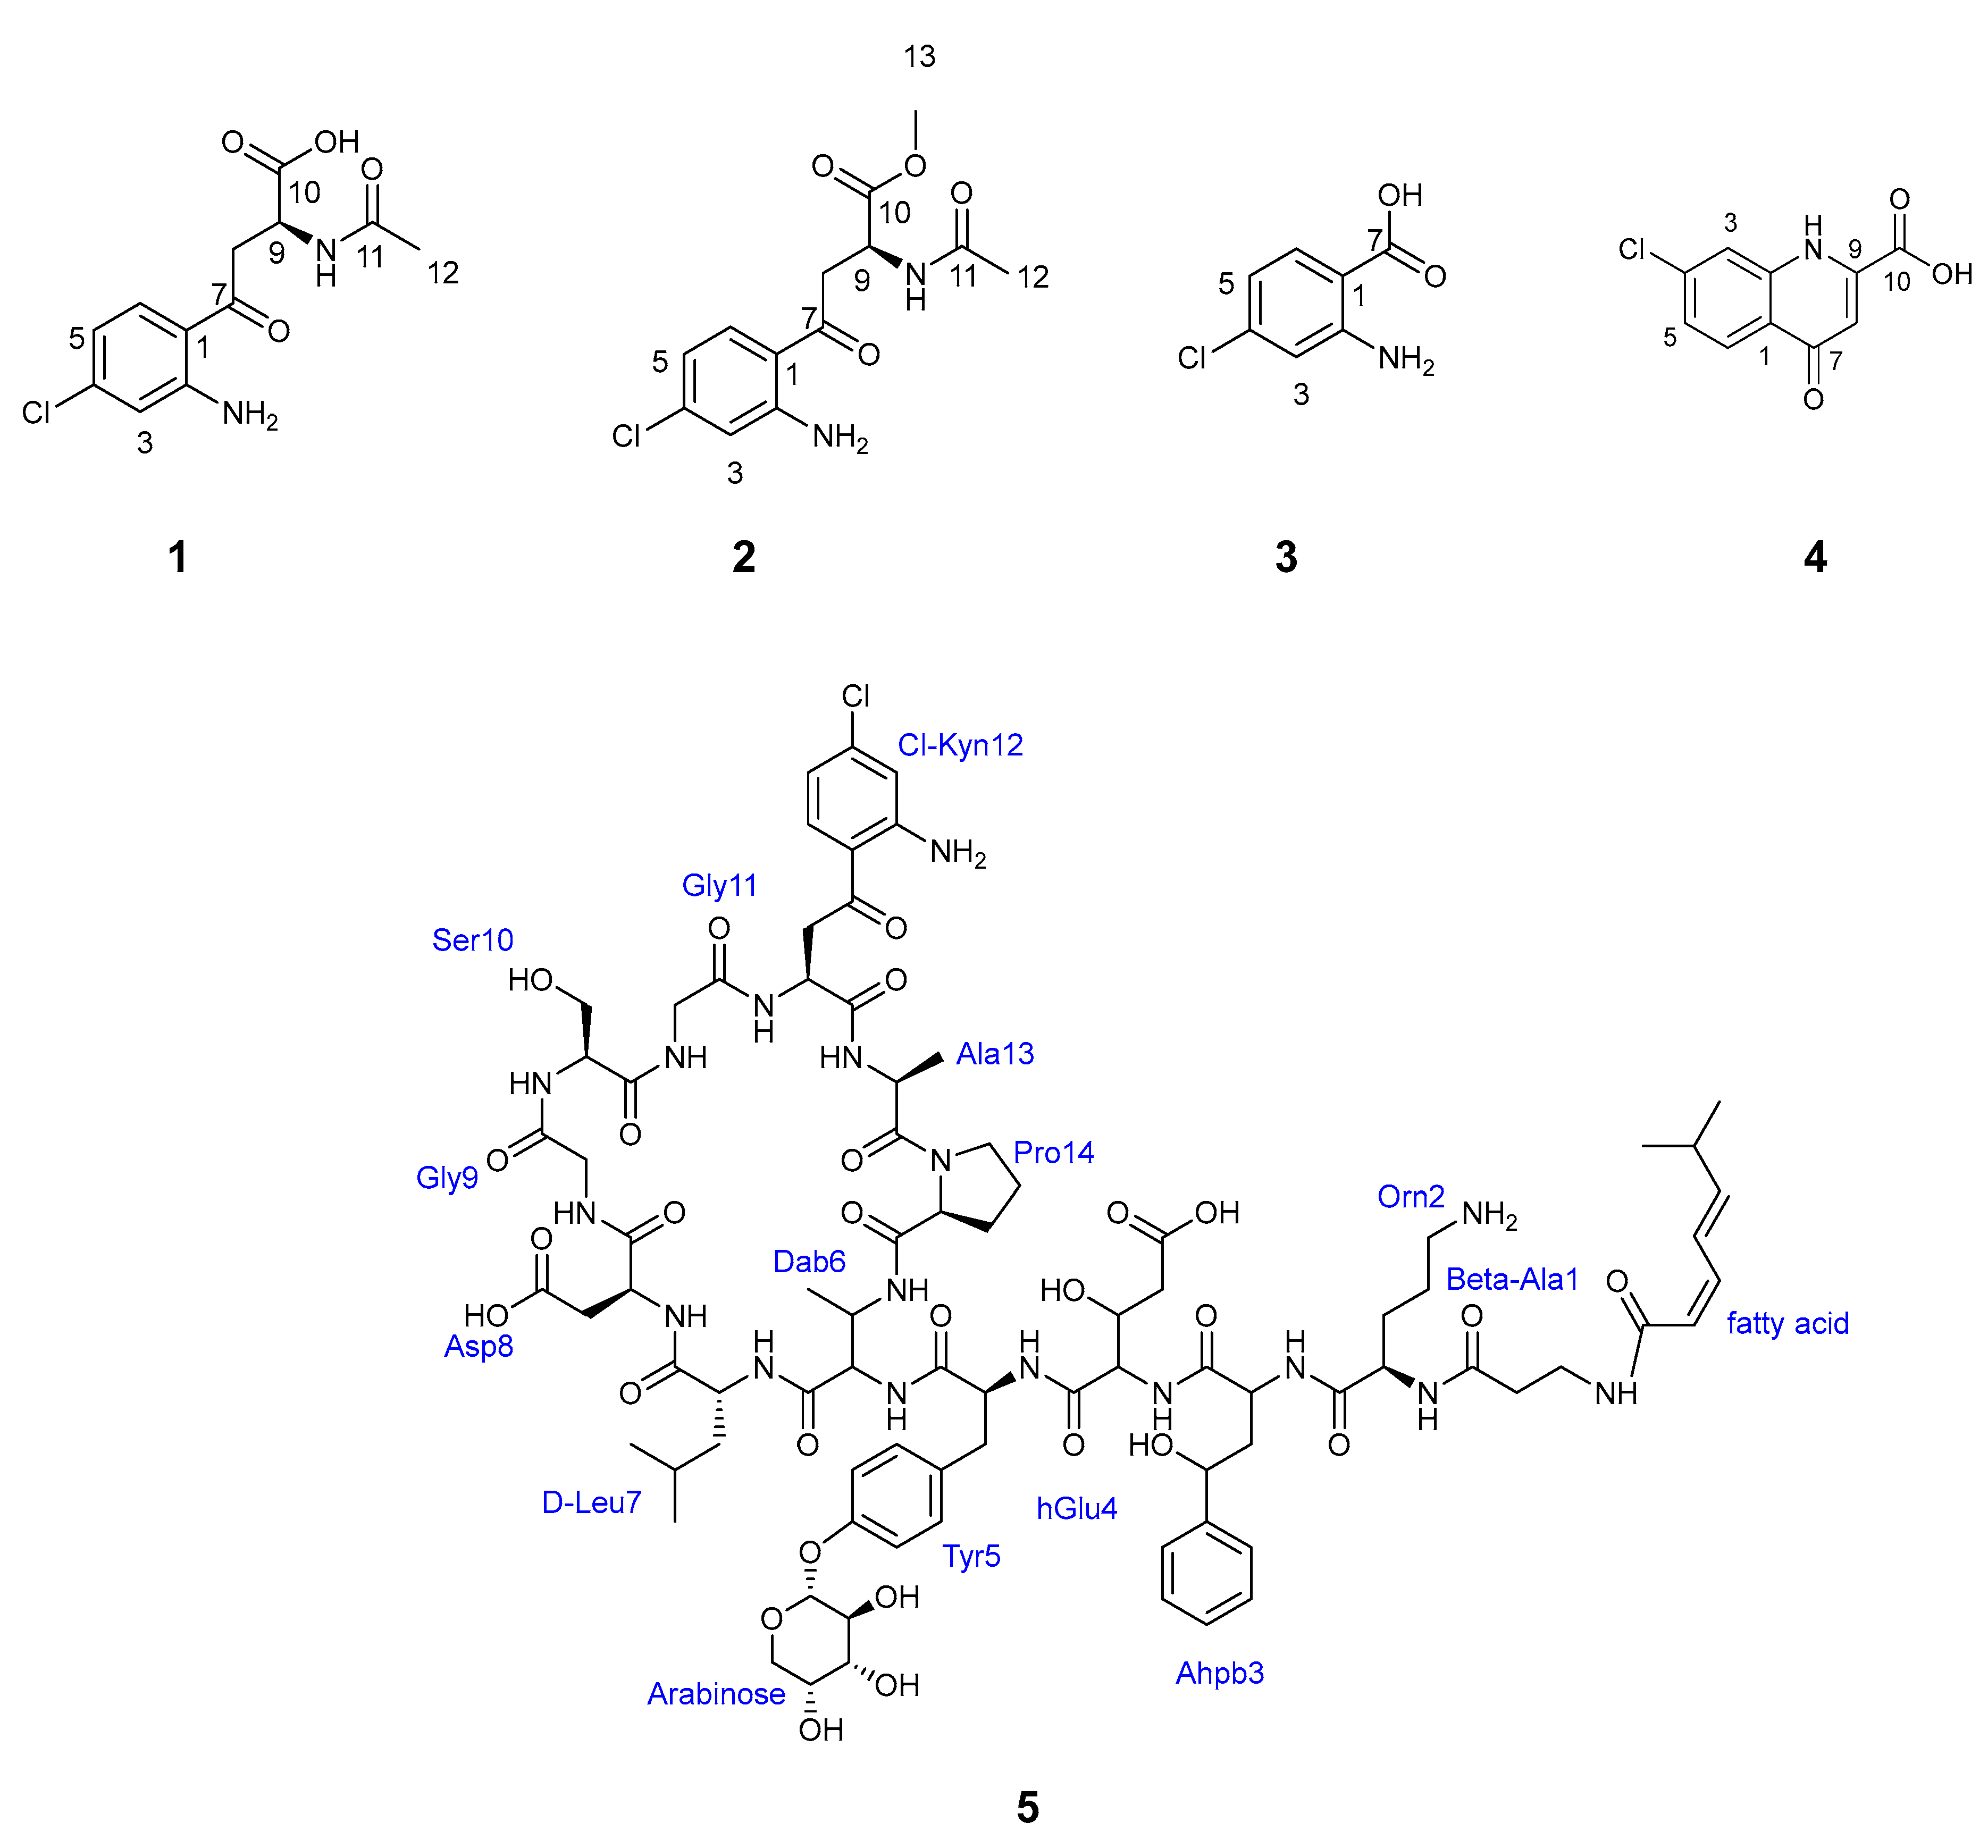
A large-scale culture (8L) of Streptomyces sp. B188M101 was grown on R358 medium in a closed system shaker at 28 °C for 10 days, yielding 16.45 g of combined extract. The extract was fractionated following a modified Kupchan solvent partitioning method [55], and upon dereplication analysis, subsequent purification of the butanol fraction resulted in the isolation of three new chlorinated compounds, designated as agelolines B–D (13), and two known compounds, ageloline A (4) [51] and gausemycin A (5) [49,50] (Figure 5), as outlined in the materials and methods section.
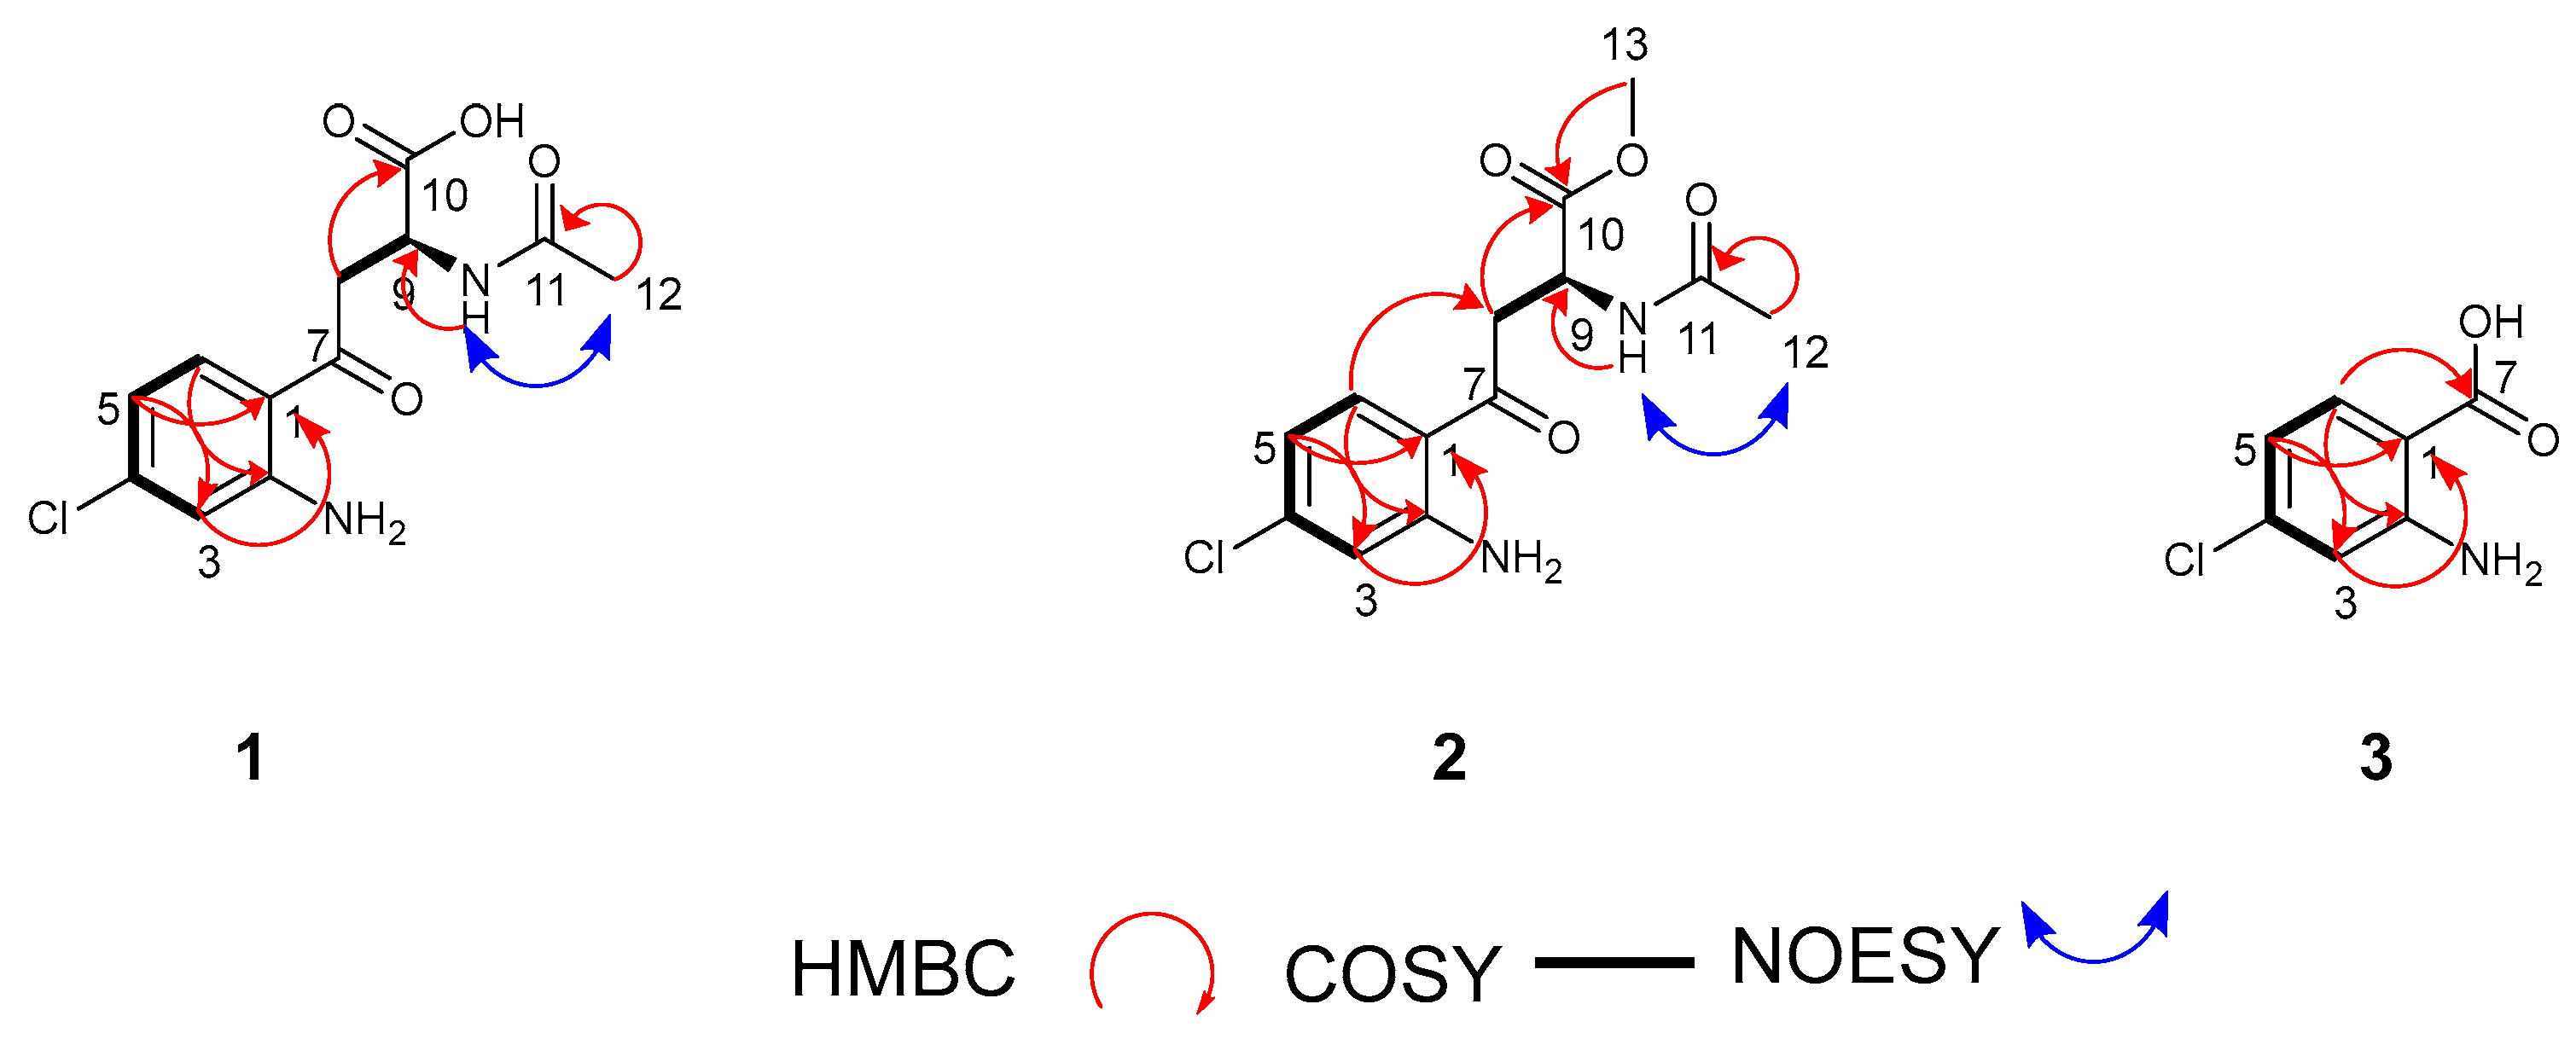
Compound 1 was isolated as yellowish powder. The high-resolution electron spray ionisation Orbitrap mass spectroscopy of 1 revealed an isotopic pattern indicating the presence of a chlorinated atom at m/z 285.0638/287.0607 (M+H, Δ + 0.5 ppm), and assigned the molecular formula C12H14ClN2O4, requiring 7 degrees of unsaturation (see Figure S11). The 1D and 2D NMR data shows the presence of signals consistent with three sp2 aromatic methines, one sp3 aliphatic methine, one sp3 methylene, one sp3 methyl, and six sp2 quaternary carbons (see Table 1 and Figures S12–S14). Detailed analysis of 1H NMR chemical shifts, coupling constants, and COSY data suggested the presence of a 1,2,4-trisubstituted aromatic ring exhibiting coupling from H-5 (δH 6.56, J = 8.7, 2.2) to both H-6 (δH 7.72, J = 8.7) and H-3 (δH 6.77, J = 2.2). The assignment of aromatic substructure, including the quaternary carbons to positions C-1 (δC 116.7), C-2 (δC 153.3) and C-4 (δC 141.0), were based on the chemical shifts and strong HMBC correlation from H-5 to C-1 and C-3 (δC 116.9), from H-6 to C-2 and C-4, and from H-3 to C-1 and C-5 (δC 115.9) (Figure 6 and Figure S15 and Table S2). The downfield chemical shifts at δC 153.3 and 141.0 were due to the presence of primary amine and chlorine substituents at C-2 and C-4, respectively.
The aliphatic substructure of 1 was constructed using the COSY spectrum, showing a spin system evident by the coupling between H-9 (δH 4.89, m) and the diastereotopic protons H2-8 (δH 3.54, J = 17.3, 6.3); 3.45, J = 16.9, 6.3) and a cross-peak HMBC correlation from H2-8 to C-6 (δC 133.6), C-7 (δC 198.1), C-9 (δC 49.3), and C-10 (δC 173.1, carboxylic acid unit), and from H-9 to C-7, C-8 (δC 41.2), C-10, and to the acetyl carbonyl carbon C-11 (δC 172.9). When the NMR data for compound 1 was recorded in deuterated DMSO (Figure S16), 1H-1H coupling was observed from H-9 to the amide proton (δH 8.05, NH), which supported the acetyl group (C-11; δC 21.8, C-12); this was corroborated by a NOESY correlation from the amide proton to methyl H3-12 (δH 1.97) (Figure S17) and HMBC correlation of singlet methyl protons H3-12 to C-11 (Figure 6). Hence, the complete structure of compound 1, designated as ageloline B, confirmed it to be structurally related to the previously characterised antichlamydial quinolone ageloline A isolated from Streptomyces sp. SBT345 [51].
Compound 2 was isolated as a light yellowish powder, and its molecular formula was obtained from the ESI Orbitrap MS with a characteristic chlorinated isotopic cluster at m/z 299.0795/301.0764 (M+H, Δ +0.5 ppm) with 7 degrees of unsaturation (Figure S18). The complete 1D and 2D NMR data (see Table 1 and Table S3 and Figures S19–S22) confirmed 2 to be similar to 1 except for the presence in its spectra of signals corresponding to a methoxy group. A cross-peak HMBC correlation from the methyl proton signal (δH 3.72, H3-13) to carbonyl carbon C-10 supported the attachment (Figure 6). To assess whether compound 2 was an artefact resulting from spontaneous methylation induced by methanol during the extraction process—despite its detection in the LC-MS profile of the crude extract—a 50 mL culture was prepared and extracted using sec-butanol instead of methanol. The resulting extract was analysed via ESI-Orbitrap MS. The LC-MS chromatogram confirmed the presence of both compounds 1 and 2, with base peaks observed at retention times of 9.72 and 10.59 min, respectively (see Figure S23). Notably, methanol was excluded from all subsequent extraction, fractionation, and purification steps.
The absolute configurations of compounds 1 and 2 were logically assigned as L based on extensive prior work demonstrating that 4-chloro-L-kynurenine (L-4-ClKyn)—a core substructure of both compounds—is an integral component of natural peptide antibiotics [56]. This non-proteinogenic, modified amino acid has been identified as part of the building block sequence in lipopeptide antibiotics such as taromycin-type compounds and lipoglycopeptide antibiotics [49,50,56], and is also reported in the present study. Further support for the L-configuration was provided by optical rotation measurements, which yielded a negative value, consistent with the expected behaviour of L-4-ClKyn derivatives and other L-amino acids. Based on this conclusion, structure 2 was determined and named ageloline C.
Ageloline D (3) was isolated as a reddish yellow oil, with a molecular formula of C10H7ClO3N deduced from the molecular ion in the positive mode ESI Orbitrap MS at m/z 172.0163 (M+H, Δ + 1.3 ppm) corresponding to 5 degrees of unsaturation (Figure S24). The 1H NMR spectrum of 3 showed coupling patterns suggestive of the same 1,2,4-trisubstituted aromatic ring found in 1 and 2. The carboxyl functionality was placed at C-7 (δC 170.8) due to the downfield chemical shift and a strong HMBC cross peak from H-6. The 1D and 2D NMR spectra data (see Table 1 and Table S4 and Figures S25–S28), together with the mass spectrometry analysis, established 3 as 2-amino-4-chlorobenzoic acid—a previously unreported natural product and a structural motif shared by 1 and 2.
Compound 4 was obtained as a yellowish powder which displayed a protonated ion, [M+H]+, in the positive mode HRESIMS at m/z 224.0109, from which the molecular formula of 4 was deduced as C10H7ClO3N (Δ: 0 ppm, 8 degrees of unsaturation, calcd. for C10H7ClO3N, 224.0109) (Figure S29). The comparison of 1D, 2D NMR data as well as the MS data of 4 (see Table S5, Figures S30–S33) with previously reported experimental data for ageloline A confirmed its identity [51].
Compound 5 was isolated as a white solid and peaks in its Orbitrap HR-ESI-MS spectrum at m/z 1846.7936 with a characteristic chlorinated pattern and a doubly charged ion at m/z 923.9016, both in agreement with a molecular formula of C84H118ClO28 N17 and 34 degrees of unsaturation (Figure S34). The structure of 5 was determined from full NMR spectroscopy data measured in DMSO-d6 at 318 K, and the MS/MS fragmentation pattern as suggested in the chemical dereplication section (see Tables S6 and S7 and Figures S1, S2 and S35–S37). The absolute configurations of all the proteinogenic amino acids in 5 were established by the Marfey experiment, which was performed following chromatographic analysis by reverse-phase analytical HPLC with a wavelength of 340 nm of the hydrolysate and the standard derivatised amino acids (see Table S8). The structure of 5 was confirmed as gausemycin A after a thorough check with the literature data [49].

2.5. Genomics of B188M101

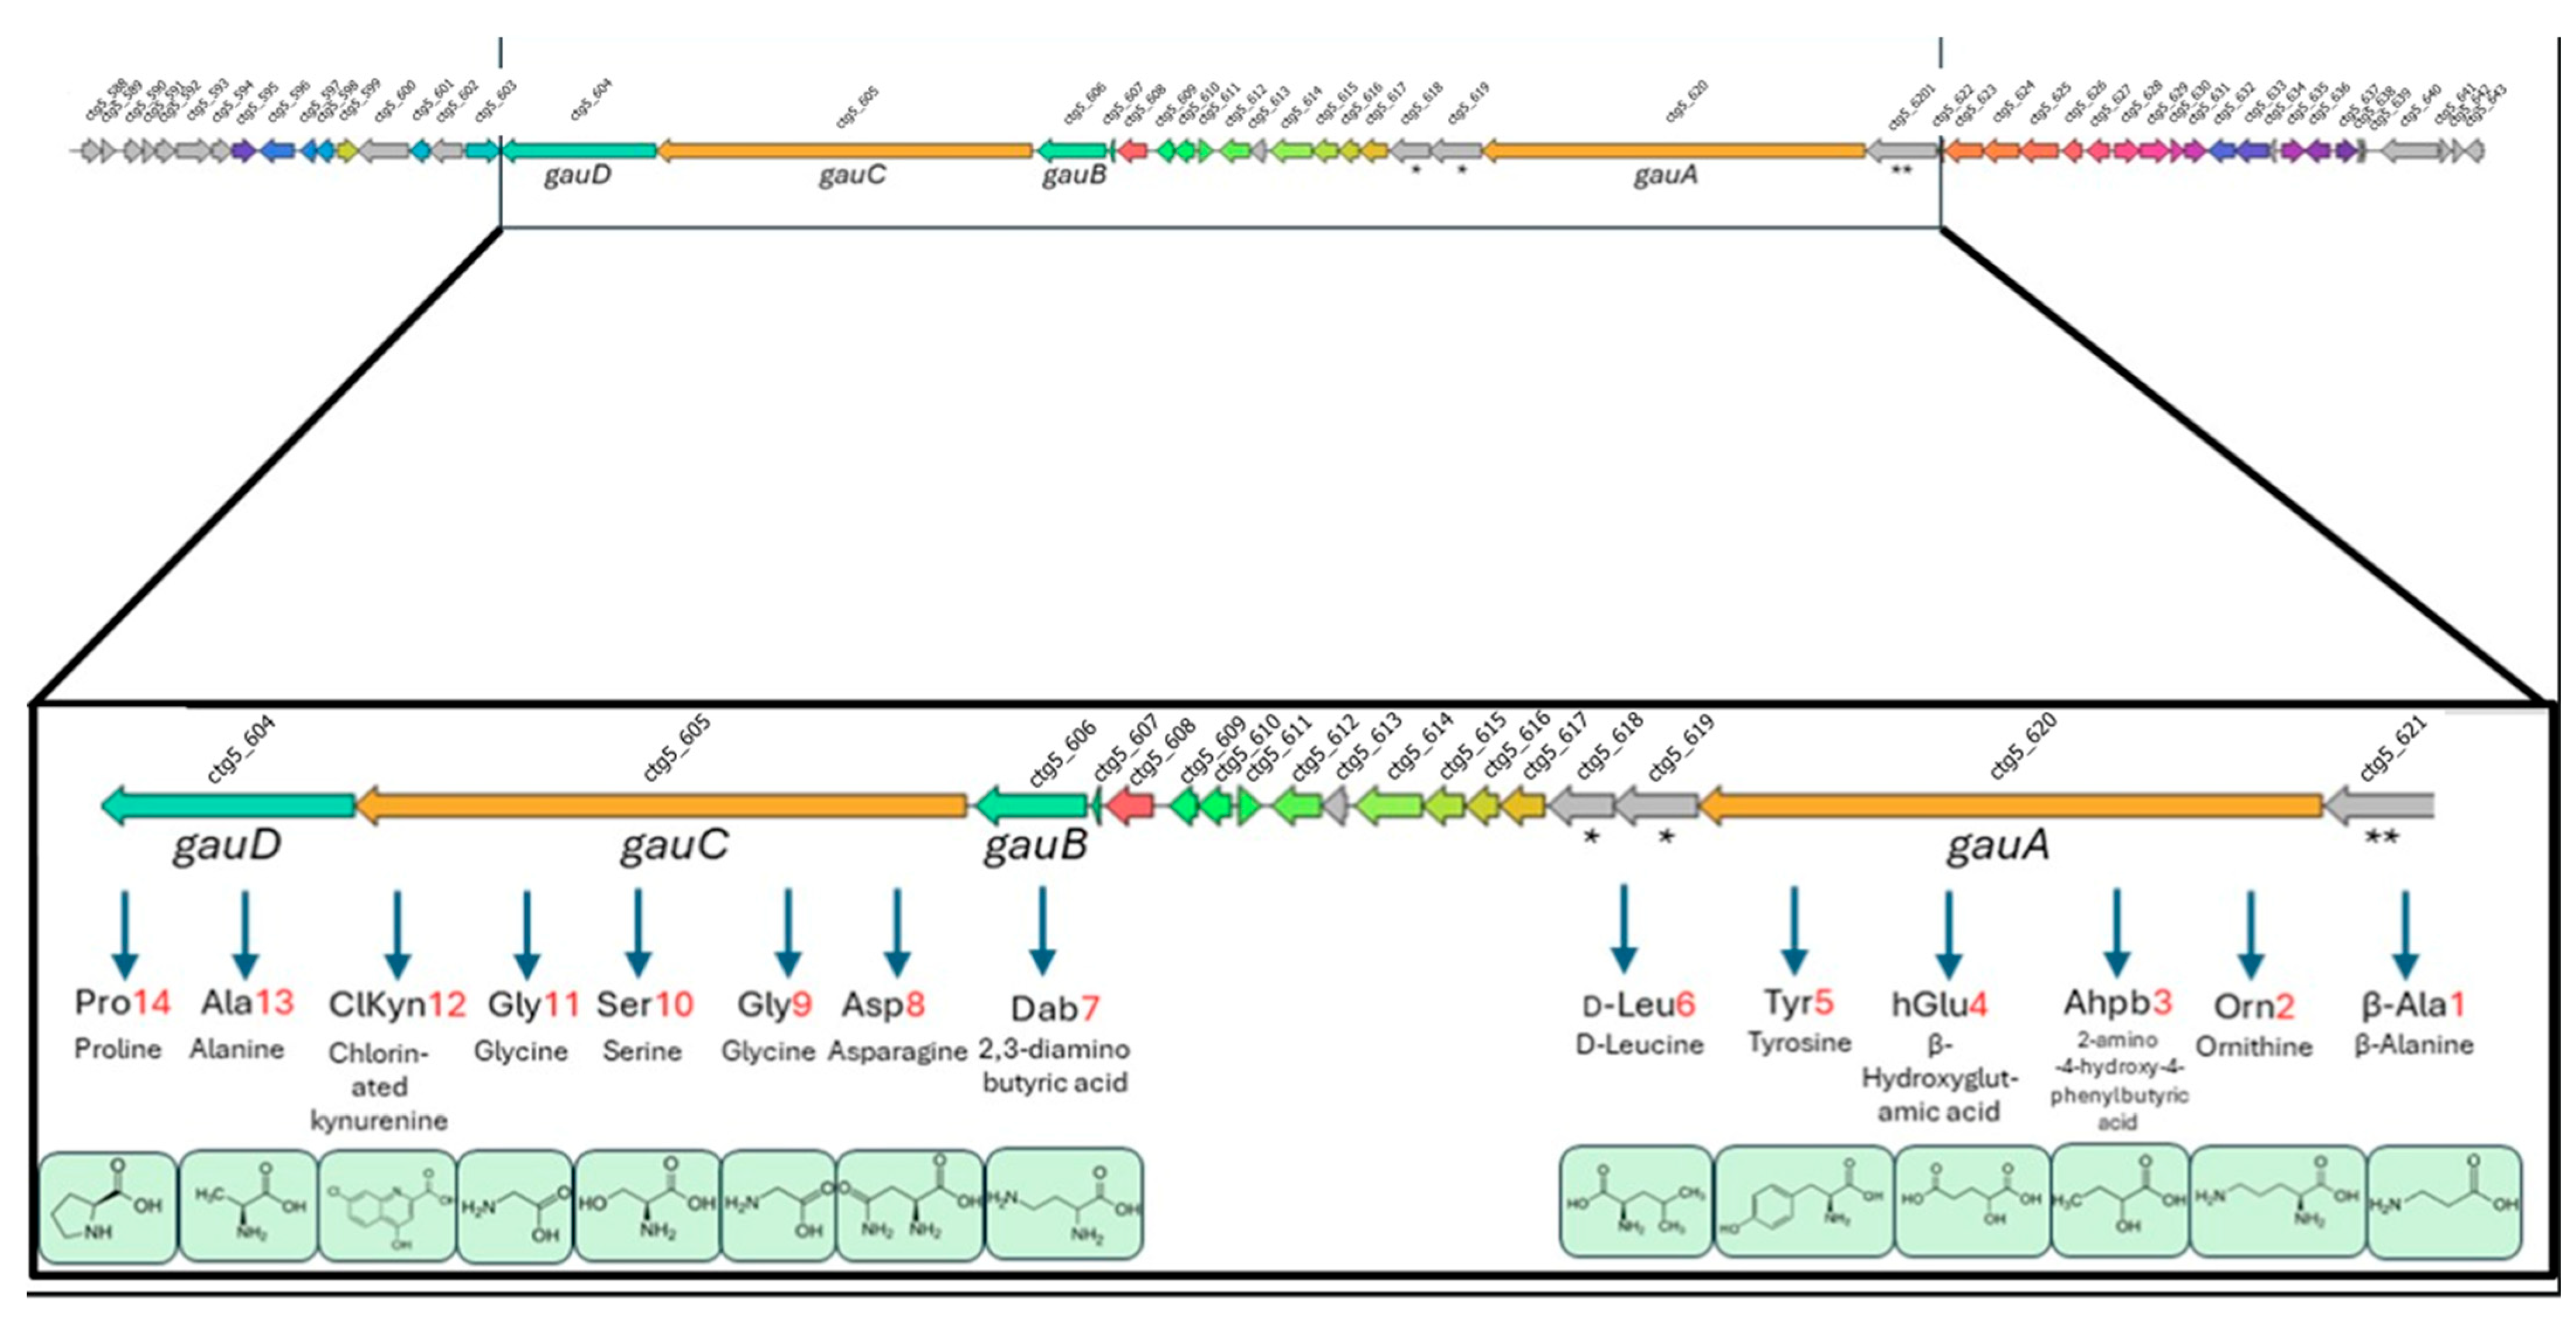
Streptomyces sp. B188M101 was taxonomically classified as a member of the S. fimicarius subgroup (Figure S38). The identification and characterisation of the chlorinated compounds (15) allowed us to explore the B188M101 genome and identify a putative halogenase gene, namely a tryptophan-7-halogenase encoding gene within a 111.8 Kb biosynthetic gene cluster (BGC). The BGC was annotated by antiSMASH version 7.0 as a NRPS/betalactone hybrid cluster comprising 56 ORFs (Table S9). The BGCs most closely related to the NRPS/betalactone cluster from Streptomyes sp. B188M101 are those which produce compound 5 (gausemycin A) and gausemycin B from Streptomyces sp. INA-Ac-5812 [49], the cadasides- [57], and malacidins- [58] producing clusters from soil metagenome cosmid libraries, and the friulimicins-producing cluster from Actinoplanes friuliensis [59] (Figure S39). The products of these clusters are cyclic lipopeptides or lipoglycopeptides with antimicrobial activities against Gram-positive bacteria and have been reported to have Ca2+ dependency. Based on the biosynthetic gene cluster composition, the heterocylic polypeptide produced from the Streptomyces sp. B188M101 is identical to that reported for gausemycin A produced by Streptomyces sp. INA-Ac-5812 (βAla1-Orn2-Ahpb3-hGlu4-Tyr5-Dab6-D-Leu7-Asp8-Gly9-Ser10-Gly11-ClKyn12-Ala13-Pro14) [49] (Figure 7).
Unlike the gausemycins, which comprise 9 amino acid residues in the heterocycle, and exocyclic 5 amino acids—including non-proteogenic components—cadasides comprise 9 amino acids in the heterocycle with 4 exocyclic residues, while friulimicins comprise 10 amino acids in the heterocycle with one exocyclic residue. While the BGC of Streptomyces sp. B188M101 hosts 56 ORFs (Table S9) spanning 111.8 Kb, the gausemycins cluster of Streptomyces sp. INA-Ac-5812 comprises 68 ORFs and is 121.5 Kb in length. A comparison of the two clusters reveals that 35 ORFs are homologous with 34.6–99.1% amino acid identities (Figure S33 and Table S10). While the gauA NRPS of Streptomyces sp. INA-Ac-5812 (Accession no. QWT72279.1) is annotated as comprising 8448 amino acids, incorporating 6 moieties into the polypeptide, that of Streptomyces sp. B188M101 (ORF 33: Figure 7; Supplementary Table S9) is annotated as a 5910 amino acid NRPS incorporating 4 amino acids into the peptide. However, ORFs 31, 32, and 34 are annotated as separate NRPS genes, and along with ORF 33, they are predicted to produce an identical polypeptide to that of Streptomyces sp. INA-Ac-5812. The homologues of gauB, gauC, and gauD in the genome of Streptomyces sp. B188M101 share amino acid sequence identities of 93.9%, 89.8%, and 92.4%, respectively (Supplementary Table S10).
Notwithstanding that the orientation of Streptomyces sp. B188M101 BGC and Streptomyces sp. INA-Ac-5812 is different, ORF 9 to ORF 50 in the former is largely homologous to ORF 11 to ORF 44 in the latter. The main differences are the insertions of genes encoding a pyridoxal-phosphate dependent enzyme; cysteine synthase (ORF 13), an argininosuccinate lyase/adenylosuccinate lyase (ORF 15), and a methyltransferase (ORF 26) in the BGC of Streptomyces sp. B188M101, which are absent from the gene cluster of Streptomyces sp. INA-Ac-5812, while the latter cluster hosts a flavin reductase family protein encoding gene (ORF 33) and a cation/H(+) antiporter encoding gene (ORF 45) not present in the cluster of Streptomyces sp. B188M101. A biosynthesis schema has been proposed by Tyurin and colleagues [49], with a similar pathway likely to be present in Streptomyces sp. B188M101. In some cases, single BGCs are known to produce more than one metabolite [60] and differences between the gausemycin BGC from Streptomyces sp. INA-Ac-5812 and the NRPS/betalactone cluster from Streptomyces sp. B188M101 may result in the production of different minor metabolites. As highlighted in Figure 3, while a number of new gausemycin analogues have been identified in the metabolome of Streptomyces sp. B188M101 as visualised through the molecular network annotation, attempts to isolate these new analogues have to date been unsuccessful. Interestingly, ORF 51 in the BGC of Streptomyces sp. B188M101 encodes an IS3 family transposase, suggesting the potential for horizontal gene transfer of part or all of this cluster.

2.6. The Proposed Biosynthesis of Ageloline A-D (14)

The agelolines A–D are natural derivatives of 7-chlorokynurenic acid, partially biosynthesized from the gausemycin biosynthetic gene cluster (BGC), as evidenced by their shared chlorinated moiety. Ageloline A is proposed to originate from the kynurenine pathway, beginning with halogenation of L-tryptophan by ORF9, followed by conversion to 7-chlorokynurenine via ORF10, annotated as tryptophan 2,3-dioxygenase (antiSMASH) and kynA (PROKKA version 1.14.5). A final transamination step, likely catalysed by a kynurenine aminotransferase (KAT), completes the biosynthesis (See Table S10 and Figure 8). ORF6, annotated as a histidinol-phosphate aminotransferase (hisC), may fulfil this role despite histidinols not being typical KAT substrates [61].
Agelolines B and C follow similar initial steps, diverging through distinct tailoring reactions. Ageloline B requires acetylation of 7-chlorokynurenine, yet no acetyltransferase is encoded within or near the BGC, which suggests the likely involvement of a distal genomic element; the closest candidate lies 84.6 Kb upstream, annotated as an L-methionine sulfoximine/sulfone acetyltransferase. Ageloline C is methylated via a methyltransferase encoded by ORF2, which is absent in the gausemycin-producing Streptomyces sp. INA-Ac-5812, suggesting strain-specific biosynthetic capabilities. Ageloline D, a chlorinated anthranilic acid, is likely formed via kynureninase (kynU) activity on chlorinated L-kynurenine. ORF11, annotated as an α-/β-hydrolase (antiSMASH) and kynU (PROKKA), is presumed to catalyse this conversion (Table S10 and Figure 8).
Together, these findings suggest that agelolines are derived from a common halogenated intermediate, with diversification driven by distal or strain-specific tailoring enzymes. Annotation discrepancies between antiSMASH and PROKKA highlight the need for functional validation, while the absence of key enzymes within the BGC points to broader genomic involvement in ageloline biosynthesis.

2.7. Biological Evaluation of Compounds 15

Compounds 15 were initially evaluated for their antibacterial activity against the aquaculture fish pathogen A. salmonicida using the enzymatic cell-based assay previously described. Only compound 5 exhibited considerable activity at an MIC value of 32 µg/mL (see Figure S40A). However, the screening platform was expanded to accommodate human pathogens, including S. aureus ATCC6538P, S. aureus GISA L3797, S. pneumoniae L44, S. maltophilia L2125, P. aeruginosa PA01, and E. coli ΔtolC L4242. Compound 3 showed significant to moderate inhibition against Staphylococcus aureus ATCC6538P, S. maltophilia L2125, and S. pneumoniae L44 with MIC values of 6, 32, and 64 µg/mL, respectively, while moderate inhibition against S. maltophilia L2125 was observed for 2 and 4 (Table 2; Figures S40 and S41).
A recent discovery reported that the bioactivity of compound 5 against methicillin-resistant S. aureus increases with the addition of calcium to the cell culture—an observation that led to a successful patent application [62]. Our experiment confirmed this finding and extended it beyond Gram-positive S. aureus to Gram-negative A. salmonicida, showing an 8- and 2-fold increase in activity with MIC values of 4 µg/mL and 16 µg/mL, respectively, when the assay cell culture broths were supplemented with 0.45 mM of calcium chloride. In contrast, increasing the calcium concentration to 20 mM yielded no further enhancement of the activity of 5 against any of the tested pathogens (Table 3 and Figure S42).
It is quite unusual for cyclic glycolipopeptides to display activity against Gram-negative bacteria, as most antibiotics of these structural scaffolds are prevented from crossing the extra outer membrane (OM) barrier consisting of lipopolysaccharides (LPS) [63,64].
The outer layer is negatively charged and creates a permeability barrier that repels most antibiotics partly due to their large size [63,64,65]. It was found that gausemycins are species-specific, as a wide range of antimicrobial inhibitions were observed when tested against a panel of Gram-positive bacteria [50], indicating multiple molecular targets, including membrane disruption in a Ca2+-dependent manner and channel-forming activity at a higher concentration of calcium ions [49,50].
This study presents the first report of compound 5 exhibiting species-specific inhibition of Aeromonas salmonicida while other Gram-negative strains—including S. maltophilia L2125, P. aeruginosa PA01, and E. coli ΔtolC L4242—remained unaffected, regardless of calcium salt supplementation. This selective activity may be attributed to the distinctive structural and antigenic properties of the surface layers (S-layer) of the A. salmonicida outer membrane, which differ substantially from those of other Gram-negative bacteria [66,67].

3. Materials and Methods

3.1. General Experimental Procedures

UV spectra were recorded on a Thermo Scientific UPLC system coupled to a photodiode array detector (Thermo Scientific, Waltham, MA, USA). Optical rotations were measured on an ADP 410 digital polarimeter (Bellingham + Stanley Ltd., Nottingham, UK). NMR spectra were recorded on Bruker AVANCE III spectrometers at 600 MHz (Bruker Corporation, Billerica, MA, USA). The Thermo Instruments UPLC system was connected to the Orbitrap IQ-X MS (Thermo Scientific, San Jose, CA, USA), equipped with heated electrospray ionisation (H-ESI). The Orbitrap was used to analyse the biological replicate samples under the following operating conditions: capillary temperature 275 °C, auxiliary gas flow rate 10 arbitrary units, sheath gas flow rate 50 arbitrary units, static gas mode, sweet gas (Arb) 1.0, ion transfer tube temperature 275 °C, vaporiser temperature 350 °C, capillary positive ion spray voltage 3.5k, and a lock mass correction set at RunStart EASY-IC. The full MS was set with a scan mass range of 150–2000 m/z, Orbitrap resolution at 120,000, RF Lens at 35%, absolute AGC target at 4.000 × 10⁵, maximum injection time mode at Auto, and data type set to centroid with the data-dependent acquisition mode set at Cycle Time (Top Speed). The assisted HCD (high-energy collisional dissociation) energy was set at 30%, with an activation time of 10 milliseconds, and the Orbitrap resolution was set at 60,000 for the MS/MS fragmentation step.
The LC system consists of a diode array detector (DAD) with a variable wavelength detection range of 200–800 nm, and an analytical Kinetex 2.6 µm EVO C18 column (100 Å, 100 × 2.1 mm). A mobile phase gradient of 0.1% formic acid in LC-MS grade H2O: acetonitrile from 5 to 95% in 13 min, and isocratic elution at 95% for 5 min at a flow rate of 300 µL/min with MS acquisition for 17 min, was employed in the UPLC and MS system.

3.2. Microbial Isolation and Identification

Streptomyces sp. B188M101 was isolated from the deep-sea sponge Lissodendoryx diversichela as previously described [26]. The genome of Streptomyces sp. B188M101 was sequenced using PacBio Sequel II following library preparation using SMRTbell Express Template Prep Kit 2.0, by Novogene Co. Ltd., Cambridge, UK. The genome was assembled using SPAdes version 3.11.1 [68]. The assembled genome was annotated using Prokka v1.14.5 [69]. Taxonomic assignment and phylogenetic analysis were performed using the Genome Taxonomy Database (GTDB-Tk) v2.3.2 [70], which was implemented on the KBase web platform [70,71]. Biosynthetic gene clusters were identified using antiSMASH v 7.0 [72], cblaster [73], and clinker [74].

3.3. Small Fermentation of Streptomyces sp. B188M101 Using an OSMAC Approach

A seed culture of Streptomyces sp. B188M101 was prepared by inoculating an autoclaved 50 mL ISP2 medium (malt extract 10 g, yeast extract 4 g, and glucose 4 g in 1 L of milli-Q H2O, pH adjusted to 7.2) in a 250 mL Erlenmeyer baffled flask with a pure colony of the bacterial strain from an agar plate. Incubation of the seed culture lasted for 72 h at 28 °C and 180 rpm in a closed-system rotary shaker (SciQuip, Rotherham, UK). Following an OSMAC approach, three biological replicates of 200 mL media culture consisting of SGG-(a-c) [glycerol 10 g, soluble starch 10 g, corn steep powder 2.5 g, yeast extract 2 g, peptone 5 g, CaCO3 3 g, NaCl 1 g, in 1 L H2O, pH adjusted to 7.3], M400-(a-c) [1% glucose, 0.03% meat extract, 0.3% peptone, 2% soluble starch, 0.5% yeast extract, 0.3% CaCO3), and R358-(a-c)[0.2% peptone, 0.4% yeast, 1% soluble starch, 4% sea salt, 5 mL/L of an 8 g/L FeSO4∙7H2O stock solution, 5 mL/L of an 8 g/L KBr stock solution, 4% sigma sea salts] in 1L Erlenmeyer baffled flasks were further inoculated with 2 mL of the seed culture and incubated for 10 days under the same shaking conditions as the seed culture. Alongside the bacterial cultures, the blank controls consisting of 200 mL of the three uncultured media were prepared to remove interfering metabolites from the culture media. After fermentation, an autoclaved Dianion HP-20 absorbent resin (12 g/200 mL) was added to each of the culture broths and allowed to shake for another 7 h. The HP-20 adsorbent resins were filtered under a vacuum, and each culture broth resin and the respective process blank medium was placed in a separate, cleaned 1 L Erlenmeyer flask containing 200 mL of 100% methanol to macerate for 24 h. Complete extraction of the biomass was achieved after subsequent cycles of extraction with MeOH (100 mL) and ethyl acetate (100 mL). The combined extract was concentrated under reduced pressure with a vacuum rotatory evaporator (IKA VACSTAR digital, Staufen im Breisgau, Germany) and later dried completely in a nitrogen drier yielding 225.70 mg (SGG-a), 255.20 mg (SGG-b), 247.20 mg (SGG-c), 250.00 mg (M400-a), 176.00 mg (M400-b), 207.80 mg (M400-c), 264.80 mg (R358-a), 297.50 mg (R358-b), 310.50 mg (R358-c), 89.05 mg (SGG-blank), 85.05 mg (M400-blank), and 71.12 mg (R358-blank).

3.4. Disc Diffusion Assay of Crude Extracts

The antibacterial activity of extracts M400, R358, and SGG was tested using a disc diffusion assay following a previously described method [40,55]. Therefore, 8 mg/mL concentration solutions of the extracts and extracts’ media controls were prepared, loaded on sterile filter paper (6 mm disc), and allowed to dry. The inoculum pathogen broth (2 mL) prepared according to the 0.5 McFarland standard was spread on Mueller Hinton agar plates. Sterile dried filter paper discs loaded with methanol were used as the negative control and a 10 µg concentration of gentamicin discs (ThermoFisher Scientific Ltd, Cheshire, UK) as the positive control. The extract filter paper, media blanks, solvent control, and antibiotic discs were impregnated into the agar plates and incubated at 28 °C for 24 h and the diameter of inhibition zones was measured. Antibacterial activity was evaluated by measuring the zone of inhibition around the disc using a transparent millimetre scale. The bioassay experiment was repeated twice.

3.5. Large-Scale Fermentation of Streptomyces sp. B188M101

The large-scale fermentation (8 L) was prepared by the following process: 5 mL of a 200 mL seed culture of Streptomyces sp. B188M101 was transferred with a disposable sterile serological pipet into 40 × 1 L baffled Erlenmeyer flasks containing autoclaved 200 mL R358 media solution. After inoculation, they were incubated for 10 days at 28 °C and shaken at 180 rpm in a closed system shaker. When fermentation was completed, 12 g of autoclaved Diaion HP-20 resin was added to each flask and allowed to shake for 24 h before removing the resin and subsequently extracted with methanol (800 mL × 3) followed by ethyl acetate (300 mL × 2). The combined organic extract was dried and yielded 16.45 g of crude extract.

3.6. Fractionation and Isolation of Metabolites from Streptomyces sp. B188M101

The R358 crude extract (16.45 g) was subjected to fractionation by Kupchan partitioning [55]. The extract was partitioned between aqueous (H2O, 700 mL) and organic phases (dichloromethane, 700 mL) in a 2 L round bottom flask. The aqueous phase (16.15 g) was further extracted with sec-butanol (300 mL × 3) yielding FB (3.85 g) and FW (8.80 g). The dichloromethane fraction (210 mg) was discarded upon chemical analysis. The FB fraction was chromatographed using a reveries BUCHI preparative flash system (Flawil, Switzerland) equipped with a reversed-phase EcoFlex C18 cartridge (80 g, 50 µm), stationary phase cartridge, and variable UV and ELSD detectors to monitor the run at 210, 230, and 254 nm. Chromatographic elution started with a mobile isocratic scheme of 100% H2O and run for 7 min followed by linear gradient elution to 100% MeOH for 80 min and finally maintained at 100% MeOH for 20 min at the flow rate of 7 mL /min with a combined running time of 94 min to afford FB1 (225.08 mg, tR 2–13 min), FB2 (111.28 mg, tR 15–19 min), FB3(97.55 mg, tR 20–26 min), FB4 (76.17 mg, tR 29–39 min), FB5 (32.38 mg, tR 45–48 min), FB6 (20.29 mg, tR 49–53 min), FB7 (31.62 mg, tR 56–62 min), FB8 (35.66 mg, tR 63–66 min), FB9(20.13 mg, tR 67–70 min), FB10 (17.59 mg, tR 71–75 min), FB11 (27.52 mg, tR 76–80 min), and FB12 (61.52 mg, tR 83–89 min). Following the chemical dereplication of the FB fractions, the FB6-FB9 fractions (107.7 mg) were combined and purified using a reversed-phase HPLC, ACE (5 µm 10 × 250 mm) with a gradient elution of 95: 5% H2O: MeCN for 15 min to 38% MeCN, followed by a gradient elution for 30 min to 50% H2O: MeCN and continued for another 20 min to 80% MeCN at the flow rate of 2 mL/min for a combined run of 50 min yielding co-eluting gausemycin derivatives (6.12 mg, tR 20–23 min) and compounds 1 (3.5 mg, tR 26.2 min), 2 (0.8 mg, tR 34.8 min), 3 (5 mg, tR 30.4 min), and 4 (5 mg, tR 27.1 min). The gausemycin mixture was further purified by re-injection with a starting gradient elution of 90:5% H2O: MeCN to 20% MeCN at 40 min, 38% MeCN at 70 min up to 50% MeCN for 80 min at the flow rate of 2 mL/min, yielding gausemycin A (5) (2.7 mg, tR 55 min).
Ageloline B (1): yellow powder; [α]D25 −17.7 (c 0.225, MeOH); UV (MeOH) λmax, nm (log ε): 194 (2.94); 234(2.91), 266(2.64), 358(3.41); HRESIMS (m/z): [M+H]+ calcd. for C12H14ClN2O4, 285.0638; found 285.0607(Δ: +0.5 ppm); NMR data, see Table 1 and Table S2 and Figures S11–S17 and S43.
Ageloline C (2): light yellowish powder; HRESIMS (m/z): [α]D25 −40 (c = 0.01 g/mL, MeOH); UV (MeCN-H2O)) λmax, nm (log ε): 194 (3.46); 234 (3.63), 254(3.24), 362(3.03); [M+H]+ calcd. for C13H16ClO4N2, 299.0795; found, 299.0793 (Δ: +0.5 ppm); NMR data, see Table 1 and Table S3 and Figures S18–S22 and S44.
Ageloline D (3): yellow powder; HRESIMS (m/z); UV (MeCN-H2O λmax, nm (log ε): 194 (2.86); 222 (2.33), 254(2.89), 346(2.66); [M+H]+ calcd. for C7H7ClO4N2, 172.0163; found, 172.0160 (Δ: +1.3 ppm); NMR data, see Table 1 and Table S4 and Figures S24–S28 and S45.

3.7. Antimicrobial Activity

The antibacterial activity of compounds 15 was determined against strains from the NAICONS collection of bacterial pathogens, including ATCC strains, as follows: 90 μL of 1–6 × 10⁵ CFU/mL bacterial suspension was dispensed into each well of a 96-well plate containing 10 μL of serial 1:2 dilutions of compound 15 (from a 10 mg/mL stock solution in 100% DMSO). All the strains were grown in Müller Hinton broth except for Streptococcus spp. and Candida albicans strains, which were grown in Todd Hewitt broth and Yeast Peptone Dextrose medium, respectively. Sterile solutions of CaCl2 in water were added to the media at the time of the experiments to obtain the final concentrations of 450 µM or 20 mM. Plates were incubated at 37 °C in a Synergy2 microplate reader (BioTek Instruments, Winooski, VT, USA) with readings at 595 nm registered every hour.

3.8. MZmine 4.20 Data Pre-Processing, MetaboAnalyst 5.0, and Feature-Based Molecular Networking

The biological replicate MS data was converted into mzML format using MSConvert from the ProteoWizard [42] and imported to MZmine (version 4.2.0), a scalable MS data analysis platform that supports hybrid datasets from various instrumental setups [43]. The mzML data was pre-processed with mass ion detection achieved through the removal of MS1 and MS2 baseline noise levels set to 1.0 × 10⁴ and 1.0 × 10², respectively. The chromatogram construction was performed for each of the centroided MS1 detected using the ADAP chromatogram builder, where minimum consecutive scans, minimum intensity for consecutive scans, minimum absolute height, and m/z mass tolerance were set to 4, 1.0 × 10², 1.0 × 10⁴, and 5 ppm, respectively. The peak detection utilised local minimum resolver as a deconvolution algorithm to construct the chromatogram of each mass ion while keeping the original feature list created in the previous step. For this algorithm, the chromatographic threshold was set to 85%, the minimum search range in the RT absolute range to 0.05 min, the minimum relative height to 0.0%, the minimum absolute height to 2.0 × 10⁶, and the minimum ratio of peak top/edge to 1.70. The identified peaks were deisotoped using the isotopic peaks grouper, in which the m/z tolerance (intra-sample) was set to 5 ppm, the RT tolerance to 0.02 for absolute minutes, maximum charge of 3 absolute minutes, and the representative isotope as the most intense. The deisotoped peaks were then aligned using a join aligner to correct any deviation of the retention time of each mass peak: the ion m/z tolerance for the alignment was set to 10 ppm, retention time tolerance to 0.06 at absolute minute, weight for m/z and RT set to 75 and 25, respectively, and the mobility weight was set to 1. The peak list produced after the alignment step was filtered using a feature list row filter algorithm to remove any mass ions outside the set range of 100 to 2000 m/z and keep peak rows that match all criteria.
The resulting feature list, including the retention time, mass to charge ratio, and peak area rows, was exported by converting into a MetaboAnalyst format CSV file, a text format that presents a set of data in Excel style. For this study, CSV files were generated in triplicate for each biological replicate sample and converted to a zip folder before uploading to the MetaboAnalyst 5.0 platform with the option of One Factor-Statistical Analysis [75]. The processed MS peak list data was pre-processed by setting the mass tolerance and retention time tolerance to 0.025 and 30 s, respectively. All features with missing values generated due to poor repeatability and below the limit of detection in the triplicates were replaced with 1/5 of the minimum positive values below their corresponding values by setting the threshold to 20%. The features were further filtered using the interquartile range (IQR), with the relative standard deviations (RSDs) set at 25%. Normalization by sum was performed for the feature peak list, followed by log transformation (base 10) and pareto scaling to transform the data to more a Gaussian-type normal distribution that allows for easy comparability in a graphical style. The above-mentioned parameters were used to generate the Principal Component Analysis (PCA), Dendrogram, and Heatmaps used in this study.
The respective MS feature lists of MS1 and MS2 were exported as quant.csv and MGF files—the formats used to create Feature-Based Molecular Networking (FBMN) analysis on the Global Natural Social Networking (GNPS) [41,76]. For generating the networking, both the precursor ion and MS/MS fragment ion tolerance were set to 0.05 Da. A molecular network was then created with edges filtered to have a cosine score above 0.50 and at least six matched peaks. The top 20 most similar nodes were kept. The spectra in the network were then searched against GNPS spectral libraries [76]. The DEREPLICATOR was used to annotate MS/MS spectra [77] and the molecular networks generated were visualized using Cytoscape software version 3.10.0 [37].

4. Conclusions

In this study, we isolated and structurally elucidated three new chlorinated natural products, agelolines B–D (13), alongside two previously reported metabolites, ageloline A (4) and gausemycin A (5), using metabolomic analysis combined with bioassay-guided purification. The antimicrobial activity of compounds 15 was assessed against the fish pathogen A. salmonicida, with gausemycin A (5) exhibiting pronounced activity at the minimum inhibitory concentration (MIC). Subsequent screening against a panel of human pathogens revealed that compound 3 displayed notable inhibitory effects against S. aureus ATCC6538P and S. maltophilia L2125. Interestingly, the addition of calcium salts enhanced the activity of compound 5 against A. salmonicida, resulting in a two-fold increase in potency.
Elucidating the mechanistic basis underlying the selective inhibition of A. salmonicida by compound 5 remains a central focus of our future investigations. To date, lipoglycopeptide antibiotics have not been reported to exhibit such activity against Gram-negative bacteria, highlighting the novelty of our findings. To support further biological and structural studies, efforts are currently underway to upscale the isolation and characterization of the newly identified gausemycin congeners dereplicated in this study.

Supplementary Materials

The following supporting information can be downloaded at https://www.mdpi.com/article/10.3390/md23090362/s1. Figure S1: MS/MS fragmentation of gausemycin A at the cyclic core (922.3815 m/z) and tail substructure fragmentation at the C-terminal end. [A]—represented the structure of gausemycin A, indicating the fragmentation pathway and explanation. Figure S2: The tail fragmentation of gausemycin A at the N-terminal and the neutral loss of the arabinose moiety. Figure S3: The tail fragmentation of gausemycin B at the C-terminal showing the additional amino acid (β-Alanine) attachment at Orn-2. Figure S4: The tail fragmentation of gausemycin C from Ahpb-3 to the fatty acid chain showing the loss of methyl-β-Alanine from the attachment on Orn-2. Figure S5: (+)-HRESIMS spectrum of putative new molecules at m/z 864.8879 (M+2H)+2. Figure S6: The tail fragmentation of putatively new molecules at m/z 864.8879 (M+2H)+2 group attachment to ornithine of the gausemycin D analogue. Figure S7: (+)-HRESIMS spectrum of putative new molecules at m/z 930.9088 (M+2H)+2. Figure S8: The tail fragmentation of putatively new molecules at m/z 930.9088 (M+2H)+2 indicating attachment to ornithine of the gausemycin A analogue. Figure S9: (+)-HRESIMS spectrum of putative new molecules at m/z 1945.8621 corresponding to 973.4351 (M+2H)+2. Figure S10: The tail fragmentation of putatively new molecules at m/z at m/z 1945.8621 corresponding to 973.4351 (M+2H)+2 showing dimethyl-β-alanine attachment to ornithine of the gausemycin A analogue. Figures S11 and S12: (+)-HRESIMS and 1H NMR spectra of 1. Figures S13–S14: HSQC and COSY NMR spectra of 1. Figures S15 and S16: HMBC and COSY (DMSO-d6) NMR spectra of 1. Figures S17 and S18: NOESY spectrum of 1 and (+) HRESIMS of 2. Figures S19 and S20: 1H NMR and HSQC spectra of 2. Figures S21 and S22: COSY and HMBC spectra of 2. Figures S23–S24: Extracted ion chromatogram of 1 and 2, and (+)-HRESIMS spectra of 3. Figures S25 and S26: 1H NMR of 3 and HSQC spectrum of 3. Figures S27 and S28: COSY and HMBC spectra of 3. Figures S29 and S30. (+)-HRESIMS and 1H NMR spectra of 4. Figures S31 and S32: HSQC and COSY NMR spectra of 4. Figures S33 and S34: HMBC spectrum of 4 and (+)-HRESIMS spectrum of 5. Figures S35 and S36: 1H NMR and HSQC spectra of 5. Figure S37: COSY spectrum of 5. Figure S38: Phylogenetic characterisation of Streptomyces sp. B188M101 by the Genome Taxonomy Database (GTDB-Tk). Figure S39: (A) Comparison of gausemycin-producing BGC from Streptomyces sp. B188M101 with most closely related known clusters from the MIBiG database. (B) Alignment of the gausemycin-producing BGC from Streptomyces sp. B188M101 (top) and the gausemycin cluster from Streptomyces sp. INA-Ac-5812 (bottom), and functional annotation of the B188M101 cluster. Note: the cluster from Streptomyces sp. INA-Ac-5812 has been reversed in orientation for improved visualisation of homology. Figure S40: Growth curve inhibition of 3 against S. S.aureus ATCC6538P (A) and S. maltophilia L21259 (B); Figure S41: Growth curve inhibition of 2 and 4 against S. maltophilia L21259 (A) and S. aureus ATCC6538P (B), respectively. Figure S42: (A) Growth curve inhibition of 5 against A. salmonicida without CaCl2 and (B) represents with CaCl2 supplement. Figures S43 and S44: UV absorption of 1 and 2. Figure S45: UV absorption of 3. Table S1: Putative chemical dereplication of detected metabolites in the Streptomyces B188M101_R358 extract. Table S2: 1H and 13C NMR data of 1 (CD3OD, 600/150 MHz). Table S3: 1H and 13C NMR data of 2 (CD3OD, 600/150 MHz) Table S4: 1H and 13C NMR data of 3 (CD3OD, 600/150 MHz). Table S5: 1H and 13C NMR data of 4 (CD3OD, 600/150 MHz). Table S6: 1H and 13C NMR data of 5 (DMSO-d6, 600/150 MHz). Table S7: MS2 fragmentation sequences of compound 5 using Orbitrap HR-ESI-MS. Table S8: Marfey’s derivatisation analysis of compound 5 hydrolysates. Table S9: Annotation of open reading frames (ORFs) in the NRPS/betalactone biosynthetic gene cluster from the genome of Streptomyces sp. B188M101. Table S10: Homologous ORFs in the gausemycin BGC of Streptomyces sp. INA-Ac-5812 and that of Streptomyces sp. B188M101. Reference [78] is cited in the supplementary materials.

Author Contributions

E.T.O.: conceptualization; investigation; formal analysis; data curation; methodology; visualisation; writing—original draft. S.A.J.: conceptualization; investigation; formal analysis; data curation; methodology; visualisation; writing—original draft. C.B.: investigation; formal analysis; data curation; writing—review and editing. S.G.: investigation; formal analysis; methodology; visualisation; writing—review and editing. H.V.: investigation; formal analysis; methodology; visualisation; writing—review and editing. M.I.: formal analysis; writing—review and editing. G.C.: investigation; methodology; writing—review and editing. L.M.M.: investigation; methodology; writing—review and editing. G.-S.N.: formal analysis; writing—review and editing. D.J.C.: conceptualization: funding acquisition; project administration; supervision; writing—review and editing. R.E.: conceptualization: investigation; supervision; writing—review and editing. M.J.: conceptualization: funding acquisition; project administration; supervision; writing—review and editing. A.D.W.D.: conceptualization: funding acquisition; project administration; supervision; writing—review and editing. All authors have read and agreed to the published version of the manuscript.

Funding

This project has received funding from the European Union’s Horizon 2020 research and innovation programme under Grant Agreement no. 101000392 (MARBLES). Mass spectrometry equipment used in this research work was provided by the BBSRC UK ALERT-22 Scheme (GRANT_NUMBER: BB/X019802/1).

Institutional Review Board Statement

Not applicable.

Data Availability Statement

Data available on request from the corresponding author.

Acknowledgments

We would like to thank Russell Gray of the Marine Biodiscovery Centre, Aberdeen for assisting in NMR spectroscopy; Diana Morgun for providing support and assistance in the disc diffusion assay screening; and Haniel Oluwabusola for drawing the graphics using Medi Bang Paint (MediBang Inc., Tokyo, Japan). Available online: https://medibangpaint.com/en/ (accessed on 13 August 2025).

Conflicts of Interest

Authors Cristina Brunati and Marianna Iorio were employed by the company NAICONS. The remaining authors declare that the research was conducted in the absence of any commercial or financial relationships that could be construed as a potential conflict of interest.

References

  1. FishStatJ-Software for Fishery and Aquaculture Statistical Time Series. Available online: https://sextant.ifremer.fr/geonetwork/srv/api/records/92c9fae9-fb8e-4ce3-80b0-bf7af46353d1 (accessed on 18 July 2025).
  2. Garlock, T.; Asche, F.; Anderson, J.; Ceballos-Concha, A.; Love, D.C.; Osmundsen, T.C.; Pincinato, R.B.M. Aquaculture: The Missing Contributor in the Food Security Agenda. Glob. Food Sec. 2022, 32, 100620. [Google Scholar] [CrossRef]
  3. Sasikumar, R.; Saranya, S.; Lourdu Lincy, L.; Thamanna, L.; Chellapandi, P. Genomic Insights into Fish Pathogenic Bacteria: A Systems Biology Perspective for Sustainable Aquaculture. Fish. Shellfish. Immunol. 2024, 154, 109978. [Google Scholar] [CrossRef]
  4. Reducing Disease Risk in Aquaculture. Available online: https://documents.worldbank.org/en/publication/documents-reports/documentdetail/110681468054563438/reducing-disease-risk-in-aquaculture (accessed on 18 July 2025).
  5. Fečkaninová, A.; Koščová, J.; Mudroňová, D.; Popelka, P.; Toropilová, J. The Use of Probiotic Bacteria against Aeromonas Infections in Salmonid Aquaculture. Aquaculture 2017, 469, 1–8. [Google Scholar] [CrossRef]
  6. Hossain, A.; Habibullah-Al-Mamun, M.; Nagano, I.; Masunaga, S.; Kitazawa, D.; Matsuda, H. Antibiotics, Antibiotic-Resistant Bacteria, and Resistance Genes in Aquaculture: Risks, Current Concern, and Future Thinking. Environ. Sci. Pollut. Res. 2022, 29, 11054–11075. [Google Scholar] [CrossRef]
  7. Vincent, A.T.; Hosseini, N.; Charette, S.J. The Aeromonas salmonicida Plasmidome: A Model of Modular Evolution and Genetic Diversity. Ann. N. Y. Acad. Sci. 2021, 1488, 16–32. [Google Scholar] [CrossRef]
  8. Fournier, K.C.; Paquet, V.E.; Attéré, S.A.; Farley, J.; Marquis, H.; Gantelet, H.; Ravaille, C.; Vincent, A.T.; Charette, S.J. Expansion of the PRAS3 Plasmid Family in Aeromonas salmonicida Subsp. Salmonicida and Growing Evidence of Interspecies Connections for These Plasmids. Antibiotics 2022, 11, 1047. [Google Scholar] [CrossRef]
  9. Liu, L.; Li, J.; Tu, M.; Gao, L.; Zhang, Y.; Rao, Y.; Rao, L.; Gui, M. Complete Genome Sequence Provides Information on Quorum Sensing Related Spoilage and Virulence of Aeromonas salmonicida GMT3 Isolated from Spoiled Sturgeon. Food Res. Int. 2024, 196, 115039. [Google Scholar] [CrossRef]
  10. Bello-López, J.M.; Sánchez-Garibay, C.; Ibáñez-Cervantes, G.; León-García, G.; Gonzalez-Avila, L.U.; Hernández-Cortez, C.; Barbosa, P.A.; Castro-Escarpulli, G. Genetic and Phenotypic Determinants of Resistance to Antibiotics in Aeromonas Spp., Strains Isolated from Pediatric Patients. J. Infect. Dev. Ctries. 2020, 14, 1146–1154. [Google Scholar] [CrossRef] [PubMed]
  11. de Bruijn, I.; Liu, Y.; Wiegertjes, G.F.; Raaijmakers, J.M. Exploring Fish Microbial Communities to Mitigate Emerging Diseases in Aquaculture. FEMS Microbiol. Ecol. 2018, 94, fix161. [Google Scholar] [CrossRef] [PubMed]
  12. Rahayu, S.; Amoah, K.; Huang, Y.; Cai, J.; Wang, B.; Shija, V.M.; Jin, X.; Anokyewaa, M.A.; Jiang, M. Probiotics Application in Aquaculture: Its Potential Effects, Current Status in China and Future Prospects. Front. Mar. Sci. 2024, 11, 1455905. [Google Scholar] [CrossRef]
  13. Sam-on, M.F.S.; Mustafa, S.; Mohd Hashim, A.; Wan Mustapha, W.A.; Yusof, M.T.; Mohd Zaini, N.A.; Mohamed Nazir, M.Y. Bibliometric Mapping on the Probiotic Trends in Managing Aquaculture Pathogens. Food Biosci. 2025, 68, 106372. [Google Scholar] [CrossRef]
  14. Brugman, S.; Ikeda-Ohtsubo, W.; Braber, S.; Folkerts, G.; Pieterse, C.M.J.; Bakker, P.A.H.M. A Comparative Review on Microbiota Manipulation: Lessons From Fish, Plants, Livestock, and Human Research. Front. Nutr. 2018, 5, 80. [Google Scholar] [CrossRef]
  15. Butt, U.D.; Khan, S.; Liu, X.; Sharma, A.; Zhang, X.; Wu, B. Present Status, Limitations, and Prospects of Using Streptomyces Bacteria as a Potential Probiotic Agent in Aquaculture. Probiotics Antimicrob. Proteins 2024, 16, 426–442. [Google Scholar] [CrossRef]
  16. James, G.; Prasannan Geetha, P.; Thavarool Puthiyedathu, S.; Vattringal Jayadradhan, R.K. Applications of Actinobacteria in Aquaculture: Prospects and Challenges. 3 Biotech 2023, 13, 42. [Google Scholar] [CrossRef]
  17. García-Bernal, M.; Campa-Córdova, Á.I.; Saucedo, P.E.; Casanova-González, M.; Medina-Marrero, R.; Mazón-Suástegui, J.M. Isolation and in Vitro Selection of Actinomycetes Strains as Potential Probiotics for Aquaculture. Vet. World 2015, 8, 170–176. [Google Scholar] [CrossRef]
  18. Caesar, L.K.; Montaser, R.; Keller, N.P.; Kelleher, N.L. Metabolomics and Genomics in Natural Products Research: Complementary Tools for Targeting New Chemical Entities. Nat. Prod. Rep. 2021, 38, 2041–2065. [Google Scholar] [CrossRef]
  19. Gaudêncio, S.P.; Bayram, E.; Lukić Bilela, L.; Cueto, M.; Díaz-Marrero, A.R.; Haznedaroglu, B.Z.; Jimenez, C.; Mandalakis, M.; Pereira, F.; Reyes, F.; et al. Advanced Methods for Natural Products Discovery: Bioactivity Screening, Dereplication, Metabolomics Profiling, Genomic Sequencing, Databases and Informatic Tools, and Structure Elucidation. Mar. Drugs 2023, 21, 308. [Google Scholar] [CrossRef]
  20. Schorn, M.A.; Verhoeven, S.; Ridder, L.; Huber, F.; Acharya, D.D.; Aksenov, A.A.; Aleti, G.; Moghaddam, J.A.; Aron, A.T.; Aziz, S.; et al. A Community Resource for Paired Genomic and Metabolomic Data Mining. Nat. Chem. Biol. 2021, 17, 363–368. [Google Scholar] [CrossRef]
  21. Zdouc, M.M.; Augustijn, H.E.; Machushynets, N.V.; Bayona, L.M.; Soldatou, S.; de Jonge, N.F.; Casu, S.; Jaspars, M.; van Wezel, G.P.; Medema, M.H.; et al. FERMO: A Dashboard for Automated Prioritization of Molecular Features from Mass Spectral Data. bioRxiv 2022. [Google Scholar] [CrossRef]
  22. Nuñez Santiago, I.; Machushynets, N.V.; Mladic, M.; van Bergeijk, D.A.; Elsayed, S.S.; Hankemeier, T.; van Wezel, G.P. NanoRAPIDS as an Analytical Pipeline for the Discovery of Novel Bioactive Metabolites in Complex Culture Extracts at the Nanoscale. Commun. Chem. 2024, 7, 71. [Google Scholar] [CrossRef] [PubMed]
  23. Wu, Q.; Bell, B.A.; Yan, J.X.; Chevrette, M.G.; Brittin, N.J.; Zhu, Y.; Chanana, S.; Maity, M.; Braun, D.R.; Wheaton, A.M.; et al. Metabolomics and Genomics Enable the Discovery of a New Class of Nonribosomal Peptidic Metallophores from a Marine Micromonospora. J. Am. Chem. Soc. 2023, 145, 58–69. [Google Scholar] [CrossRef] [PubMed]
  24. Goering, A.W.; McClure, R.A.; Doroghazi, J.R.; Albright, J.C.; Haverland, N.A.; Zhang, Y.; Ju, K.S.; Thomson, R.J.; Metcalf, W.W.; Kelleher, N.L. Metabologenomics: Correlation of Microbial Gene Clusters with Metabolites Drives Discovery of a Nonribosomal Peptide with an Unusual Amino Acid Monomer. ACS Cent. Sci. 2016, 2, 99–108. [Google Scholar] [CrossRef]
  25. Caesar, L.K.; Butun, F.A.; Robey, M.T.; Ayon, N.J.; Gupta, R.; Dainko, D.; Bok, J.W.; Nickles, G.; Stankey, R.J.; Johnson, D.; et al. Correlative Metabologenomics of 110 Fungi Reveals Metabolite–Gene Cluster Pairs. Nat. Chem. Biol. 2023, 19, 846–854. [Google Scholar] [CrossRef] [PubMed]
  26. Jackson, S.A.; Crossman, L.; Almeida, E.L.; Margassery, L.M.; Kennedy, J.; Dobson, A.D.W. Diverse and Abundant Secondary Metabolism Biosynthetic Gene Clusters in the Genomes of Marine Sponge Derived Streptomyces Spp. Isolates. Mar. Drugs 2018, 16, 67. [Google Scholar] [CrossRef]
  27. Al-Ansari, M.; Kalaiyarasi, M.; Almalki, M.A.; Vijayaraghavan, P. Optimization of Medium Components for the Production of Antimicrobial and Anticancer Secondary Metabolites from Streptomyces Sp. AS11 Isolated from the Marine Environment. J. King Saud. Univ. Sci. 2020, 32, 1993–1998. [Google Scholar] [CrossRef]
  28. Scherlach, K.; Hertweck, C. Triggering Cryptic Natural Product Biosynthesis in Microorganisms. Org. Biomol. Chem. 2009, 7, 1753–1760. [Google Scholar] [CrossRef]
  29. Bode, H.B.; Bethe, B.; Höfs, R.; Zeeck, A. Big Effects from Small Changes: Possible Ways to Explore Nature’s Chemical Diversity. ChemBioChem 2002, 3, 619–627. [Google Scholar] [CrossRef]
  30. Rateb, M.E.; Ebel, R.; Jaspars, M. Natural Product Diversity of Actinobacteria in the Atacama Desert. Antonie van Leeuwenhoek, Int. J. General. Mol. Microbiol. 2018, 111, 1467–1477. [Google Scholar] [CrossRef]
  31. Goodfellow, M.; Fiedler, H.P. A Guide to Successful Bioprospecting: Informed by Actinobacterial Systematics. Antonie Leeuwenhoek Int. J. Gen. Mol. Microbiol. 2010, 98, 119–142. [Google Scholar] [CrossRef] [PubMed]
  32. Boudemagh, A.; Kitouni, M.; Boughachiche, F.; Hamdiken, H.; Oulmi, L.; Reghioua, S.; Zerizer, H.; Couble, A.; Mouniee, D.; Boulahrouf, A.; et al. Isolation and Molecular Identification of Actinomycete Microflora, of Some Saharian Soils of South East Algeria (Biskra, EL-Oued and Ourgla) Study of Antifungal Activity of Isolated Strains. J. Mycol. Med. 2005, 15, 39–44. [Google Scholar] [CrossRef]
  33. Chanana, S.; Thomas, C.S.; Zhang, F.; Rajski, S.R.; Bugni, T.S. HCAPCA: Automated Hierarchical Clustering and Principal Component Analysis of Large Metabolomic Datasets in R. Metabolites 2020, 10, 297. [Google Scholar] [CrossRef] [PubMed]
  34. Hou, Y.; Braun, D.R.; Michel, C.R.; Klassen, J.L.; Adnani, N.; Wyche, T.P.; Bugni, T.S. Microbial Strain Prioritization Using Metabolomics Tools for the Discovery of Natural Products. Anal. Chem. 2012, 84, 4277–4283. [Google Scholar] [CrossRef]
  35. Clark, C.M.; Costa, M.S.; Conley, E.; Li, E.; Sanchez, L.M.; Murphy, B.T. Using the Open-Source MALDI TOF-MS IDBac Pipeline for Analysis of Microbial Protein and Specialized Metabolite Data. J. Vis. Exp. 2019, 2019, e59219. [Google Scholar] [CrossRef]
  36. McVean, G. A Genealogical Interpretation of Principal Components Analysis. PLoS Genet. 2009, 5, e1000686. [Google Scholar] [CrossRef]
  37. Cabezas, L.M.C.; Izbicki, R.; Stern, R.B. Hierarchical Clustering: Visualization, Feature Importance and Model Selection. Appl. Soft Comput. 2023, 141, 110303. [Google Scholar] [CrossRef]
  38. Boyko, N.I.; Tkachyk, O.A. Hierarchical Clustering Algorithm for Dendrogram Construction and Cluster Counting. Inform. Math. Methods Simul. 2023, 13, 5–15. [Google Scholar] [CrossRef]
  39. Kimes, P.K.; Liu, Y.; Neil Hayes, D.; Marron, J.S. Statistical Significance for Hierarchical Clustering. Biometrics 2017, 73, 811–821. [Google Scholar] [CrossRef]
  40. Islam, M.S.; Akhtar, M.M.; Parvez, M.S.; Alam, M.J.; Alam, M.F. Antitumor and Antibacterial Activity of a Crude Methanol Leaf Extract of Vitex negundo L. Arch. Biol. Sci. 2013, 65, 229–238. [Google Scholar] [CrossRef]
  41. Nothias, L.F.; Petras, D.; Schmid, R.; Dührkop, K.; Rainer, J.; Sarvepalli, A.; Protsyuk, I.; Ernst, M.; Tsugawa, H.; Fleischauer, M.; et al. Feature-Based Molecular Networking in the GNPS Analysis Environment. Nat. Methods 2020, 17, 905–908. [Google Scholar] [CrossRef]
  42. Chambers, M.C.; MacLean, B.; Burke, R.; Amodei, D.; Ruderman, D.L.; Neumann, S.; Gatto, L.; Fischer, B.; Pratt, B.; Egertson, J.; et al. A Cross-Platform Toolkit for Mass Spectrometry and Proteomics. Nat. Biotechnol. 2012, 30, 918–920. [Google Scholar] [CrossRef]
  43. Schmid, R.; Heuckeroth, S.; Korf, A.; Smirnov, A.; Myers, O.; Dyrlund, T.S.; Bushuiev, R.; Murray, K.J.; Hoffmann, N.; Lu, M.; et al. Integrative Analysis of Multimodal Mass Spectrometry Data in MZmine 3. Nat. Biotechnol. 2023, 41, 447–449. [Google Scholar] [CrossRef]
  44. Ono, K.; Fong, D.; Gao, C.; Churas, C.; Pillich, R.; Lenkiewicz, J.; Pratt, D.; Pico, A.R.; Hanspers, K.; Xin, Y.; et al. Cytoscape Web: Bringing Network Biology to the Browser. Nucleic Acids Res. 2025, 53, W203–W212. [Google Scholar] [CrossRef]
  45. Shannon, P.; Markiel, A.; Ozier, O.; Baliga, N.S.; Wang, J.T.; Ramage, D.; Amin, N.; Schwikowski, B.; Ideker, T. Cytoscape: A Software Environment for Integrated Models of Biomolecular Interaction Networks. Genome Res. 2003, 13, 2498–2504. [Google Scholar] [CrossRef] [PubMed]
  46. Pluskal, T.; Uehara, T.; Yanagida, M. Highly Accurate Chemical Formula Prediction Tool Utilizing High-Resolution Mass Spectra, MS/MS Fragmentation, Heuristic Rules, and Isotope Pattern Matching. Anal. Chem. 2012, 84, 4396–4403. [Google Scholar] [CrossRef]
  47. Celma, A.; Sancho, J.V.; Schymanski, E.L.; Fabregat-Safont, D.; Ibáñez, M.; Goshawk, J.; Barknowitz, G.; Hernández, F.; Bijlsma, L. Improving Target and Suspect Screening High-Resolution Mass Spectrometry Workflows in Environmental Analysis by Ion Mobility Separation. Environ. Sci. Technol. 2020, 54, 15120–15131. [Google Scholar] [CrossRef]
  48. Kind, T.; Fiehn, O. Metabolomic Database Annotations via Query of Elemental Compositions: Mass Accuracy Is Insufficient Even at Less than 1 Ppm. BMC Bioinform. 2006, 7, 234. [Google Scholar] [CrossRef] [PubMed]
  49. Tyurin, A.; Alferova, V.; Paramonov, A.; Shuvalov, M.; Kudryakova, G.; Rogozhin, E.; Zherebker, A.; Brylev, V.; Chistov, A.; Baranova, A.; et al. Gausemycins A,B–Cyclic Lipoglycopeptides from Streptomyces sp. Angew. Chem. Int. Ed. Engl. 2021, 60, 18694–18703. [Google Scholar] [CrossRef] [PubMed]
  50. Kravchenko, T.V.; Paramonov, A.S.; Kudzhaev, A.M.; Efimova, S.S.; Khorev, A.S.; Kudryakova, G.K.; Ivanov, I.A.; Chistov, A.A.; Baranova, A.A.; Krasilnikov, M.S.; et al. Gausemycin Antibiotic Family Acts via Ca2+-Dependent Membrane Targeting. J. Nat. Prod. 2024, 87, 664–674. [Google Scholar] [CrossRef]
  51. Cheng, C.; Othman, E.M.; Reimer, A.; Grüne, M.; Kozjak-Pavlovic, V.; Stopper, H.; Hentschel, U.; Abdelmohsen, U.R. Ageloline A, New Antioxidant and Antichlamydial Quinolone from the Marine Sponge-Derived Bacterium Streptomyces sp. SBT345. Tetrahedron Lett. 2016, 57, 2786–2789. [Google Scholar] [CrossRef]
  52. Mordhorst, S.; Ruijne, F.; Vagstad, A.L.; Kuipers, O.P.; Piel, J. Emulating Nonribosomal Peptides with Ribosomal Biosynthetic Strategies. RSC Chem. Biol. 2022, 4, 7–36. [Google Scholar] [CrossRef]
  53. Xu, F.; Butler, R.; May, K.; Rexhepaj, M.; Yu, D.; Zi, J.; Chen, Y.; Liang, Y.; Zeng, J.; Hevel, J.; et al. Modified Substrate Specificity of a Methyltransferase Domain by Protein Insertion into an Adenylation Domain of the Bassianolide Synthetase. J. Biol. Eng. 2019, 13, 65. [Google Scholar] [CrossRef]
  54. McErlean, M.; Overbay, J.; Van Lanen, S. Refining and Expanding Nonribosomal Peptide Synthetase Function and Mechanism. J. Ind. Microbiol. Biotechnol. 2019, 46, 493–513. [Google Scholar] [CrossRef]
  55. Kupchan, S.M.; Stevens, K.L.; Rohlfing, E.A.; Sickles, B.R.; Sneden, A.T.; Miller, R.W.; Bryan, R.F. New Cytotoxic Neolignans from Aniba Megaphylla Mez.1’2. J. Org. Chem. 1978, 43, 586–590. [Google Scholar] [CrossRef]
  56. Alferova, V.A.; Shuvalov, M.V.; Suchkova, T.A.; Proskurin, G.V.; Aparin, I.O.; Rogozhin, E.A.; Novikov, R.A.; Solyev, P.N.; Chistov, A.A.; Ustinov, A.V.; et al. 4-Chloro-l-Kynurenine as Fluorescent Amino Acid in Natural Peptides. Amino Acids 2018, 50, 1697–1705. [Google Scholar] [CrossRef]
  57. Wu, C.; Shang, Z.; Lemetre, C.; Ternei, M.A.; Brady, S.F. Cadasides, Calcium-Dependent Acidic Lipopeptides from the Soil Metagenome That Are Active against Multidrug-Resistant Bacteria. J. Am. Chem. Soc. 2019, 141, 3910–3919. [Google Scholar] [CrossRef]
  58. Hover, B.M.; Kim, S.H.; Katz, M.; Charlop-Powers, Z.; Owen, J.G.; Ternei, M.A.; Maniko, J.; Estrela, A.B.; Molina, H.; Park, S.; et al. Culture-Independent Discovery of the Malacidins as Calcium-Dependent Antibiotics with Activity against Multidrug-Resistant Gram-Positive Pathogens. Nat. Microbiol. 2018, 3, 415–422. [Google Scholar] [CrossRef]
  59. Heinzelmann, E.; Berger, S.; Müller, C.; Härtner, T.; Poralla, K.; Wohlleben, W.; Schwartz, D. An Acyl-CoA Dehydrogenase Is Involved in the Formation of the Δcis3 Double Bond in the Acyl Residue of the Lipopeptide Antibiotic Friulimicin in Actinoplanes Friuliensis. Microbiology 2005, 151, 1963–1974. [Google Scholar] [CrossRef] [PubMed]
  60. Martinet, L.; Naômé, A.; Deflandre, B.; Maciejewska, M.; Tellatin, D.; Tenconi, E.; Smargiasso, N.; De Pauw, E.; Van Wezel, G.P.; Rigali, S. A Single Biosynthetic Gene Cluster Is Responsible for the Production of Bagremycin Antibiotics and Ferroverdin Iron Chelators. mBio 2019, 10, e01230-19. [Google Scholar] [CrossRef] [PubMed]
  61. Koper, K.; Han, S.W.; Pastor, D.C.; Yoshikuni, Y.; Maeda, H.A. Evolutionary Origin and Functional Diversification of Aminotransferases. J. Biol. Chem. 2022, 298, 102122. [Google Scholar] [CrossRef] [PubMed]
  62. RU2762182C1; Gausemycin A and B. G. F. Gause Research Institute for the Discovery of New Antibiotics: Moscow, Russia, 2021; p. 29.
  63. Ebbensgaard, A.; Mordhorst, H.; Aarestrup, F.M.; Hansen, E.B. The Role of Outer Membrane Proteins and Lipopolysaccharides for the Sensitivity of Escherichia Coli to Antimicrobial Peptides. Front. Microbiol. 2018, 9, 2153. [Google Scholar] [CrossRef]
  64. Yoon, Y.; Song, S. Structural Insights into the Lipopolysaccharide Transport (Lpt) System as a Novel Antibiotic Target. J. Microbiol. 2024, 62, 261–275. [Google Scholar] [CrossRef]
  65. Schneider, T.; Sahl, H.G. An Oldie but a Goodie-Cell Wall Biosynthesis as Antibiotic Target Pathway. Int. J. Med. Microbiol. 2010, 300, 161–169. [Google Scholar] [CrossRef] [PubMed]
  66. Ebanks, R.; Goguen, M.; McKinnon, S.; Pinto, D.; Ross, N.W. Identification of the major outer membrane proteins of Aeromonas salmonicida. Dis Aquat. Org. 2005, 68, 29–38. [Google Scholar] [CrossRef]
  67. Rey-Varela, D.; Cisneros-Sureda, J.; Balado, M.; Rodríguez, J.; Lemos, M.L.; Jiménez, C. The Outer Membrane Protein Fstc of Aeromonas salmonicida Subsp. Salmonicida Acts as Receptor for Amonabactin Siderophores and Displays a Wide Ligand Plasticity. Structure-Activity Relationships of Synthetic Amonabactin Analogues. ACS Infect. Dis. 2019, 5, 1936–1951. [Google Scholar] [CrossRef] [PubMed]
  68. Prjibelski, A.; Antipov, D.; Meleshko, D.; Lapidus, A.; Korobeynikov, A. Using SPAdes De Novo Assembler. Curr. Protoc. 2020, 22, 3380–3387. [Google Scholar] [CrossRef]
  69. Seemann, T. Prokka: Rapid Prokaryotic Genome Annotation. Bioinformatics 2014, 30, 2068–2069. [Google Scholar] [CrossRef]
  70. Chaumeil, P.A.; Mussig, A.J.; Hugenholtz, P.; Parks, D.H. GTDB-Tk v2: Memory Friendly Classification with the Genome Taxonomy Database. Bioinformatics 2022, 38, 5315–5316. [Google Scholar] [CrossRef]
  71. Welcome to KBase Predictive Biology|Kbase. Available online: https://www.kbase.us/ (accessed on 18 July 2025).
  72. Blin, K.; Shaw, S.; Augustijn, H.E.; Reitz, Z.L.; Biermann, F.; Alanjary, M.; Fetter, A.; Terlouw, B.R.; Metcalf, W.W.; Helfrich, E.J.N.; et al. AntiSMASH 7.0: New and Improved Predictions for Detection, Regulation, Chemical Structures and Visualisation. Nucleic Acids Res. 2023, 51, W46–W50. [Google Scholar] [CrossRef] [PubMed]
  73. Gilchrist, C.L.M.; Booth, T.J.; Van Wersch, B.; Van Grieken, L.; Medema, M.H.; Chooi, Y.H. Cblaster: A Remote Search Tool for Rapid Identification and Visualization of Homologous Gene Clusters. Bioinform. Adv. 2021, 1, vbab016. [Google Scholar] [CrossRef]
  74. Gilchrist, C.L.M.; Chooi, Y.H. Clinker & Clustermap.Js: Automatic Generation of Gene Cluster Comparison Figures. Bioinformatics 2021, 37, 2473–2475. [Google Scholar] [CrossRef]
  75. Pang, Z.; Chong, J.; Zhou, G.; De Lima Morais, D.A.; Chang, L.; Barrette, M.; Gauthier, C.; Jacques, P.É.; Li, S.; Xia, J. MetaboAnalyst 5.0: Narrowing the Gap between Raw Spectra and Functional Insights. Nucleic Acids Res. 2021, 49, W388–W396. [Google Scholar] [CrossRef] [PubMed]
  76. Wang, M.; Carver, J.J.; Phelan, V.V.; Sanchez, L.M.; Garg, N.; Peng, Y.; Nguyen, D.D.; Watrous, J.; Kapono, C.A.; Luzzatto-Knaan, T.; et al. Sharing and Community Curation of Mass Spectrometry Data with Global Natural Products Social Molecular Networking. Nat. Biotechnol. 2016, 34, 828–837. [Google Scholar] [CrossRef] [PubMed]
  77. Mohimani, H.; Gurevich, A.; Shlemov, A.; Mikheenko, A.; Korobeynikov, A.; Cao, L.; Shcherbin, E.; Nothias, L.F.; Dorrestein, P.C.; Pevzner, P.A. Dereplication of Microbial Metabolites through Database Search of Mass Spectra. Nat. Commun. 2018, 9, 4035. [Google Scholar] [CrossRef] [PubMed]
  78. NMR Guidelines for ACS Journals. Available online: https://pubsapp.acs.org/paragonplus/submission/acs_nmr_guidelines.pdf (accessed on 16 September 2025).
Figure 1. (A) Principal Component Analysis (PCA) score plot. Pink circles correspond to the M400 extract; green circles correspond to the R358 extract; navy blue circles correspond to the SGG extract. (B) Hierarchical Clustering Dendrogram (samples were clustered using the Ward method and Euclidean distance metric): the same colour representation as (A) using squares.
Marinedrugs 23 00362 g001
Figure 2. (A) Disc diffusion assay showing zone of inhibition of the M400, R358, and SGG extracts and gentamicin antibiotic (P) against A. salmonicida. (B) Media control of M400, R358, SGG, and dried methanol discs as negative control (N).
Marinedrugs 23 00362 g002
Figure 3. Global molecular network of the marine-derived Streptomyces B188M101 extracts (M400, R358 and SGG). (A) Overall molecular network of M400, R358, SGG, and media control extracts; red circles highlight three unique chlorinated clusters. (B) Clearer view of molecular mass clusters of putative new chlorinated compounds including the known gausemycin antibiotics.
Marinedrugs 23 00362 g003
Figure 4. The known compounds identified in the R358 extract of Streptomyces B188M101.
Marinedrugs 23 00362 g004
Figure 5. Structures of agelolines B–D (13), ageloline A (4), and gausemycin A (5).
Marinedrugs 23 00362 g005
Figure 6. Key HMBC, 1H—1H COSY and NOESY correlations of compounds 13.
Marinedrugs 23 00362 g006
Figure 7. Structure of the biosynthetic gene cluster, from Streptomyces sp. B188M101, presumed to produce gausemycins. The substrates of the NRPS modules are indicated. * Two ORFS (ctg_618 and ctg_619) are homologous to a single NRPS module from the gausemycin BGC from Streptomyces sp. INA-Ac-5812 [49]. These ORFs are predicted to incorporate d-Leucine into the polypeptide. ** An ORF not annotated by antiSMASH to be part of the gauA NRPS is homologous to a NRPS module in the Streptomyces sp. INA-Ac-5812, within gauA, and incorporates β-alanine into the polypeptide.
Marinedrugs 23 00362 g007
Figure 8. Proposed biosynthetic scheme for ageloline A–D (14).
Marinedrugs 23 00362 g008
Table 1. 1H and 13C NMR data of compounds 13 (CD3OD, 600 MHz).
123
PositionδC, TypeδH, Mult. (J in Hz)δC, TypeδH, Mult. (J in Hz)δC, TypeδH, Mult. (J in Hz)
1116.7, C 116.7, C 110.3, C
2153.3, C 153.3, C 153.6, C
3116.9, CH6.77 (d, 2.2)116.9, CH6.77 (d, 2.2)116.3, CH6.74 (d, 2.2)
4141.0, C 141.0, C 140.5, C
5115.9, CH6.56 (dd, 8.7, 2.2)115.9, CH6.56 (dd, 8.7, 2.2)116.0, CH6.50 (dd, 8.7, 2.2)
6133.6, CH7.72 (d, 8.7)133.6, CH7.71 (d, 8.7)133.9, CH7.77 (d, 8.7)
7198.1, C 198.1, C 170.8, C
841.2, CH23.54 (dd, 17.3, 6.3), 3.45 (dd, 16.9, 6.3)41.2, CH23.53 (dd, 17.3, 6.3), 3.46 (dd, 16.9, 6.3)
949.3, CH4.89 (m)49.3, CH4.91 (m)
10173.1, C 173.1, C
11172.9, C 172.9, C
1221.8, CH31.97 (s)21.8, CH31.96 (s)
13 51.5, CH3 3.72 (s)
Table 2. In-vitro antimicrobial activity of compounds 15.
Compound MIC (µg/mL)
Pathogenic Species12345
Staphylococcus aureus ATCC6538P128>128612832
S. aureus L3797>128>128>128>128>64
S. pneumoniae L44 >128>12864128128
S. maltophilia L2125128643264nt
Aeromonas salmonicida>128>128>128>12832
Pseudomonas aeruginosa>128>128>128>128>128
E. coli ΔtolC L4242>128>128>128>128>128
Table 3. In-vitro antimicrobial activity of compound 5 after supplemented with CaCl2.
Pathogenic Species0 mM CaCl20.45 mM CaCl220 mM CaCl2
Staphylococcus aureus ATCC6538P324≤4
S. aureus GISA L3797>641632
S. pneumoniae L44 128128nt
Aeromonas salmonicida321616
Pseudomonas aeruginosa>128>128>128
E. coli ΔtolC L4242>128>128>64
Disclaimer/Publisher’s Note: The statements, opinions and data contained in all publications are solely those of the individual author(s) and contributor(s) and not of MDPI and/or the editor(s). MDPI and/or the editor(s) disclaim responsibility for any injury to people or property resulting from any ideas, methods, instructions or products referred to in the content.