
Isolation and Characterization of Photosensitive Hemolytic Toxins from the Mixotrophic Dinoflagellate Akashiwo sanguinea
Abstract
1. Introduction
2. Results
2.1. A. sanguinea Toxins
2.1.1. Optimization of Extraction Solvent
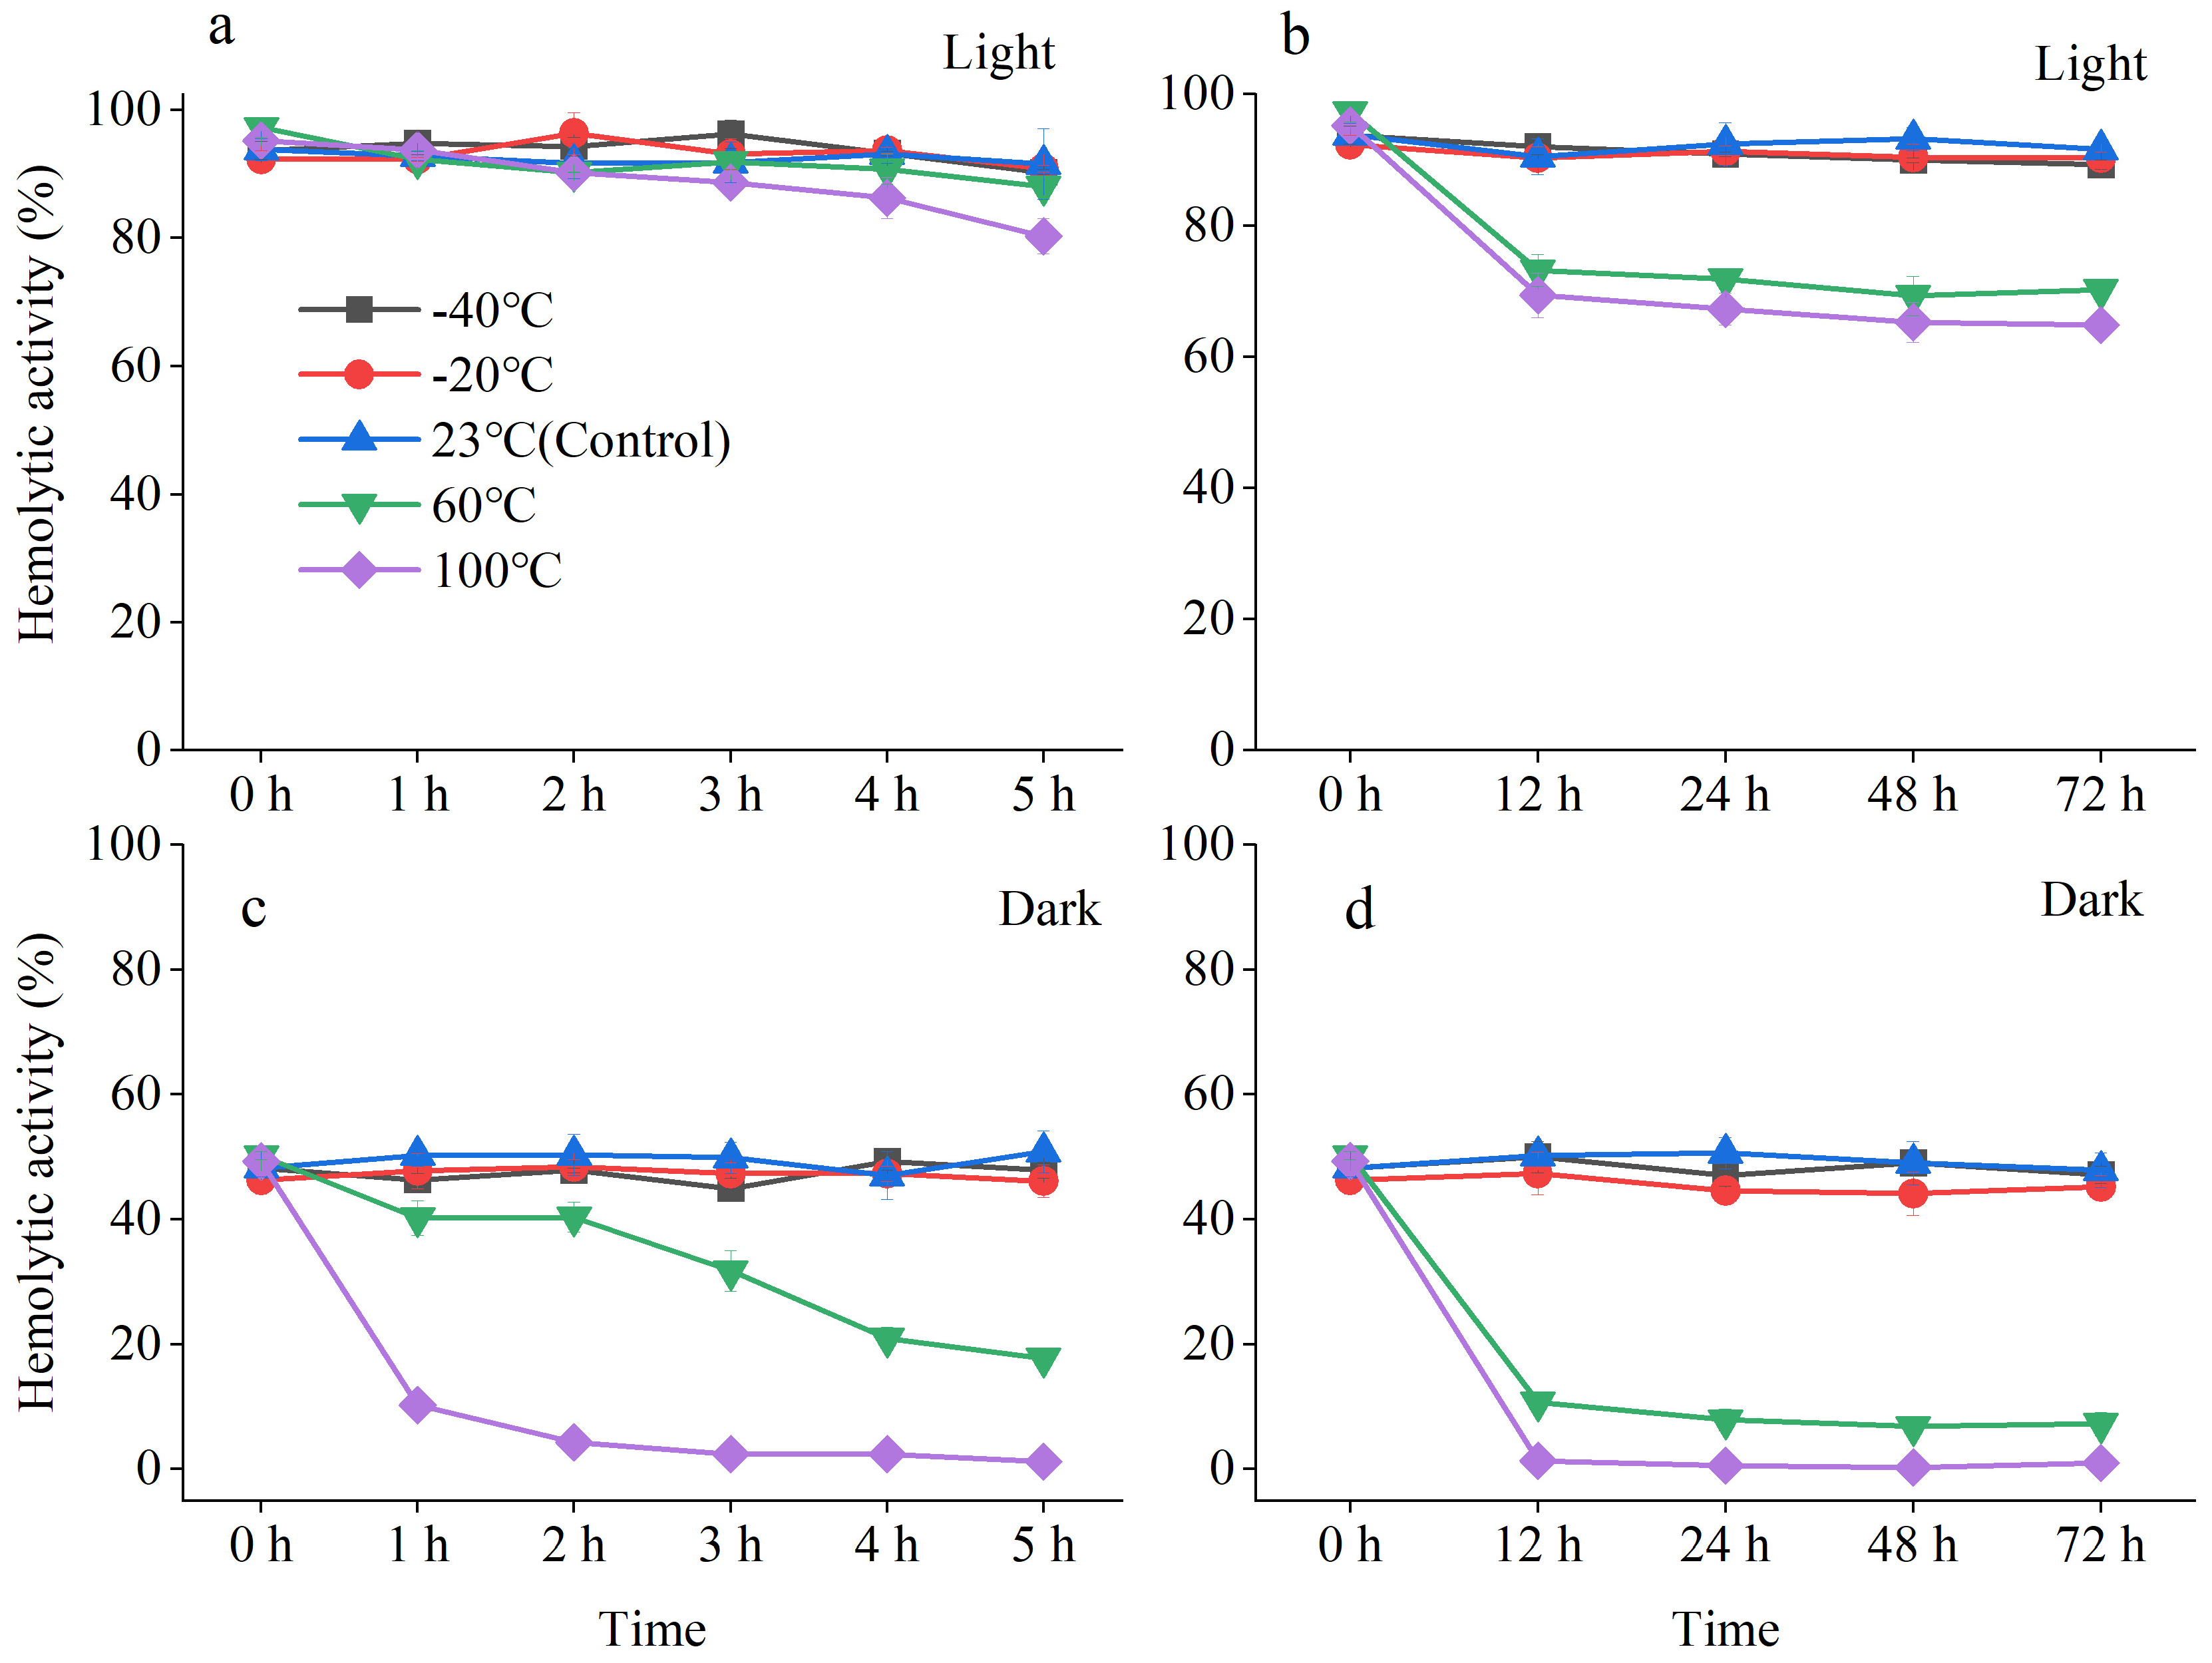
2.1.2. Stability of A. sanguinea Toxins
- (1)
- Thermal stability
- (2)
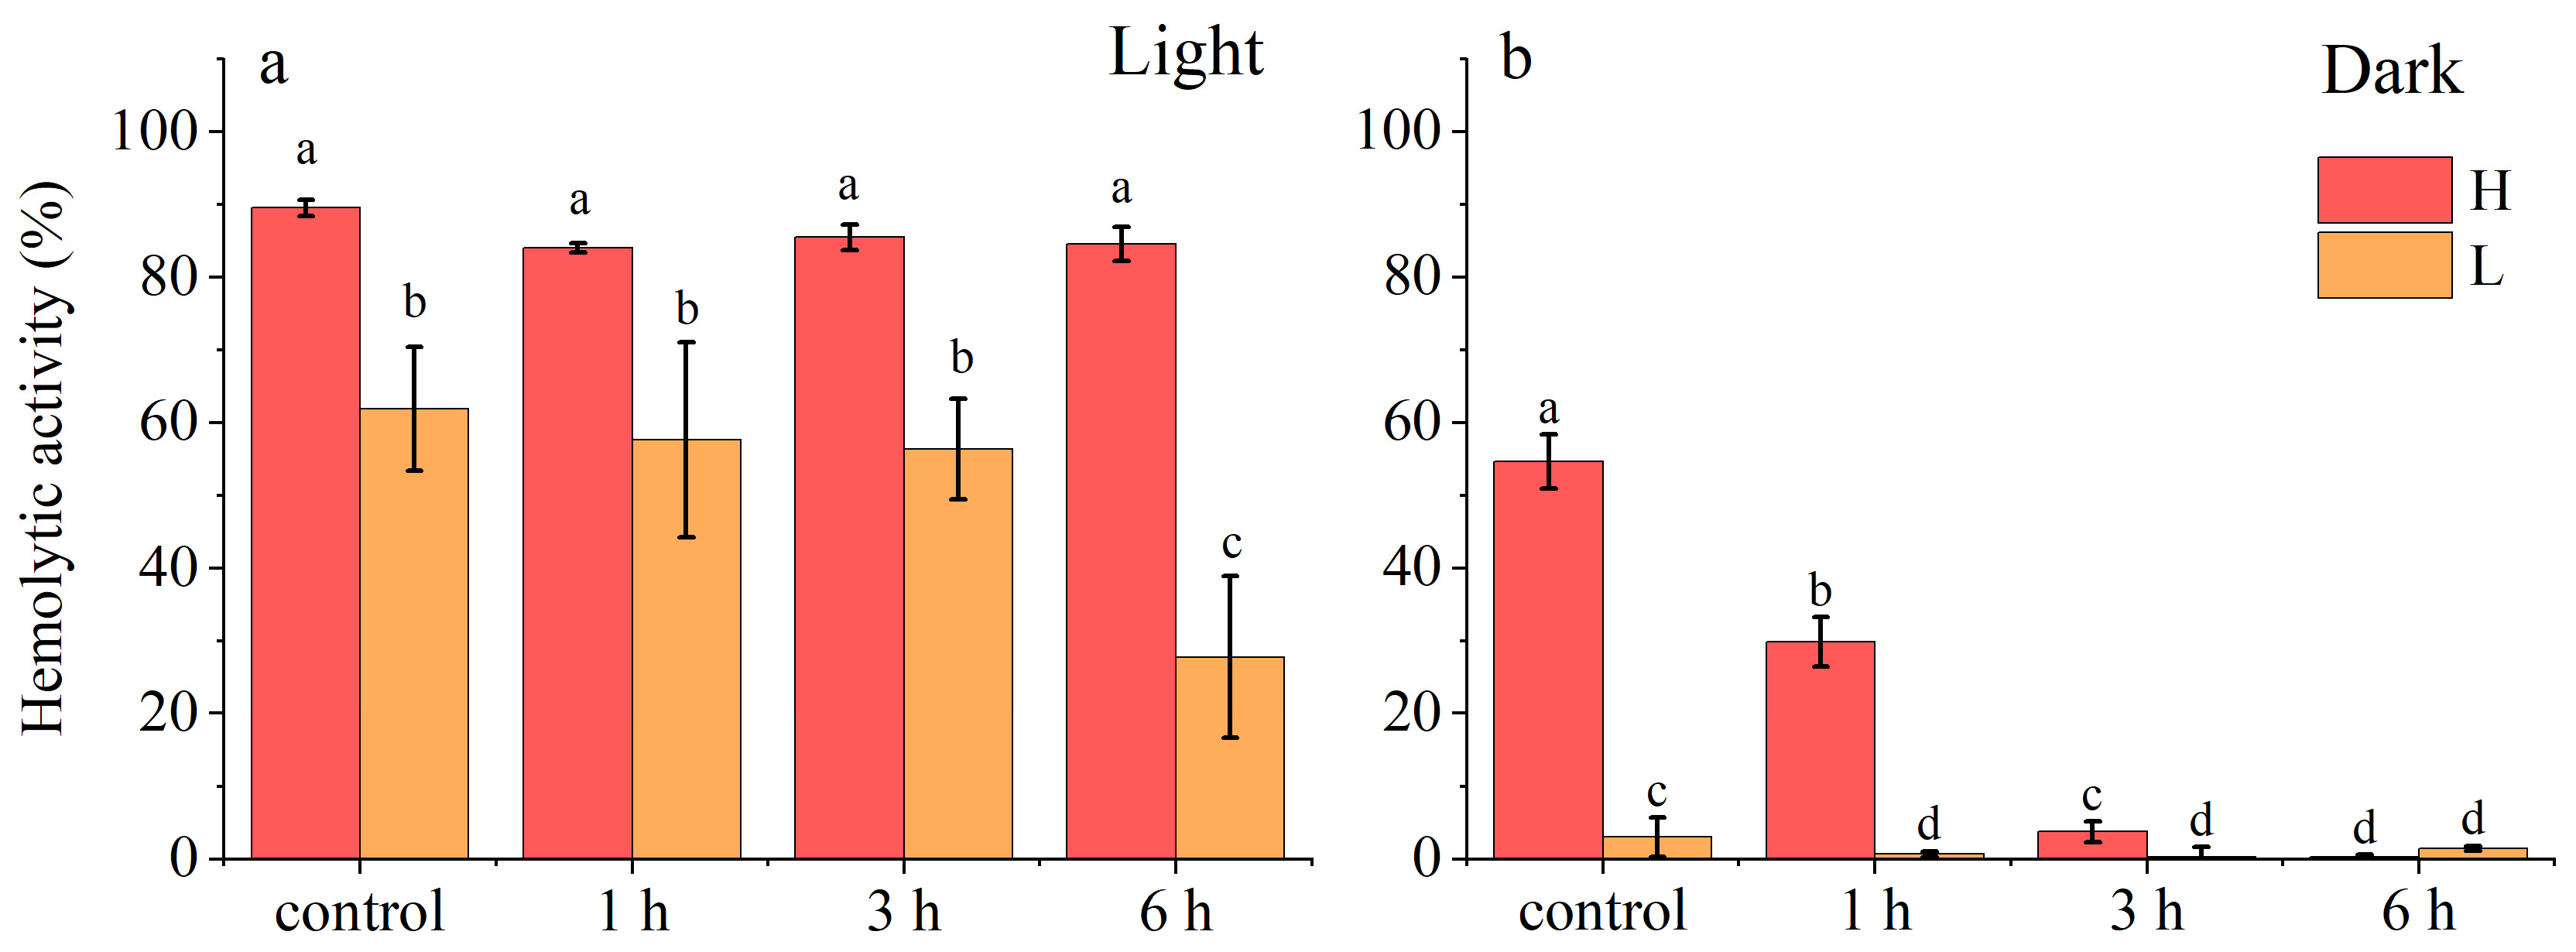
- Photostability
- (3)
- Long-Term Chemical Stability
2.2. SPE Purification of A. sanguinea Acetone Extract
2.2.1. Hemolytic Activity of SPE Fractions
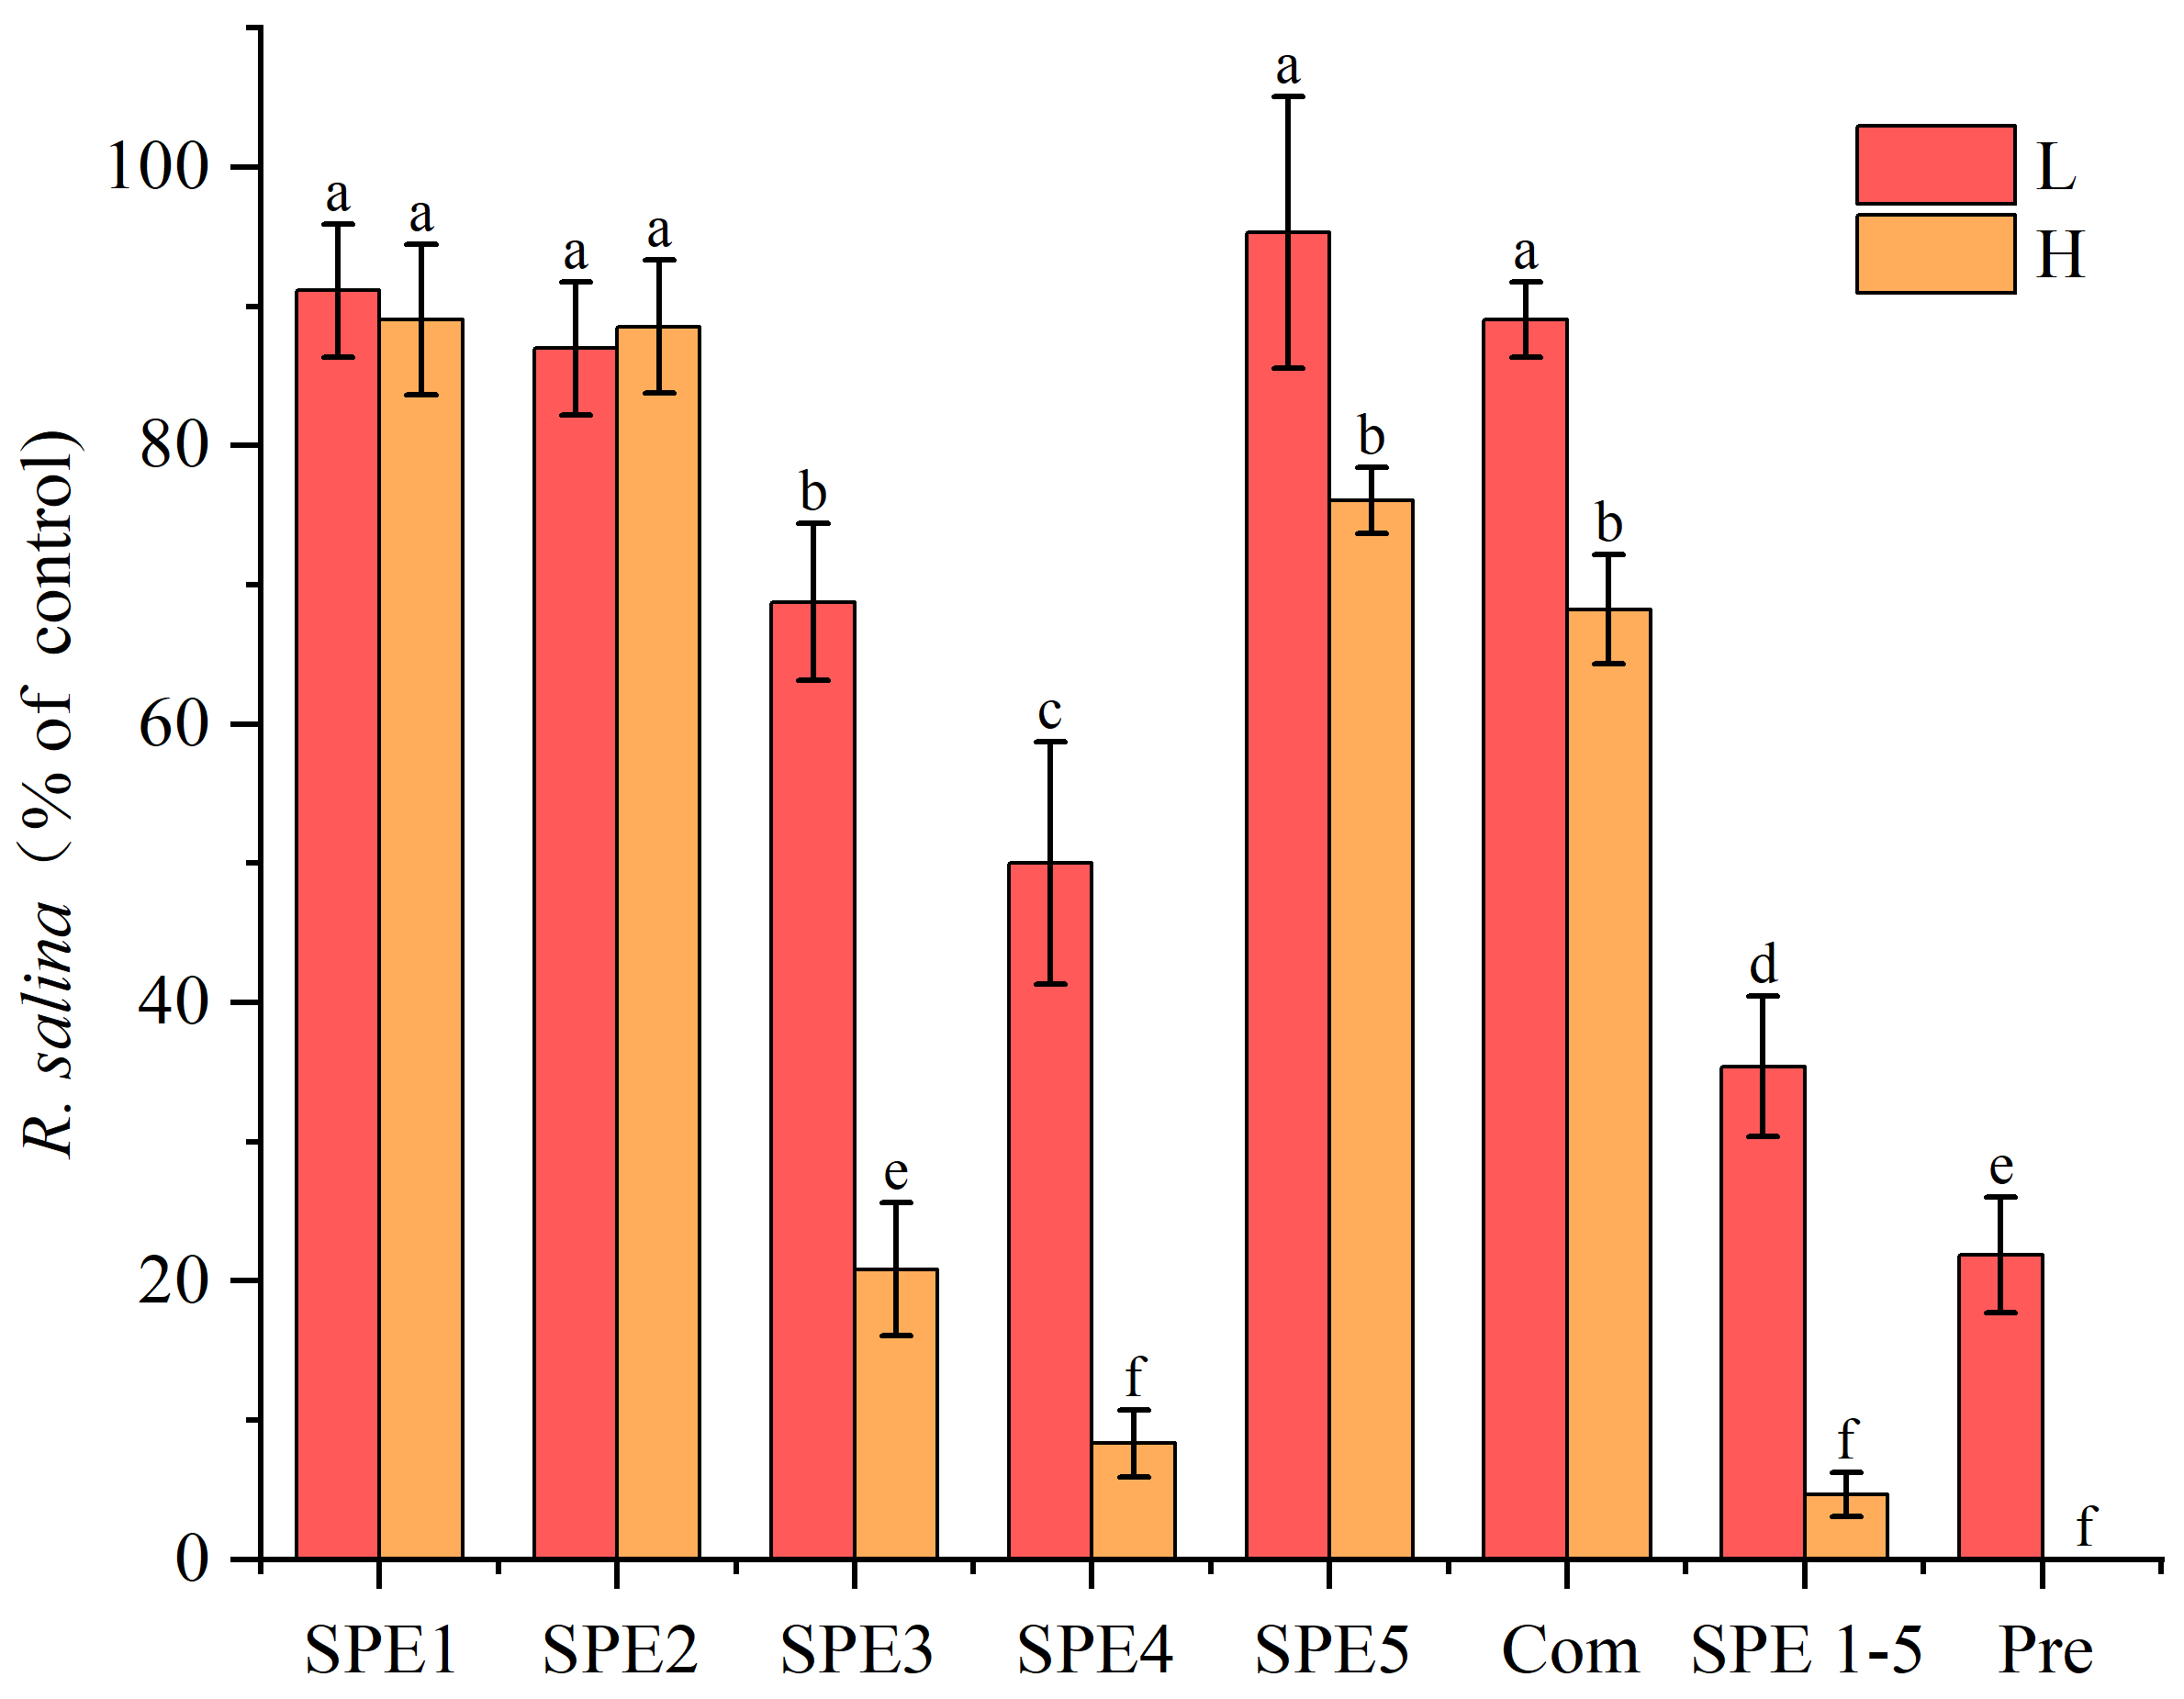
2.2.2. Allelopathic Effect of SPE Fractions
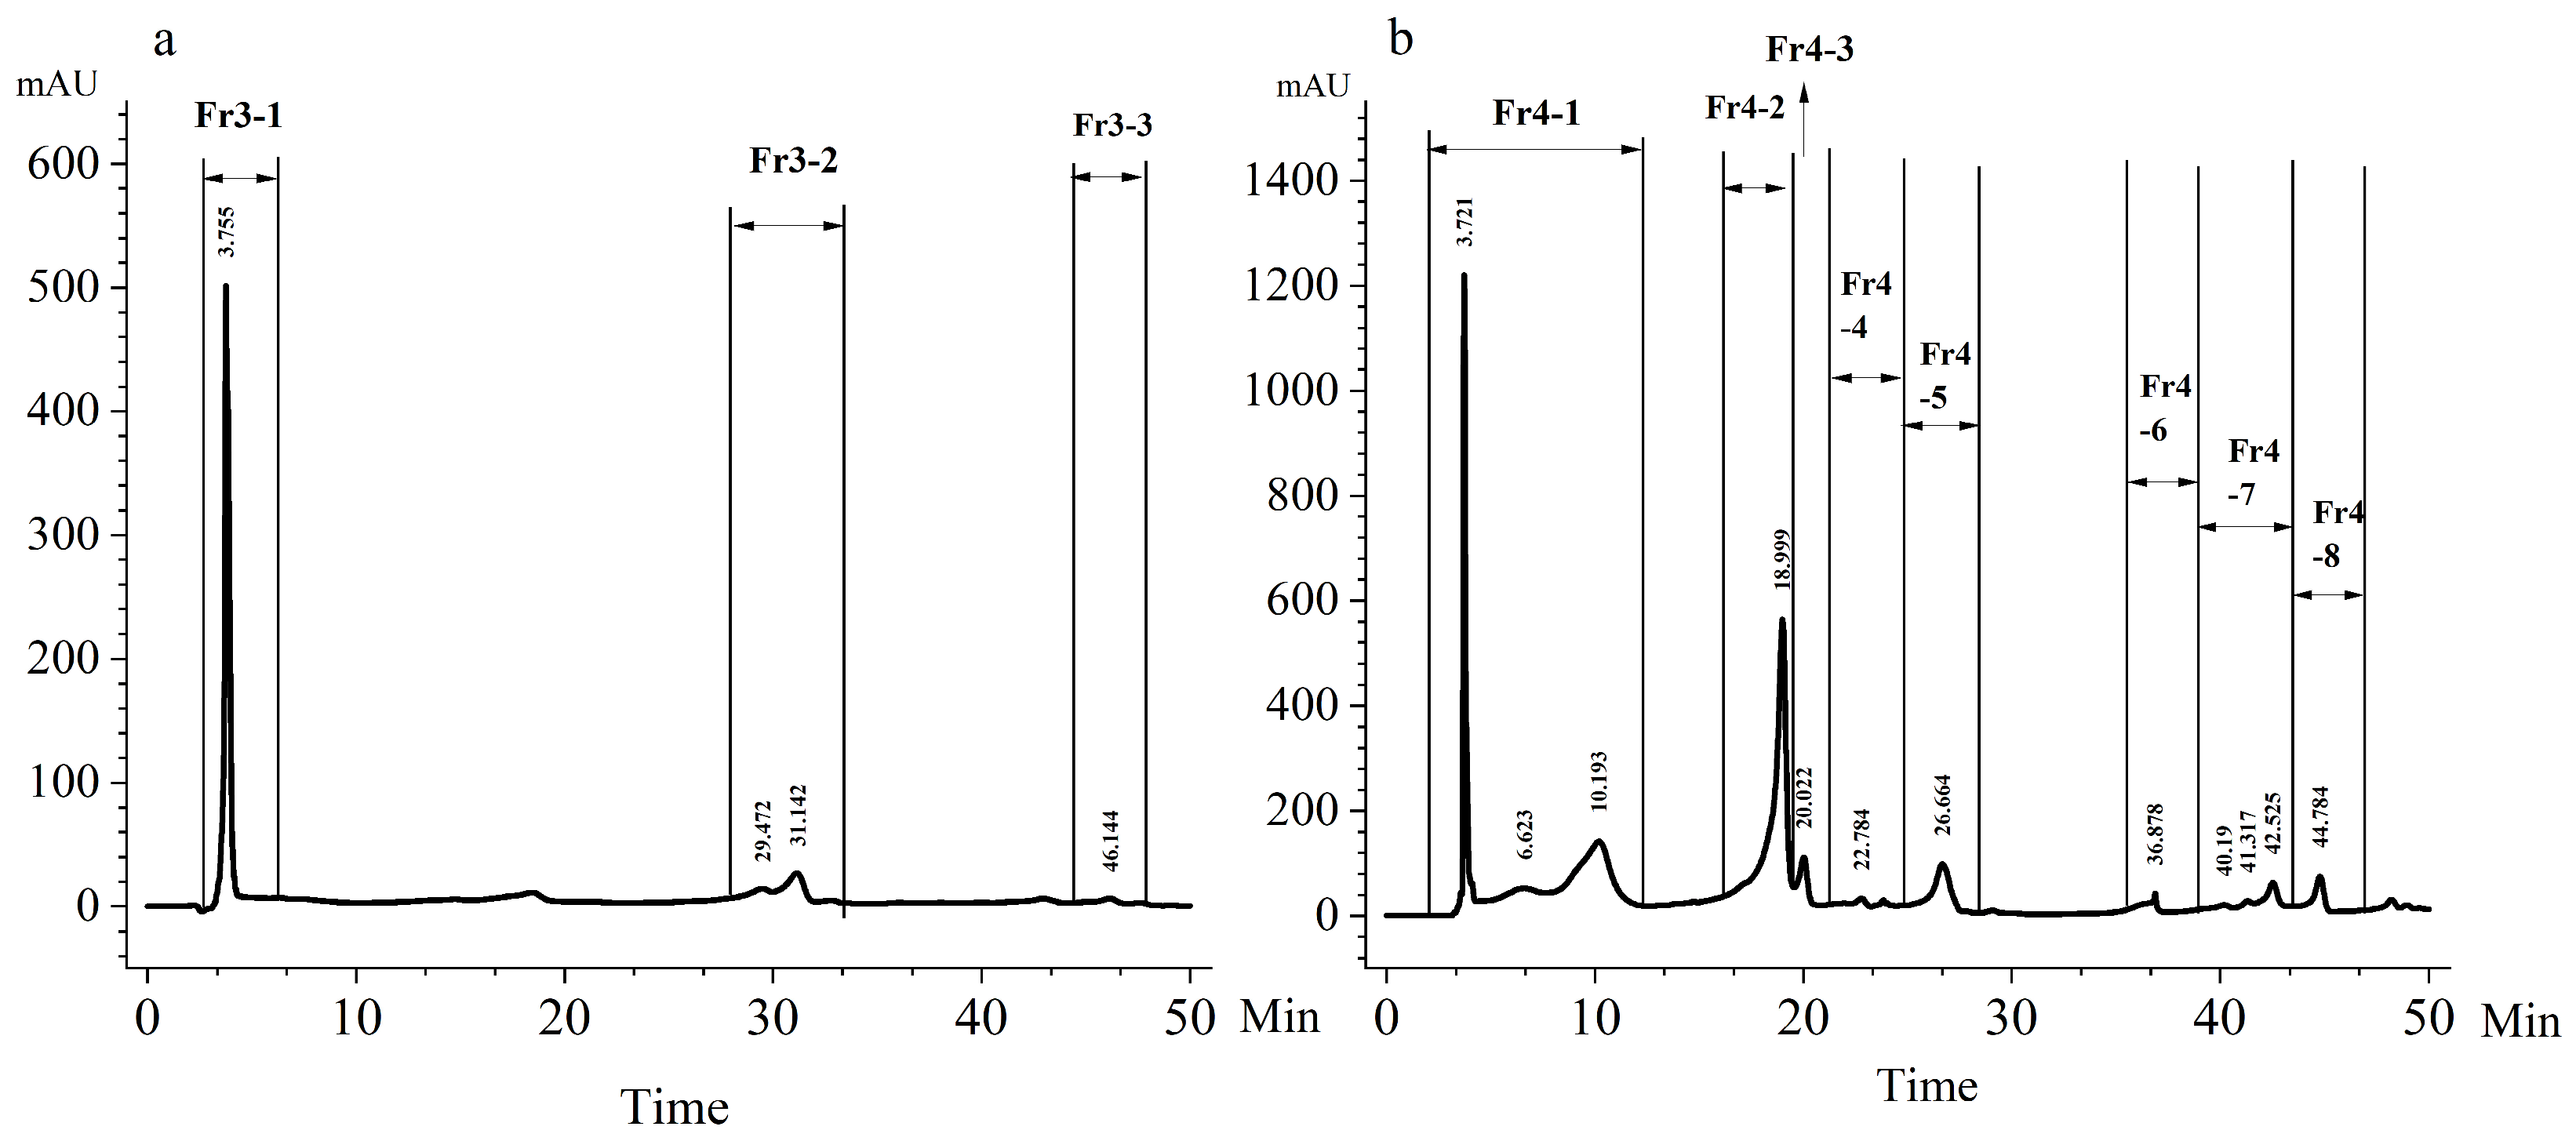
2.3. HPLC Fractionation of SPE3 and SPE4
2.4. Characterization of HPLC Fraction Fr4-5
2.4.1. UV-Vis Analysis
2.4.2. FTIR Analysis
2.4.3. HRMS/MS Analysis
3. Discussion
3.1. Stability of Hemolytic Toxins
3.2. Molecular Characterization of Fraction Fr4-5
3.3. Ecological Significance of Porphyrin-like Phycotoxins
4. Materials and Methods
4.1. Algal Cultures Conditions
4.2. Extraction of A. sanguinea Toxins
4.2.1. Hemolytic Activity of A. sanguinea Extract
4.2.2. Optimization of Extraction Solvent
4.2.3. Stability of A. sanguinea Toxins
- (1)
- Thermal stability
- (2)
- Photostability
- (3)
- Long-term chemical stability
4.3. SPE Purification of A. sanguine Acetone Extract
4.3.1. SPE Fractionation from A. sanguinea Acetone Extract
4.3.2. Hemolytic and Allelopathic Activities of SPE Fractions
4.4. HPLC Purification of SPE3 and SPE4
4.5. Characterization of HPLC Fraction
4.5.1. UV-Vis Analysis
4.5.2. FTIR Analysis
4.5.3. HRMS/MS Analysis
4.6. Hemolytic Activity and Allelopathic Activity Assays
4.6.1. Hemolytic Activity
4.6.2. Allelopathic Activity
4.7. Data Analysis
5. Conclusions
Supplementary Materials
Author Contributions
Funding
Institutional Review Board Statement
Data Availability Statement
Acknowledgments
Conflicts of Interest
References
- Daugbjerg, N.; Hansen, G.; Larsen, J.; Moestrup, O. Phylogeny of some of the major genera of dinoflagellates based on ultrastructure and partial LSU rDNA sequence data, including the erection of three new genera of unarmoured dinoflagellates. Phycologia 2000, 39, 302–317. [Google Scholar] [CrossRef]
- Matsubara, T.; Nagasoe, S.; Yamasaki, Y.; Shikata, T.; Shimasaki, Y.; Oshima, Y.; Honjo, T. Effects of temperature, salinity, and irradiance on the growth of the dinoflagellate Akashiwo sanguinea. J. Exp. Mar. Biol. Ecol. 2007, 342, 226–230. [Google Scholar] [CrossRef]
- Hirasaka, K. On a case of discolored sea-water. Annot. Zool. Jpn. 1922, 10, 161–164. [Google Scholar]
- Smida, D.B.; Sahraoui, I.; Grami, B.; Mabrouk, H.H.; Hlaili, A.S. Population dynamics of potentially harmful algal blooms in Bizerte Lagoon, Tunisia. Afr. J. Aquat. Sci. 2014, 39, 177–188. [Google Scholar] [CrossRef]
- Jessup, D.A.; Miller, M.A.; Ryan, J.P.; Nevins, H.M.; Kerkering, H.A.; Mekebri, A.; Crane, D.B.; Johnson, T.A.; Kudela, R.M. Mass Stranding of Marine Birds Caused by a Surfactant-Producing Red Tide. PLoS ONE 2009, 4, 8. [Google Scholar] [CrossRef]
- O’Boyle, S.; McDermott, G. Observations of a thin near surface layer in an estuarine environment: An exceptional bloom of the dinoflagellate Akashiwo sanguinea in the Lee estuary (Lough Mahon), Co. Cork, in September 2010. Deep-Sea Res. Part II-Top. Stud. Oceanogr. 2014, 101, 244–248. [Google Scholar] [CrossRef]
- White, A.E.; Watkins-Brandt, K.S.; McKibben, S.M.; Wood, A.M.; Hunter, M.; Forster, Z.; Du, X.N.; Peterson, W.T. Large-scale bloom of Akashiwo sanguinea in the Northern California current system in 2009. Harmful Algae 2014, 37, 38–46. [Google Scholar] [CrossRef]
- Grattan, L.M.; Holobaugh, S.; Morris, J.G., Jr. Harmful algal blooms and public health. Harmful Algae 2016, 57, 2–8. [Google Scholar]
- Lu, S.H.; Hodgkiss, I.J. Harmful algal bloom causative collected from Hong Kong waters. Hydrobiologia 2004, 512, 231–238. [Google Scholar] [CrossRef]
- Du, X.N.; Peterson, W.; McCulloch, A.; Liu, G.X. An unusual bloom of the dinoflagellate Akashiwo sanguinea off the central Oregon, USA, coast in autumn 2009. Harmful Algae 2011, 10, 784–793. [Google Scholar] [CrossRef]
- Yang, C.Y.; Li, Y.; Zhou, Y.Y.; Zheng, W.; Tian, Y.; Zheng, T.L. Bacterial community dynamics during a bloom caused by Akashiwo sanguinea in the Xiamen sea area, China. Harmful Algae 2012, 20, 132–141. [Google Scholar] [CrossRef]
- Chen, T.T.; Liu, Y.; Song, S.Q.; Li, C.W.; Tang, Y.Z.; Yu, Z.M. The effects of major environmental factors and nutrient limitation on growth and encystment of planktonic dinoflagellate Akashiwo sanguinea. Harmful Algae 2015, 46, 62–70. [Google Scholar] [CrossRef]
- Tang, Y.Z.; Gobler, C.J. Sexual resting cyst production by the dinoflagellate Akashiwo sanguinea: A potential mechanism contributing to the ubiquitous distribution of a harmful alga. J. Phycol. 2015, 51, 298–309. [Google Scholar] [CrossRef]
- Kwon, H.K.; Oh, S.-J. Growth Response of the Dinoflagellate Akashiwo sanguinea in Relation to Temperature, Salinity and Irradiance, and its Advantage in Species Succession. J. Korean Soc. Mar. Environ. Saf. 2014, 20, 1–10. [Google Scholar] [CrossRef]
- Xu, N.; Wang, M.; Tang, Y.Z.; Zhang, Q.; Duan, S.S.; Gobler, C.J. Acute toxicity of the cosmopolitan bloom-forming dinoflagellate Akashiwo sanguinea to finfish, shellfish, and zooplankton. Aquat. Microb. Ecol. 2018, 80, 209–222. [Google Scholar] [CrossRef]
- Liu, Y.; Chen, T.; Wang, X.; Song, S.; Li, C. Variation in the photosynthetic activities of the dinoflagellate Akashiwo sanguinea during formation of resting cysts. Mar. Biol. 2020, 167, 158. [Google Scholar] [CrossRef]
- Horner, R.A.; Garrison, D.L.; Plumley, F.G. Harmful algal blooms and red tide problems on the US west coast. Limnol. Oceanogr. 1997, 42 Pt 2, 1076–1088. [Google Scholar] [CrossRef]
- Kim, D.; Nakamura, A.; Okamoto, T.; Komatsu, N.; Oda, T.; Ishimatsu, A.; Muramatsu, T. Toxic potential of the raphidophyte Olisthodiscus luteus: Mediation by reactive oxygen species. J. Plankton Res. 1999, 21, 1017–1027. [Google Scholar] [CrossRef]
- Badylak, S.; Phlips, E.J.; Mathews, A.L.; Kelley, K. Akashiwo sanguinea (Dinophyceae) extruding mucous from pores on the cell surface. Algae 2014, 29, 197–201. [Google Scholar] [CrossRef]
- Wu, X.E.; Yang, Y.; Yang, Y.Y.; Zhong, P.; Xu, N. Toxic Characteristics and Action Mode of the Mixotrophic Dinoflagellate Akashiwo sanguinea on Co-Occurring Phytoplankton and Zooplankton. Int. J. Environ. Res. Public Health 2022, 19, 404. [Google Scholar] [CrossRef]
- Shumway, S.E. A review of the effects of algal blooms on shellfish and aquaculture. J. World Aquac. Soc. 1990, 21, 65–104. [Google Scholar] [CrossRef]
- Botes, L.; Smit, A.; Cook, P. The potential threat of algal blooms to the abalone (Haliotis midae) mariculture industry situated around the South African coast. Harmful Algae 2003, 2, 247–259. [Google Scholar] [CrossRef]
- James, K.J.; Carey, B.; O’Halloran, J.; van Pelt, F.N.A.M.; ŠKrabÁKovÁ, Z. Shellfish toxicity: Human health implications of marine algal toxins. Epidemiol. Infect. 2010, 138, 927–940. [Google Scholar] [CrossRef]
- Cusick, K.D.; Sayler, G.S. An Overview on the Marine Neurotoxin, Saxitoxin: Genetics, Molecular Targets, Methods of Detection and Ecological Functions. Mar. Drugs 2013, 11, 991–1018. [Google Scholar] [CrossRef]
- Nicholson, G.M.; Lewis, R.J. Ciguatoxins: Cyclic polyether modulators of voltage-gated Iion channel function. Mar. Drugs 2006, 4, 82–118. [Google Scholar] [CrossRef]
- Liu, X.; Ma, Y.; Wu, J.; Yin, Q.; Wang, P.; Zhu, J.; Chan, L.L.; Wu, B. Characterization of new gambierones produced by Gambierdiscus balechii 1123M1M10. Mar. Drugs 2022, 21, 3. [Google Scholar] [CrossRef]
- Christensen, V.G.; Khan, E. Freshwater neurotoxins and concerns for human, animal, and ecosystem health: A review of anatoxin-a and saxitoxin. Sci. Total Environ. 2020, 736, 139515. [Google Scholar] [CrossRef]
- Hallegraeff, G.M.; Anderson, D.M.; Belin, C.; Bottein, M.-Y.D.; Bresnan, E.; Chinain, M.; Enevoldsen, H.; Iwataki, M.; Karlson, B.; McKenzie, C.H. Perceived global increase in algal blooms is attributable to intensified monitoring and emerging bloom impacts. Commun. Earth Environ. 2021, 2, 117. [Google Scholar] [PubMed]
- Gentien, P.; Lunven, M.; Lazure, P.; Youenou, A.; Crassous, M.-P. Motility and autotoxicity in Karenia mikimotoi (Dinophyceae). Philos. Trans. R. Soc. B Biol. Sci. 2007, 362, 1937–1946. [Google Scholar] [CrossRef]
- Kuroda, A.; Nakashima, T.; Yamaguchi, K.; Oda, T. Isolation and characterization of light-dependent hemolytic cytotoxin from harmful red tide phytoplankton Chattonella marina. Comp. Biochem. Physiol. Part C Toxicol. Pharmacol. 2005, 141, 297–305. [Google Scholar] [CrossRef]
- Basti, L.; Nagai, S.; Watanabe, S.; Oda, T.; Tanaka, Y. Neuroenzymatic activity and physiological energetics in Manila clam, Ruditapes philippinarum, during short-term sublethal exposure to harmful alga, Heterocapsa circularisquama. Aquat. Toxicol. 2016, 176, 76–87. [Google Scholar] [CrossRef] [PubMed]
- Neely, T.; Campbell, L. A modified assay to determine hemolytic toxin variability among Karenia clones isolated from the Gulf of Mexico. Harmful Algae 2006, 5, 592–598. [Google Scholar] [CrossRef]
- Kobayashi, J.i.; Kubota, T. Bioactive macrolides and polyketides from marine dinoflagellates of the genus Amphidinium. J. Nat. Prod. 2007, 70, 451–460. [Google Scholar] [CrossRef]
- Kobayashi, J. Amphidinolides and its related macrolides from marine dinoflagellates. J. Antibiot. 2008, 61, 271–284. [Google Scholar] [CrossRef]
- Paul, G.K.; Matsumori, N.; Murata, M.; Tachibana, K. Isolation and chemical structure of amphidinol 2, a potent hemolytic compound from marine dinoflagellate Amphidinium klebsii. Tetrahedron Lett. 1995, 36, 6279–6282. [Google Scholar]
- Deeds, J.R.; Terlizzi, D.E.; Adolf, J.E.; Stoecker, D.K.; Place, A.R. Toxic activity from cultures of Karlodinium micrum (= Gyrodinium galatheanum) (Dinophyceae)—A dinoflagellate associated with fish mortalities in an estuarine aquaculture facility. Harmful Algae 2002, 1, 169–189. [Google Scholar] [CrossRef]
- Deeds, J.R.; Reimschuessel, R.; Place, A.R. Histopathological effects in fish exposed to the toxins from Karlodinium micrum. J. Aquat. Anim. Health 2006, 18, 136–148. [Google Scholar] [CrossRef]
- Kempton, J.W.; Lewitus, A.J.; Deeds, J.R.; Law, J.M.; Place, A.R. Toxicity of Karlodinium micrum (Dinophyceae) associated with a fish kill in a South Carolina brackish retention pond. Harmful Algae 2002, 1, 233–241. [Google Scholar]
- Van Wagoner, R.M.; Deeds, J.R.; Satake, M.; Ribeiro, A.A.; Place, A.R.; Wright, J.L. Isolation and characterization of karlotoxin 1, a new amphipathic toxin from Karlodinium veneficum. Tetrahedron Lett. 2008, 49, 6457–6461. [Google Scholar]
- Miyazaki, Y.; Nakashima, T.; Iwashita, T.; Fujita, T.; Yamaguchi, K.; Oda, T. Purification and characterization of photosensitizing hemolytic toxin from harmful red tide phytoplankton, Heterocapsa circularisquama. Aquat. Toxicol. 2005, 73, 382–393. [Google Scholar] [CrossRef] [PubMed]
- Yang, Y.; Huang, B.; Tang, Y.; Xu, N. Allelopathic effects of mixotrophic dinoflagellate Akashiwo sanguinea on co-occurring phytoplankton: The significance of nutritional ecology. J. Oceanol. Limnol. 2021, 39, 903–917. [Google Scholar]
- Lo, P.-C.; Leng, X.; Ng, D.K. Hetero-arrays of porphyrins and phthalocyanines. Coord. Chem. Rev. 2007, 251, 2334–2353. [Google Scholar]
- Songaila, E.; Augulis, R.n.; Gelzinis, A.; Butkus, V.; Gall, A.; Büchel, C.; Robert, B.; Zigmantas, D.; Abramavicius, D.; Valkunas, L. Ultrafast energy transfer from chlorophyll c 2 to chlorophyll a in fucoxanthin–chlorophyll protein complex. J. Phys. Chem. Lett. 2013, 4, 3590–3595. [Google Scholar]
- Wright, S.; Jeffrey, S.; Mantoura, R. Phytoplankton Pigments in Oceanography: Guidelines to Modern Methods; Unesco Pub.: Paris, France, 2005. [Google Scholar]
- Jeffrey, S.; Wright, S.W. A new spectrally distinct component in preparations of chlorophyll c from the micro-alga Emiliania huxleyi (Prymnesiophycease). Biochim. Biophys. Acta (BBA)-Bioenerg. 1987, 894, 180–188. [Google Scholar]
- Taniguchi, M.; Lindsey, J.S. Absorption and fluorescence spectral database of chlorophylls and analogues. Photochem. Photobiol. 2021, 97, 136–165. [Google Scholar] [CrossRef]
- Foote, C.S. Mechanisms of photosensitized oxidation: There are several different types of photosensitized oxidation which may be important in biological systems. Science 1968, 162, 963–970. [Google Scholar]
- Wilson, B.C. Photodynamic therapy for cancer: Principles. Can. J. Gastroenterol. 2002, 16, 393–400. [Google Scholar]
- Muniyandi, K.; George, B.; Parimelazhagan, T.; Abrahamse, H. Role of photoactive phytocompounds in photodynamic therapy of cancer. Molecules 2020, 25, 4102. [Google Scholar] [CrossRef]
- Tang, Y.Z.; Gobler, C.J. Characterization of the toxicity of Cochlodinium polykrikoides isolates from Northeast US estuaries to finfish and shellfish. Harmful Algae 2009, 8, 454–462. [Google Scholar] [CrossRef]
- Tang, Y.Z.; Kong, L.; Holmes, M.J. Dinoflagellate Alexandrium leei (Dinophyceae) from Singapore coastal waters produces a water-soluble ichthyotoxin. Mar. Biol. 2007, 150, 541–549. [Google Scholar] [CrossRef]
- James, S.V.; Valenti, T.W., Jr.; Prosser, K.N.; Grover, J.P.; Roelke, D.L.; Brooks, B.W. Sunlight amelioration of Prymnesium parvum acute toxicity to fish. J. Plankton Res. 2011, 33, 265–272. [Google Scholar] [CrossRef]
- Büchel, C. Light harvesting complexes in chlorophyll c-containing algae. Biochim. Biophys. Acta Bioenerg. 2020, 1861, 148027. [Google Scholar] [CrossRef] [PubMed]
- Cabral, B.J.; Coutinho, K.; Canuto, S. Born-Oppenheimer molecular dynamics and electronic properties of chlorophyll-c(2) in liquid methanol. J. Chem. Phys. 2013, 138, 225102. [Google Scholar] [CrossRef]
- Sato, Y.; Oda, T.; Muramatsu, T.; Matsuyama, Y.; Honjo, T. Photosensitizing hemolytic toxin in Heterocapsa circularisquama, a newly identified harmful red tide dinoflagellate. Aquat. Toxicol. 2002, 56, 191–196. [Google Scholar] [CrossRef]
- Kim, D.; Miyazaki, Y.; Nakashima, T.; Iwashita, T.; Fujita, T.; Yamaguchi, K.; Choi, K.S.; Oda, T. Cytotoxic action mode of a novel porphyrin derivative isolated from harmful red tide dinoflagellate Heterocapsa circularisquama. J. Biochem. Mol. Toxicol. 2008, 22, 158–165. [Google Scholar] [CrossRef]
- Wu, N.; Tong, M.; Gou, S.; Zeng, W.; Xu, Z.; Jiang, T. Hemolytic Activity in Relation to the Photosynthetic System in Chattonella marina and Chattonella ovata. Mar. Drugs 2021, 19, 336. [Google Scholar] [CrossRef] [PubMed]
- Paasche, E. Marine plankton algae grown with light-dark cycles. I. Coccolithus huxleyi. Physiol. Plant. 1967, 20, 946–956. [Google Scholar] [CrossRef]
- Phung, T.-H.; Jung, H.-I.; Park, J.-H.; Kim, J.-G.; Back, K.; Jung, S. Porphyrin biosynthesis control under water stress: Sustained porphyrin status correlates with drought tolerance in transgenic rice. Plant Physiol. 2011, 157, 1746–1764. [Google Scholar] [CrossRef]
- Adolf, J.E.; Yeager, C.L.; Miller, W.D.; Mallonee, M.E.; Harding, L.W., Jr. Environmental forcing of phytoplankton floral composition, biomass, and primary productivity in Chesapeake Bay, USA. Estuar. Coast. Shelf Sci. 2006, 67, 108–122. [Google Scholar] [CrossRef]
- Skovgaard, A.; Hansen, P.J. Food uptake in the harmful alga Prymnesium parvum mediated by excreted toxins. Limnol. Oceanogr. 2003, 48, 1161–1166. [Google Scholar] [CrossRef]
- Sheng, J.; Malkiel, E.; Katz, J.; Adolf, J.E.; Place, A.R. A dinoflagellate exploits toxins to immobilize prey prior to ingestion. Proc. Natl. Acad. Sci. USA 2010, 107, 2082–2087. [Google Scholar] [CrossRef] [PubMed]
- Yang, L.; Liu, L.; Xu, D.; Li, D.; Liu, R.; Liang, Y. Progress of the studies on hemolytic toxin structure in marine algae. Mar. Environ. Sci. 2016, 35, 628–634. [Google Scholar] [CrossRef]
- Wu, X.; Yang, Y.; Xie, S.; Zhong, P.; Xu, N. Grazing rate of the mixotrophic dinoflagellate Akashiwo sanguinea is associated with hemolytic activity under varying irradiance and nutrient levels. Sci. Total Environ. 2025, 967, 178835. [Google Scholar] [PubMed]
- Guillard, R.R.L. Culture of Phytoplankton for Feeding Marine Invertebrates. In Culture of Marine Invertebrate Animals: Proceedings—1st Conference on Culture of Marine Invertebrate Animals Greenport; Smith, W.L., Chanley, M.H., Eds.; Springer: Boston, MA, USA, 1975; pp. 29–60. [Google Scholar] [CrossRef]
- Ou, G.; Wang, H.; Si, R.; Guan, W. The dinoflagellate Akashiwo sanguinea will benefit from future climate change: The interactive effects of ocean acidification, warming and high irradiance on photophysiology and hemolytic activity. Harmful Algae 2017, 68, 118–127. [Google Scholar] [CrossRef]
- Eschbach, E.; Scharsack, J.P.; John, U.; Medlin, L.K. Improved erythrocyte lysis assay in microtitre plates for sensitive detection and efficient measurement of haemolytic compounds from ichthyotoxic algae. J. Appl. Toxicol. Int. J. 2001, 21, 513–519. [Google Scholar] [CrossRef]


Disclaimer/Publisher’s Note: The statements, opinions and data contained in all publications are solely those of the individual author(s) and contributor(s) and not of MDPI and/or the editor(s). MDPI and/or the editor(s) disclaim responsibility for any injury to people or property resulting from any ideas, methods, instructions or products referred to in the content. |
© 2025 by the authors. Licensee MDPI, Basel, Switzerland. This article is an open access article distributed under the terms and conditions of the Creative Commons Attribution (CC BY) license (https://creativecommons.org/licenses/by/4.0/).
Share and Cite
Pan, J.; Fang, T.; Xie, S.; Xu, N.; Zhong, P. Isolation and Characterization of Photosensitive Hemolytic Toxins from the Mixotrophic Dinoflagellate Akashiwo sanguinea. Mar. Drugs 2025, 23, 153. https://doi.org/10.3390/md23040153
Pan J, Fang T, Xie S, Xu N, Zhong P. Isolation and Characterization of Photosensitive Hemolytic Toxins from the Mixotrophic Dinoflagellate Akashiwo sanguinea. Marine Drugs. 2025; 23(4):153. https://doi.org/10.3390/md23040153
Chicago/Turabian StylePan, Jiling, Ting Fang, Shuang Xie, Ning Xu, and Ping Zhong. 2025. "Isolation and Characterization of Photosensitive Hemolytic Toxins from the Mixotrophic Dinoflagellate Akashiwo sanguinea" Marine Drugs 23, no. 4: 153. https://doi.org/10.3390/md23040153
APA StylePan, J., Fang, T., Xie, S., Xu, N., & Zhong, P. (2025). Isolation and Characterization of Photosensitive Hemolytic Toxins from the Mixotrophic Dinoflagellate Akashiwo sanguinea. Marine Drugs, 23(4), 153. https://doi.org/10.3390/md23040153