
High-Yield Preparation of American Oyster Defensin (AOD) via a Small and Acidic Fusion Tag and Its Functional Characterization


 and
and 
Abstract
:1. Introduction
2. Results
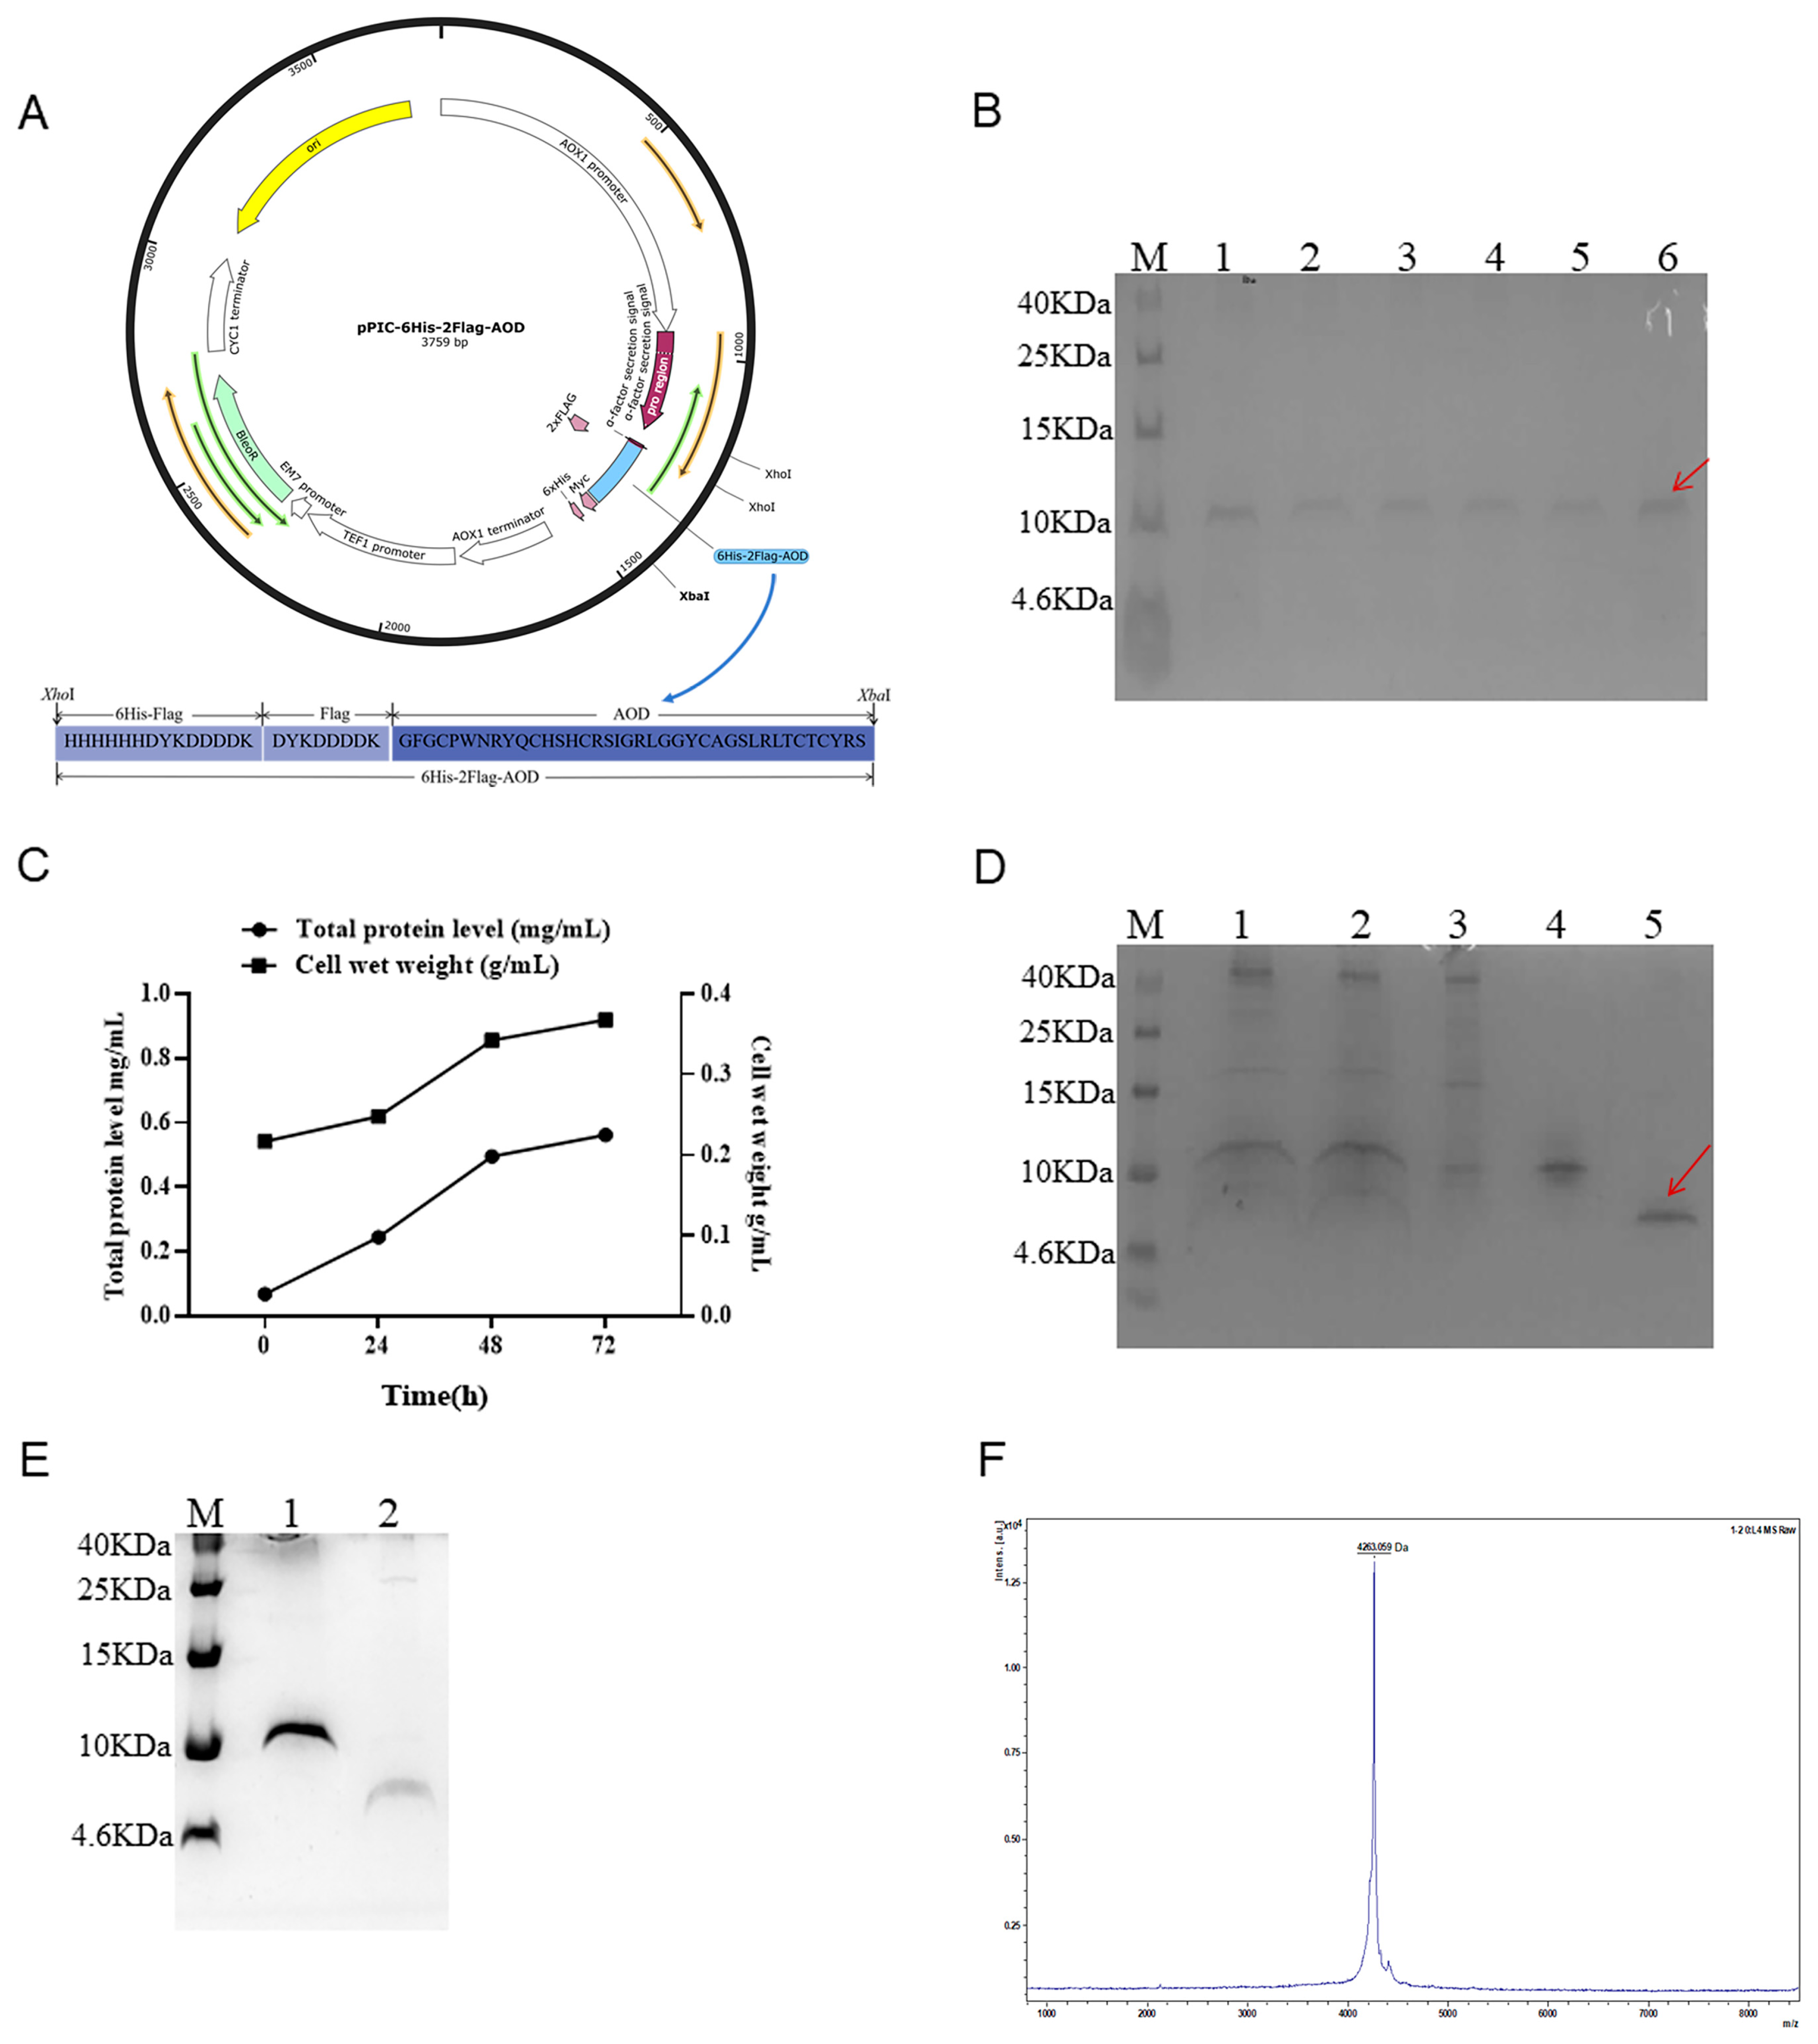
2.1. Construction of the Recombinant Plasmids
2.2. Expression of 6His-2Flag-AOD at Shaker and Fermenter Level with High Level
2.3. Purification, Cleavage, and Identification
2.4. AOD Had High Antibacterial Activity
2.5. AOD Eradicated S. epidermidis Thoroughly
2.6. AOD Showed Low Hemolytic Activity and Cytotoxicity
2.7. AOD Exhibited High Stability
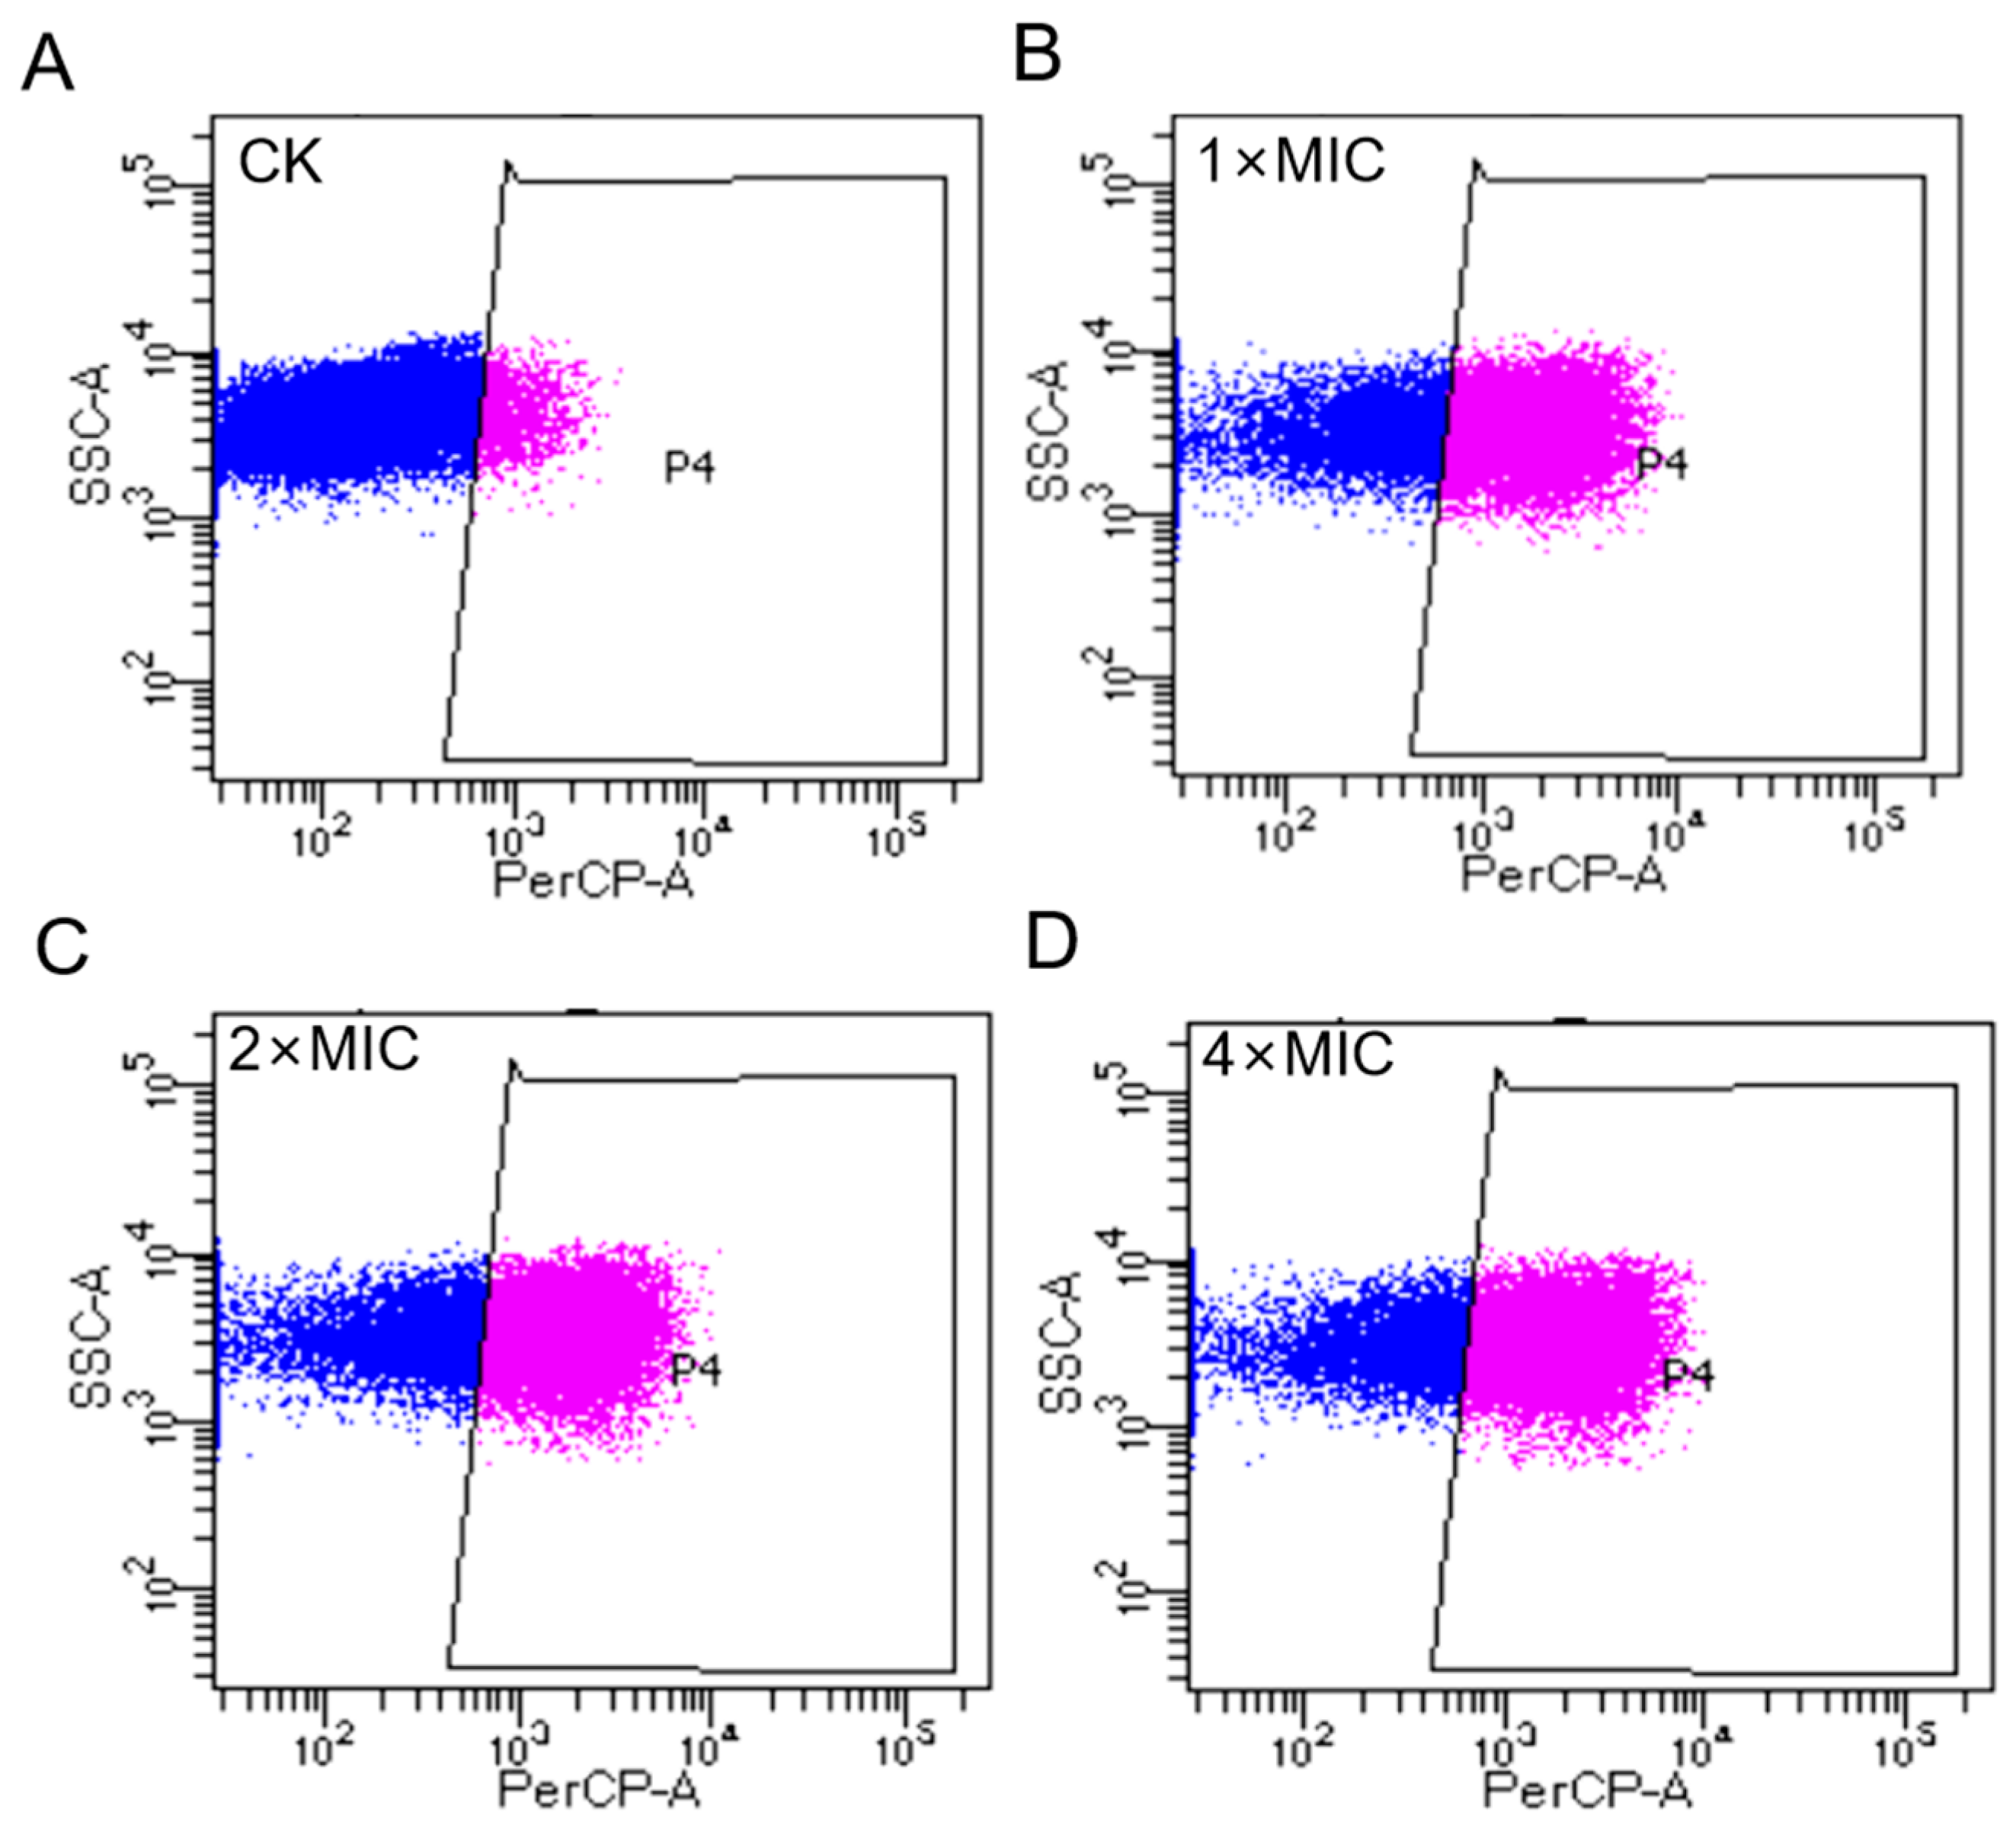
2.8. AOD Disrupted the Bacterial Membrane Integrity of S. epidermidis (Flow Cytometry)
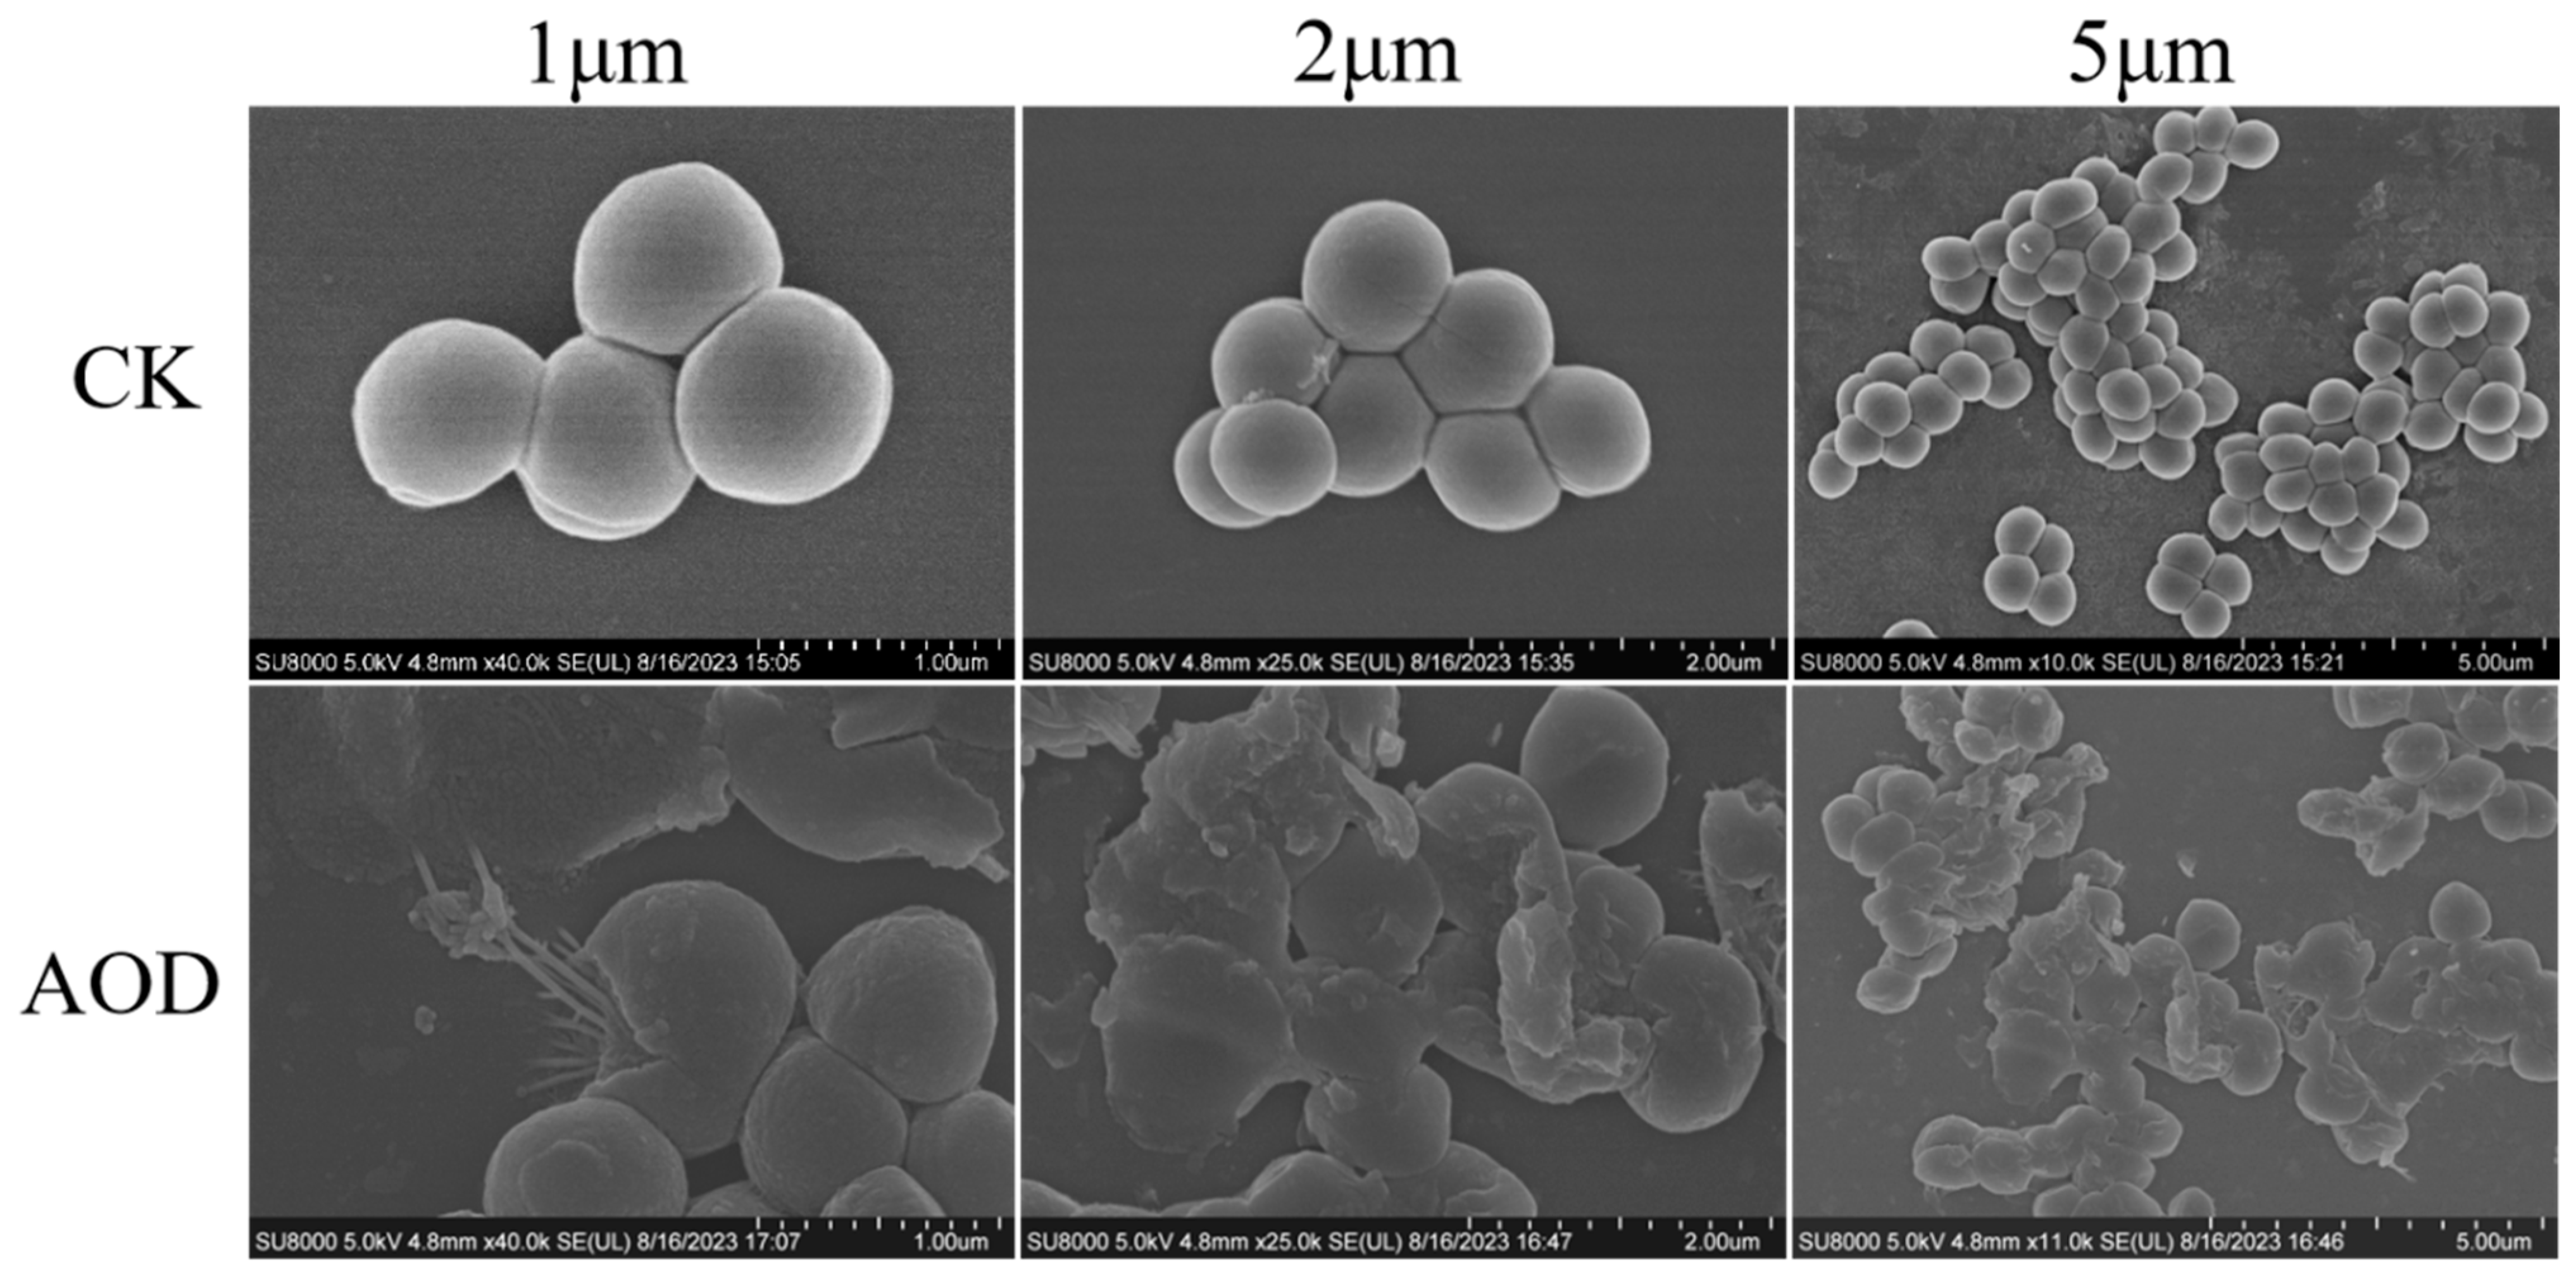
2.9. AOD Disrupted the Bacterial Membrane Integrity of S. epidermidis (SEM and TEM)
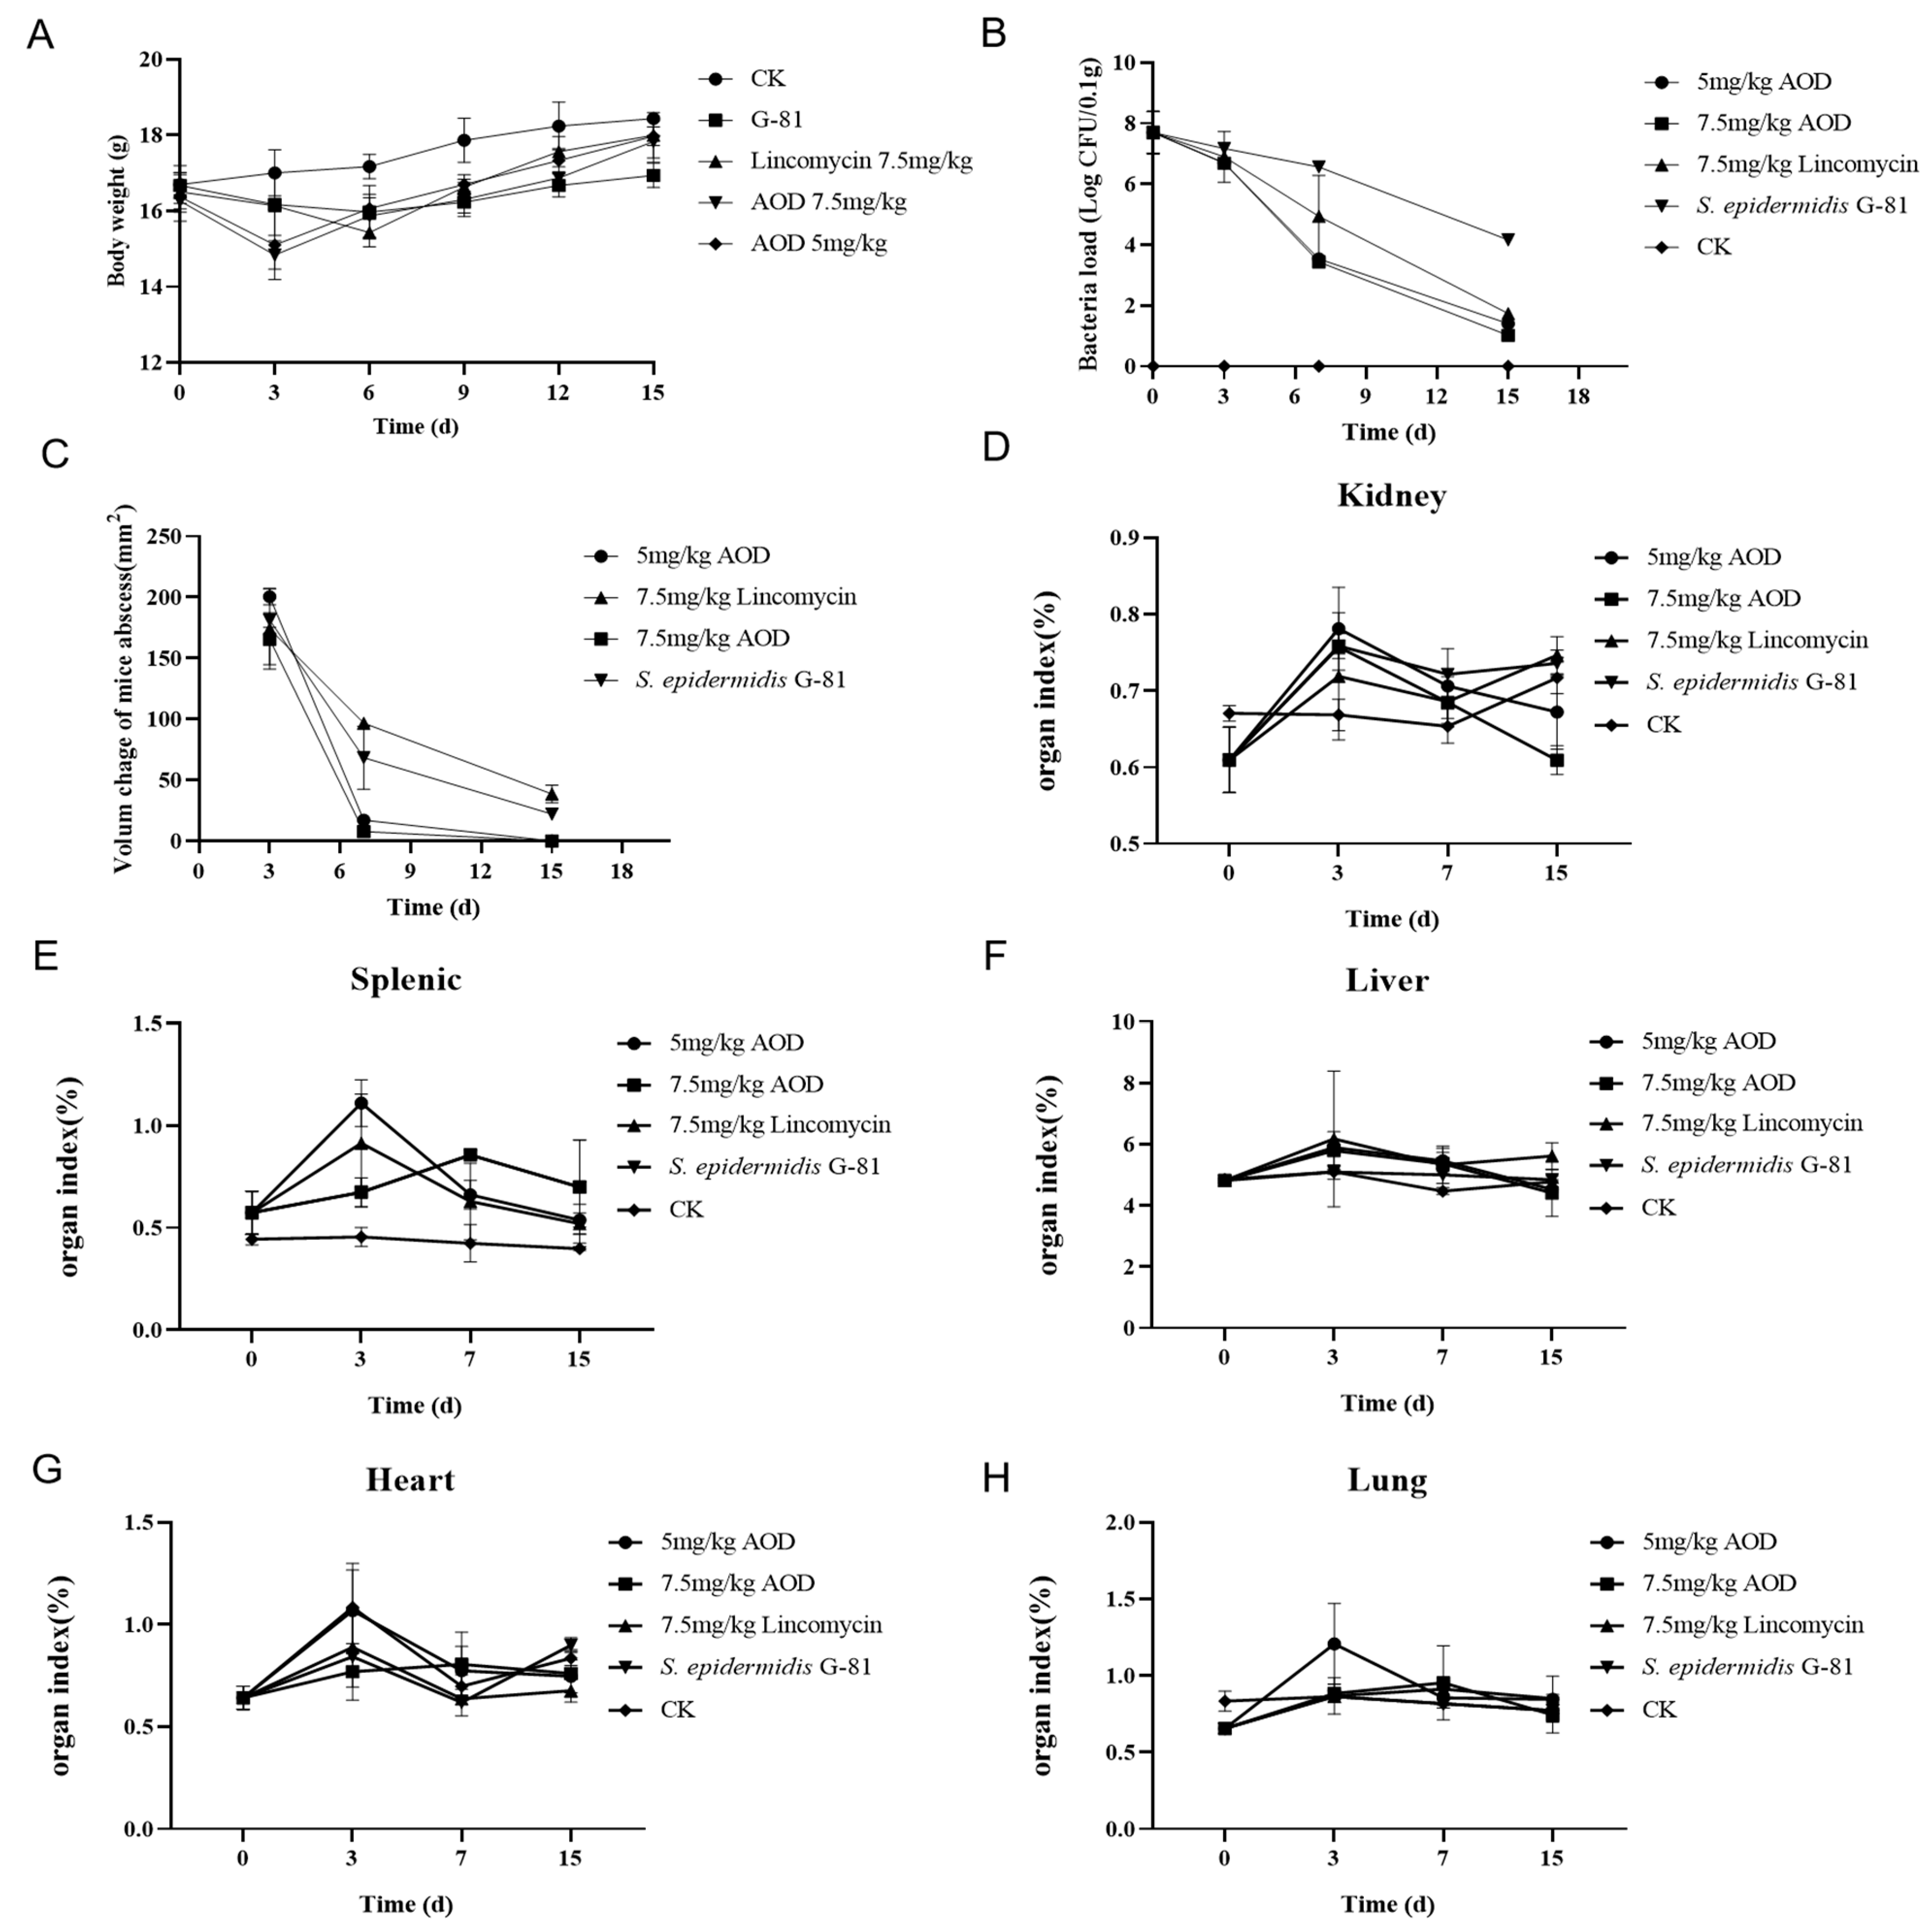
2.10. AOD Showed Protective Effect in the Murine Abscess Model for S. epidermidis Infection
3. Discussion
4. Materials and Methods
4.1. Strains, Plasmids, Reagents, Cell Line, and Animals
4.2. Expression, Purification, Cleavage, and Identification of AOD
4.2.1. Construction of the Recombinant Plasmids
4.2.2. Expression of 6His-2Flag-AOD at the Shaking Flask and Fermenter Level
4.2.3. Purification, Identification, and Cleavage of 6His-2Flag-AOD
4.3. Physical and Chemical Properties
4.3.1. Minimal Inhibitory Concentrations
4.3.2. Bactericidal Effect of AOD on S. epidermidis G-81 In Vitro
4.3.3. Cytotoxicity, Hemolysis, and Stability of AOD
Hemolysis
Temperature, pH, Ion, and Protease Stability
Cytotoxicity
4.4. In Vitro Antibacterial Mechanism of AOD
4.4.1. Membrane Permeabilization Analysis by Flow Cytometer
4.4.2. Scanning Electron Microscopy Observations
4.4.3. Transmission Electron Microscopy Observations
4.5. Efficacy of AOD against S. epidermidis G-81 In Vivo
5. Conclusions
Author Contributions
Funding
Institutional Review Board Statement
Data Availability Statement
Conflicts of Interest
References
- Mwangi, J.; Hao, X.; Lai, R.; Zhang, Z.Y. Antimicrobial Peptides: New Hope in the War against Multidrug Resistance. Zool. Res. 2019, 40, 488. [Google Scholar] [CrossRef] [PubMed]
- Figueroa, D.; Perez, C.; Elmore, D.E. The Role of Arginine and Lysine in Histone Derived Antimicrobial Peptides. Biophys. J. 2016, 110, 416a. [Google Scholar] [CrossRef]
- Lazzaro, B.P.; Zasloff, M.; Rolff, J. Antimicrobial Peptides: Application Informed by Evolution. Science 2020, 368, e5480. [Google Scholar] [CrossRef] [PubMed]
- Pen, G.; Yang, N.; Teng, D.; Mao, R.; Hao, Y.; Wang, J. A Review on the Use of Antimicrobial Peptides to Combat Porcine Viruses. Antibiotics 2020, 9, 801. [Google Scholar] [CrossRef] [PubMed]
- Coleman, P.C.; Bale, J.S.; Hayward, S.A. Meat Feeding Restricts Rapid Cold Hardening Response and Increases Thermal Activity Thresholds of Adult Blow Flies, Calliphora vicina (Diptera: Calliphoridae). PLoS ONE 2015, 10, e0131301. [Google Scholar] [CrossRef] [PubMed]
- Seo, J.-K.; Crawford, J.M.; Stone, K.L.; Noga, E.J. Purification of a Novel Arthropod Defensin from the American Oyster, Crassostrea virginica. Biochem. Biophys. Res. Commun. 2005, 338, 1998–2004. [Google Scholar] [CrossRef] [PubMed]
- Seo, J.-K.; Kim, D.-G.; Lee, J.-E.; Park, K.-S.; Lee, I.-A.; Lee, K.-Y.; Kim, Y.-O.; Nam, B.-H. Antimicrobial Activity and Action Mechanisms of Arg-Rich Short Analog Peptides Designed from the C-terminal Loop Region of American Oyster Defensin (AOD). Mar. Drugs 2021, 19, 451. [Google Scholar] [CrossRef]
- Einhauer, A.; Jungbauer, A. The FLAG™ peptide, a Versatile Fusion Tag for the Purification of Recombinant Proteins. J. Biochem. Biophys. Methods 2001, 49, 455–465. [Google Scholar] [CrossRef]
- Hochuli, E.; Döbeli, H.; Schacher, A. New Metal Chelate Adsorbent Selective for Proteins and Peptides Containing Neighbouring Histidine Residues. J. Chromatogr. A 1987, 411, 177–184. [Google Scholar] [CrossRef]
- Kim, D.S.; Kim, S.W.; Song, J.M.; Kim, S.Y.; Kwon, K.-C. A New Prokaryotic Expression Vector for the Expression of Antimicrobial Peptide Abaecin Using SUMO Fusion Tag. BMC Biotechnol. 2019, 19, 13. [Google Scholar] [CrossRef]
- Hopp, T.P.; Prickett, K.S.; Price, V.L.; Libby, R.T.; March, C.J.; Cerretti, D.P.; Urdal, D.L.; Conlon, P.J. A Short Polypeptide Marker Sequence Useful for Recombinant Protein Identification and Purification. Biol. Technol. 1988, 6, 1204–1210. [Google Scholar] [CrossRef]
- Maroux, S.; Baratti, J.; Desnuelle, P. Purification and Specificity of Porcine Enterokinase. J. Biol. Chem. 1971, 246, 5031–5039. [Google Scholar] [CrossRef] [PubMed]
- Zhang, Y.; Serratore, N.D.; Briggs, S.D. N-ICE Plasmids for Generating N-terminal 3× FLAG Tagged Genes that Allow Inducible, Constitutive or Endogenous Expression in Saccharomyces cerevisiae. Yeast 2017, 34, 223–235. [Google Scholar] [CrossRef] [PubMed]
- Rogers, K.L.; Fey, P.D.; Rupp, M.E. Coagulase-negative Staphylococcal Infections. Infect. Dis. Clin. N. Am. 2009, 23, 73–98. [Google Scholar] [CrossRef] [PubMed]
- Ardon, C.B.; Prens, E.; Fuursted, K.; Ejaz, R.; Shailes, J.; Jenssen, H.; Jemec, G.B. Biofilm Production and Antibiotic Susceptibility of Staphylococcus epidermidis strains from Hidradenitis Suppurativa lesions. J. Eur. Acad. Dermatol. Venereol. 2019, 33, 170–177. [Google Scholar] [CrossRef] [PubMed]
- Melicherová, K.; Krahulec, J.; Šafránek, M.; Lišková, V.; Hopková, D.; Széliová, D.; Turňa, J. Optimization of the Fermentation and Downstream Processes for Human Enterokinase Production in Pichia pastoris. Appl. Microbiol. Biotechnol. 2017, 101, 1927–1934. [Google Scholar] [CrossRef] [PubMed]
- Cereghino, G.P.L.; Cereghino, J.L.; Ilgen, C.; Cregg, J.M. Production of Recombinant Proteins in Fermenter Cultures of the Yeast Pichia pastoris. Curr. Opin. Biotechnol. 2002, 13, 329–332. [Google Scholar] [CrossRef]
- Yang, N.; Teng, D.; Mao, R.; Hao, Y.; Wang, X.; Wang, Z.; Wang, X.; Wang, J. A Recombinant Fungal Defensin-like Peptide-P2 Combats Multidrug-resistant Staphylococcus aureus and biofilms. Appl. Microbiol. Biotechnol. 2019, 103, 5193–5213. [Google Scholar] [CrossRef]
- Zhang, J.; Yang, Y.; Teng, D.; Tian, Z.; Wang, S.; Wang, J. Expression of Plectasin in Pichia pastoris and Its Characterization as a New Antimicrobial Peptide against Staphyloccocus and Streptococcus. Protein Expr. Purif. 2011, 78, 189–196. [Google Scholar] [CrossRef]
- Andrews, J.M. Determination of Minimum Inhibitory Concentrations. J. Antimicrob. Chemother. 2001, 48 (Suppl. 1), 5–16. [Google Scholar] [CrossRef]
- Hao, Y.; Teng, D.; Mao, R.; Yang, N.; Wang, J. Site Mutation Improves the Expression and Antimicrobial Properties of Fungal Defense. Antibiotics 2023, 12, 1283. [Google Scholar] [CrossRef] [PubMed]
- Shen, W.; Yang, N.; Teng, D.; Hao, Y.; Ma, X.; Mao, R.; Wang, J. Design and High Expression of Non-glycosylated Lysostaphins in Pichia pastoris and their pharmacodynamic study. Front. Microbiol. 2021, 12, 637–662. [Google Scholar] [CrossRef] [PubMed]
- Jin, Y.; Yang, N.; Teng, D.; Hao, Y.; Mao, R.; Wang, J. Molecular Modification of Kex2 P1’Site Enhances Expression and Druggability of Fungal Defensin. Antibiotics 2023, 12, 786. [Google Scholar] [CrossRef] [PubMed]
- Li, S.; Wang, Y.; Xue, Z.; Jia, Y.; Li, R.; He, C.; Chen, H. The Structure-mechanism Relationship and Mode of Actions of Antimicrobial Peptides: A Review. Trends Food Sci. Technol. 2021, 109, 103–115. [Google Scholar] [CrossRef]
- Ambrosio, R.L.; Rosselló, C.A.; Casares, D.; Palmieri, G.; Anastasio, A.; Escribá, P.V. The Antimicrobial Peptide 1018-K6 Interacts Distinctly with Eukaryotic and Bacterial Membranes, the Basis of Its Specificity and Bactericidal Activity. Int. J. Mol. Sci. 2022, 23, 12392. [Google Scholar] [CrossRef] [PubMed]
- Kwakman, P.H.; te Velde, A.A.; Vandenbroucke-Grauls, C.M.; Van Deventer, S.J.; Zaat, S.A. Treatment and Prevention of Staphylococcus epidermidis Experimental Biomaterial-associated Infection by Bactericidal Peptide 2. Antimicrob. Agents Chemother. 2006, 50, 3977–3983. [Google Scholar] [CrossRef]
- Ma, X.; Yang, N.; Mao, R.; Hao, Y.; Yan, X.; Teng, D.; Wang, J. The Pharmacodynamics Study of Insect Defensin DLP4 against Toxigenic Staphylococcus hyicus ACCC 61734 in Vitro and Vivo. Front. Cell Infect. Microbiol. 2021, 11, 638598. [Google Scholar] [CrossRef]
- Liu, H.; Yang, N.; Mao, R.; Teng, D.; Hao, Y.; Wang, X.; Wang, J. A New High-yielding Antimicrobial Peptide NZX and Its Antibacterial Activity against Staphylococcus hyicus in Vitro/Vivo. Appl. Microbiol. Biotechnol. 2020, 104, 1555–1568. [Google Scholar] [CrossRef]
- Zhang, Y.; Teng, D.; Wang, X.; Mao, R.; Cao, X.; Hu, X.; Zong, L.; Wang, J. In Vitro and in Vivo Characterization of a New Recombinant Antimicrobial Peptide, MP1102, against Methicillin-resistant Staphylococcus aureus. Appl. Microbiol. Biotechnol. 2015, 99, 6255–6266. [Google Scholar] [CrossRef]
- Wiegand, I.; Hilpert, K.; Hancock, R.E. Agar and Broth Dilution Methods to Determine the Minimal Inhibitory Concentration (MIC) of Antimicrobial Substances. Nat. Protoc. 2008, 3, 163–175. [Google Scholar] [CrossRef]
- Flamm, R.K.; Rhomberg, P.R.; Lindley, J.M.; Sweeney, K.; Ellis-Grosse, E.J.; Shortridge, D. Evaluation of the Bactericidal Activity of Fosfomycin in Combination with Selected Antimicrobial Comparison Agents Tested against Gram-Negative Bacterial Strains by Using Time-Kill Curves. Antimicrob. Agents Chemother. 2019, 63, 10–1128. [Google Scholar] [CrossRef] [PubMed]
- Yang, N.; Liu, X.; Teng, D.; Li, Z.; Wang, X.; Mao, R.; Wang, X.; Hao, Y.; Wang, J. Antibacterial and Detoxifying Activity of NZ17074 Analogues with Multi-layers of Selective Antimicrobial Actions against Escherichia coli and Salmonella enteritidis. Sci. Rep. 2017, 7, 3392. [Google Scholar] [CrossRef] [PubMed]
- Wang, X.; Teng, D.; Mao, R.; Yang, N.; Hao, Y.; Wang, J. Combined Systems Approaches Reveal a Multistage Mode of Action of a Marine Antimicrobial Peptide against Pathogenic Escherichia coli and its Protective Effect against Bacterial Peritonitis and Endotoxemia. Antimicrob. Agents Chemother. 2017, 61, e01056-16. [Google Scholar] [CrossRef] [PubMed]
- Stearns-Kurosawa, D.J.; Osuchowski, M.F.; Valentine, C.; Kurosawa, S.; Remick, D.G. The Pathogenesis of Sepsis. Annu. Rev. Pathol. 2011, 6, 19–48. [Google Scholar] [CrossRef]
- Horst, S.A.; Hoerr, V.; Beineke, A.; Kreis, C.; Tuchscherr, L.; Kalinka, J.; Lehne, S.; Schleicher, I.; Köhler, G.; Fuchs, T. A Novel Mouse Model of Staphylococcus aureus Chronic Osteomyelitis that Closely Mimics the Human Infection: An Integrated View of Disease Pathogenesis. Am. J. Pathol. 2012, 181, 1206–1214. [Google Scholar] [CrossRef]
- Lei, Z.; Zhang, D.; Lu, B.; Zhou, W.; Wang, D. Activation of Mast Cells in Skin Abscess Induced by Staphylococcus aureus (S. aureus) Infection in Mice. Res. Vet. Sci. 2018, 118, 66–71. [Google Scholar] [CrossRef]
- Chen, C.; Hooper, D.C. Effect of Staphylococcus aureus Tet38 Native Efflux Pump on in Vivo Response to Tetracycline in a Murine Subcutaneous Abscess Model. J. Antimicrob. Chemother. 2018, 73, 720–723. [Google Scholar] [CrossRef]


| Strains | MIC (μg/mL) | |
|---|---|---|
| AOD | Lincomycin | |
| S. aureus ATCC 43300 | 8 | >64 |
| S. aureus ATCC 25923 | 16 | 1 |
| S. aureus E48 | 8 | 1 |
| S. pseudintermedius A2101 | 8 | 32 |
| S. agalactiae ATCC 13813 | 4 | - |
| S. hyicus NCTC 10350 | 16 | 32 |
| S. epidermidis ATCC 35984 | 4 | - |
| S. epidermidis ATCC 12228 | 4 | 4 |
| S. epidermidis G-81 | 4 | 4 |
| E. coli ATCC 25922 | >64 | 2 |
| Salmonella typhimurium CVCC 14028 | >64 | - |
| Shigella flexneri CMCC 51571 | >64 | - |
Disclaimer/Publisher’s Note: The statements, opinions and data contained in all publications are solely those of the individual author(s) and contributor(s) and not of MDPI and/or the editor(s). MDPI and/or the editor(s) disclaim responsibility for any injury to people or property resulting from any ideas, methods, instructions or products referred to in the content. |
© 2023 by the authors. Licensee MDPI, Basel, Switzerland. This article is an open access article distributed under the terms and conditions of the Creative Commons Attribution (CC BY) license (https://creativecommons.org/licenses/by/4.0/).
Share and Cite
Zhao, Q.; Yang, N.; Gu, X.; Li, Y.; Teng, D.; Hao, Y.; Lu, H.; Mao, R.; Wang, J. High-Yield Preparation of American Oyster Defensin (AOD) via a Small and Acidic Fusion Tag and Its Functional Characterization. Mar. Drugs 2024, 22, 8. https://doi.org/10.3390/md22010008
Zhao Q, Yang N, Gu X, Li Y, Teng D, Hao Y, Lu H, Mao R, Wang J. High-Yield Preparation of American Oyster Defensin (AOD) via a Small and Acidic Fusion Tag and Its Functional Characterization. Marine Drugs. 2024; 22(1):8. https://doi.org/10.3390/md22010008
Chicago/Turabian StyleZhao, Qingyi, Na Yang, Xinxi Gu, Yuanyuan Li, Da Teng, Ya Hao, Haiqiang Lu, Ruoyu Mao, and Jianhua Wang. 2024. "High-Yield Preparation of American Oyster Defensin (AOD) via a Small and Acidic Fusion Tag and Its Functional Characterization" Marine Drugs 22, no. 1: 8. https://doi.org/10.3390/md22010008
APA StyleZhao, Q., Yang, N., Gu, X., Li, Y., Teng, D., Hao, Y., Lu, H., Mao, R., & Wang, J. (2024). High-Yield Preparation of American Oyster Defensin (AOD) via a Small and Acidic Fusion Tag and Its Functional Characterization. Marine Drugs, 22(1), 8. https://doi.org/10.3390/md22010008