
Adsorption of Cationic Dyes on a Magnetic 3D Spongin Scaffold with Nano-Sized Fe3O4 Cores

 ,
, 
Abstract
:1. Introduction
2. Results
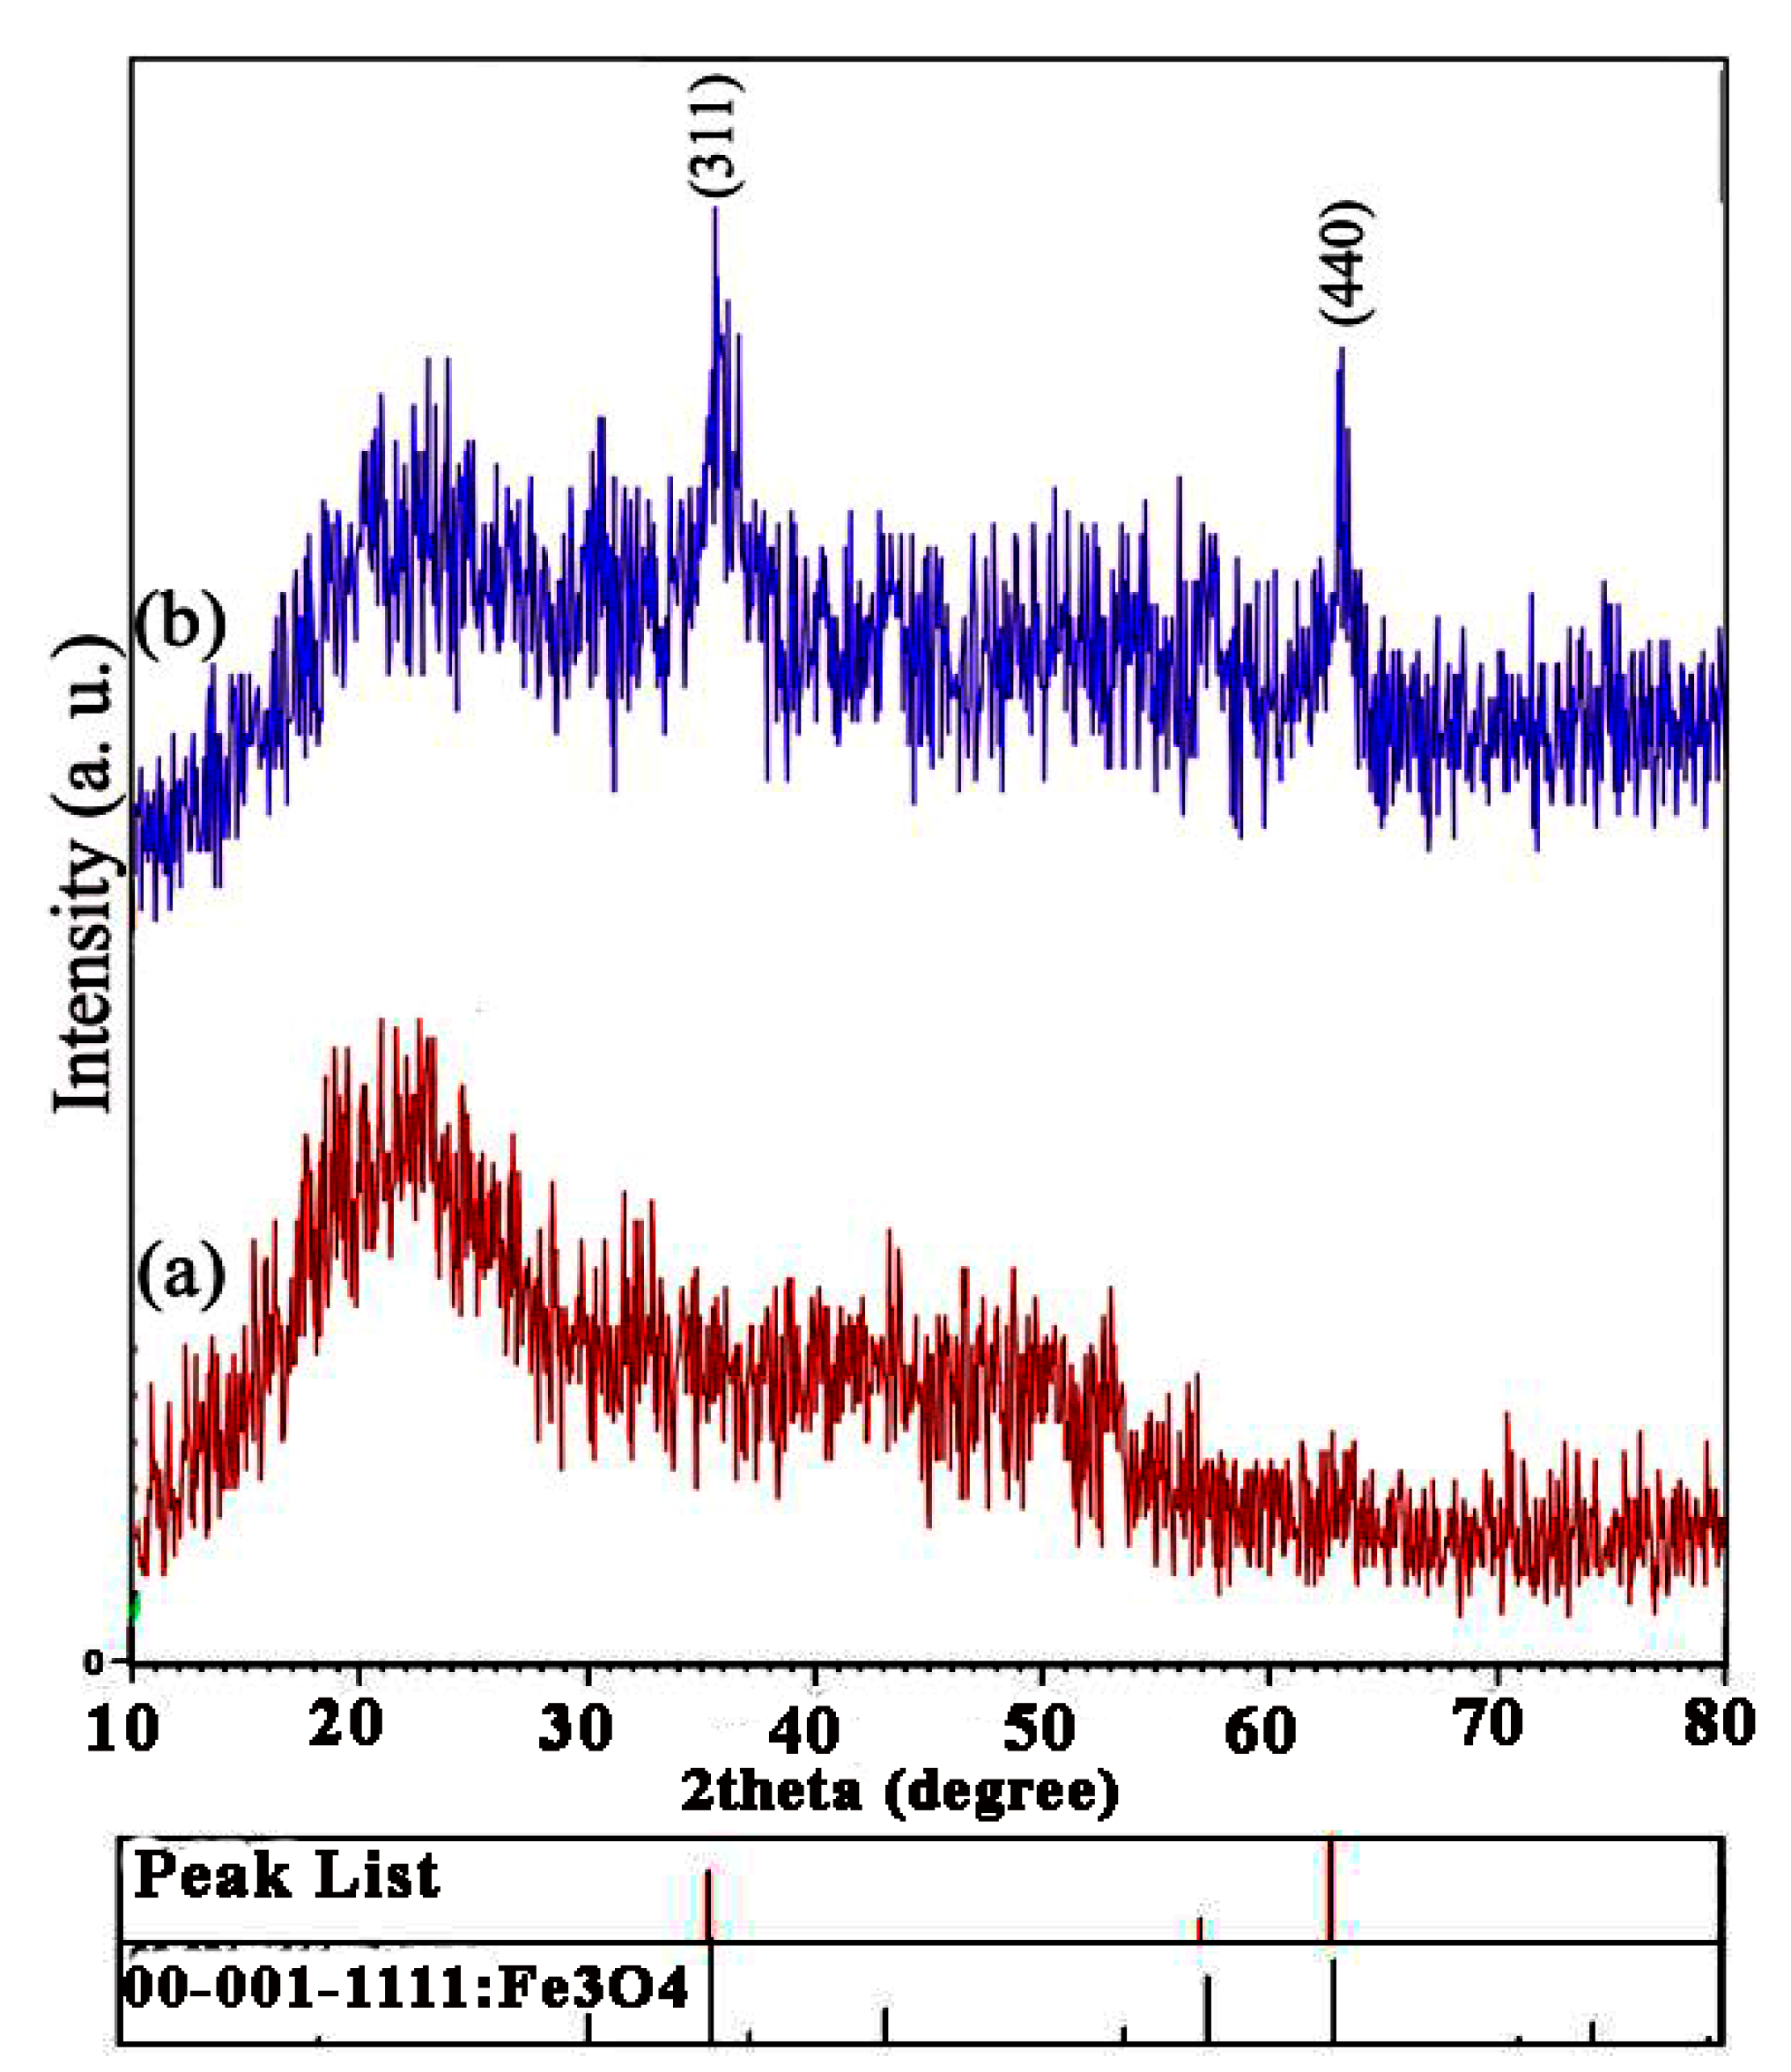
2.1. XRD Patterns
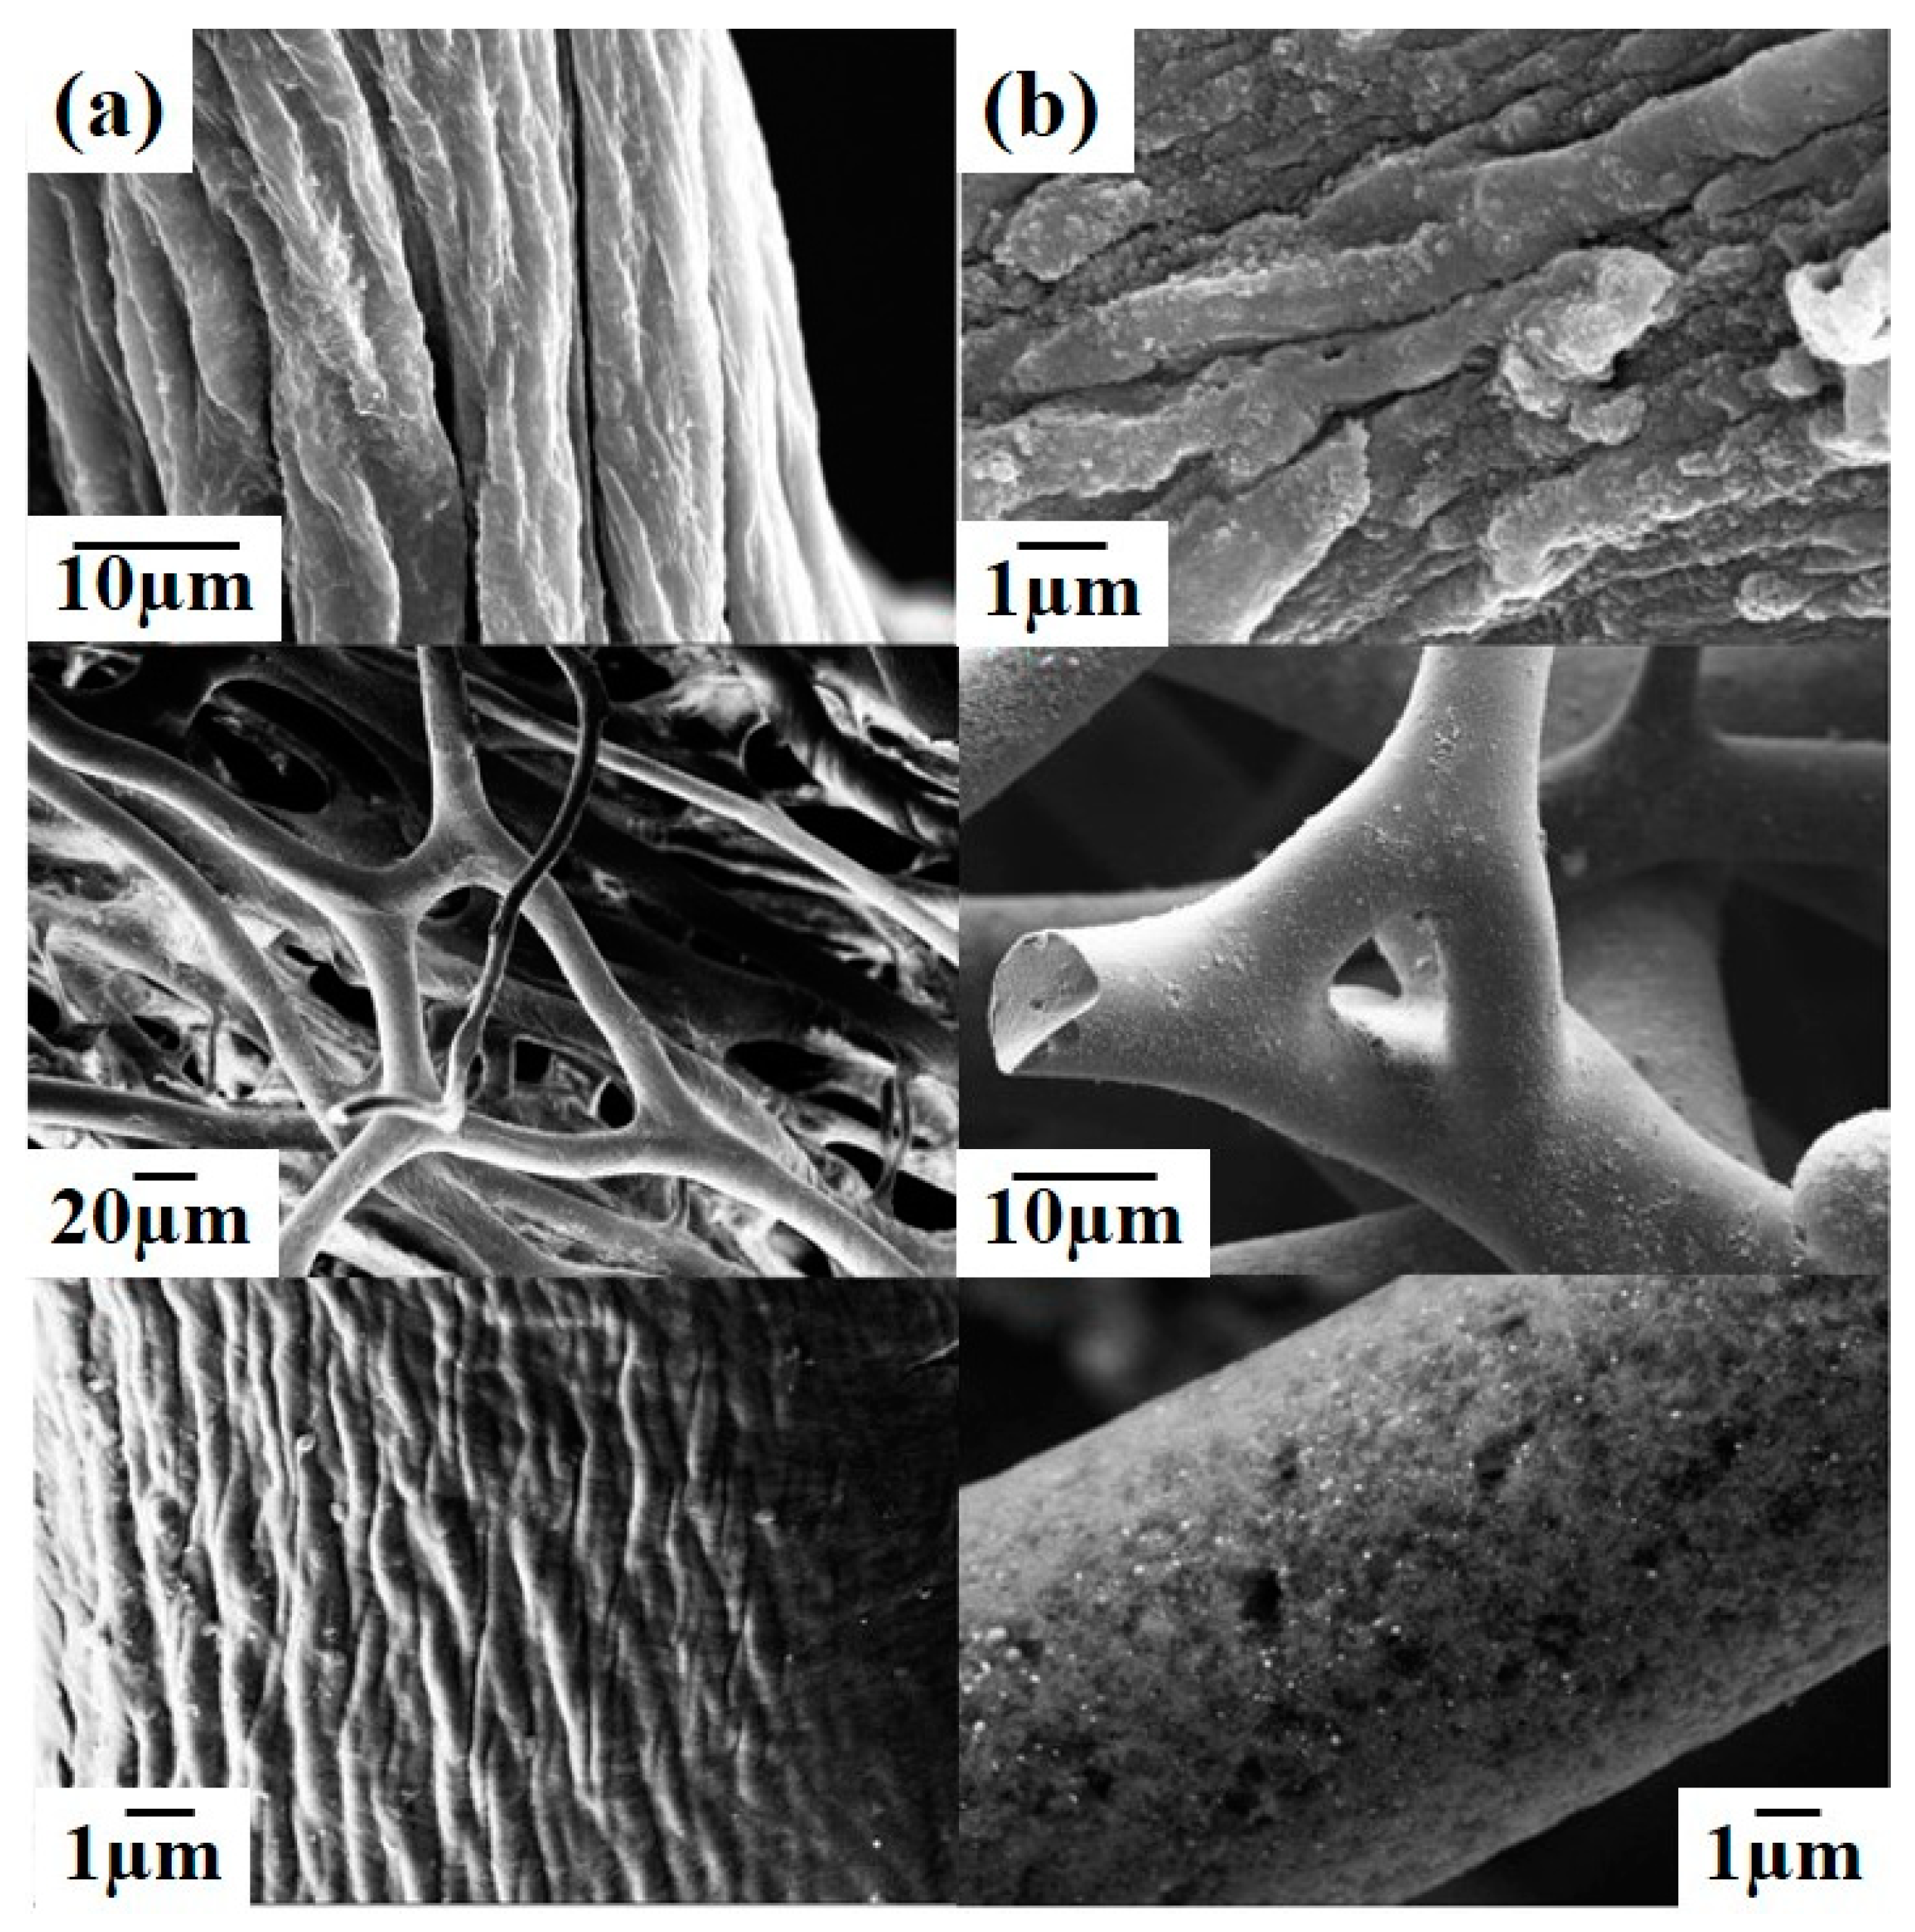
2.2. FESEM Images
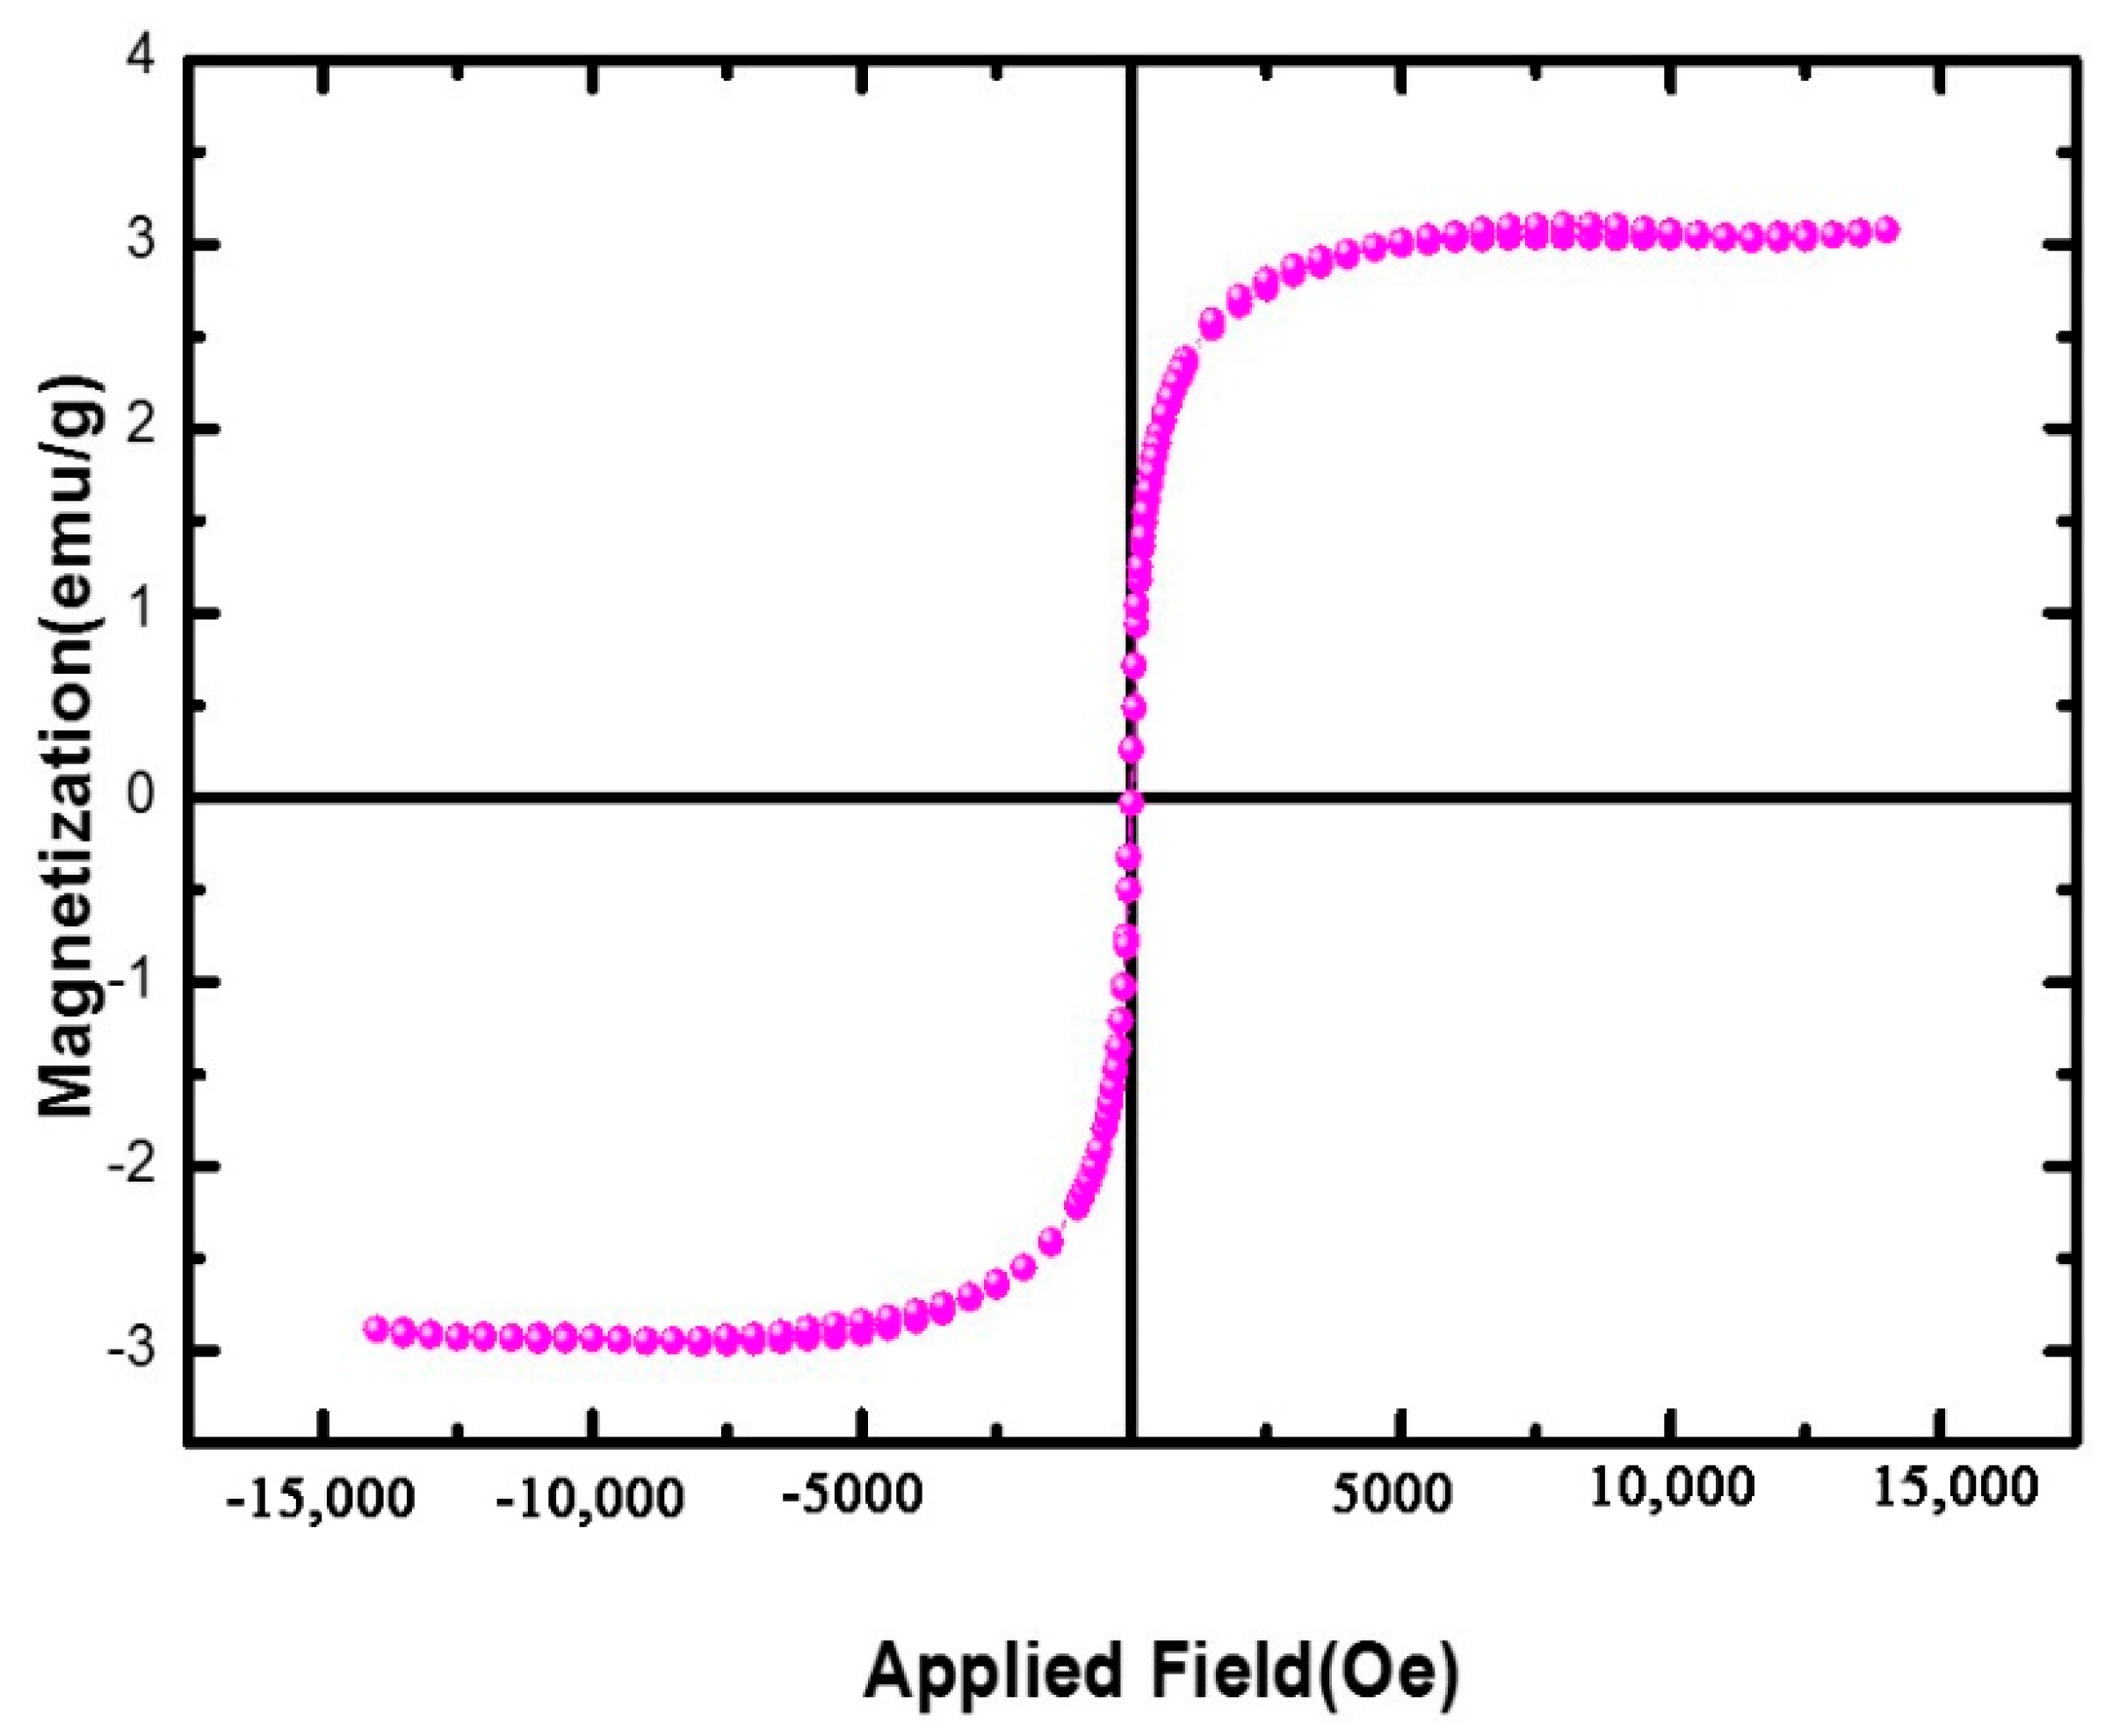
2.3. VSM Patterns
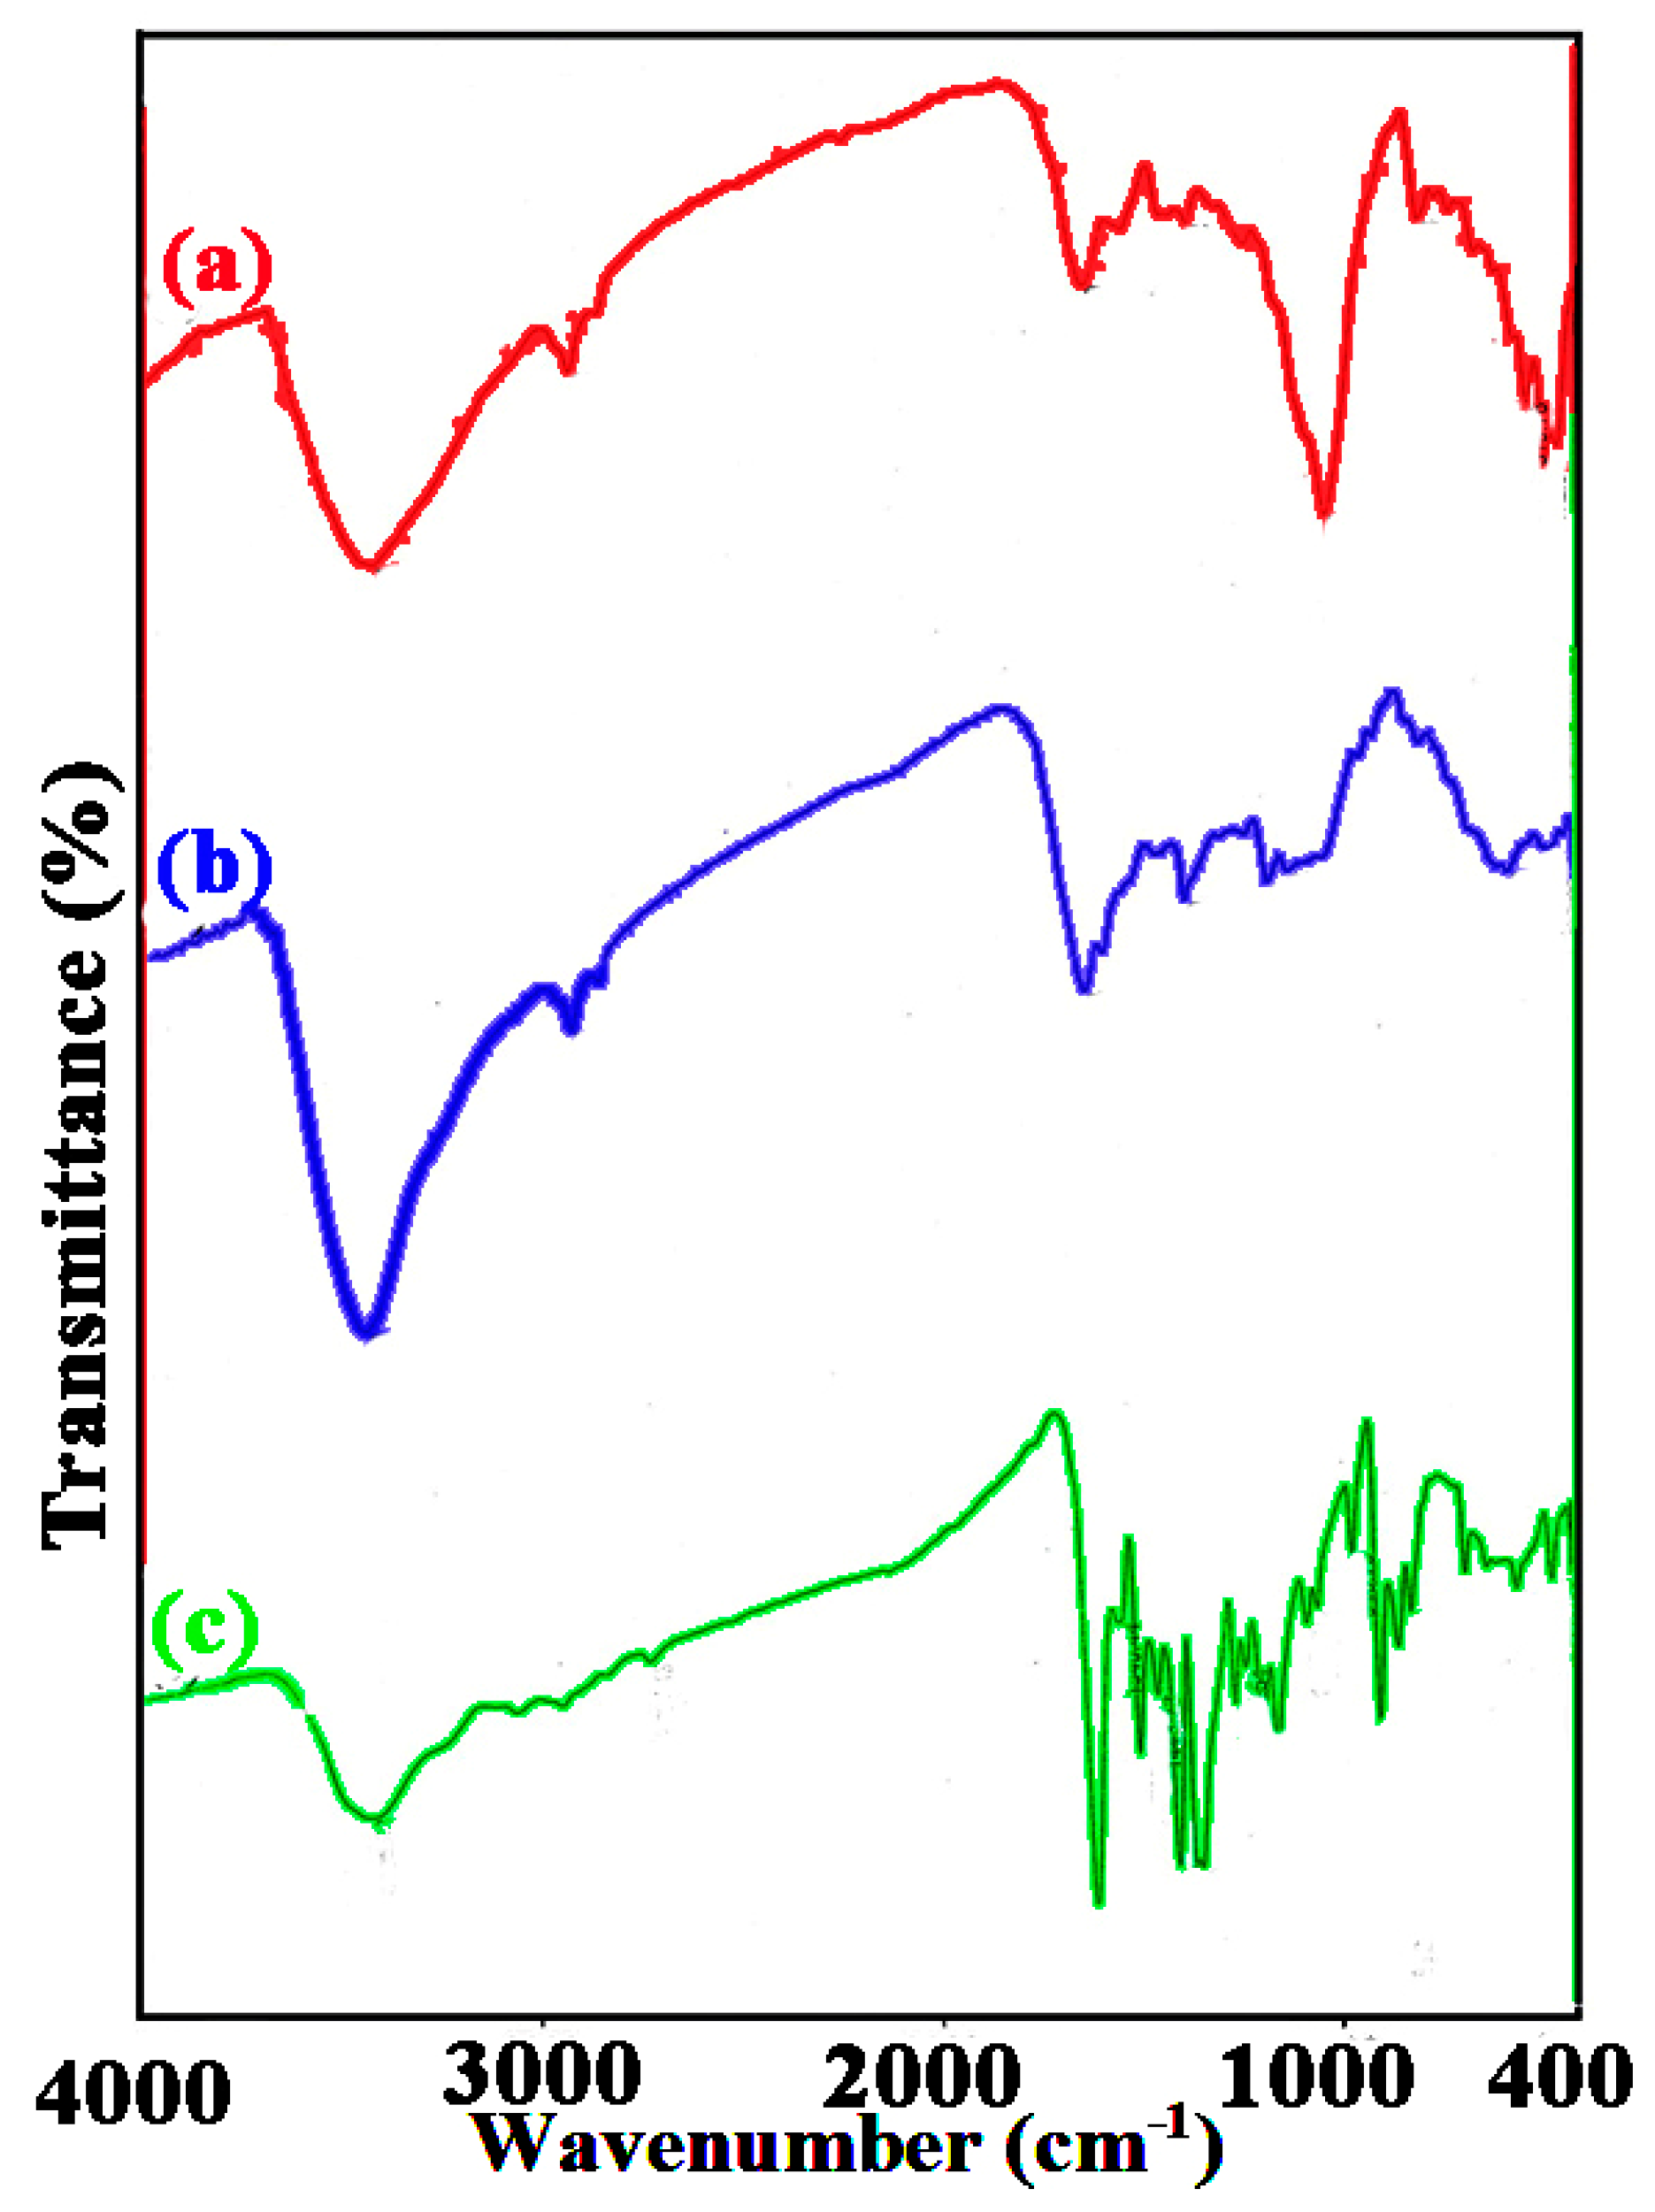
2.4. FTIR Spectra
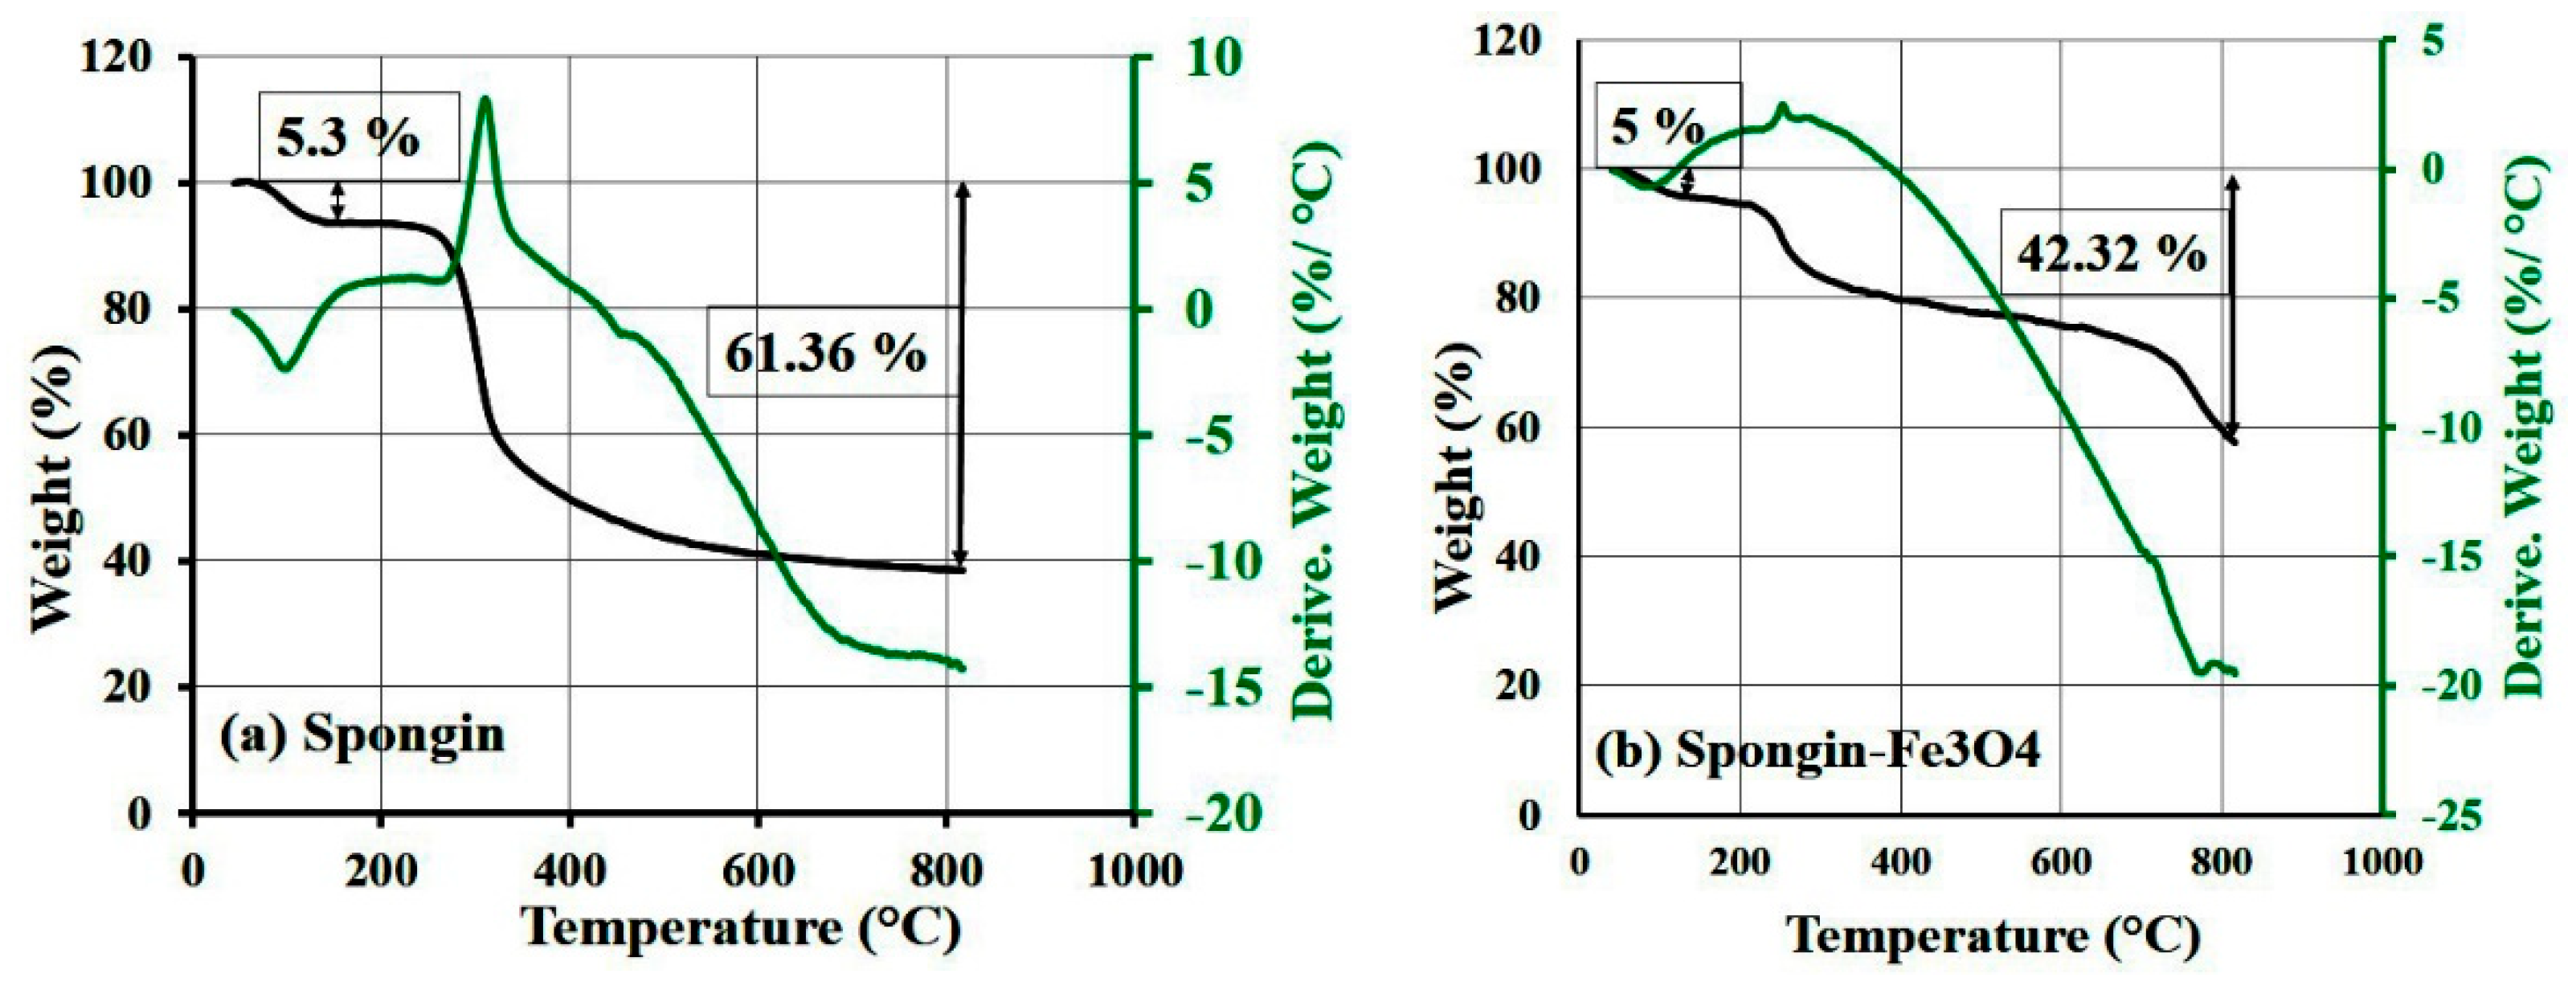
2.5. TGA/DTA
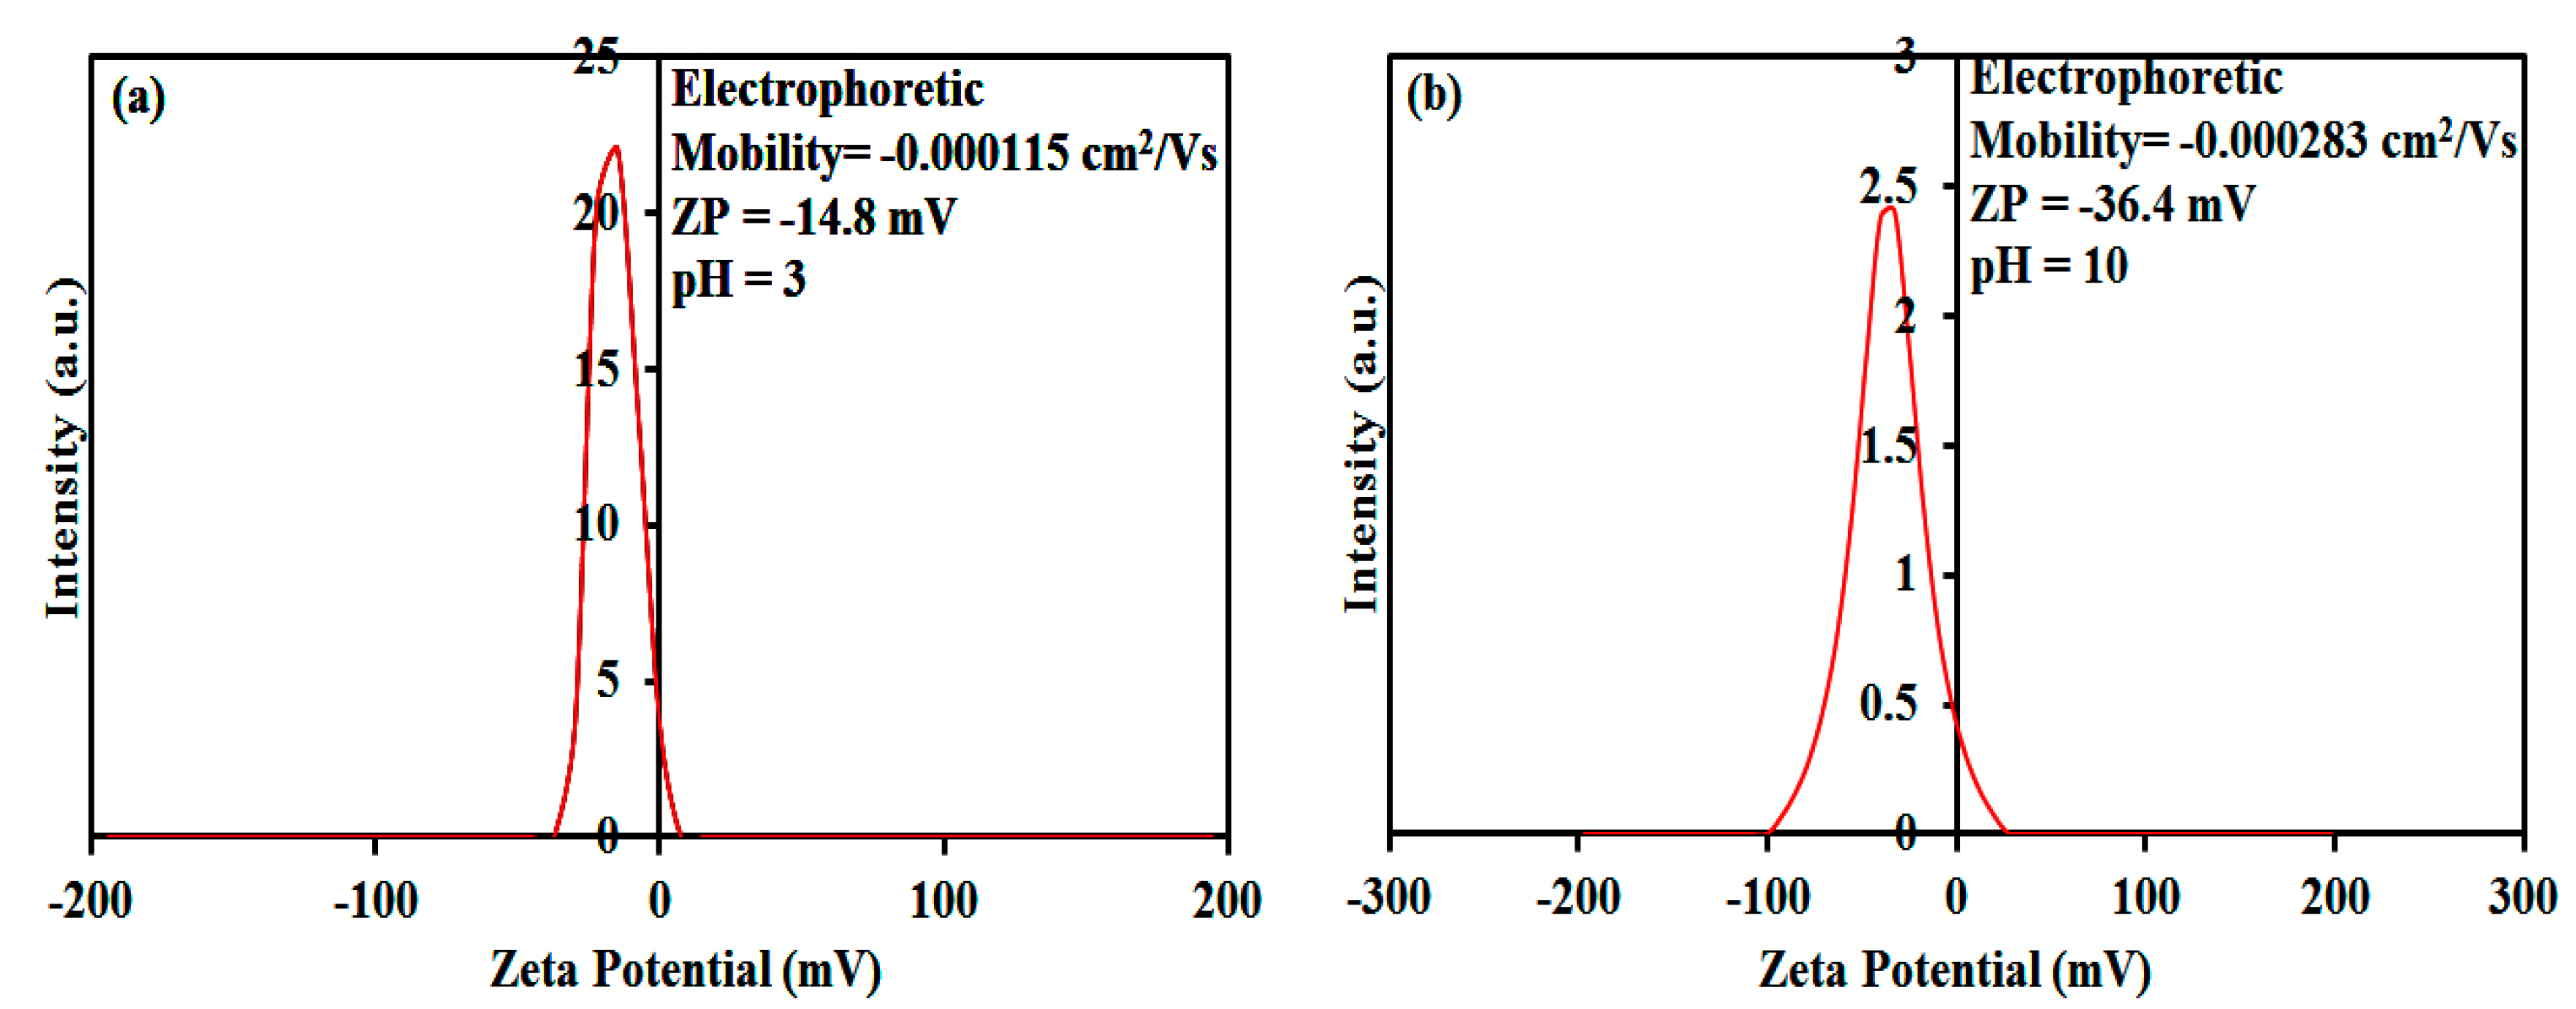
2.6. Zeta Potential Measurements
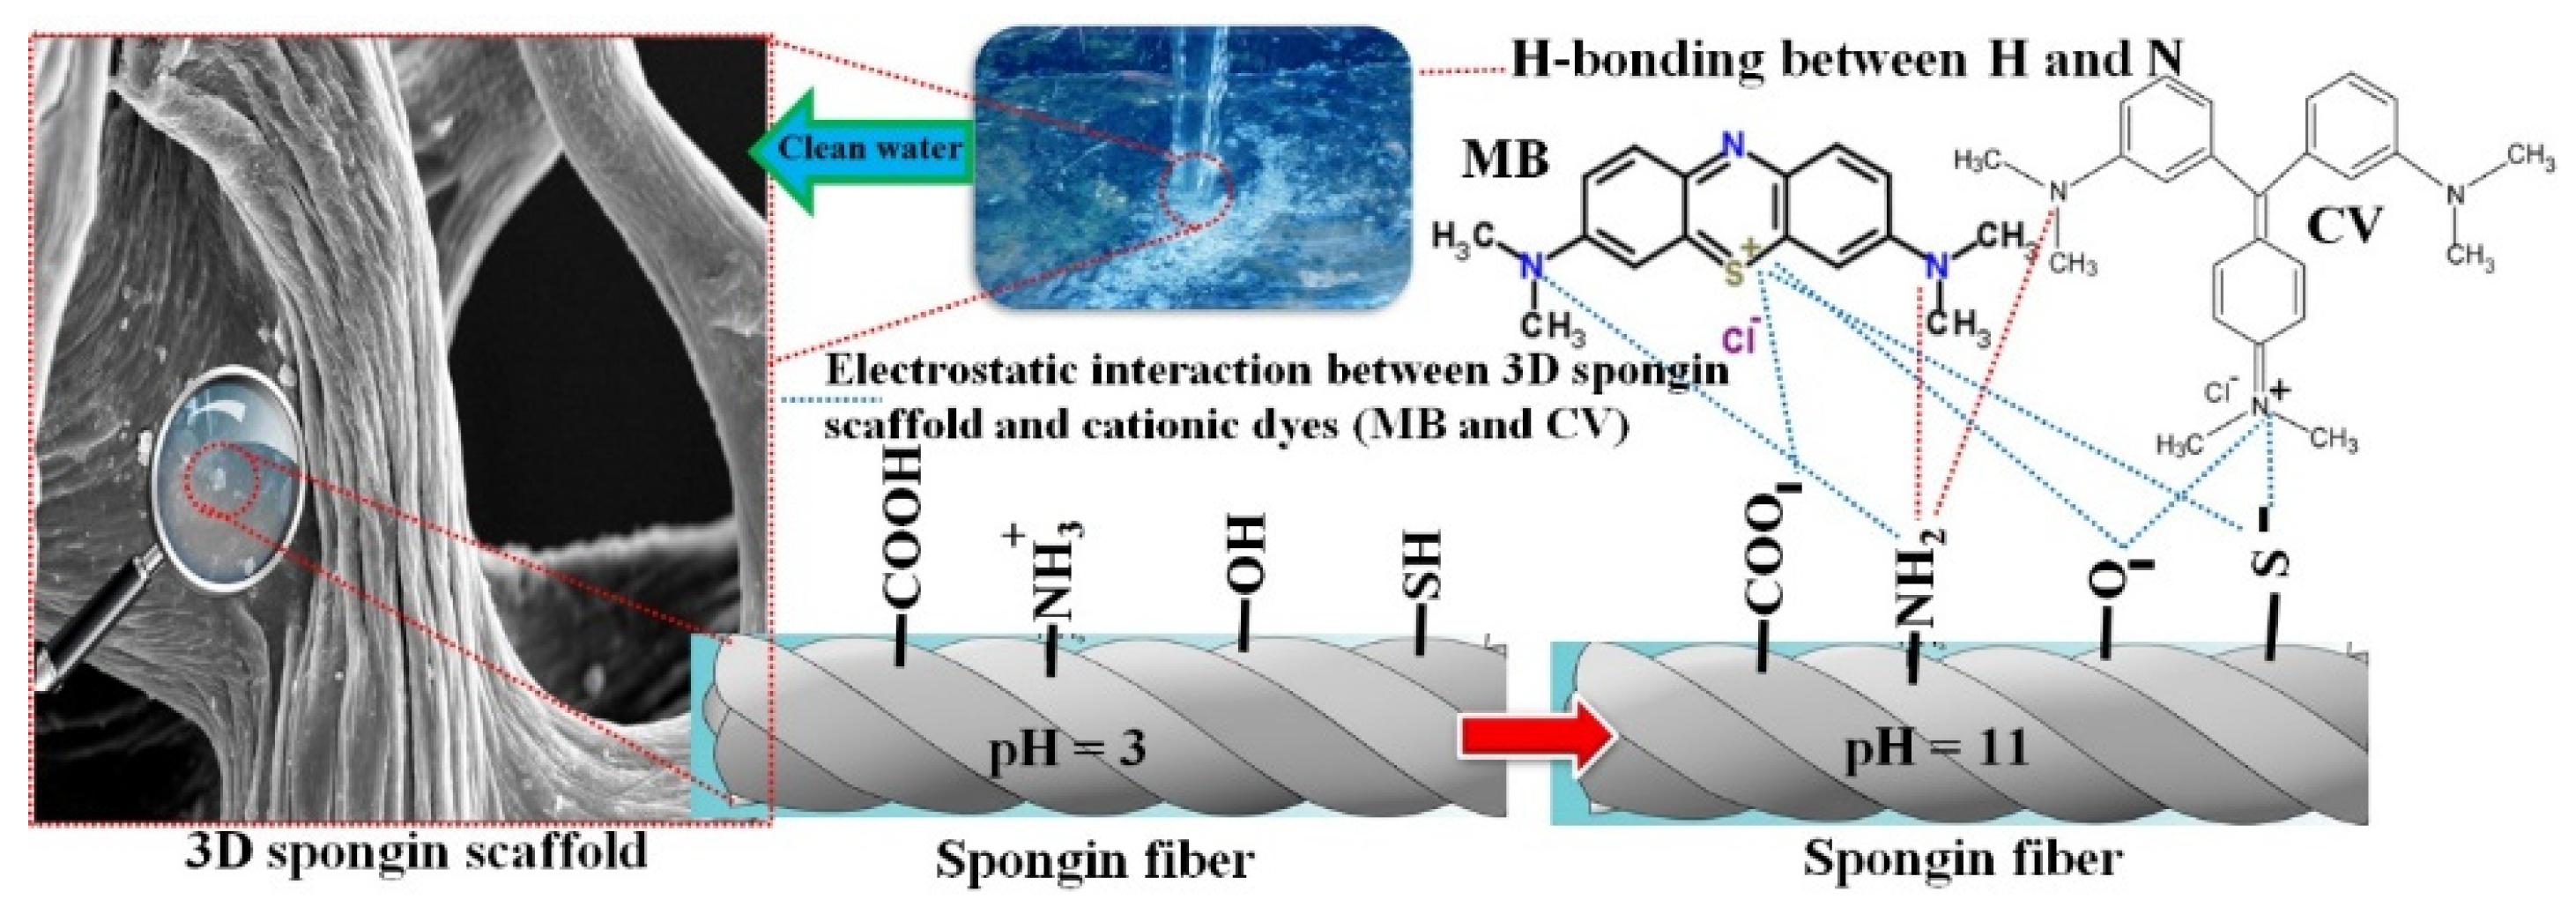
3. Discussion
3.1. Investigation of Dye Adsorption
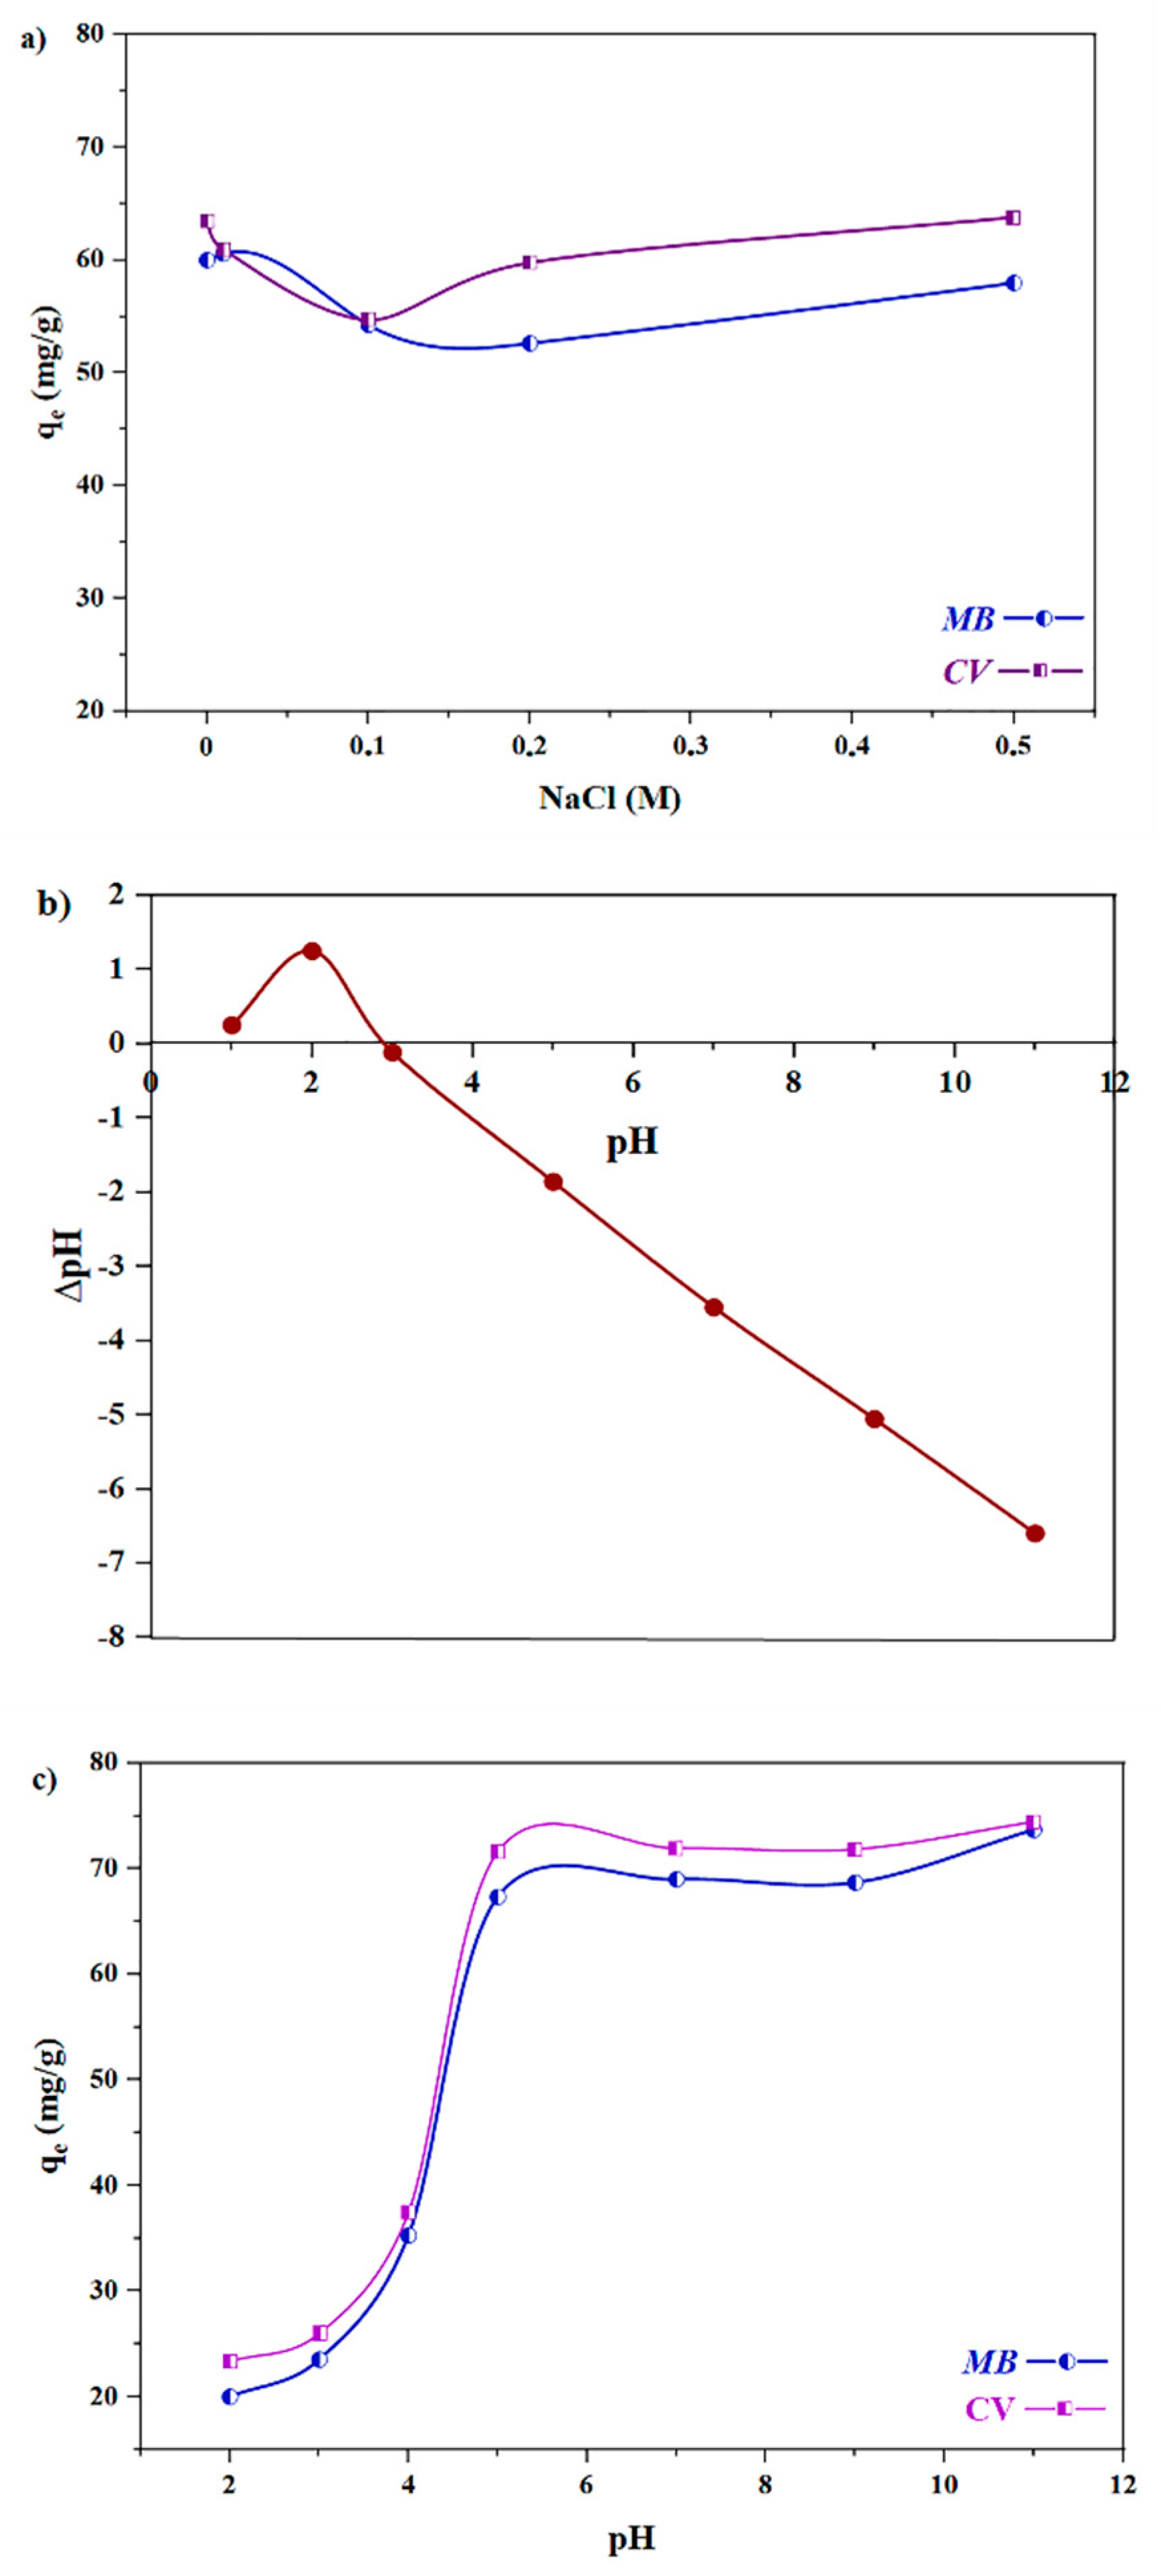
3.1.1. The Effect of Ionic Strength and pH Parameters
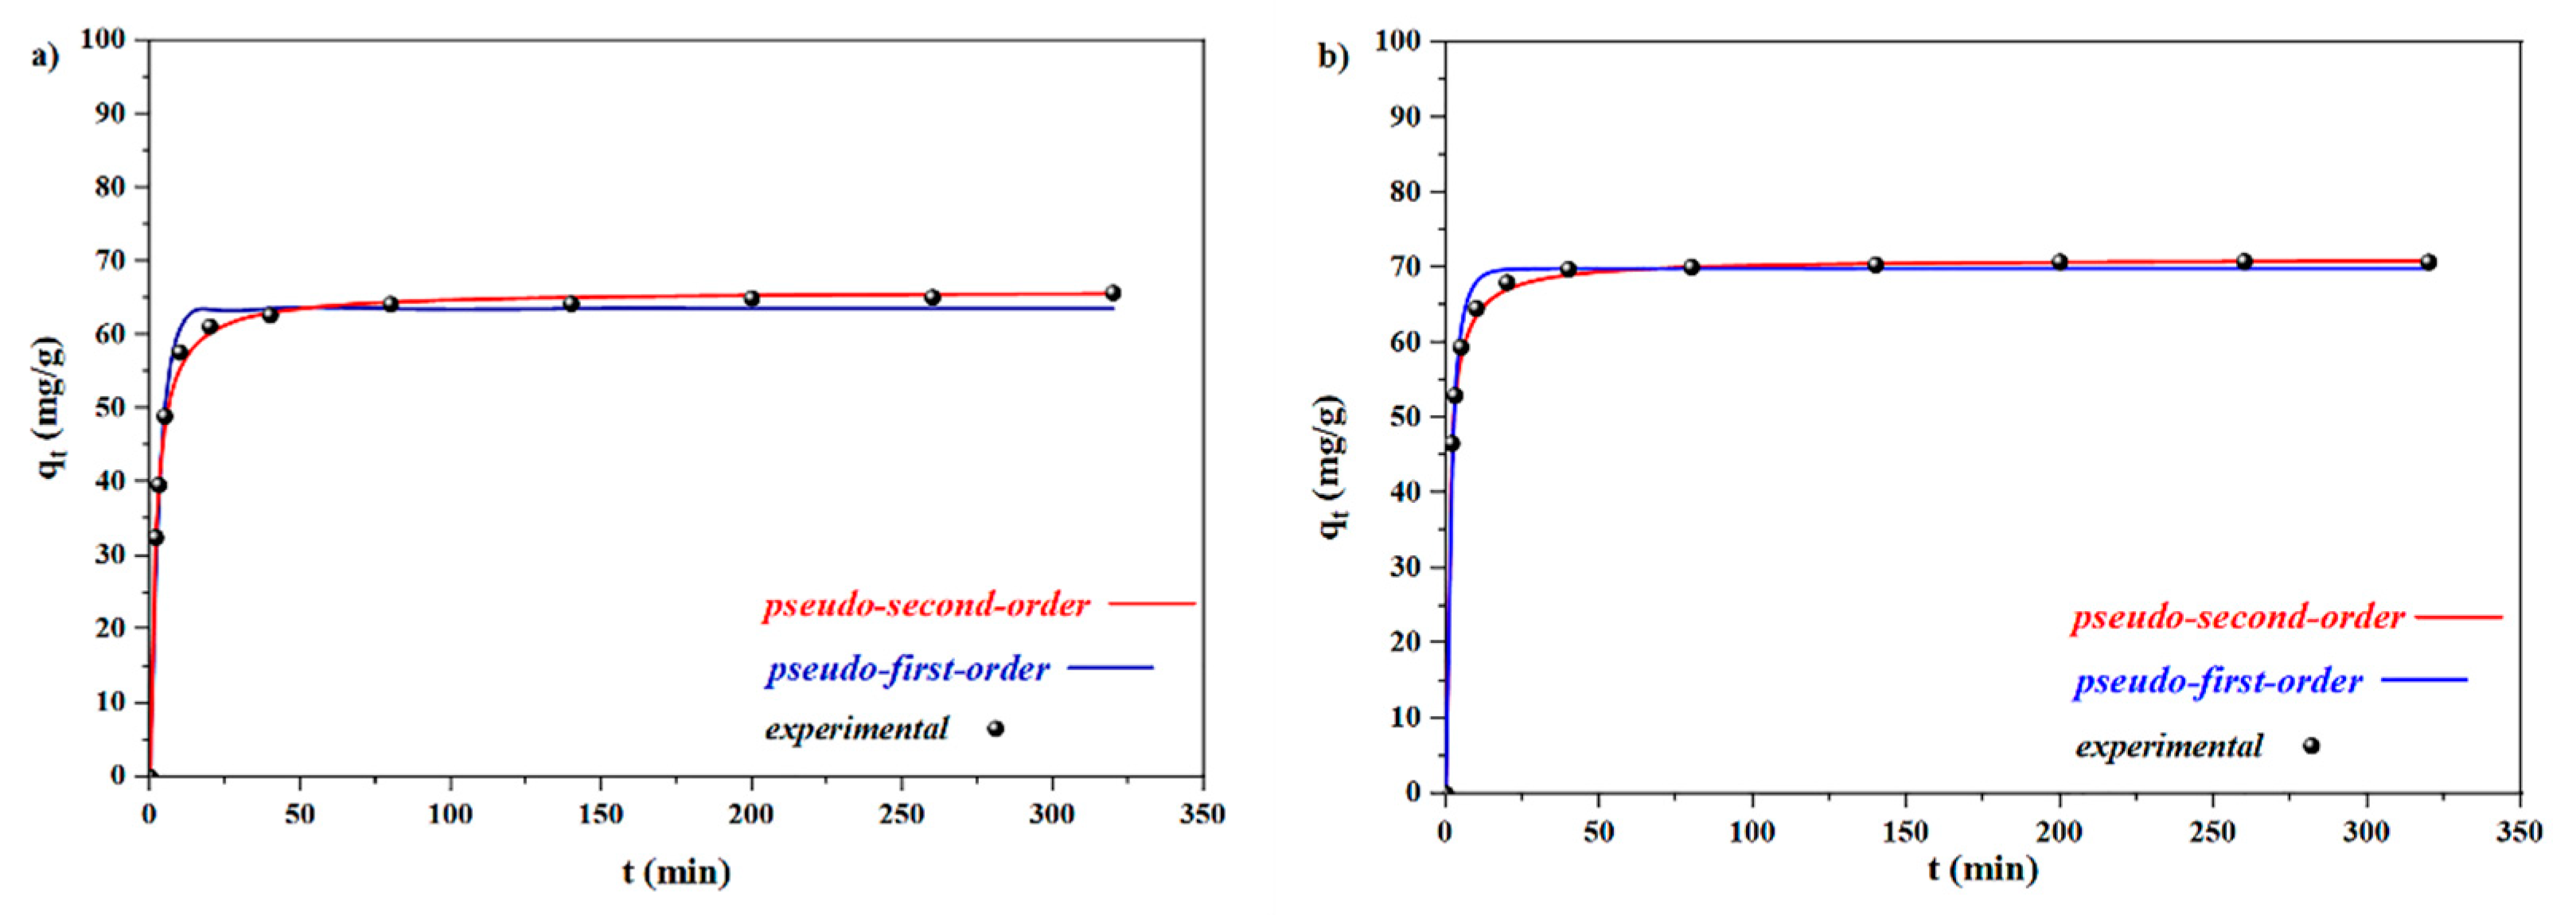
3.1.2. Adsorption Kinetics
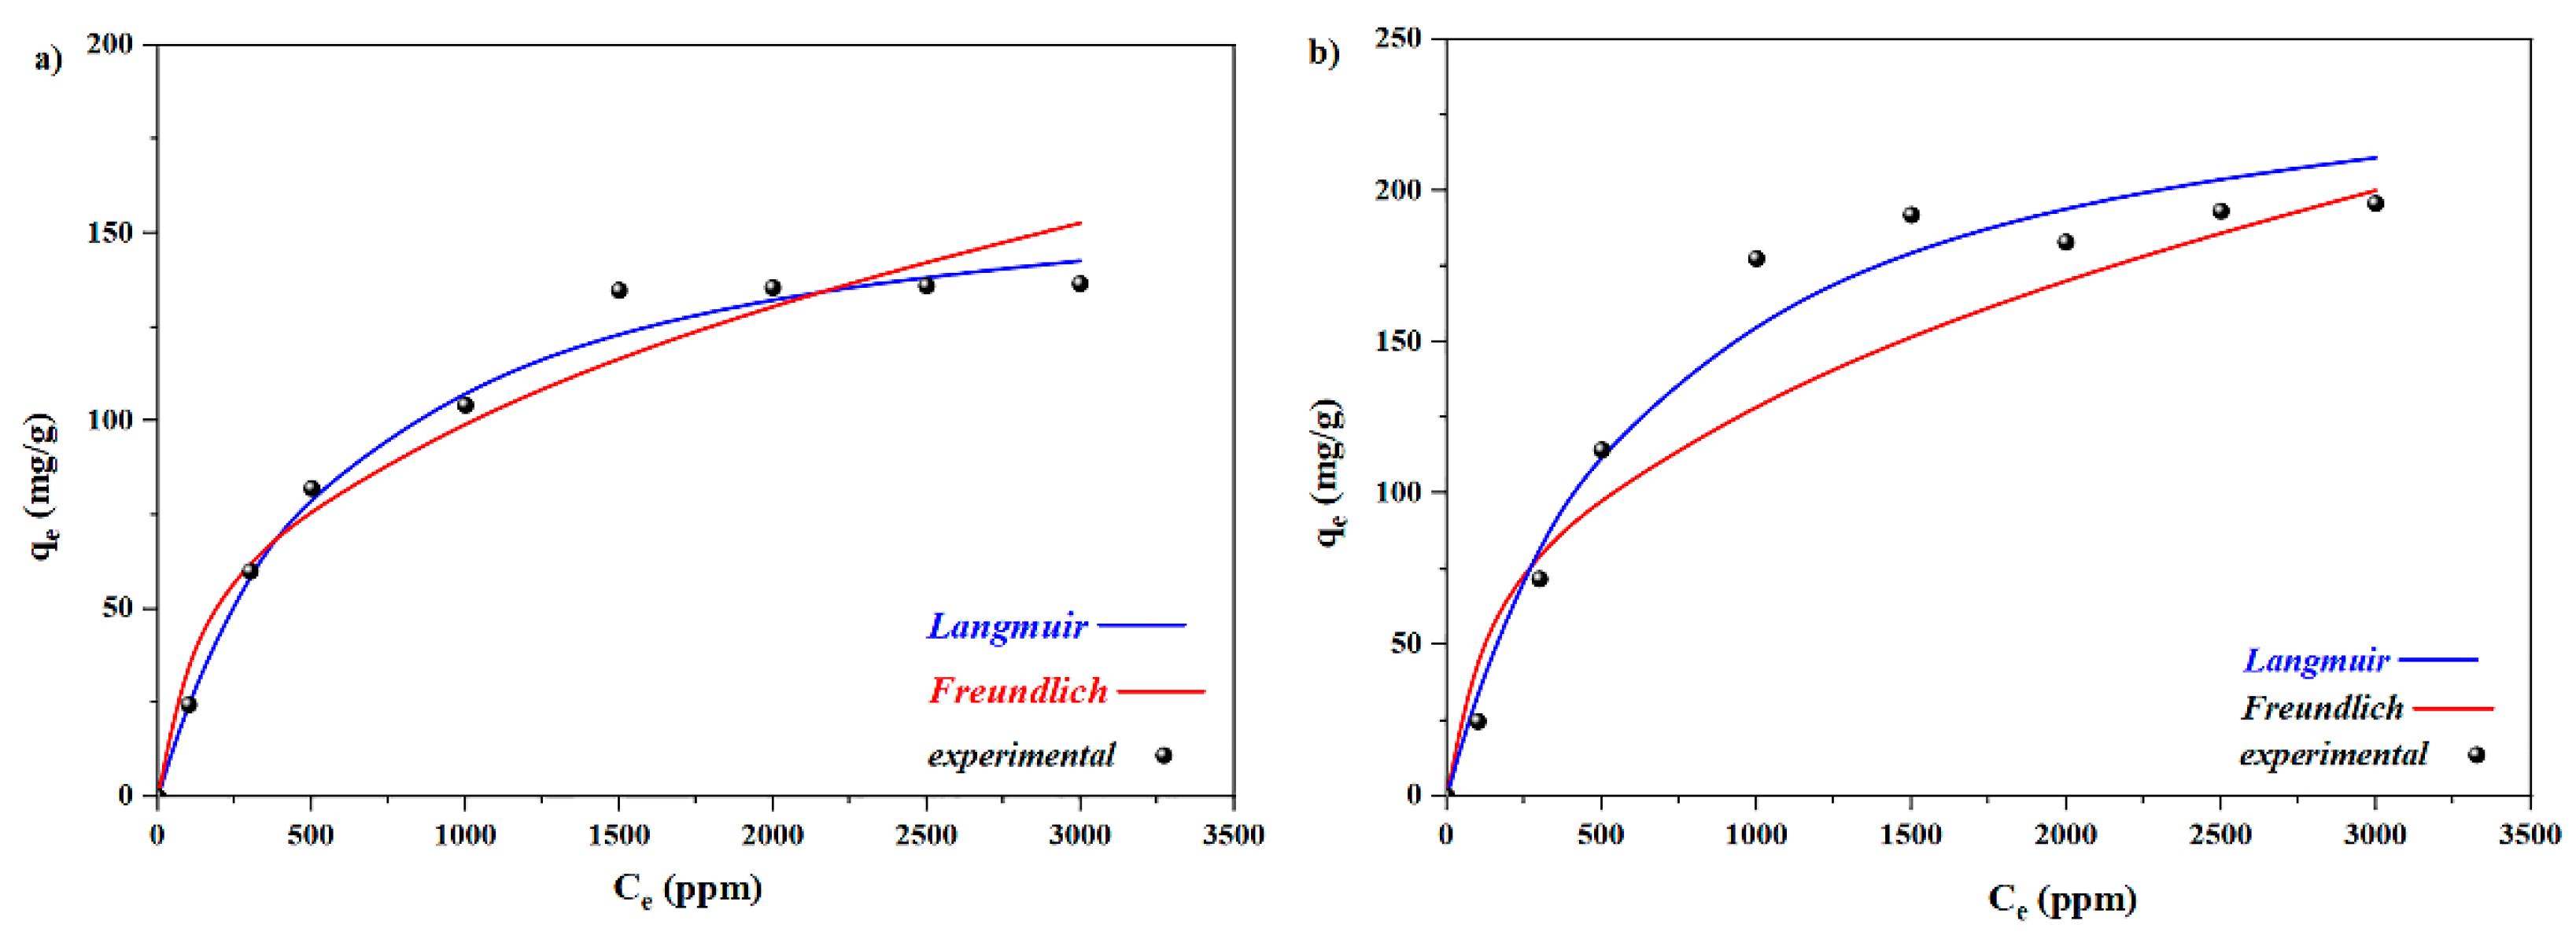
3.1.3. Adsorption Isotherms
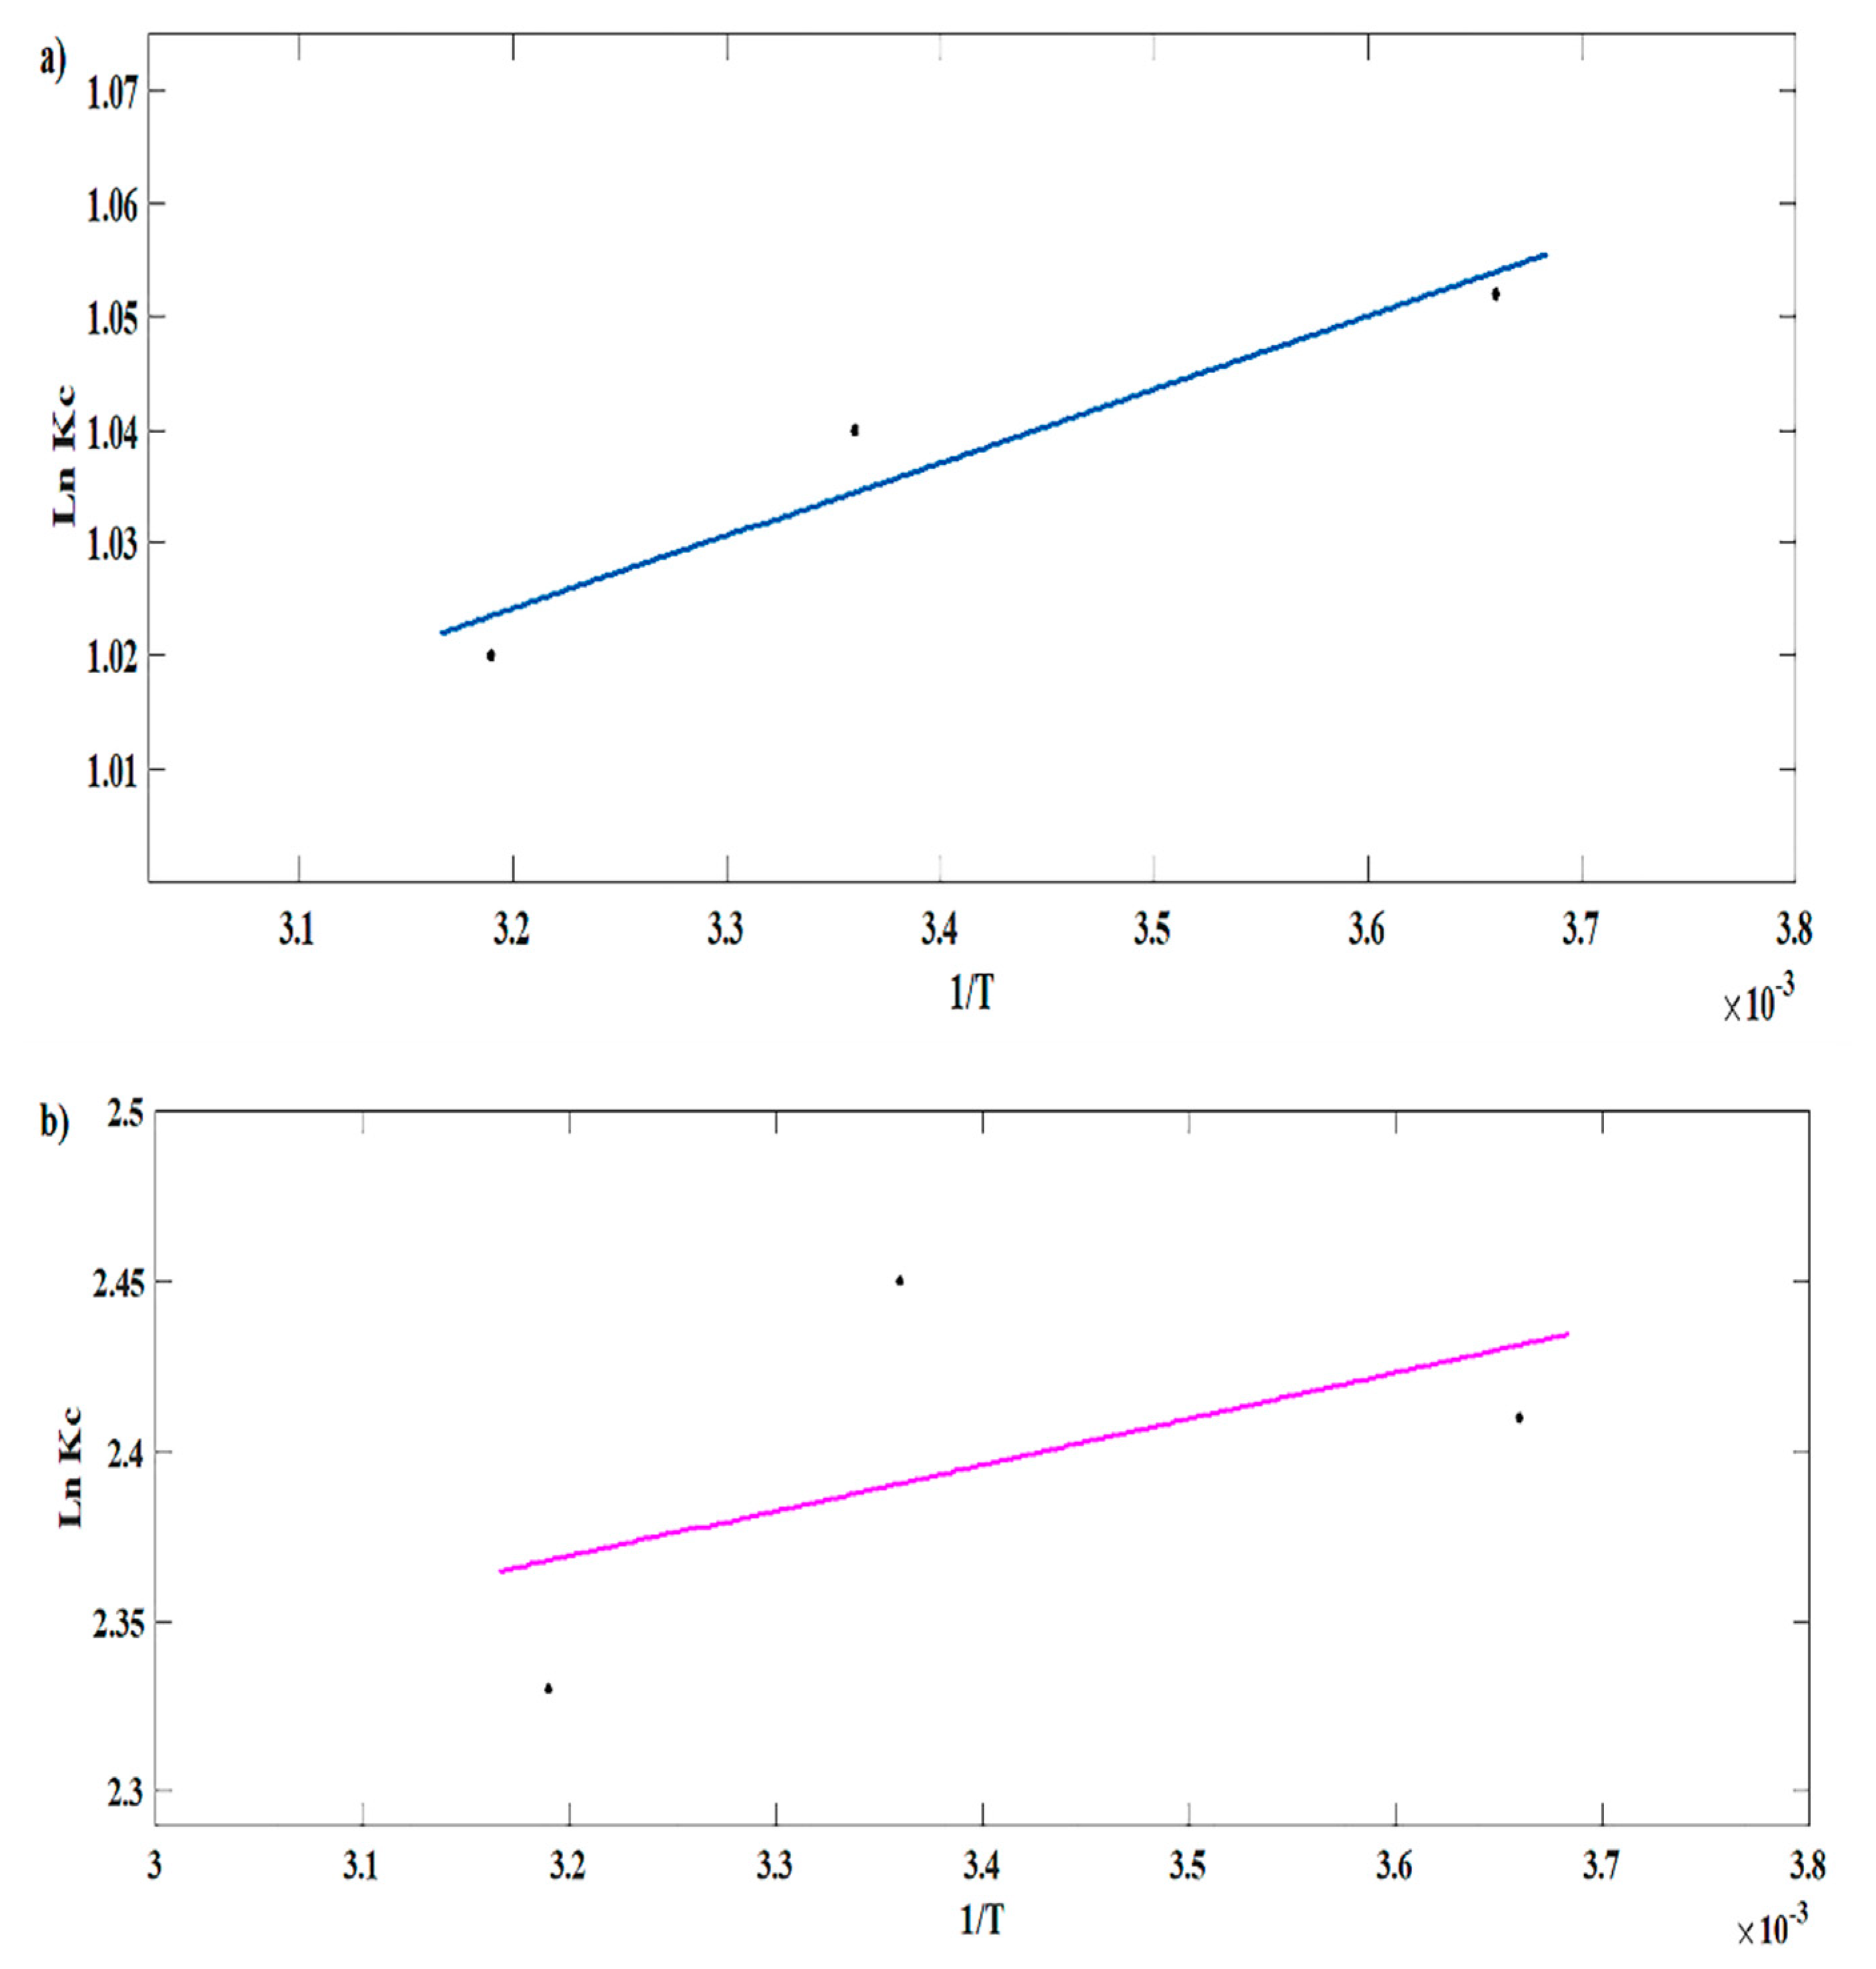
3.1.4. Thermodynamic Studies
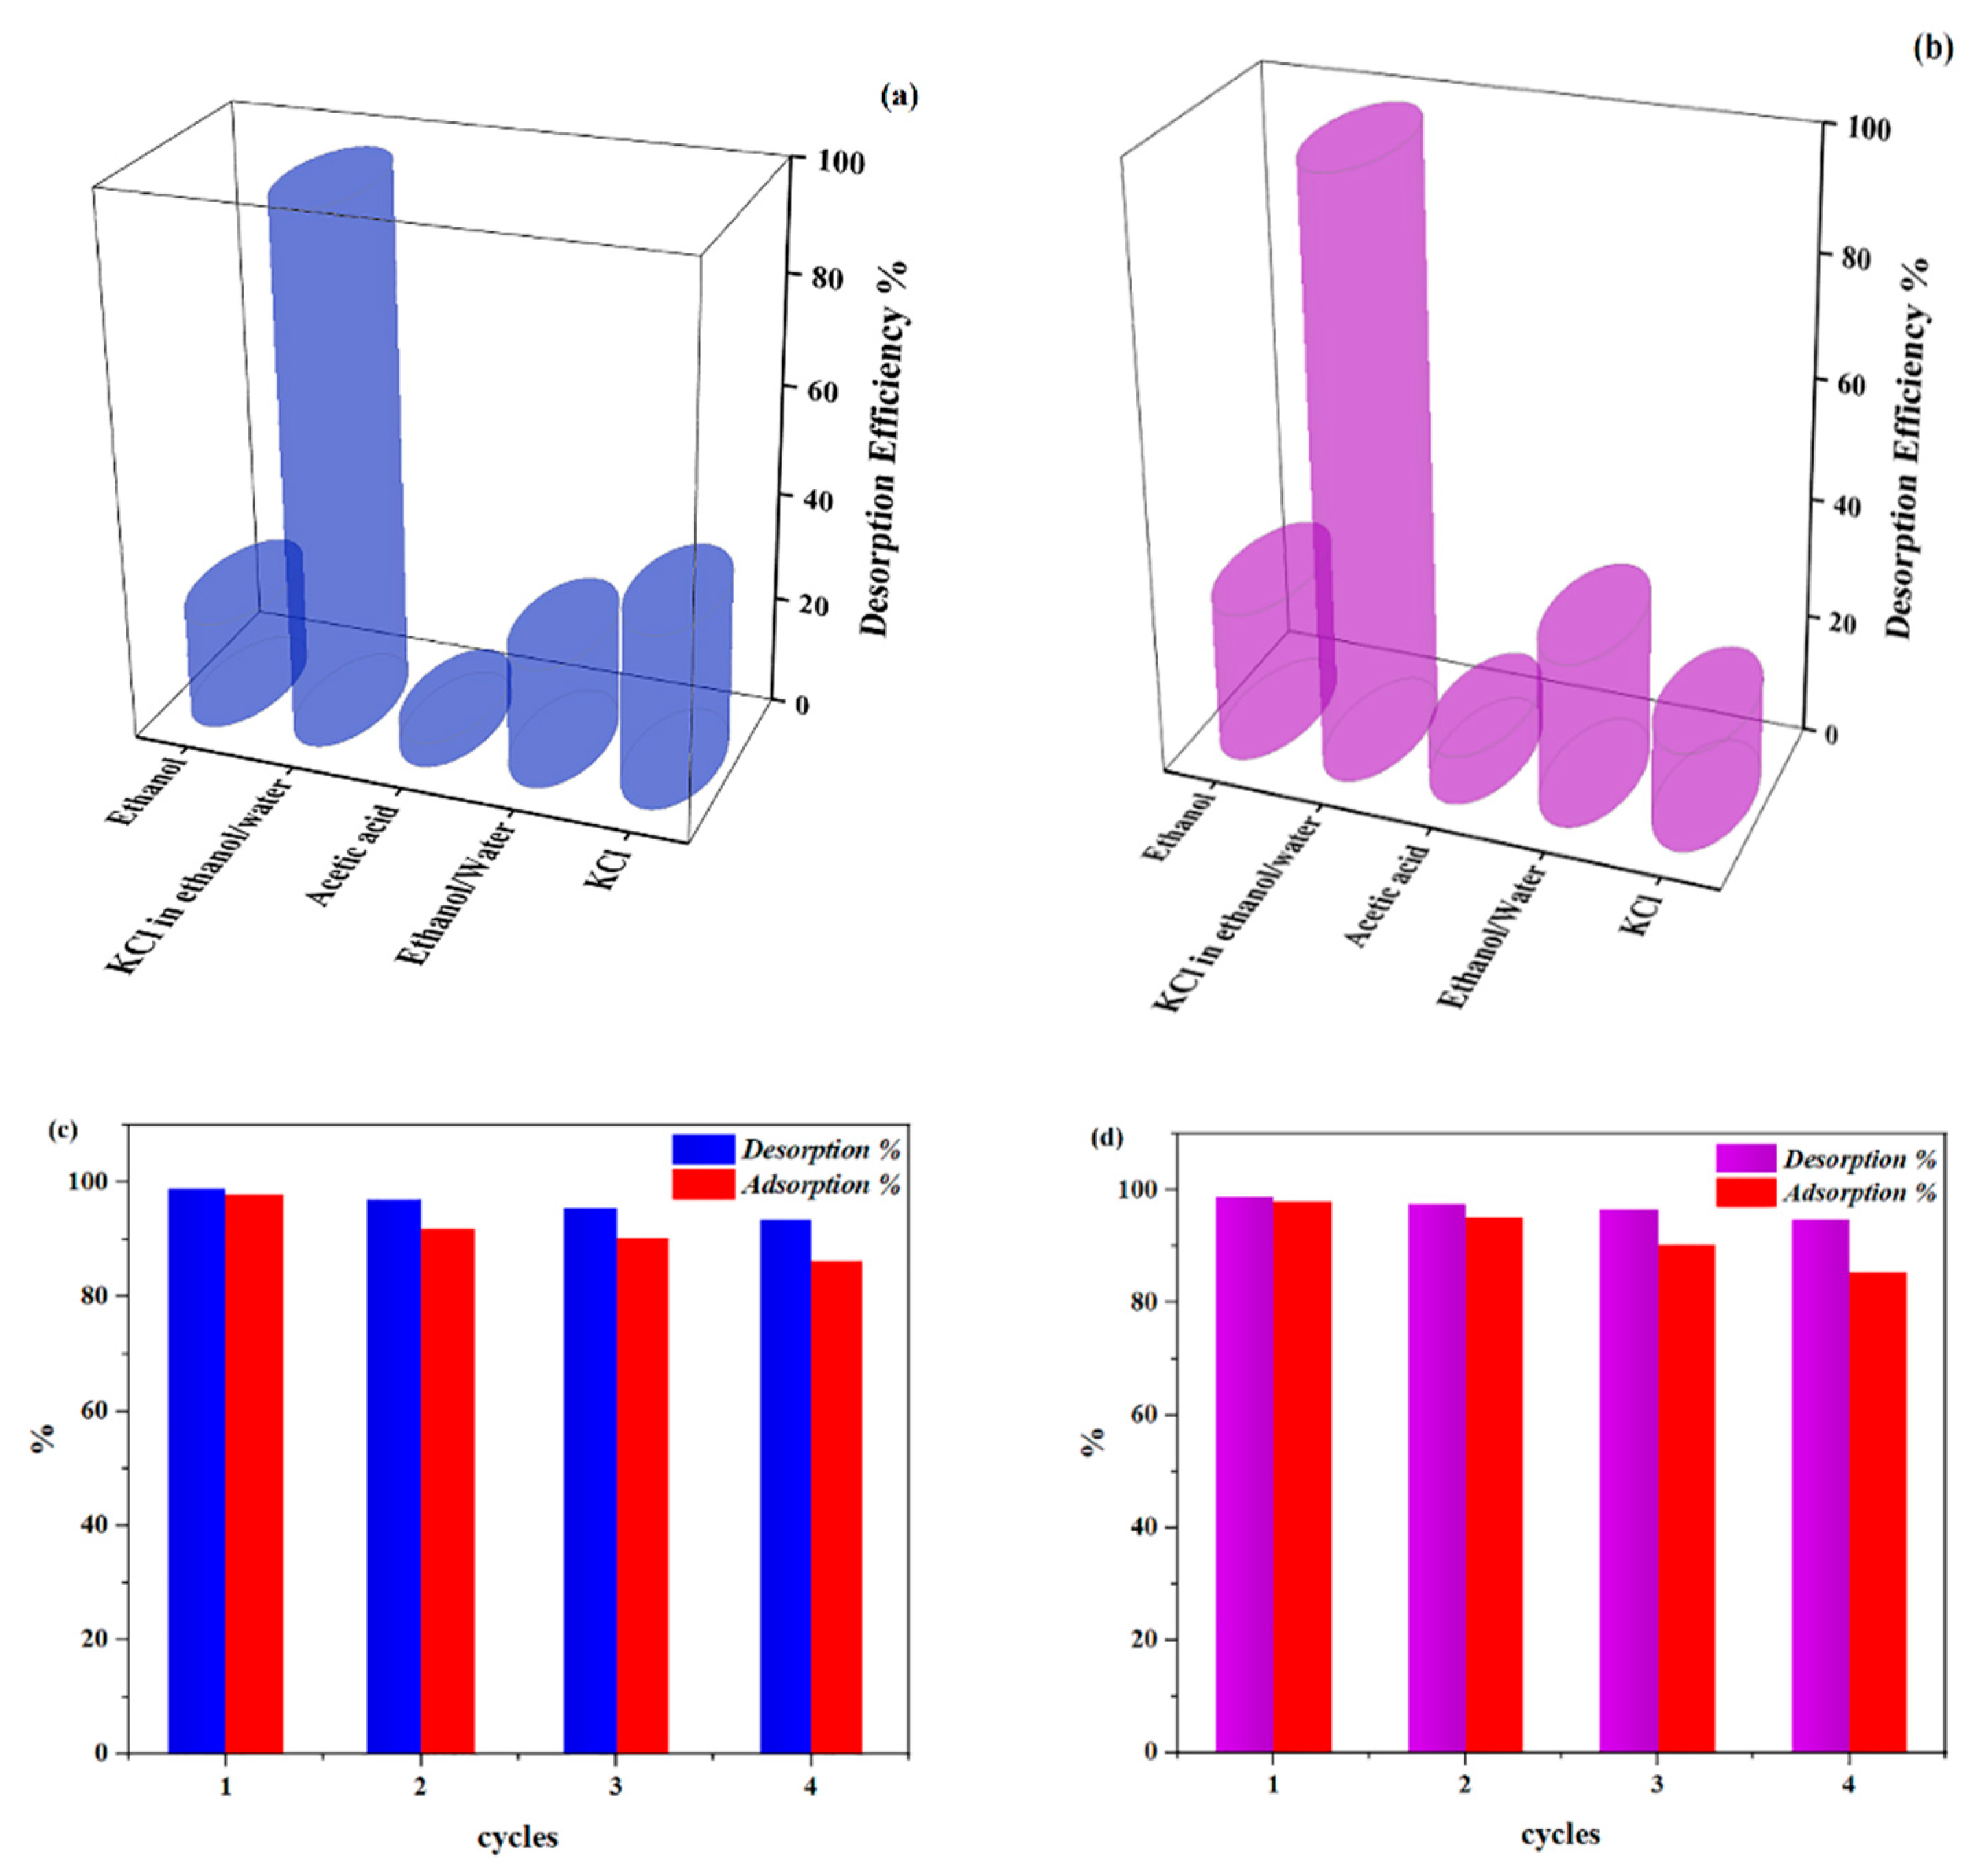
3.2. Desorption Studies
4. Materials and Methods
4.1. Materials
4.2. Preparation of Spongin Scaffolds
4.3. Preparation of Magnetic Spongin–Fe3O4
4.4. Characterization of the Synthesized Spongin–Fe3O4 Nanocomposite
4.5. Pollutant Adsorption Tests
4.6. Points of Zero Charge
5. Conclusions
Author Contributions
Funding
Conflicts of Interest
References
- Peymani-Motlagh, S.M.; Moeinian, N.; Rostami, M.; Fasihi-Ramandi, M.; Sobhani-Nasab, A.; Rahimi-Nasrabadi, M.; Eghbali-Arani, M.; Ganjali, M.R.; Jesionowski, T.; Ehrlich, H. Effect of Gd3+-, Pr3+- or Sm3+-substituted cobalt–zinc ferrite on photodegradation of methyl orange and cytotoxicity tests. J. Rare Earths 2019, 37, 1288–1295. [Google Scholar] [CrossRef]
- Lellis, B.; Fávaro-Polonio, C.Z.; Pamphile, J.A.; Polonio, J.C. Effects of textile dyes on health and the environment and bioremediation potential of living organisms. Biotechnol. Res. Innov. 2019, 3, 275–290. [Google Scholar] [CrossRef]
- Vesali-Naseh, M.; Vesali Naseh, M.R.; Ameri, P. Adsorption of Pb (II) ions from aqueous solutions using carbon nanotubes: A systematic review. J. Clean. Product. 2021, 291, 125917. [Google Scholar] [CrossRef]
- Shahwan, T.; Sirriah, S.A.; Nairat, M.; Boyacı, E.; Eroğlu, A.E.; Scott, T.B.; Hallam, K.R. Green synthesis of iron nanoparticles and their application as a Fenton-like catalyst for the degradation of aqueous cationic and anionic dyes. Chem. Eng. J. 2011, 172, 258–266. [Google Scholar] [CrossRef]
- Tiwari, J.N.; Mahesh, K.; Le, N.H.; Kemp, K.C.; Timilsina, R.; Tiwari, R.N.; Kim, K.S. Reduced graphene oxide-based hydrogels for the efficient capture of dye pollutants from aqueous solutions. Carbon 2013, 56, 173–182. [Google Scholar] [CrossRef]
- Adegoke, K.A.; Bello, O.S. Dye sequestration using agricultural wastes as adsorbents. Water Resour. Ind. 2015, 12, 8–24. [Google Scholar] [CrossRef] [Green Version]
- Rushing, L.G.; Bowman, M.C. Determination of gentian violet in animal feed, human urine, and wastewater by high pressure liquid chromatography. J. Chromatogr. Sci. 1980, 18, 224–232. [Google Scholar] [CrossRef]
- Yavuz, E.; Tokalıoğlu, Ş.; Patat, Ş. Core–shell Fe3O4 polydopamine nanoparticles as sorbent for magnetic dispersive solid-phase extraction of copper from food samples. Food Chem. 2018, 263, 232–239. [Google Scholar] [CrossRef]
- Wang, L.; Li, J.; Wang, Z.; Zhao, L.; Jiang, Q. Low-temperature hydrothermal synthesis of α-Fe/Fe3O4 nanocomposite for fast Congo red removal. Dalton Trans. 2013, 42, 2572–2579. [Google Scholar] [CrossRef]
- Chaudhary, G.R.; Saharan, P.; Kumar, A.; Mehta, S.; Mor, S.; Umar, A. Adsorption studies of cationic, anionic and azo-dyes via monodispersed Fe3O4 nanoparticles. J. Nanosci. Nanotechnol. 2013, 13, 3240–3245. [Google Scholar] [CrossRef]
- Vigneshwaran, S.; Sundarakannan, R.; John, K.M.; Deepak Joel Johnson, R.; Arun Prasath, K.; Ajith, S.; Arumugaprabu, V.; Uthayakumar, M. Recent advancement in the natural fiber polymer composites: A comprehensive review. J. Clean. Prod. 2020, 277, 24109. [Google Scholar] [CrossRef]
- Adithya, S.P.; Sidharthan, D.S.; Abhinandan, R.; Balagangadharan, K.; Selvamurugan, N. Nanosheets-incorporated bio-composites containing natural and synthetic polymers/ceramics for bone tissue engineering. Int. J. Biol. Macromol. 2020, 164, 1960–1972. [Google Scholar] [CrossRef]
- Sanjay, M.R.; Madhu, P.; Jawaid, M.; Senthamaraikannan, P.; Senthil, S.; Pradeep, S. Characterization and properties of natural fiber polymer composites: A comprehensive review. J. Clean. Prod. 2018, 172, 566–581. [Google Scholar] [CrossRef]
- Norman, M.; Bartczak, P.; Zdarta, J.; Tylus, W.; Szatkowski, T.; Stelling, A.L.; Ehrlich, H.; Jesionowski, T. Adsorption of CI Natural Red 4 onto spongin skeleton of marine demosponge. Materials 2015, 8, 96–116. [Google Scholar] [CrossRef] [Green Version]
- Szatkowski, T.; Wysokowski, M.; Lota, G.; Pęziak, D.; Bazhenov, V.V.; Nowaczyk, G.; Walter, J.; Molodtsov, S.L.; Stöcker, H.; Himcinschi, C. Novel nanostructured hematite–spongin composite developed using an extreme biomimetic approach. RSC Adv. 2015, 5, 79031–79040. [Google Scholar] [CrossRef] [Green Version]
- Tsurkan, D.; Wysokowski, M.; Petrenko, I.; Voronkina, A.; Khrunyk, Y.; Fursov, A.; Ehrlich, H. Modern scaffolding strategies based on naturally pre-fabricated 3D biomaterials of poriferan origin. Appl. Phys. A 2020, 126, 1–9. [Google Scholar]
- Khrunyk, Y.; Lach, S.; Petrenko, I.; Ehrlich, H. Progress in Modern Marine Biomaterials Research. Mar. Drugs 2020, 18, 589. [Google Scholar] [CrossRef] [PubMed]
- Norman, M.; Bartczak, P.; Zdarta, J.; Ehrlich, H.; Jesionowski, T. Anthocyanin dye conjugated with Hippospongia communis marine demosponge skeleton and its antiradical activity. Dyes Pigment 2016, 134, 541–552. [Google Scholar] [CrossRef]
- Kim, M.M.; Mendis, E.; Rajapakse, N.; Lee, S.H.; Kim, S.K. Effect of spongin derived from Hymeniacidon sinapium on bone mineralization. J. Biomed. Mater. Res. 2009, 90, 540–546. [Google Scholar] [CrossRef] [PubMed]
- Parisi, J.; Fernandes, K.; Avanzi, I.; Dorileo, B.; Santana, A.; Andrade, A.; Gabbai-Armelin, P.; Fortulan, C.; Trichês, E.; Granito, R. Incorporation of collagen from marine sponges (spongin) into hydroxyapatite samples: Characterization and in vitro biological evaluation. Mar. Biotechnol. 2019, 21, 30–37. [Google Scholar] [CrossRef]
- Ashouri, V.; Adib, K.; Rahimi-Nasrabadi, M. Pre-concentration and extraction of fenitrothion using a prefabricated 3D spongin-based skeleton of marine demosponge: Optimization by experimental design. Appl. Phys. A 2020, 126, 860. [Google Scholar] [CrossRef]
- Ashouri, V.; Rahimi-Nasrabadi, M.; Attaran Fariman, G.; Adib, K.; Zahedi, M.M.; Ganjali, M.R.; Khosrowshahi, E.M. Extraction and pre-concentration of ketamine by using a three-dimensional spongin-based scaffold of the Haliclona sp. marine demosponge origin. Appl. Phys. A 2020, 126, 1–12. [Google Scholar] [CrossRef]
- Norman, M.; Bartczak, P.; Zdarta, J.; Tomala, W.; Żurańska, B.; Dobrowolska, A.; Piasecki, A.; Czaczyk, K.; Ehrlich, H.; Jesionowski, T. Sodium copper chlorophyllin immobilization onto Hippospongia communis marine demosponge skeleton and its antibacterial activity. Int. J. Mol. Sci. 2016, 17, 1564. [Google Scholar] [CrossRef] [Green Version]
- Zdarta, J.; Norman, M.; Smułek, W.; Moszyński, D.; Kaczorek, E.; Stelling, A.L.; Ehrlich, H.; Jesionowski, T. Spongin-based scaffolds from Hippospongia communis demosponge as an effective support for lipase immobilization. Catalysts 2017, 7, 147. [Google Scholar] [CrossRef]
- Norman, M.; Żółtowska-Aksamitowska, S.; Zgoła-Grześkowiak, A.; Ehrlich, H.; Jesionowski, T. Iron (III) phthalocyanine supported on a spongin scaffold as an advanced photocatalyst in a highly efficient removal process of halophenols and bisphenol A. J. Hazard. Mater. 2018, 347, 78–88. [Google Scholar] [CrossRef] [PubMed]
- Szatkowski, T.; Siwińska-Stefańska, K.; Wysokowski, M.; Stelling, A.L.; Joseph, Y.; Ehrlich, H.; Jesionowski, T. Immobilization of titanium (IV) oxide onto 3D spongin scaffolds of marine sponge origin according to extreme biomimetics principles for removal of CI Basic Blue 9. Biomimetics 2017, 2, 4. [Google Scholar] [CrossRef] [Green Version]
- Szatkowski, T.; Kopczyński, K.; Motylenko, M.; Borrmann, H.; Mania, B.; Graś, M.; Lota, G.; Bazhenov, V.V.; Rafaja, D.; Roth, F. Extreme biomimetics: A carbonized 3D spongin scaffold as a novel support for nanostructured manganese oxide (IV) and its electrochemical applications. Nano Res. 2018, 11, 4199–4214. [Google Scholar] [CrossRef]
- Żółtowska, S.; Koltsov, I.; Alejski, K.; Ehrlich, H.; Ciałkowski, M.; Jesionowski, T. Thermal decomposition behaviour and numerical fitting for the pyrolysis kinetics of 3D spongin-based scaffolds. The classic approach. Polym. Test. 2021, 97, 107148. [Google Scholar] [CrossRef]
- Tsurkan, D.; Simon, P.; Schimpf, C.; Motylenko, M.; Rafaja, D.; Roth, F.; Inosov, D.S.; Makarova, A.A.; Stepniak, I.; Petrenko, I.; et al. Extreme Biomimetics: Designing of the First Nanostructured 3D Spongin–Atacamite Composite and its Application. Adv. Mater. 2021, 33, 2101682. [Google Scholar] [CrossRef] [PubMed]
- Iaroslav, P.; Summers, A.P.; Simon, P.; Żółtowska-Aksamitowska, S.; Motylenko, M.; Schimpf, C.; Rafaja, D.; Roth, F.; Kummer, K.; Brendler, E.; et al. Extreme biomimetics: Preservation of molecular detail in centimeter-scale samples of biological meshes laid down by sponges. Sci. Adv. 2019, 5, eaax2805. [Google Scholar]
- Rostami, M. Construction of La-doped TiO2@ La-doped ZnO–B-doped reduced graphene oxide ternary nanocomposites for improved visible light photocatalytic activity. RSC Adv. 2017, 7, 43424–43431. [Google Scholar] [CrossRef] [Green Version]
- Rostami, M.; Rahimi-Nasrabadi, M.; Ganjali, M.R.; Ahmadi, F.; Shojaei, A.F.; Rafiee, M.D. Facile synthesis and characterization of TiO2–graphene–ZnFe2−xTbxO4 ternary nano-hybrids. J. Mater. Sci. 2017, 52, 7008–7016. [Google Scholar] [CrossRef]
- Rotami, M.; Hamadanian, M.; Rahimi-Nasrabadi, M.; Ganjali, M.R. Sol–gel preparation of metal and nonmetal-codoped TiO2–graphene nanophotocatalyst for photodegradation of MO under UV and visible-light irradiation. Ionics 2019, 25, 1869–1878. [Google Scholar] [CrossRef]
- Gandomi, F.; Peymani-Motlagh, S.M.; Rostami, M.; Sobhani-Nasab, A.; Fasihi-Ramandi, M.; Eghbali-Arani, M.; Ahmadian, R.; Gholipour, N.; Rahimi-Nasrabadi, M.; Ganjali, M.R. Simple synthesis and characterization of Li0.5Fe2.5O4, LiMg0.5Fe2O4 and LiNi0.5Fe2O4, and investigation of their photocatalytic and anticancer properties on hela cells line. J. Mater. Sci. Mater. Electron. 2019, 30, 19691–19702. [Google Scholar] [CrossRef]
- Zdarta, J.; Antecka, K.; Frankowski, R.; Zgoła-Grześkowiak, A.; Ehrlich, H.; Jesionowski, T. The effect of operational parameters on the biodegradation of bisphenols by Trametes versicolor laccase immobilized on Hippospongia communis spongin scaffolds. Sci. Total Environ. 2018, 615, 784–795. [Google Scholar] [CrossRef]
- Rahimi-Nasrabadi, M.; Rostami, M.; Ahmadi, F.; Shojaie, A.F.; Rafiee, M.D. Synthesis and characterization of ZnFe2−xYbxO4–graphene nanocomposites by sol–gel method. J. Mater. Sci. Mater. Electron. 2016, 27, 11940–11945. [Google Scholar] [CrossRef]
- Jesionowski, T.; Norman, M.; Żółtowska-Aksamitowska, S.; Petrenko, I.; Joseph, Y.; Ehrlich, H. Marine spongin: Naturally prefabricated 3D scaffold-based biomaterial. Mar. Drugs 2018, 16, 88. [Google Scholar] [CrossRef] [PubMed] [Green Version]
- Rostami, M.; Sharafi, P.; Mozaffari, S.; Adib, K.; Sobhani-Nasab, A.; Rahimi-Nasrabadi, M.; Fasihi-Ramandi, M.; Ganjali, M.R.; Badiei, A. A facile preparation of ZnFe2O4–CuO-N/B/RGO and ZnFe2O4–CuO–C3N4 ternary heterojunction nanophotocatalyst: Characterization, biocompatibility, photo-Fenton-like degradation of MO and magnetic properties. J. Mater. Sci. Mater. Electron. 2021, 32, 5457–5472. [Google Scholar] [CrossRef]
- Rostami, M.; Nayebossadr, S.; Mozaffari, S.; Sobhani-Nasab, A.; Rahimi-Nasrabadi, M.; Fasihi-Ramandi, M.; Ganjali, M.R.; Bardajee, G.R.; Badiei, A. Heterojunction of N/B/RGO and gC3N4 anchored magnetic ZnFe2O4@ ZnO for promoting UV/Vis-induced photo-catalysis and in vitro toxicity studies. Environ. Sci. Pollut. Res. 2021, 28, 11430–11443. [Google Scholar] [CrossRef]
- Ehrlich, H. Enigmatic structural protein spongin. In Marine Biological Materials of Invertebrate Origin; Springer: Berlin/Heidelberg, Germany, 2019; pp. 161–172. [Google Scholar]
- Selmin, F.; Cilurzo, F.; Aluigi, A.; Franze, S.; Minghetti, P. Regenerated keratin membrane to match the in vitro drug diffusion through human epidermis. Res. Pharm. Sci. 2012, 2, 72–78. [Google Scholar] [CrossRef] [Green Version]
- Parisi, J.R.; Fernandes, K.R.; Aparecida do Vale, G.C.; de França Santana, A.; de Almeida Cruz, M.; Fortulan, C.A.; Zanotto, E.D.; Peitl, O.; Granito, R.N.; Rennó, A.C.M. Marine spongin incorporation into Biosilicate® for tissue engineering applications: An in vivo study. J. Biomater. Appl. 2020, 35, 205–214. [Google Scholar] [CrossRef]
- Tang, H.; Zhou, W.; Zhang, L. Adsorption isotherms and kinetics studies of malachite green on chitin hydrogels. J. Hazard. Mater. 2012, 209, 218–225. [Google Scholar] [CrossRef] [PubMed]
- Subhan, F.; Aslam, S.; Yan, Z.; Khan, M.; Etim, U.; Naeem, M. Effective adsorptive performance of Fe3O4@ SiO2 core shell spheres for methylene blue: Kinetics, isotherm and mechanism. J. Porous Mater. 2019, 26, 1465–1474. [Google Scholar] [CrossRef]
- Wang, F.; Zhang, L.; Wang, Y.; Liu, X.; Rohani, S.; Lu, J. Fe3O4@ SiO2@ CS-TETA functionalized graphene oxide for the adsorption of methylene blue (MB) and Cu (II). Appl. Surf. Sci. 2017, 420, 970–981. [Google Scholar] [CrossRef]
- Chang, J.; Ma, J.; Ma, Q.; Zhang, D.; Qiao, N.; Hu, M.; Ma, H. Adsorption of methylene blue onto Fe3O4/activated montmorillonite nanocomposite. Appl. Clay Sci. 2016, 119, 132–140. [Google Scholar] [CrossRef]
- Rostami, M.; Nasab, A.S.; Fasihi-Ramandi, M.; Badiei, A.; Rahimi-Nasrabadi, M.; Ahmadi, F. The ZnFe2O4@ mZnO–N/RGO nano-composite as a carrier and an intelligent releaser drug with dual pH-and ultrasound-triggered control. New J. Chem. 2021, 45, 4280–4291. [Google Scholar] [CrossRef]
- Hafezi, M.; Rostami, M.; Hosseini, A.; Rahimi-Nasrabadi, M.; Fasihi-Ramandi, M.; Badiei, A.; Ahmadi, F. Cur-loaded ZnFe2O4@ mZnO@ N-GQDs biocompatible nano-carriers for smart and controlled targeted drug delivery with pH-triggered and ultrasound irradiation. J. Mol. Liq. 2021, 322, 114875. [Google Scholar] [CrossRef]
- Kozłowski, H.; Kowalik-Jankowska, T.; Jeżowska-Bojczuk, M. Chemical and biological aspects of Cu2+ interactions with peptides and aminoglycosides. Coord. Chem. Rev. 2005, 249, 2323–2334. [Google Scholar] [CrossRef]
- Al-Degs, Y.S.; El-Barghouthi, M.I.; El-Sheikh, A.H.; Walker, G.M. Effect of solution pH, ionic strength, and temperature on adsorption behavior of reactive dyes on activated carbon. Dyes Pigment 2008, 77, 16–23. [Google Scholar] [CrossRef]
- Rostami, M. Photodecomposition and adsorption of hazardous organic pollutants by Ce-doped ZnO@ Ce-doped TiO2-N/S-dual doped RGO ternary nano-composites photocatalyst for water remediation. J. Mol. Struct. 2019, 1185, 191–199. [Google Scholar] [CrossRef]
- Dragan, E.S.; Apopei Loghin, D.F.; Cocarta, A.I. Efficient sorption of Cu2+ by composite chelating sorbents based on potato starch-graft-polyamidoxime embedded in chitosan beads. ACS Appl. Mater. Interfaces 2014, 6, 16577–16592. [Google Scholar] [CrossRef] [PubMed]
- Som, A.M.; Ahmat, N.; Hamid, H.A.A.; Azizuddin, N. A comparative study on foliage and peels of Hylocereus undatus (white dragon fruit) regarding their antioxidant activity and phenolic content. Heliyon 2019, 5, e01244. [Google Scholar] [CrossRef] [PubMed] [Green Version]
- Pal, M.; Ghosh, M. Prophylactic effect of α-linolenic acid and α-eleostearic acid against MeHg induced oxidative stress, DNA damage and structural changes in RBC membrane. Food Chem. Toxicol. 2012, 50, 2811–2818. [Google Scholar] [CrossRef] [PubMed]
- Foo, K.Y.; Hameed, B.H. Insights into the modeling of adsorption isotherm systems. Chem. Eng. J. 2010, 156, 2–10. [Google Scholar] [CrossRef]
- Kumar, S.; Stecher, G.; Li, M.; Knyaz, C.; Tamura, K. MEGA X: Molecular evolutionary genetics analysis across computing platforms. Mol. Biol. Evol. 2018, 35, 1547–1549. [Google Scholar] [CrossRef]
- Dragan, E.S. Design and applications of interpenetrating polymer network hydrogels. A review. Chem. Eng. J. 2014, 243, 572–590. [Google Scholar] [CrossRef]
- Deb, M.L.; Borpatra, P.J.; Baruah, P.K. A one-pot catalyst/external oxidant/solvent-free cascade approach to pyrimidines via a 1, 5-hydride transfer. Green Chem. 2019, 21, 69–74. [Google Scholar] [CrossRef]
- Bulut, Y.; Aydın, H. A kinetics and thermodynamics study of methylene blue adsorption on wheat shells. Desalination 2006, 194, 259–267. [Google Scholar] [CrossRef]
- Ghaffour, N.; Bundschuh, J.; Mahmoudi, H.; Goosen, M.F. Renewable energy-driven desalination technologies: A comprehensive review on challenges and potential applications of integrated systems. Desalination 2015, 356, 94–114. [Google Scholar] [CrossRef] [Green Version]
- Zhang, J.; Terrones, M.; Park, C.R.; Mukherjee, R.; Monthioux, M.; Koratkar, N.; Kim, Y.S.; Hurt, R.; Frackowiak, E.; Enoki, T. Carbon science in 2016: Status, challenges and perspectives. Carbon 2016, 98, 708–732. [Google Scholar] [CrossRef]
- Ajanovic, J.; Wagh, M.; Sethi, P.; Sharma, D.D.; Harriman, D.J.; Rosenbluth, M.B.; Bhatt, A.V.; Barry, P.; Rodgers, S.D.; Vasudevan, A. Pci Express Enhancements and Extensions. U.S. Patent 2008/0109565, 8 May 2008. [Google Scholar]
- Kannan, N.; Sundaram, M.M. Kinetics and mechanism of removal of methylene blue by adsorption on various carbons—A comparative study. Dyes Pigment 2001, 51, 25–40. [Google Scholar] [CrossRef]
- Mahdavinia, G.R.; Soleymani, M.; Sabzi, M.; Azimi, H.; Atlasi, Z. Novel magnetic polyvinyl alcohol/laponite RD nanocomposite hydrogels for efficient removal of methylene blue. J. Environ. Chem. Eng. 2017, 5, 2617–2630. [Google Scholar] [CrossRef]
- Tsai, W.; Chang, C.; Lin, M.; Chien, S.; Sun, H.; Hsieh, M. Adsorption of acid dye onto activated carbons prepared from agricultural waste bagasse by ZnCl2 activation. Chemosphere 2001, 45, 51–58. [Google Scholar] [CrossRef]
- Debrassi, A.; Corrêa, A.F.; Baccarin, T.; Nedelko, N.; Ślawska-Waniewska, A.; Sobczak, K.; Dłużewski, P.; Greneche, J.-M.; Rodrigues, C.A. Removal of cationic dyes from aqueous solutions using N-benzyl-O-carboxymethylchitosan magnetic nanoparticles. Chem. Eng. J. 2012, 183, 284–293. [Google Scholar] [CrossRef]
- Mahdavinia, G.R.; Aghaie, H.; Sheykhloie, H.; Vardini, M.T.; Etemadi, H. Synthesis of CarAlg/MMt nanocomposite hydrogels and adsorption of cationic crystal violet. Carbohydr. Polym. 2013, 98, 358–365. [Google Scholar] [CrossRef]
- Hamidzadeh, S.; Torabbeigi, M.; Shahtaheri, S.J. Removal of crystal violet from water by magnetically modified activated carbon and nanomagnetic iron oxide. J. Environ. Health Sci. Eng. 2015, 13, 1–7. [Google Scholar] [CrossRef] [PubMed] [Green Version]
- Gaurav, S.; Amit, K.; Naushad, M.; García-Peñas, A.; Al-Muhtaseb, A.; Ghfar, A.; Vikrant, S.; Tansir, A.; Stadler, F. Fabrication and characterization of gum arabic-cl-poly (acrylamide) nanohydrogel for effective adsorption of crystal violet dye. Carbohydr. Polym. 2018, 202, 444–453. [Google Scholar]
- Eslami, S.; Heess, N.; Weber, T.; Tassa, Y.; Szepesvari, D.; Hinton, G.E. Attend, infer, repeat: Fast scene understanding with generative models. Adv. Neural Inf. Process. Syst. 2016, 29, 3225–3233. [Google Scholar]
- Calvete, T.; Lima, E.C.; Cardoso, N.F.; Dias, S.L.P.; Pavan, F.A. Application of carbon adsorbents prepared from the Brazilian pine-fruit-shell for the removal of Procion Red MX 3B from aqueous solution-Kinetic, equilibrium, and thermodynamic studies. Chem. Eng. J. 2009, 155, 627–636. [Google Scholar] [CrossRef]
- Ofomaja, A.E.; Ho, Y.S. Effect of pH on cadmium biosorption by coconut copra meal. J. Hazard. Mater. 2007, 139, 356–362. [Google Scholar] [CrossRef]


| Pseudo-First-Order | Pseudo-Second-Order | ||||||
|---|---|---|---|---|---|---|---|
| k1 (min−1) | qe (mg·g−1) | r2 | k2 × 103 (g·min−1·mg−1) | qe (mg·g−1) | r2 | qe.exp (mg·g−1) | |
| MB | 0.3189 | 63.55 | 0.9725 | 7.993 | 65.97 | 0.9921 | 65.70 |
| CV | 0.4865 | 69.86 | 0.9551 | 13.7 | 71.07 | 0.9910 | 70.69 |
| Freundlich | Langmuir | ||||||
|---|---|---|---|---|---|---|---|
| n | kf (mg·g−1)(g·L−1)−1/n | r2 | qm (mg·g−1) | KL (L·g−1) | r2 | RL (mg·g−1) | |
| MB | 2.608 | 7.091 | 0.9149 | 168 | 0.001876 | 0.9775 | 0.9815 |
| CV | 2.545 | 8.609 | 0.8674 | 253 | 0.001671 | 0.9642 | 0.9966 |
| T (K) | ΔG (J·mol−1) | ΔH (J·mol−1) | ΔS (J·K−1·mol−1) | |
|---|---|---|---|---|
| MB | 273 | −2392.7 ± 42.1 | −539.3 ± 42.1 | 6.789 ± 0.8 |
| 298 | −2562.42 ± 42.1 | |||
| 313 | −2664.26 ± 42.1 | |||
| CV | 273 | −5520.3 ± 120.8 | −1125 ± 120.8 | 16.1 ± 2.1 |
| 298 | −5922.8 ± 120.8 | |||
| 313 | −6164.3 ± 120.8 |
| Dye | Adsorbent | Adsorption Capacity (mg.g−1) | Reference |
|---|---|---|---|
| MB | Bamboo-based activated carbon | 454 | [63] |
| MB | Magnetic Fucus vesiculosus | 577.1 | [63] |
| MB | Coconut shell activated carbon | 277 | [63] |
| MB | Rice husk activated carbon | 343 | [63] |
| MB | Magnetic polyvinyl alcohol/Laponite RD | 251 | [64] |
| MB | Jute fiber carbon | 225 | [65] |
| MB | Magnetic spongin | 168 | Present work |
| CV | OC-BzM nanoparticles | 248 | [66] |
| CV | Magnetic Fucus vesiculosus | 1062 | [63] |
| CV | CarAlg/MMt nanocomposite hydrogel | 88 | [67] |
| CV | Nanomagnetic iron oxide | 16 | [68] |
| CV | Magnetically modified activated carbon | 67 | [68] |
| CV | Gum arabic-cl-poly(acrylamide) nanohydrogel | 99 | [69] |
| CV | Magnetic 3D spongin–Fe3O4 | 253 | Present work |
Publisher’s Note: MDPI stays neutral with regard to jurisdictional claims in published maps and institutional affiliations. |
© 2021 by the authors. Licensee MDPI, Basel, Switzerland. This article is an open access article distributed under the terms and conditions of the Creative Commons Attribution (CC BY) license (https://creativecommons.org/licenses/by/4.0/).
Share and Cite
Akbari, M.; Jafari, H.; Rostami, M.; Mahdavinia, G.R.; Sobhani nasab, A.; Tsurkan, D.; Petrenko, I.; Ganjali, M.R.; Rahimi-Nasrabadi, M.; Ehrlich, H. Adsorption of Cationic Dyes on a Magnetic 3D Spongin Scaffold with Nano-Sized Fe3O4 Cores. Mar. Drugs 2021, 19, 512. https://doi.org/10.3390/md19090512
Akbari M, Jafari H, Rostami M, Mahdavinia GR, Sobhani nasab A, Tsurkan D, Petrenko I, Ganjali MR, Rahimi-Nasrabadi M, Ehrlich H. Adsorption of Cationic Dyes on a Magnetic 3D Spongin Scaffold with Nano-Sized Fe3O4 Cores. Marine Drugs. 2021; 19(9):512. https://doi.org/10.3390/md19090512
Chicago/Turabian StyleAkbari, Maryam, Hessam Jafari, Mojtaba Rostami, Gholam Reza Mahdavinia, Ali Sobhani nasab, Dmitry Tsurkan, Iaroslav Petrenko, Mohammad Reza Ganjali, Mehdi Rahimi-Nasrabadi, and Hermann Ehrlich. 2021. "Adsorption of Cationic Dyes on a Magnetic 3D Spongin Scaffold with Nano-Sized Fe3O4 Cores" Marine Drugs 19, no. 9: 512. https://doi.org/10.3390/md19090512
APA StyleAkbari, M., Jafari, H., Rostami, M., Mahdavinia, G. R., Sobhani nasab, A., Tsurkan, D., Petrenko, I., Ganjali, M. R., Rahimi-Nasrabadi, M., & Ehrlich, H. (2021). Adsorption of Cationic Dyes on a Magnetic 3D Spongin Scaffold with Nano-Sized Fe3O4 Cores. Marine Drugs, 19(9), 512. https://doi.org/10.3390/md19090512