Article

Polar Lipids Composition, Antioxidant and Anti-Inflammatory Activities of the Atlantic Red Seaweed Grateloupia turuturu

1
Mass Spectrometry Centre, LAQV-REQUIMTE, Department of Chemistry, University of Aveiro, Santiago University Campus, 3810-193 Aveiro, Portugal
2
CESAM-Centre for Environmental and Marine Studies, Department of Chemistry, University of Aveiro, Santiago University Campus, 3810-193 Aveiro, Portugal
3
ALGAplus—Production and Trading of Seaweed and Derived Products Lda., 3830-196 Ilhavo, Portugal
4
ECOMARE, CESAM-Centre for Environmental and Marine Studies, Department of Biology, University of Aveiro, Santiago University Campus, 3810-193 Aveiro, Portugal
*
Author to whom correspondence should be addressed.
Mar. Drugs 2021, 19(8), 414; https://doi.org/10.3390/md19080414
Submission received: 20 June 2021 / Revised: 14 July 2021 / Accepted: 23 July 2021 / Published: 26 July 2021

Abstract

:
Grateloupia turuturu Yamada, 1941, is a red seaweed widely used for food in Japan and Korea which was recorded on the Atlantic Coast of Europe about twenty years ago. This seaweed presents eicosapentaenoic acid (EPA) and other polyunsaturated fatty acids (PUFAs) in its lipid fraction, a feature that sparked the interest on its potential applications. In seaweeds, PUFAs are mostly esterified to polar lipids, emerging as healthy phytochemicals. However, to date, these biomolecules are still unknown for G. turuturu. The present work aimed to identify the polar lipid profile of G. turuturu, using modern lipidomics approaches based on high performance liquid chromatography coupled to high resolution mass spectrometry (LC–MS) and gas chromatography coupled to mass spectrometry (GC–MS). The health benefits of polar lipids were identified by health lipid indices and the assessment of antioxidant and anti-inflammatory activities. The polar lipids profile identified from G. turuturu included 205 lipid species distributed over glycolipids, phospholipids, betaine lipids and phosphosphingolipids, which featured a high number of lipid species with EPA and PUFAs. The nutritional value of G. turuturu has been shown by its protein content, fatty acyl composition and health lipid indices, thus confirming G. turuturu as an alternative source of protein and lipids. Some of the lipid species assigned were associated to biological activity, as polar lipid extracts showed antioxidant activity evidenced by free radical scavenging potential for the 2,2′-azino-bis-3-ethyl benzothiazoline-6-sulfonic acid (ABTS+) radical (IC50 ca. 130.4 μg mL−1) and for the 2,2-diphenyl-1-picrylhydrazyl (DPPH) radical (IC25 ca. 129.1 μg mL−1) and anti-inflammatory activity by inhibition of the COX-2 enzyme (IC50 ca. 33 µg mL−1). Both antioxidant and anti-inflammatory activities were detected using a low concentration of extracts. This integrative approach contributes to increase the knowledge of G. turuturu as a species capable of providing nutrients and bioactive molecules with potential applications in the nutraceutical, pharmaceutical and cosmeceutical industries.

Graphical Abstract

1. Introduction

Seaweeds play a central role in oceans food webs, as habitats for marine species that support biodiversity and as bioremediators through nutrient assimilation from seawater, all these features granted them a renewed attention in the blue bioeconomy [1,2,3]. Beyond the context of natural systems, seaweeds have been traditionally used as food in Asian countries and, in recent decades, the use of seaweeds as food has been increasing in the western world [4]. This trend is supported by the growing interest in their nutritional and health benefits promoted by seaweeds in the human diets [4,5]. Moreover, seaweeds are also a sustainable alternative raw material and, in particular, a potential source of polyunsaturated fatty acids (PUFA) and healthy fats to be used in multiple high-end uses [2]. Red seaweeds (Rhodophyta) are a source of many commercially important compounds, such as floridean starch and sulfated galactans, carrageenans and agar, minerals, vitamins, phycobiliproteins and other pigments, mycosporine-like amino acids and unsaturated fatty acids, with multiple applications [6,7]. Grateloupia turuturu Yamada, 1941 (also reported in the literature as G. doryphora), is a red seaweed native to Japan and Korea where it is traditionally used as food and a source of carrageenan-agar polymers [8]. In recent decades, this seaweed was recorded on the Atlantic Coast of Europe [9], likely originating from aquaculture activities related to oyster farming and/or global shipping [10]. Although G. turuturu is non-native species to the Atlantic and may have been erroneously labelled as an invasive species [11], it does not seem to have any negative impacts in coastal environments. In fact, G. turuturu seems to contribute to the maintenance of autochthonous seaweed species and to preserve natural biodiversity [12].
Grateloupia spp. are sea vegetables widely used as a source of proteins and lipids in countries where they are traditionally consumed, being considered a healthy and nutritious food [6]. Information on the composition of G. turuturu in the Atlantic Coast is still scarce [6]. The few studies available have shown that it has a high protein content (ca. 14.0%, up to 30.0% DW) [13,14], that it is a good source of essential amino acids [15] and that it has a high carbohydrates content (ca. 41.6%, up to 63.0% DW) [13,14]. The lipid content of G. turuturu is low, in line with what is known for other red seaweeds (ca. 0.7%, up to 4.0% DW) [14,16,17]. Nonetheless, lipids of G. turuturu are characterized by featuring a high PUFA content [15], as already reported for specimens originating from Brittany [13,16,18] and Portugal (present study). The prevailing PUFA in the lipids of G. turuturu is eicosapentaenoic acid (EPA, C20:5n-3), considered a fatty acid that is typically supplied by fish, followed by arachidonic acid (AA, C20:4n-6) [18,19]. Eicosapentaenoic acid has well-known nutritional and health benefits, including contributing to reduce the synthesis of inflammatory eicosanoids, reactive oxygen species and cytokines and giving rise to anti- inflammatory mediators [20]. In addition, EPA has been associated with the prevention of cardiovascular infections and chronic diseases [21,22] and diabetes [23], as well as exhibiting antimicrobial [23] and antioxidant activities [24]. In seaweeds, FAs are mainly found in polar lipids, such as glycolipids (GL), phospholipids (PL) and betaine lipids, important constituents of cell and plastid membranes [25]. So far, classical chromatographic-based approaches followed by off-line gas chromatography–mass spectrometry (GC–MS) analysis of FAs have been performed to tentatively identify the glycolipids and phospholipids classes on G. turuturu [16,19,26], but its polar lipidome at the molecular level has not yet been determined. This characterization is currently achieved by using high-resolution mass spectrometry (MS)-based lipidomic approaches coupled to liquid chromatography (LC), as already described for other red seaweeds [27,28,29,30]. The use of this omics approach makes it possible to identify not only PUFA carriers but also certain molecules with intrinsic bioactive properties.
In the search for bioactive compounds for sustainable use of Grateloupia spp., some studies have reported the evaluation of bioactivities of organic solvent extracts of G. turuturu (also reported in the literature as G. doryphora) and species in the same genus, such as G. filicina, G. elliptica, G. imbricata and G. lanceola [7,31,32,33,34]. Methanol, acetone, ethyl acetate and chloroform extracts from G. filicina have shown good antioxidants properties as scavengers of reactive oxygen species [35] and capacities of reducing lipid peroxidation in oils and DNA damage in rat lymphocytes [36]. Remarkably, the fat content of some extracts has been found to correlate with antioxidant activity. Ethyl acetate extracts obtained from G. elliptica revealed anti-inflammatory activity by showing the capacity to inhibit the production of pro-inflammatory mediators, such as nitric oxide (NO), prostaglandin E2 (PGE2), interleukin-6 (IL-6) and tumor necrosis factor-α (TNF-α) [37]. The biological potential of Grateloupia extracts has generated more interest due to their beneficial effects in the prevention of chronic diseases and aging. A supplementation with 20% of G. turuturu biomass increased the longevity of Drosophila melanogaster, while a formula containing 100% G. turuturu achieved the highest antigenotoxic potential against streptonigrin-induced genotoxicity [33]. Grateloupia turuturu mixed diet is a promising complementary source of lipids in abalone aquaculture [38], thus reinforcing the potential use of this seaweed as a source of nutritious lipids in feed applications.
In order to increase our knowledge of this seaweed, in the present study, we evaluated the nutritional value of G. turuturu by performing a thorough characterization of the polar lipidome using LC–MS and fatty acid profiling using GC–MS, followed by calculation of health lipid indices. The antioxidant activities of the lipid extracts were carried out by evaluating their potential for scavenging free radicals against the 2,2-diphenyl-1-picrylhydrazyl (DPPH) and 2,2′-azino-bis-3-ethyl benzothiazoline-6-sulfonic acid (ABTS) radicals and the anti-inflammatory activity of the lipid extracts was evaluated based on the capacity to inhibit the cyclooxygenase-2 (COX-2) enzyme.

2. Results

2.1. Lipids Content and Carbon/Nitrogen Ratio

The total lipid content of G. turuturu was 0.88% ± 0.25% of dry weight biomass (DW). The total content of lipid, carbon, nitrogen and protein, along with the C/N ratio of G. turuturu, are presented in Table 1. The tissue carbon-to-nitrogen ratio (C/N) accounted for 8.30 ± 0.19. The protein content accounted for 26.26% ± 0.69% DW.

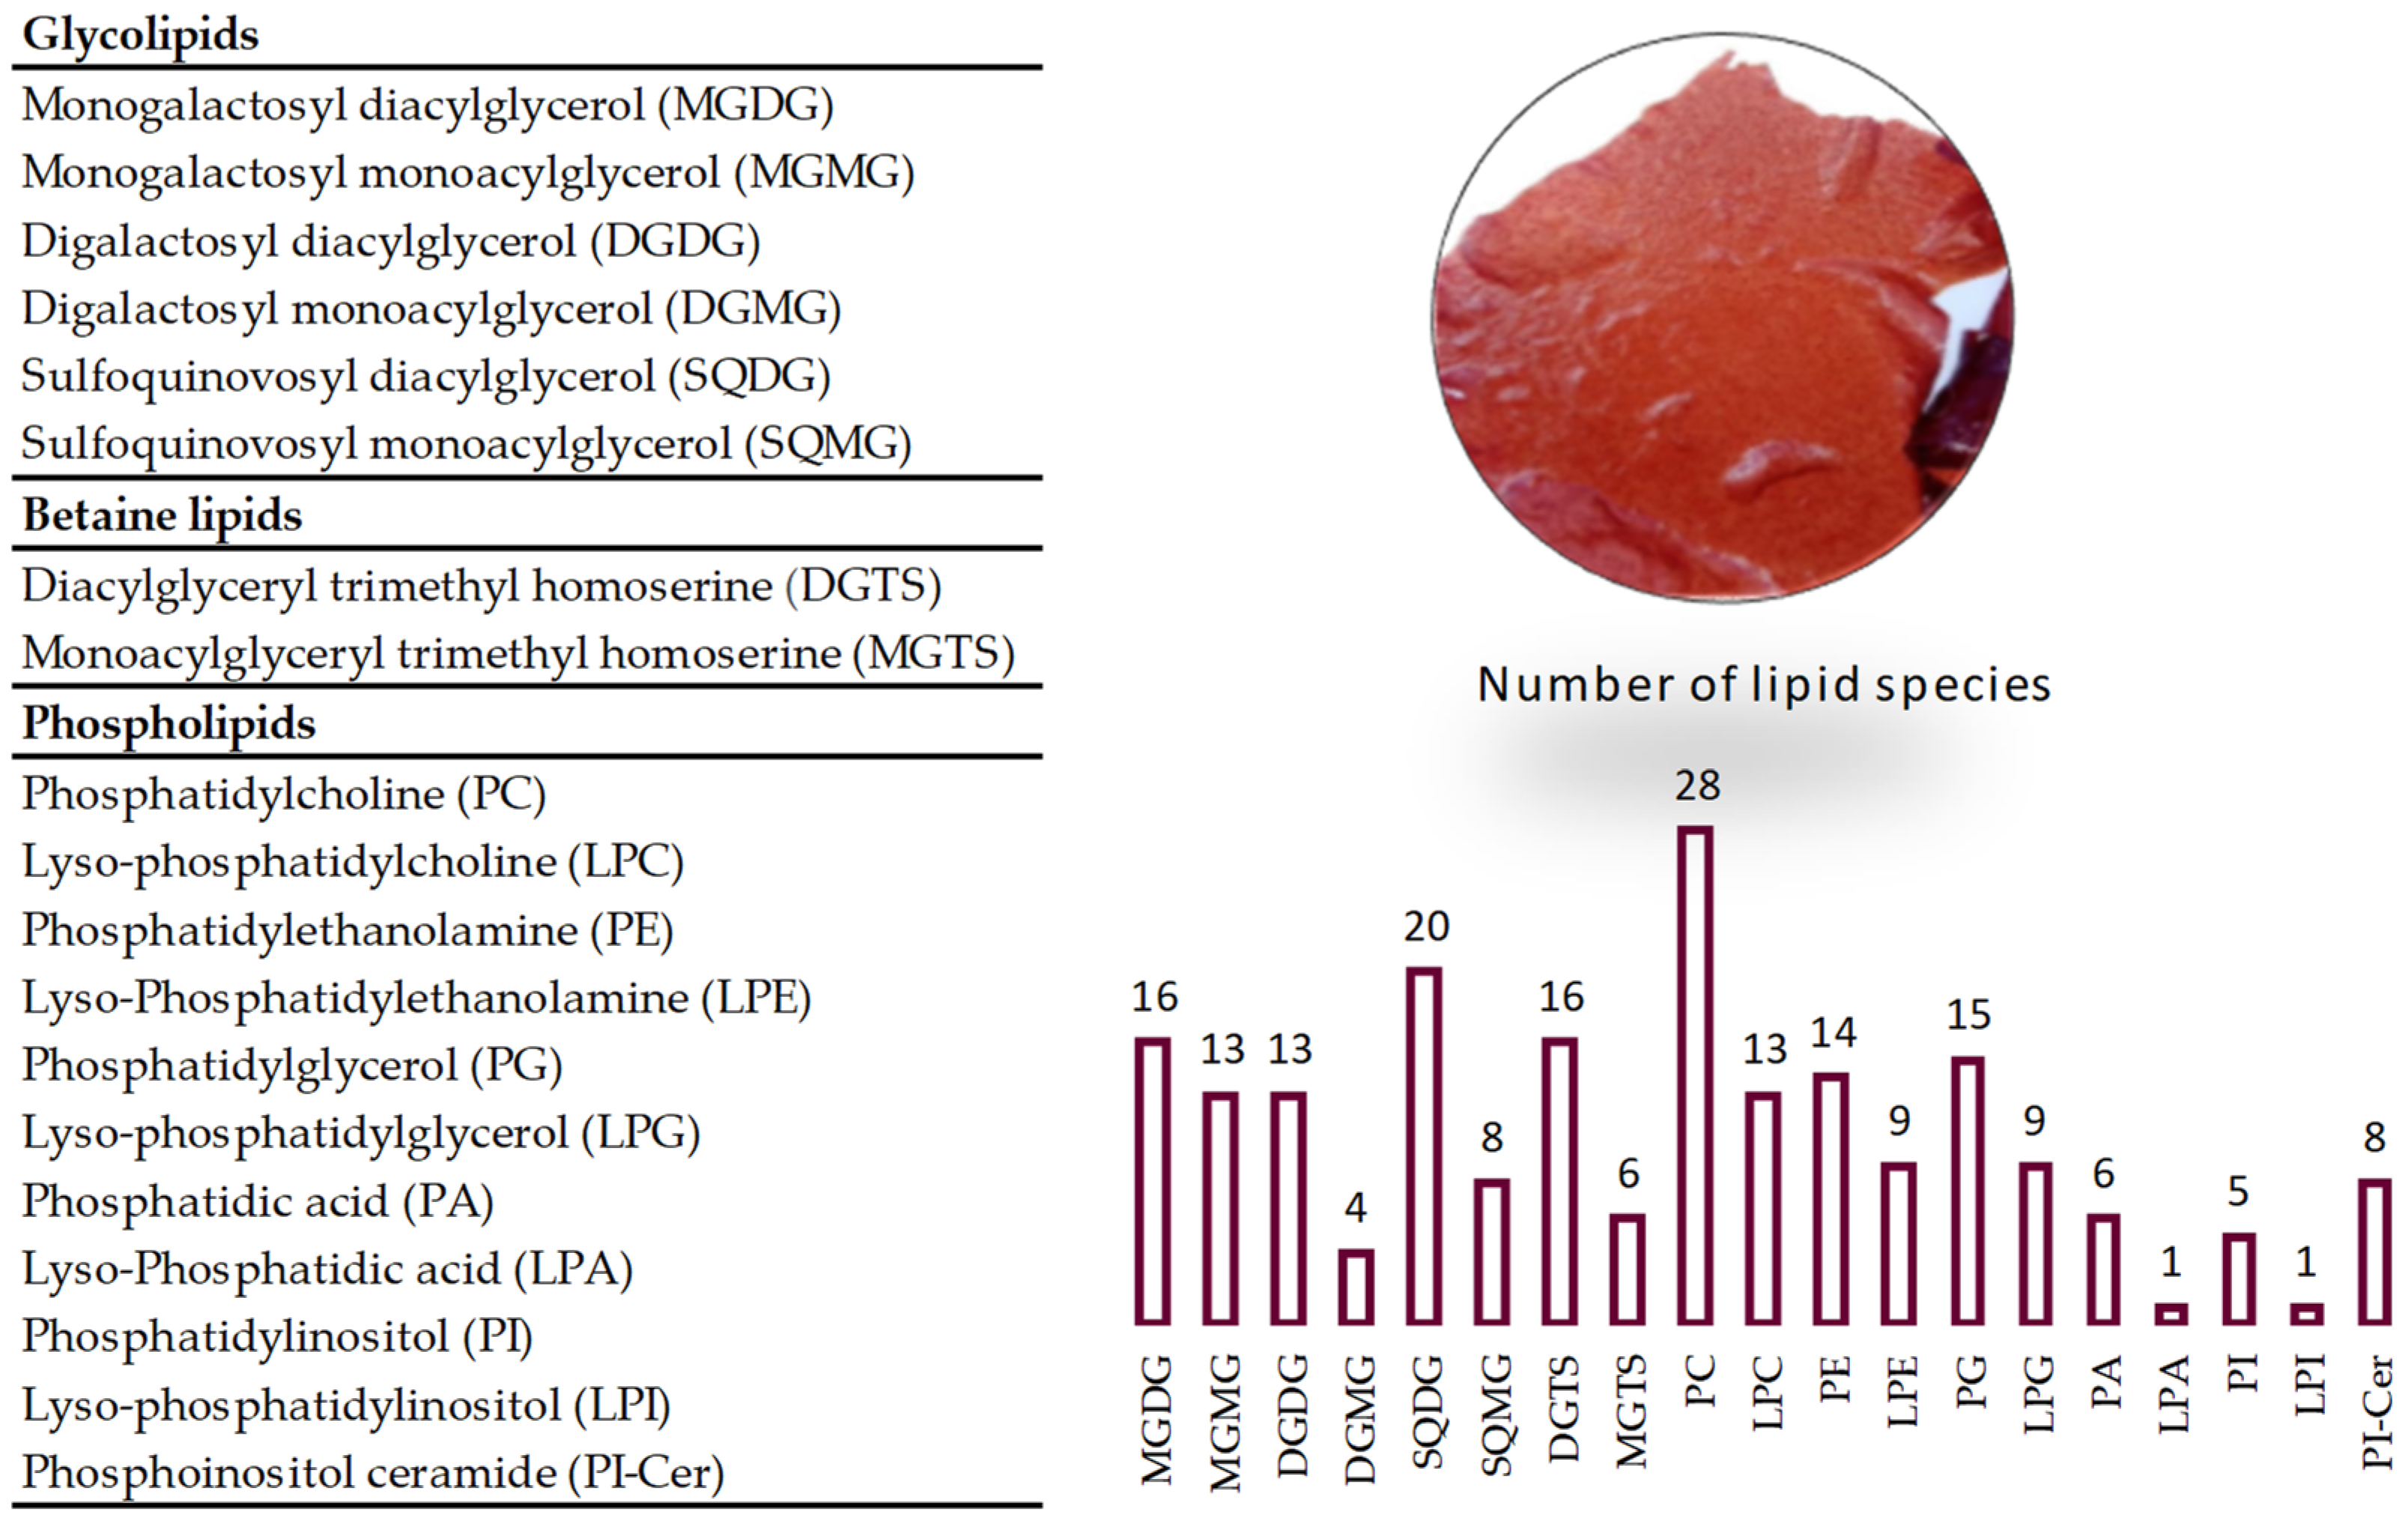
2.2. Lipidome of Grateloupia turuturu

A total of 205 lipid species (m/z values) were identified, with these being distributed over glycolipids (74 species), phospholipids (109 species) and betaine lipids (22 species) (Figure 1).

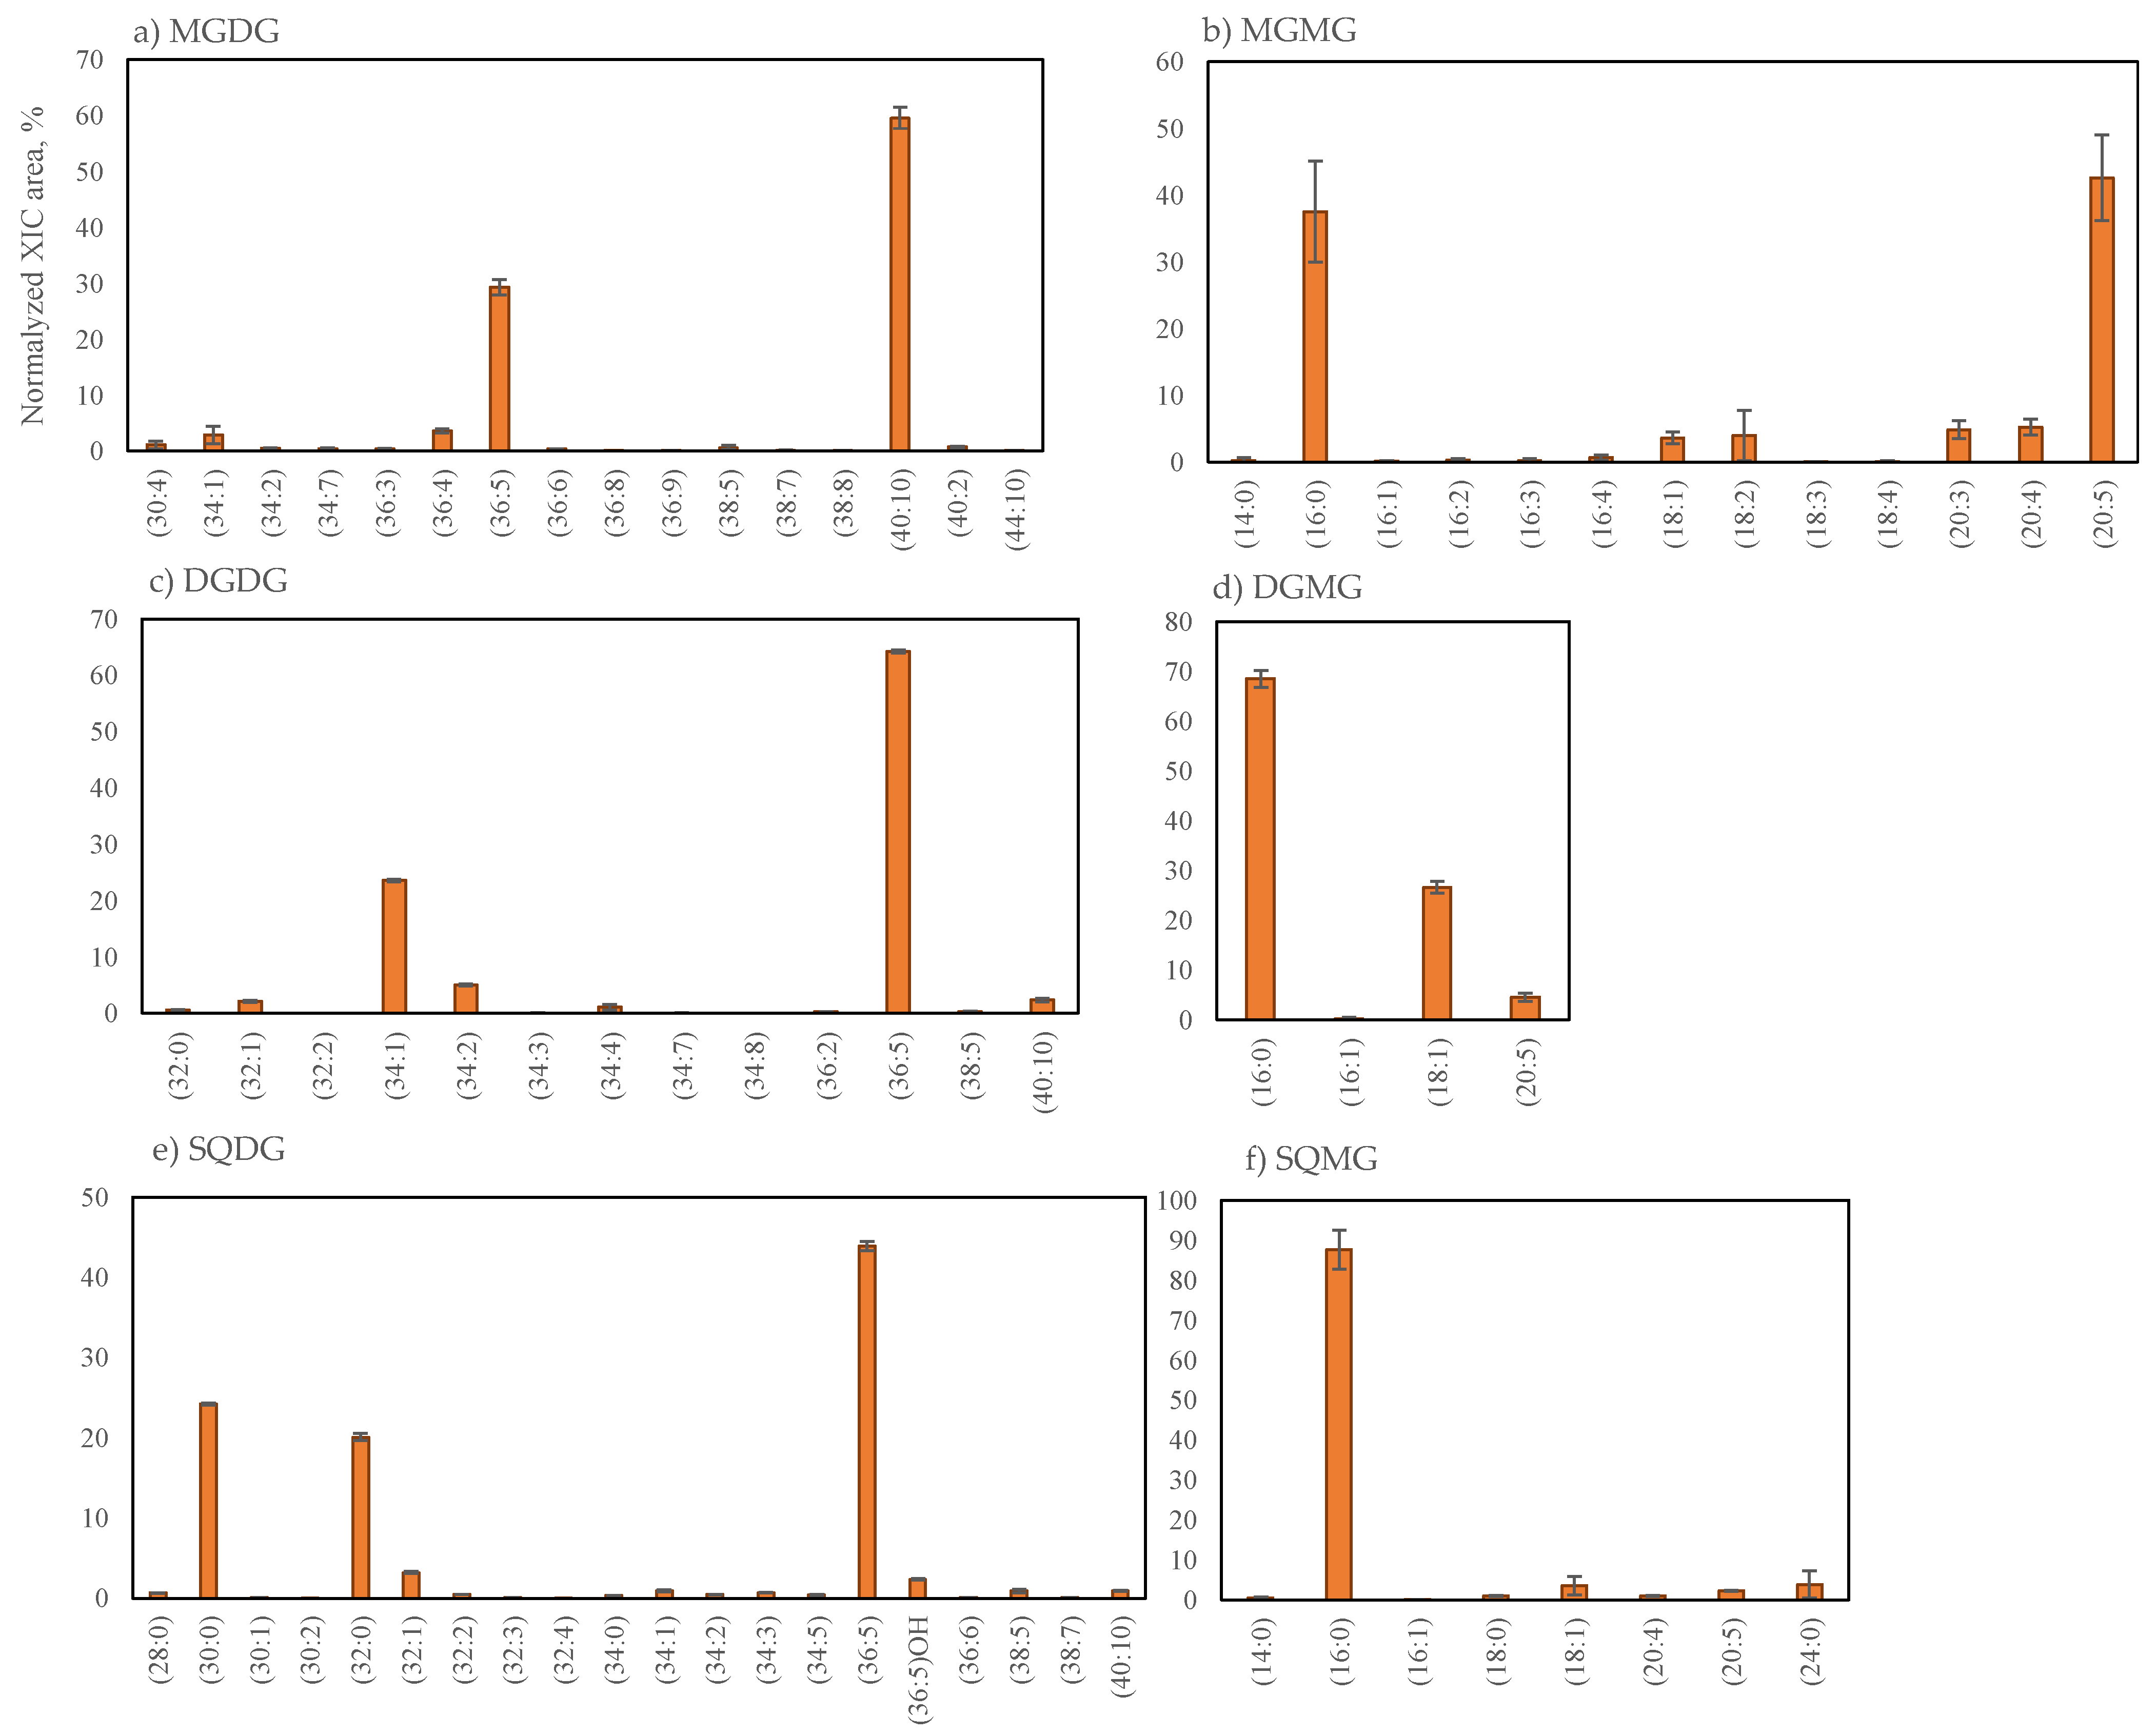
2.2.1. Glycolipids Profile of Grateloupia turuturu

The glycolipids species (GLs) identified in G. turuturu included the galactolipid classes MGDG (16 lipid species), DGDG (13 lipid species), MGMG (13 lipid species) and DGMG (4 lipid species) and the classes of the anionic sulfolipid SQDG (20 lipid species) and SQMG (8 lipid species). Galactolipids were identified by LC–MS as [M + NH4]+ ions and sulfolipids as [M − H] ions. The identification of the lipids species is provided in Table 2 (Supplementary Materials, Table S1, Figures S2 and S3). The relative percentage of each lipid species within each specific class was calculated and the graphical representation is shown in Figure 2.
Glycolipids species were mainly esterified with C14:0, C16-, C18- and C20-fatty acyl chains and the unsaturation degree of the lipids species (DoU) ranged between 0 and 5 for lyso-GLs (MGMG, DGMG and SQMG), 1 and 10 for MGDG and 0 and 10 for the DGDG and SQDG classes (Table 2). Our data showed that the more abundant lipid species had a total number of 36- and 40-carbons in the case of MGDG, 34- and 40-carbons in DGDG, 30-, 32- and 36-carbons in SQDG, 16- and 20-carbons in MGMG and 16-carbon in DGMG and SQMG (Figure 2). Lipid species bearing C14:0, C16:0, C16:1 and C20:5 were present at up to 10% of relative abundance (RA) in each class. Among the most abundant galactolipids species were MGDG (40:10), assigned as MGDG (20:5/20:5) at m/z 840.5633, DGDG (36:5) assigned as DGDG (20:5_16:0) at m/z 956.6315, MGMG (20:5) at m/z 556.3488, MGMG (16:0) at m/z 510.3637 and DGMG (16:0) at m/z 672.4174. In the sulfolipids class are SQDG (36:5) corresponding to SQDG (20:5_16:0) at m/z 839.4989 and SQMG (16:0) at m/z 555.2849. Hydroxy-lipid species SQDG (36:5)OH was identified in the SQDG lipid class.

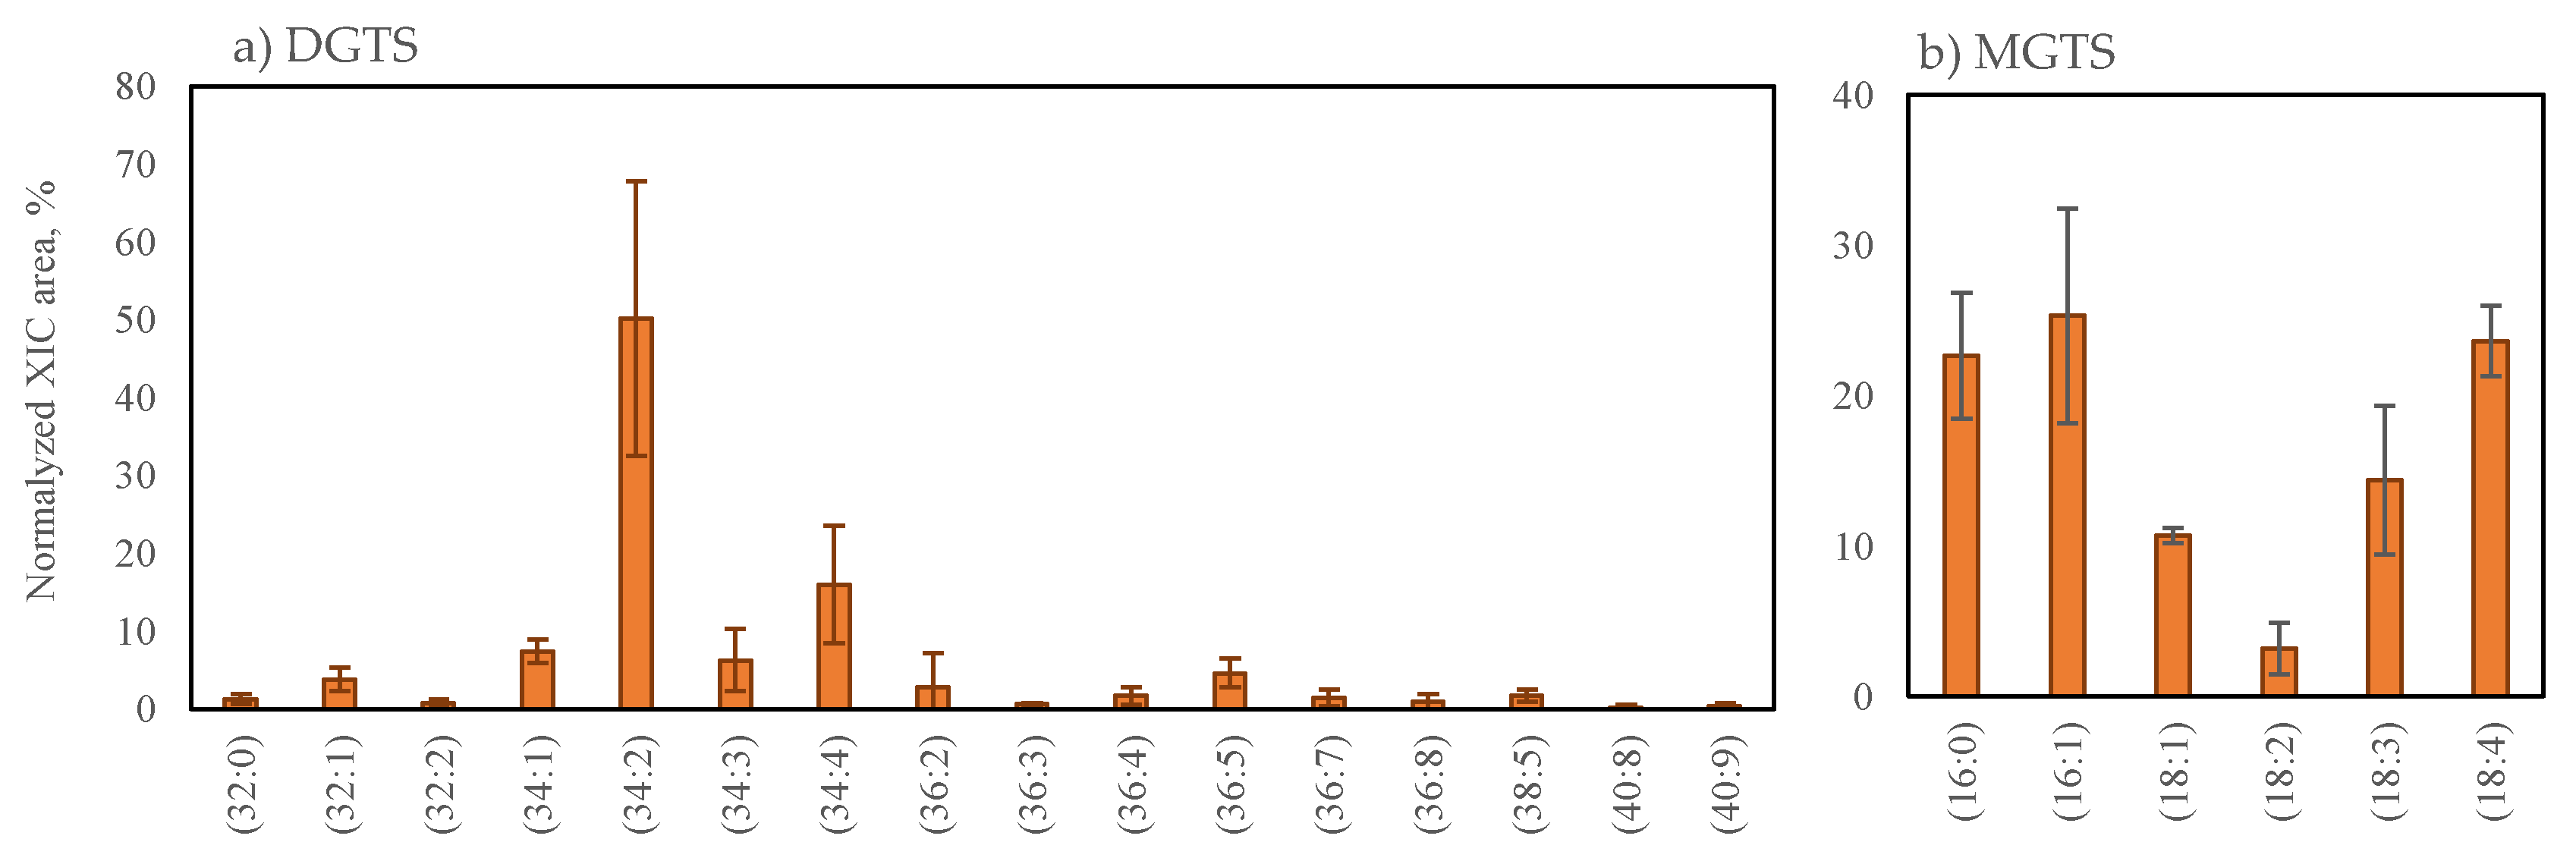
2.2.2. Betaine Lipids Profile of Grateloupia turuturu

The betaine lipids diacylglyceryl-N,N,N-trimethyl-homoserine (16 DGTS lipid species) and monoacylglyceryl-N,N,N-trimethyl-homoserine (6 MGTS lipid species) were identified in G. turuturu. Lipid species were identified using LC–MS spectra as [M + H]+ ions, as described in Table 3. The RA of lipids species within each of the aforementioned classes is shown in Figure 3 and Supplementary Materials, Figure S4. The fragmentation pattern observed in the MS/MS spectra of these lipids is shown in the Supplementary Materials (Table S1, Figure S4b,d). Betaine lipids were mainly esterified into C16- and C18-fatty acyl chains and the unsaturation degree (DoU) of lipids species ranged between 0 and 4 in the case of MGTS, while, in the case of DGTS, the DoU ranged between 0 and 9. The major lipid species of the DGTS class were the 34-carbons DGTS and the most abundant lipid species was DGTS (34:2), assigned to DGTS (16:1_18:1) at m/z 736.6101. The most abundant MGTS species had 16- and 18-carbons, namely, MGTS (16:1) at m/z 472.3631, MGTS (16:0) at m/z 474.3795 and MGTS (18:4) at m/z 494.3486.

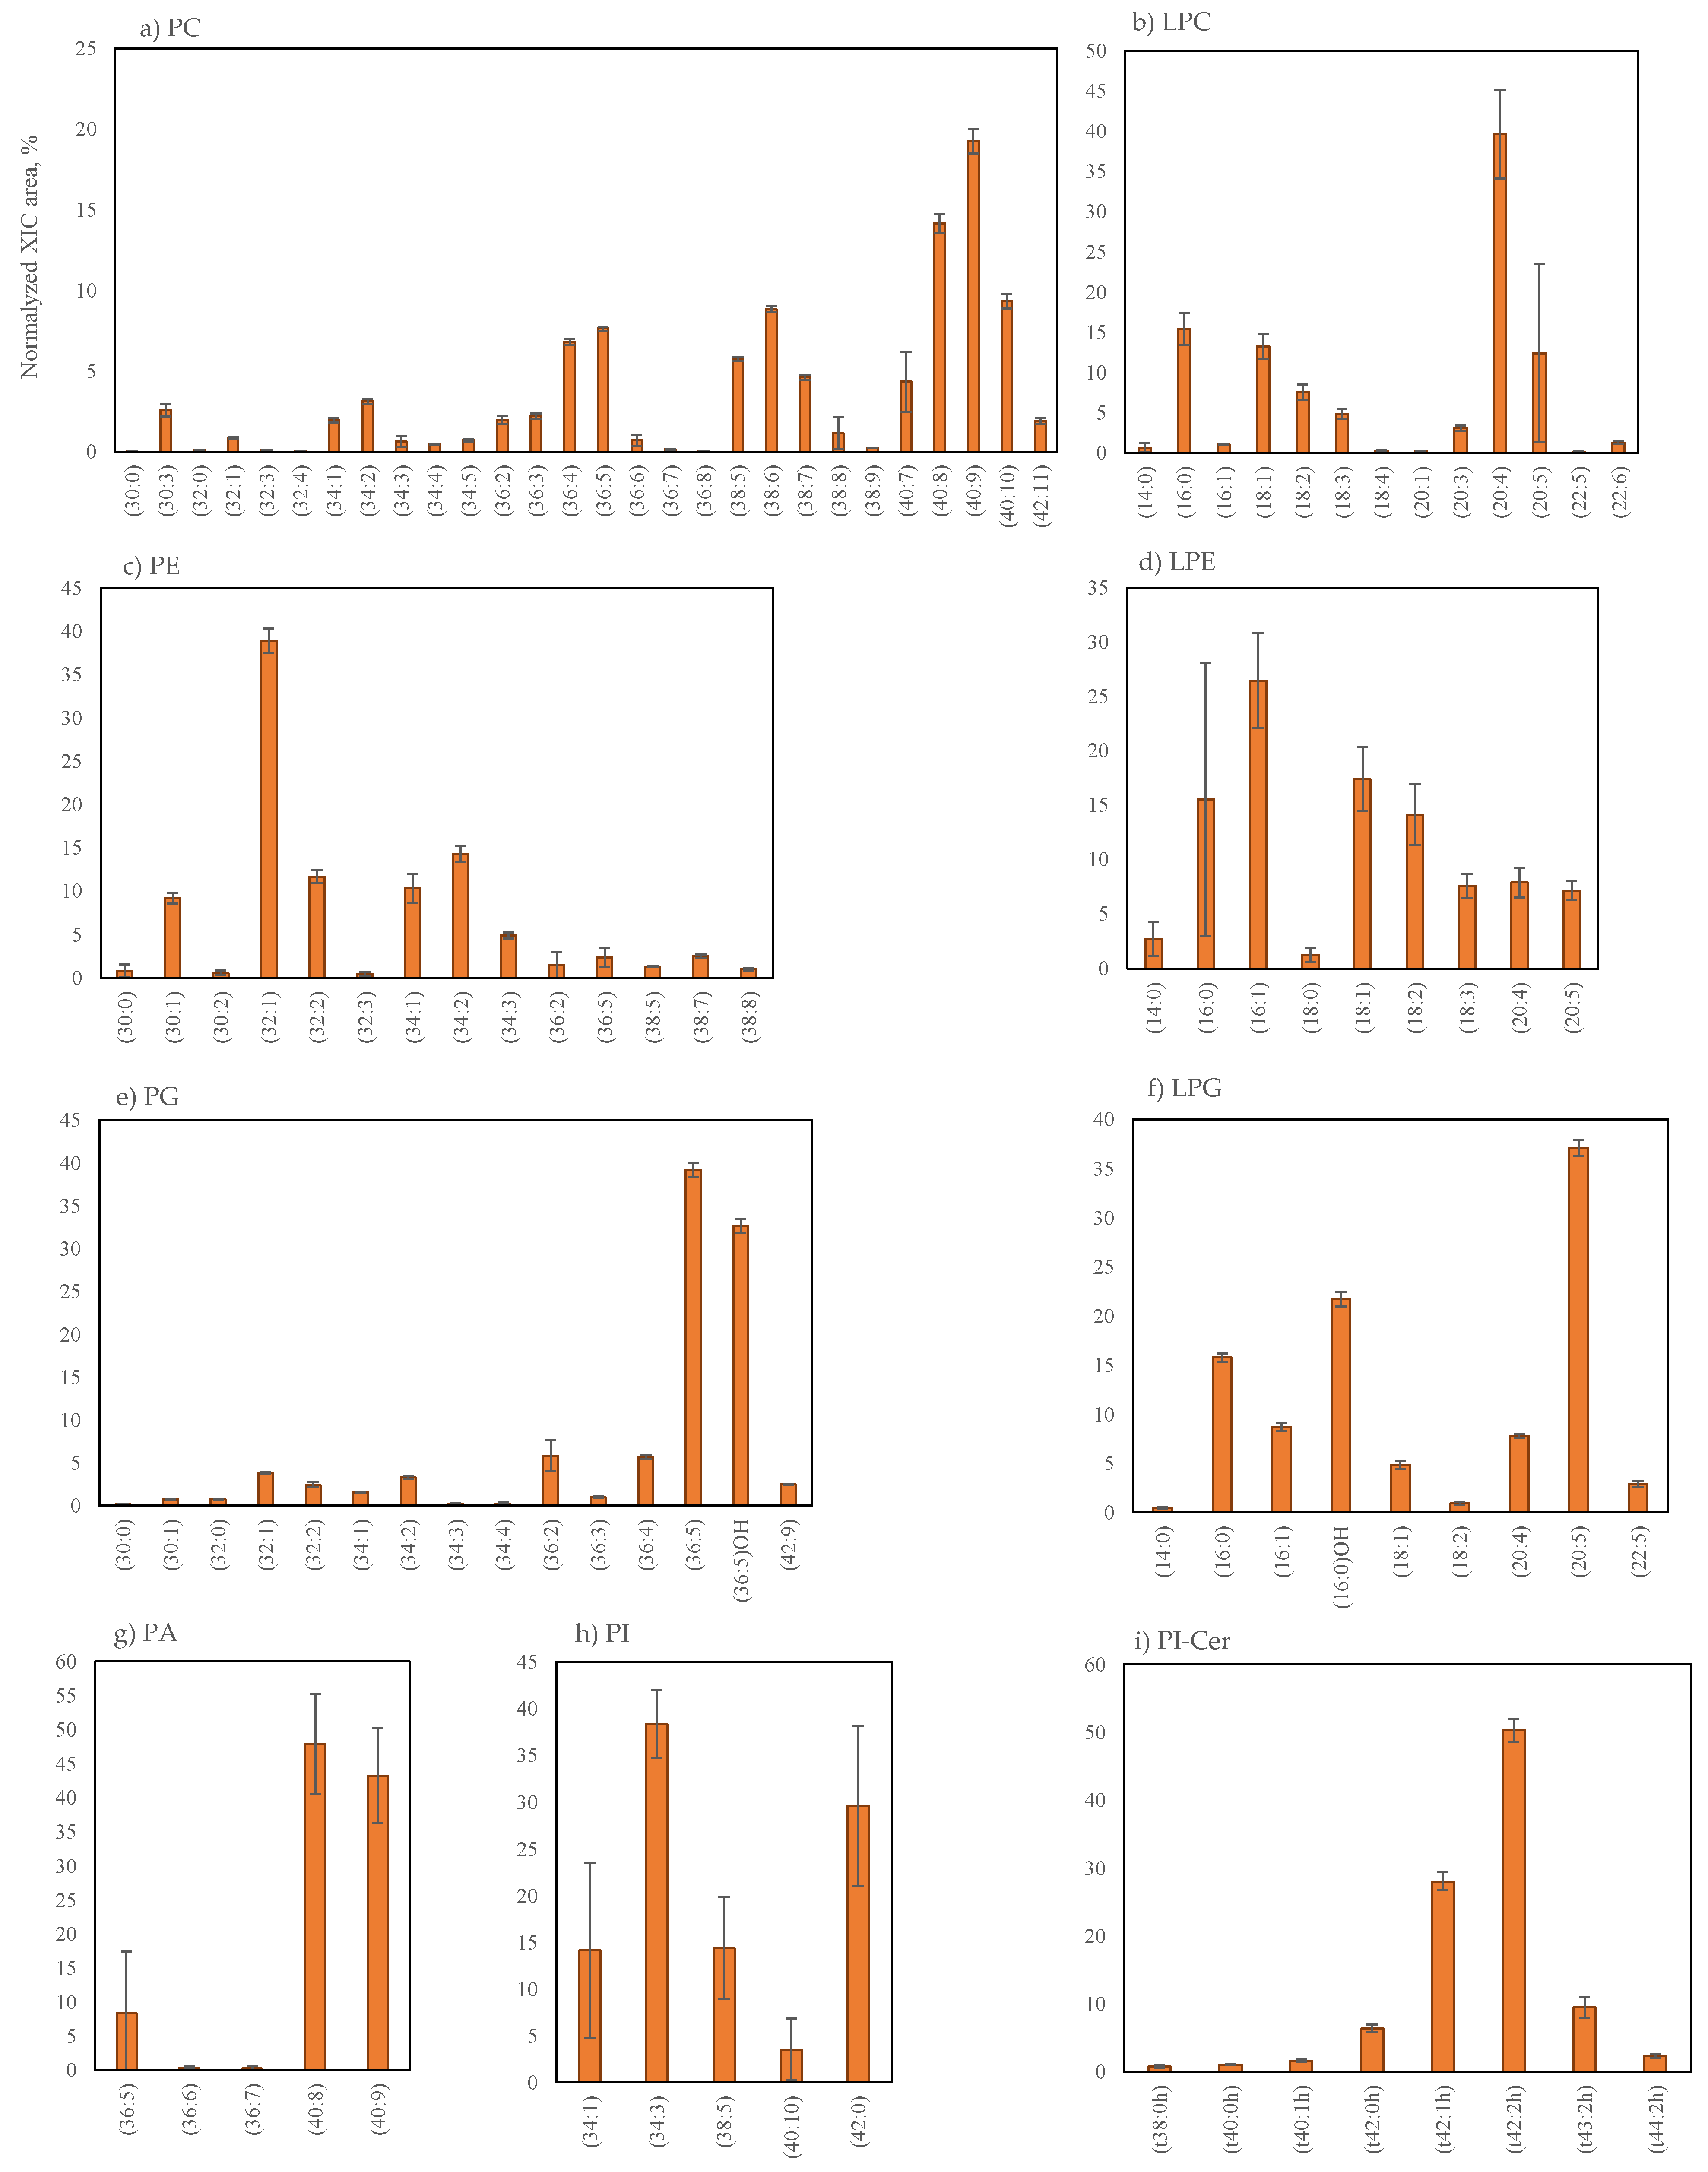
2.2.3. Phospholipids Profile of Grateloupia turuturu

Ten lipid classes were identified in the phospholipids (PLs) of G. turuturu: phosphatidylcholine (PC, 28 lipid species) and lyso-PC (LPC, 13 lipid species), phosphatidylethanolamine (PE, 14 lipid species) and lyso-PE (LPE, 9 lipid species), phosphatidylglycerol (PG, 15 lipid species) and lyso-PG (LPG, 9 lipid species), phosphatidic acid (PA, 6 lipid species) and lyso-PA (LPA, 1 lipid species) and phosphatidylinositol (PI, 5 lipid species) and lyso-PI (1 LPI species), as summarized in the Table 4. LC–MS spectra of these phospholipid classes and MS/MS data are shown in the Supplementary Materials (Table S1, Figures S5–S9). The relative percentage of each lipid species within each specific class is shown in Figure 4. The majority of PLs species included C14:0, C16-, C18- and C20-fatty acyl chains. The DoU of lipid species varied between 0 and 11, in the case of PC, between 0 and 8 in PE, between 0 and 9 in PG, between 5 and 9 in PA (that included C16- and C20-fatty acyl chains), between 0 and 10 in PI (that included C16- and C18-fatty acyl chains), between 0 and 6 in LPC and between 0 and 5 in LPE and LPG. Regarding the lyso-lipids LPI and LPA, the only lipid species identified were LPI (16:0), at m/z 571.2897 and LPA (20:4), at m/z 457.2362, respectively. The most abundant lipid species within each class included 36-, 38- and 40-carbons, in the case of PC, 32- and 34-carbons in PE, 36-carbons in PG, 40-carbons in PA and 34- and 42-carbons in PI. In the case of lyso-PLs, the most abundant lipid species included 16-,18-,20-carbons in LPC, 16- and 18-carbons in LPE and 16- and 20-carbons in LPG.
Classes PC and LPC were identified as [M + H]+ ions in the LC−MS spectra and fatty acyl composition was assigned by the identification of the carboxylate ions (RCOO−) in the LC−MS/MS of the [M + CH3OO] ions. The most abundant lipid species were PC (40:9), assigned as PC (20:4/20:5) at m/z 828.5542, and LPC (20:4) at m/z 544.3406, as observed in the Figure 4a,b and Table 4. Classes PE and LPE were identified as [M − H] and [M + H]+ ions in the LC−MS and the fatty acyl composition was assigned by the identification of the carboxylate ions (RCOO) in the LC−MS/MS spectra. The most abundant lipid species were PE (32:1), identified as PE (16:1/16:0) at m/z 688.4932, and LPE (16:1) at m/z 452.2787, as observed in the Figure 4c,d and Table 4. The molecular species of PG and LPG were identified as [M − H] ions (Figure 4e–f). The most abundant were PG (36:5) at m/z 767.4878, identified as PG (20:5/16:0) and PG (20:4/16:1), and LPG (20:5) at m/z 529.2577. The hydroxy-lipids PG (36:5)OH and LPG(16-OH) were identified in these classes. Classes PA and PI were assigned in LC−MS and MS/MS spectra as [M − H] ions. In these classes, the most abundant lipid species were PA (40:8) at m/z 743.4660, identified as PA (20:4/20:4) (Table 4, Figure 4g), and PI (34:3) at m/z 831.5030, Table 4, Figure 4h). Concerning phosphoinositol ceramides (PI-Cer), the species were identified as [M − H] ions in the LC−MS spectra (Table 4, Figure 4i). LC–MS spectra of this class and MS/MS data are shown in Figure S10 in the Supplementary Materials. The eight lipid species identified included saturated- and unsaturated-sphingosine-bases and saturated and unsaturated hydroxylated acyl chains. The most abundant lipid species included 42-carbons PI-Cer. The most abundant PI-Cer (t42:2h) at m/z 920.6240 contained the long-chain base 18:1-phytosphingosine (trihydroxy sphingoid base) and the long monounsaturated hydroxy-fatty acid having 24-carbons (PI-Cer (t18:1/h24:1).

2.2.4. Fatty Acids Profile of Grateloupia turuturu

The lipid extracts were further analysed for esterified fatty acids (FA) profiling and a total of 19 FA were identified by GC–MS after the transmethylation (Table 5, Figure S11). The FA acid profile calculated as relative abundance showed ca. 37.50% of saturated FA (SFA), ca. 16.70% of monounsaturated FA (MUFA) and ca. 49.51% of polyunsaturated FA (PUFA) (Table 5). The three fatty acids that contributed about 60% of the total FA content were palmitic acid (C16:0), the most abundant fatty acid which accounted for 60.48 ± 10.44 µg mg−1 extract, ca. 22.03% of the FA content (or 628.89 ± 47.70 µg g−1 DW biomass), eicosapentaenoic acid (EPA; C20:5n-3) which accounted for 57.18 ± 8.74 µg mg−1 extract, ca. 20.86% of FA content (or 595.19 ± 32.17 µg g−1 DW biomass), and arachidonic acid (AA, C20:4n-6) which accounted for 35.41 ± 5.76 µg mg1 extract, ca. 12.91% of FA content (368.19 ± 20.56 µg g−1 DW biomass). Stearic acid (C18:0) and oleic acid (C18:1n-9) accounted for 5.44 % and 7.44 %, respectively, while other FAs, such as linoleic acid (C18:2n-6), linolenic acid (C18:3n-3) and octadecatetraenoic acid (C18:4), were less than 5% of total FA content. Other minor fatty acids were identified, including FA with odd-number carbon chains (e.g., C15:0 and C17:0). The total content of esterified fatty acids was 273.52 ± 34.49 µg mg−1 extract (2853.16 ± 139.33 µg g−1 DW biomass).
Based on their FA profile, lipid extracts were evaluated in light of their nutritional value and potential health benefits not only by determining the fatty acids profile, but also by calculating health lipid indices, such as Σ PUFA/Σ SFA and Σ PUFA n-6/n-3 ratios, as well as nutritive value (NVI), atherogenic (AI), thrombogenic (TI), hypocholesterolemic/hypercholesterolemic (h/H) and the peroxidizability index (PI) ratios (Table 5). The ratios of Σ PUFA/Σ SFA and Σ PUFA n-6/n-3 ratios represented, respectively, 1.32 ± 0.04 and 0.87 ± 0.01. Grateloupia turuturu FA showed an n-6/n-3 ratio < 1 and an NVI of about 0.77 ± 0.03, mainly due to the highest proportion of C16:0. Both AI and TI were < 1, while the h/H index was 2.4 ± 0.12. In addition, the quality of the lipid extract expressed as the percentage of PI was 218.42 ± 30.47%.

2.3. Antioxidant Activity of the Lipid Extracts of Grateloupia turuturu

A dose-dependent increase in the scavenging capacity was observed for all concentrations tested (Figure 5). For ABTS, a 50% inhibition (IC50) of the ABTS●+ radical was achieved at a concentration of 130.4 ± 52.4 μg mL−1, which represents a TE of 7.3 ± 3.7 µmol g−1. In the DPPH assay, the IC50 value could not be calculated because the percentage of antioxidant activity was less than 50%, so the IC50 values of the extracts were outside the tested concentration range. Thus, a 25% inhibition (IC25) of DPPH was obtained at a concentration of 129.1 ± 58.7 μg mL−1, representing a TE of 83.2 ± 39.6 µmol g−1. The best radical scavenging capacity was achieved at a concentration of 250 μg mL−1 in both ABTS (89.79% ± 8.22%) and DPPH (52.21% ± 19.57%).

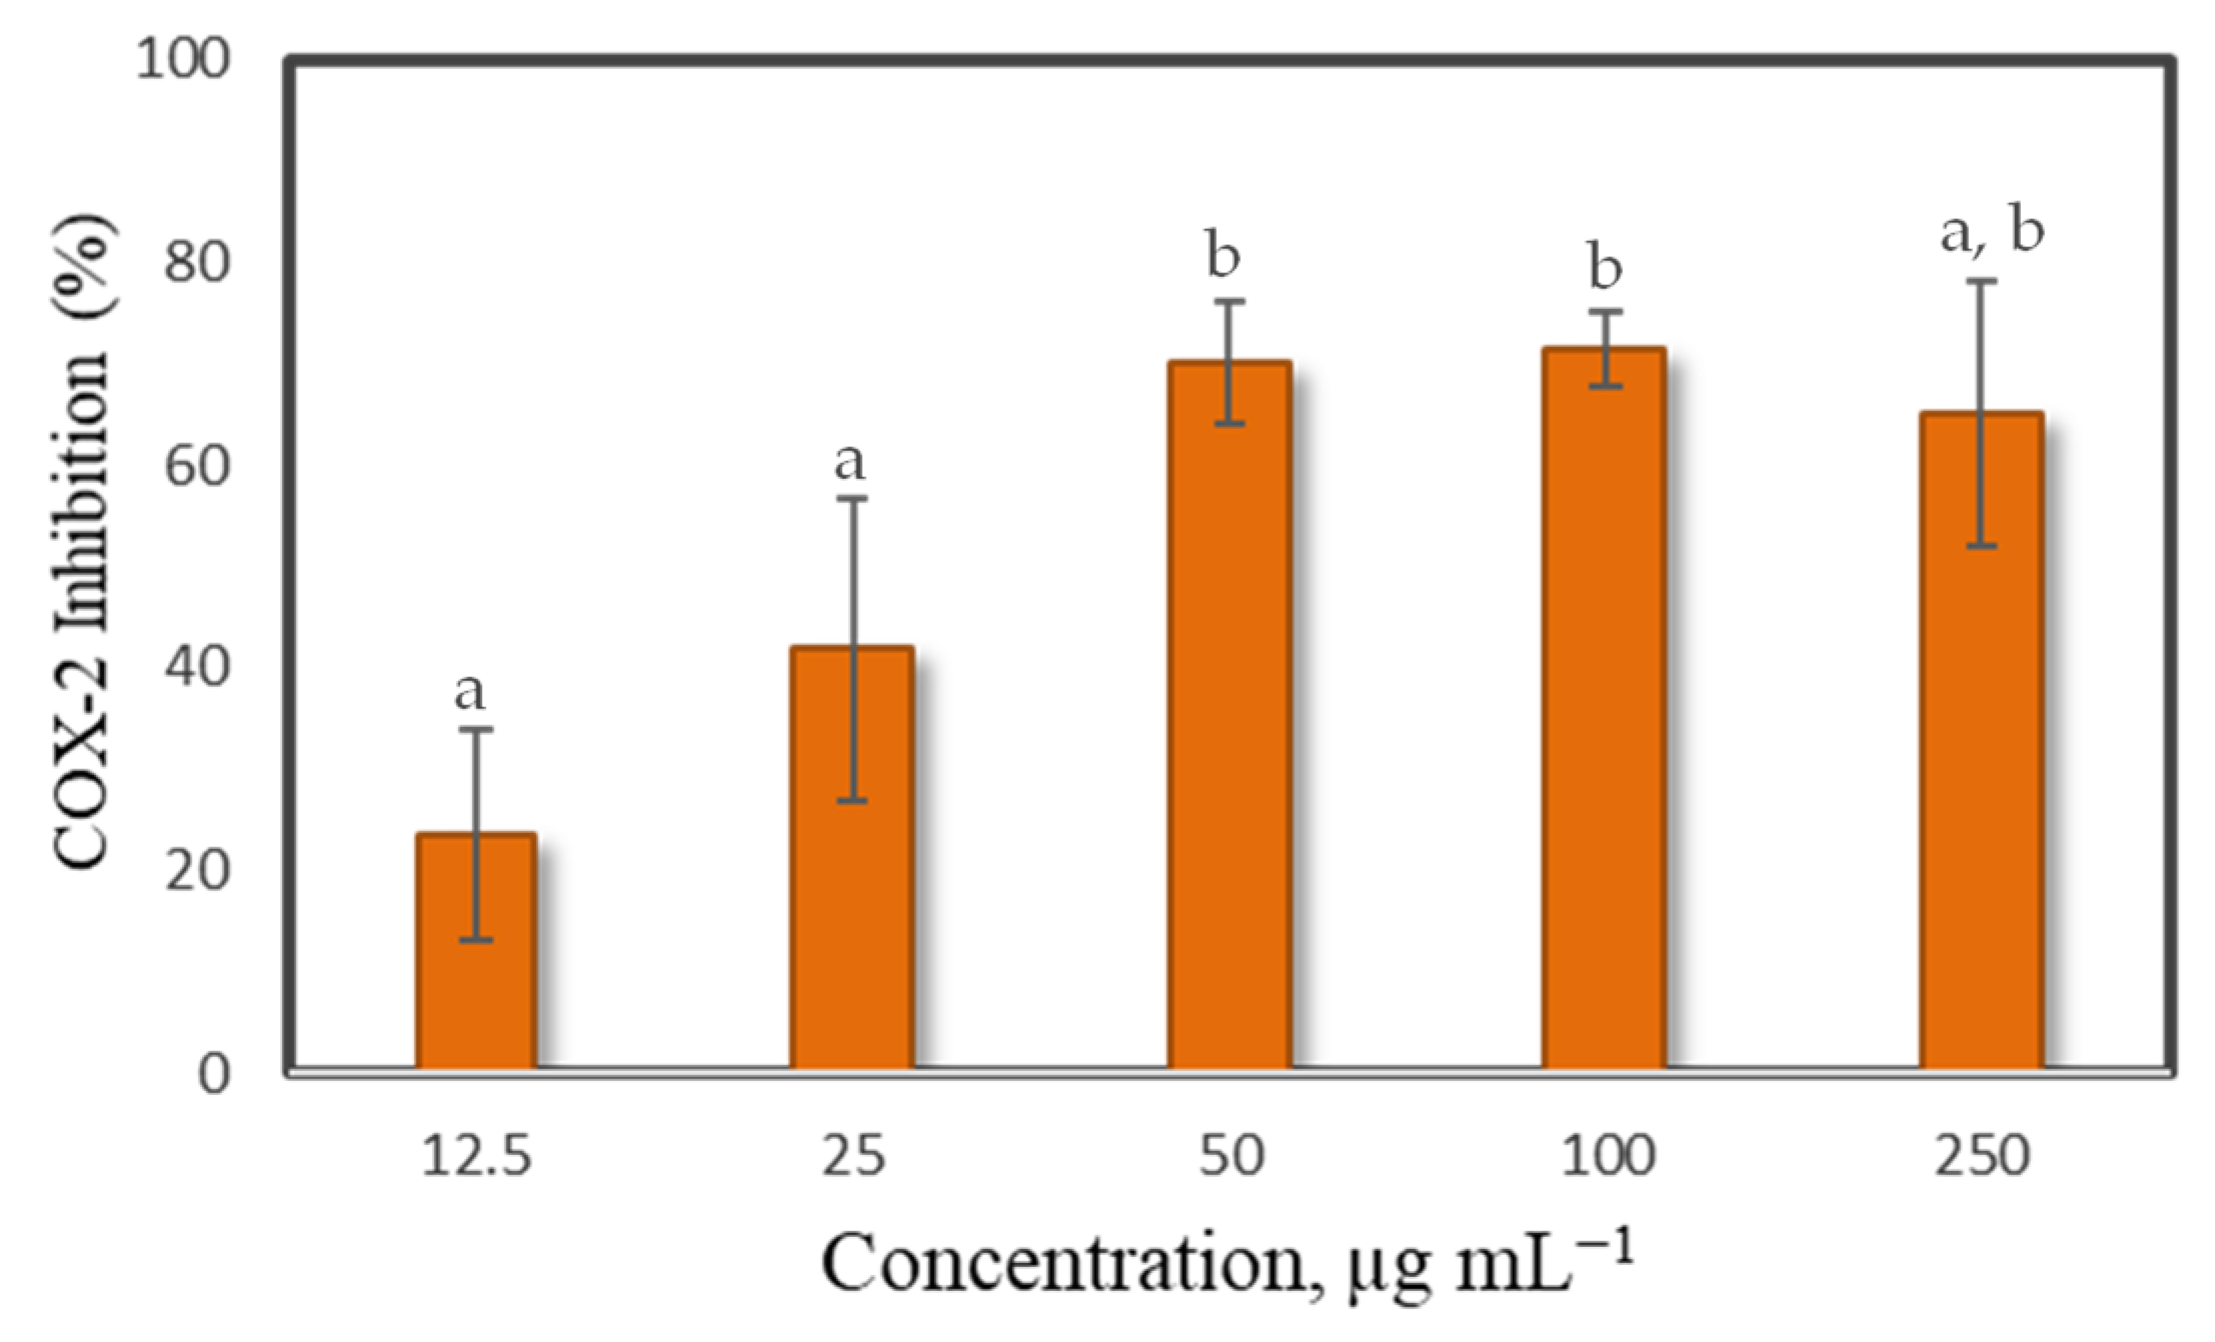
2.4. Cyclooxygenase 2 (COX 2) Enzyme Inhibitory Capacity of the Lipids Extracts of Grateloupia turuturu

All the concentrations of lipid extracts tested showed the capacity to inhibit COX-2 activity in vitro, although showing only a dose-dependent response between 12.5 and 50 µg mL−1 of lipid extract (Figure 6). However, a concentration of ca. 33 µg mL−1 was able to inhibit the PG2 production by 50%, demonstrating that the extract has a potential anti-inflammatory activity.

3. Discussion

Grateloupia turuturu is widely consumed in Asia [39] and its nutritional value is evidenced by the high proportion of proteins and n-3 fatty acid EPA (C20:5, n-3) that it displays [13,40,41]. In Europe, G. turuturu is yet to be explored, despite having EPA as one of its main fatty acids in the lipid pool, much as Palmaria palmata, a red seaweed commercially used and appreciated in western countries [42].
Grateloupia turuturu, studied in the present work, contained 26.26 ± 0.69 g 100g−1 DW of protein, in line with the levels reported for other red seaweeds [13,14]. This value is close to the maximum concentration indicated by Denis et al. for the specimens sampled on the Brittany coast [13]. The total lipid content of G. turuturu was determined and accounted for 0.88 ± 0.25 g 100 g−1 of biomass in dry weight (DW). This result is consistent with data from the literature (ca. 0.7%, up to 4.0% DW) [14,17,43,44] and in line for that of other red seaweeds [28,45,46,47]. Low fat and high protein content make red seaweeds a promising alternative for non-animal proteins [48,49]. In addition, the obtained C/N ratio of 8.30 ± 0.19 (Table 1) represents a value quite similar to those of nitrophilic red seaweeds, values below the proposed critical limit of 10 [50]. This value expresses a balanced nutrient status of G. turuturu [51,52] and corresponds to the trend high protein–low lipid relationship as found in our study.
The nutritional value of G. turuturu was also demonstrated by the profiling of FAs and the calculation of nutritional indices (Table 5). The saturated FA level was lower than that previously described for G. turuturu from Brittany [13] and within the range reported by Hotimchenko for G. turuturu sampled in the Sea of Japan [44]. Palmitic acid (C16:0) was the most abundant FA (ca. 22.03%) followed by C20:5n-3 (ca. 20.86%) (Table 5), as previously described by Rodrigues et al. [15] and Hotimchenko [44], but different from those reported by Denis et al. [13] and Kendel et al. [16,19], who obtained a 2.0-fold relationship of C16:0 versus C20:5n-3 FA in G. turuturu. This difference was attributed to both environmental conditions and genetic status of the seaweed [13].
Eicosapentaenoic acid is the main PUFA in the lipid extract of G. turuturu (5.7 g per 100 g−1 of lipid extract (ca. 0.06 g of EPA per 100 grams of DW biomass, or ca. 0.01 g of EPA per 100 grams of fresh biomass)), that can be proximate to certain n-3 in fish such as dogfish [53]. According to U.S. Food and Drug Administration (FDA, https://www.fda.gov/food, accessed on 13 May 2021), new recommendations for the consumption of EPA and DHA claim that a daily dose of, at least, 0.8 g of EPA and DHA (combined total) provides a beneficial effect on health. Taking into account the EPA content of the lipid extract of G. turuturu, ca. 14 g of lipid extract (1.4 times a tablespoon) would provide proximately 0.8 g of EPA per serving. The nutritional value of G. turuturu extracts was corroborated by the PUFA/SFA ratio calculated in the present work, as it was greater than the recommended threshold 0.45, as well as by its n-6/n-3 ratio (<1). These values are consistent with those previously reported in Grateloupia spp. [15] and other red seaweeds [46] and have been associated with human health benefits, such as the prevention of noncommunicable and cardiovascular diseases [54,55]. The nutritive index (NVI) obtained (0.77 ± 0.03) was clearly driven by the higher proportion of C16:0, compared to C18:0 and C18:1 FA. The calculated AI and TI were < 1 and < 0.5, respectively, as recommended to be protective against coronary artery disease [56]. The values of AI and TI were within the reported for the red seaweeds Porphyra dioica [29] and P. palmata [46] and marine fish [57]. The ratio between hypocholesterolemic and hypercholesterolemic fatty acids (h/H index) is also within the values reported for marine fish [57]. Finally, the quality of lipid extract and the stability of PUFA included in food and its vulnerability to oxidation, evaluated by calculating the peroxidizability index (PI percentage), achieved a value of 218.42 ± 30.47%, thus expressing a balanced relation between the required amount and type of PUFA that guarantees a protective effect for coronary disease. Therefore, G. turuturu can be used in the food industry applications contributing to dietary recommendations of SFA and PUFA intake (http://www.fao.org, accessed on 13 May 2021).
Polar lipids from seaweeds are considered high-value lipids with beneficial health effects fostering seaweed valorization. The lipidome of G. turuturu was identified here for the first time using an approach based on liquid chromatography–mass spectrometry, which allowed the identification of 205 lipid species distributed over glycolipids, betaine lipids, phospholipids and phosphoinositol ceramides PI-Cer (Table 2, Table 3 and Table 4). The complex lipids (polar lipids) from seaweeds are gaining a new interest because they are the key carriers of PUFAs and feature bioactive properties [58,59]. The classes of glycolipid were previously identified for G. turuturu [19] and G. jilicina [60] by using preparative thin-layer chromatography and the PL was determined by HPLC coupled to an evaporative light scattering detector [16]. Betaine lipids and PI-Cer classes were identified in the lipidome of G. turuturu for the first time in the present study but have already been described in other red seaweeds [26], such as Porphyra dioica [29] and Palmaria palmata [46]. It is also worth referring that PI-Cer lipids are considered to be biomarkers of Rhodophyta [46,61,62].
Several glycolipids and phospholipids identified in the G. turuturu lipidome were esterified to EPA, including the most abundant lipid species in most classes, as described for P. palmata [46]. Marine polar lipids are considered to be important carriers of n-3 fatty acids with higher n-3 PUFA levels than triglycerides (TAG) [63,64]. The bioavailability of PUFAs comprising n-3 FAs is also considered to be higher when these FAs are esterified into polar lipids, namely PL, compared to TAG [65]. In addition, polar lipids such as glycolipids and phospholipids from seaweeds are recognized by their wide range of bio functionalities [66] and the interest in these healthy and bioactive molecules is growing. Polar lipids can be used as an ingredient for food fortification in PUFA and in functional food, or used as emulsifying agents in the food industry [63,64,65,66].
In this study, the antioxidant and cyclooxygenase-2 inhibitory actions of the lipid extract of G. turuturu were tested. The concentrations necessary to inhibit the activity of the DPPH radical by 20% are of the same order as that reported for G. gracilis (IC20 119.5 ± 1.8 µg mL−1) and P. palmata (IC20 119.6 ± 8.0 µg mL−1) [67]. Our results reveal that a polar lipid extract of G. turuturu features antioxidant activity at low concentrations. The scavenging activity of G. filicina extracts, obtained using other organic solvent systems (e.g., ethyl acetate, chloroform, or acetone) [35], was a 50% inhibition achieved at higher concentrations (2 mg mL−1 of extract). In the same study, chloroform extracts had higher antioxidant activity than commercial antioxidants, such as BHA (butylated hydroxyanisole), BHT (butylated hydroxytoluene) and a-tocopherol [35]. Overall, G. turuturu lipid extracts exhibit antioxidant activity and can be used as natural antioxidants for food and feed, as a dietary supplement to nutraceuticals, or as an active ingredient in functional foods or cosmeceuticals promoting health and prevention against damages caused by free radicals. Other potential applications include food processing industries to prevent oxidation and replace synthetic antioxidants. The antioxidant effects of natural products are necessary both for health and wellbeing to counter oxidative stress [68,69], but also for the preservation and packaging of food to increase shelf life through reduction of lipid peroxidation [70].
The ability of lipid extracts from G. turuturu to inhibit COX-2 and, thus, reducing the formation of PGH2, was herein demonstrated reaching 50% inhibitory effect at 33 µg mL−1 (Figure 6). Our findings show that these extracts were more effective than those from other red seaweeds, such as P. palmata and P. dioica, which achieved more than 80% inhibition of COX-2 using 500 µg mL−1 of lipid extract [67]. Cyclooxygenase-2 (COX-2) is a key enzyme in fatty acid metabolism that is upregulated in inflammation. COX-2 is induced by proinflammatory cytokines and enhances the synthesis of prostaglandins, which stimulates inflammation response [54]. Targeted inhibition of COX-2 is a promising approach to inhibit inflammation, with phytonutrients and phytochemicals holding the potential to act in this regulation [71]. These results are in line with those reported by Yang et al. [37], who showed the anti-inflammatory effect of ethyl acetate extracts from G. elliptica on the inhibition of prostaglandin E2 (PGE2) in a macrophages cell line (IC50 values of the same order found in this study). In the same work, inhibition of the production of pro-inflammatory mediators such as nitric oxide (NO) was also reported. Even though no lipid species have so far been attributed to this specific activity, several lipid species that were well-represented in the lipid extracts of G. turuturu analyzed in the present work (MGDG and DGDG contained (20:5/20:5), (20:5/20:4), (18:4/16:0), (20:4/16:0), (20:5/16:0) and (20:5/14:0), SQDG (20:5/14:0), PG (20:5/16:0), PG (20:5/16:1) and PC (20:5/20:5)), have been reported to be related with anti-inflammatory activity on the downregulation of iNOS in macrophages [72,73]. These lipid species were isolated from extracts of red seaweeds Chondrus crispus and P. palmata. All of those lipid species contained C20:5(n-3) FA and showed higher activity than the free FA C20:5(n-3), suggesting that a higher bioactivity was likely due to the polar head of these molecules. These characteristics support per se the growing interest in polar lipids from seaweeds, principally those originating from red seaweeds [67]. Particularly, GLs bearing n-3 PUFA have been related to bioactive properties, such as antibacterial, antitumoral and antiviral activities, enhancing the pharmacological potential of these compounds [58]. Recent research associated with galactolipids “takes us back to our origins” by reminding that eating vegetables provides access to n-3 FA and contributes to the balance anti-inflammatory (n-3) and pro-inflammatory (n-6) fatty acids [74]. It is known that PLs display anti-inflammatory, anti-oxidant, anti-fibrogenic, anti-apoptotic, membrane-protective and lipid-regulating effects, with a positive impact on several diseases, apparently without significant side effects [63]. Although the market for marine PLs is still in its early stages, there is a growing trend to use marine PLs to supply n-3 PUFA for the global food and dietary supplements market [63]. All beneficial effects of marine lipids should be considered venues for future research.
In summary, G. turuturu lipids can be used in the food industry, using the seaweed biomass as an ingredient for food fortification and functional foods (e.g., dairy products or supplements), or by using the lipid extracts as ingredients for nutraceutical, pharmaceutical and cosmeceutical applications, providing valuable products to be explored for commercialization [75]. Lipidomics can therefore be used for screening the biomass with the best composition in polar lipids richer in PUFA and with the most promising bioactivities, allowing the selection of the seaweed strains for commercial exploitation [6,29].
Overall, the findings reported in the present work add value to G. turuturu and contribute to the development of blue bioeconomy.

4. Materials and Methods

4.1. Reagents

All chemicals and reagents were purchased from Fisher Scientific Ltd. (Loughborough, UK), unless otherwise specified [71]. Lipid standards were purchased from Avanti Polar Lipids, Inc. (Alabaster, AL, USA) [71]. Ammonium acetate and 6-hydroxyl-2,5,7,8-tetramethylchromane-2-carboxylic acid (Trolox) were purchased from Sigma-Aldrich (St Louis, MO, USA). 2,2-Diphenyl-1-picrylhydrazyl (DPPH) was purchased from Aldrich (Milwaukee, WI, USA). 2,2′-Azino-bis-3-ethylbenzothiazoline-6-sulfonic acid diammonium salt (ABTS) was obtained from Fluka (Buchs, Switzerland). Milli-Q water (Synergy, Millipore Corporation, Billerica, MA, USA) was used.

4.2. Collection of Macroalgae and Preparation of Biomass

The specimens of the red seaweed G. turuturu Yamada were hand-harvested in Ria de Aveiro coastal lagoon (Gafanha da Nazaré, Portugal, 40°39′ N, 8°43′ W) in February 2017 (winter). Samples were rinsed with fresh water, cleaned of epiphytes, if present, and oven-dried at 30 °C in an air tunnel (up to ca. 13% moisture content was achieved). Biomass of at least 5 specimens was used, five replicates of ca. 200 mg to extract total lipids and three replicates of 2 mg to determine the C/N ratio.

4.3. Proximate Elemental Composition Analysis

Elemental analysis (C and N) (2 mg × 3 replicates) was performed using an elemental analyzer (Leco TruspecMicro CHNS 630-200-200) at the combustion furnace temperature of 1075 °C and an afterburner temperature of 850 °C. The carbon-to-nitrogen ratio (C/N) was calculated through tissue C (g 100 g−1 dry weight biomass, DW)/tissue N content (g 100 g−1 DW) ratio (excluding moisture from sample weight). The nitrogen–protein conversion factor 6.25 was used to estimate protein content.

4.4. Lipid Extraction

The lipid content was determined by gravimetry. Lipids were extracted from weighed samples (200 mg each, for a total of 5 replicates) by adding 3 mL of methanol: chloroform mixture (2:1, v/v) to each sample replicate in glass tubes with Teflon-lined screw caps (modified Bligh and Dyer method used in the Marine Lipidomics Laboratory [28,71]). The organic phase was collected first and the remaining biomass residue was re-extracted twice. Water (2 mL) and chloroform (2 mL) were added to the collected total organic phase and the lower organic phase was collected for drying under a stream of nitrogen gas. The content of total lipid extract was estimated by gravimetry and stored at –20 °C, under a nitrogen atmosphere, before analysis. The five replicates were analyzed by LC–MS.

4.5. Hydrophilic Interaction Liquid Chromatography−High Resolution Mass Spectrometry (HILIC−MS) and Tandem Mass Spectrometry (MS/MS)

Analysis of lipid extracts was performed in a high-performance liquid chromatography (HPLC) Ultimate 3000 Dionex (Thermo Fisher Scientific, Bremen, Germany) system with an autosampler and coupled online to the Q-Exactive® hybrid quadrupole Orbitrap® mass spectrometer (Thermo Fisher Scientific, Waltham, MA, USA). An Ascentis Si column (150 mm × 1 mm, 3 μm, Sigma-Aldrich, St. Louis, MO, USA) and a two-phases-solvent system (mobile phase A, acetonitrile/methanol/water (50:25:25, v/v/v) with 1 mM ammonium acetate; mobile phase B, acetonitrile/ methanol (60:40, v/v) with 1 mM ammonium acetate) were employed for the separation of lipids by HILIC-chromatography, as previously described [71]. The injection volume was 5 μL of each sample containing 10 μg of lipid extract, a volume of 4 μL of a mixture of phospholipid standards mix, described in da Costa et al. (2020) [71], and 86 μL of mobile phase B.
The MS employed was equipped with Orbitrap technology and was operated using a positive/negative switching toggle between positive (electrospray voltage of 3.0 kV) and negative (electrospray voltage of 2.7 kV) ion modes, with a capillary temperature of 250 °C and sheath gas flow of 15 arbitrary units (a.u.). Mass spectra were acquired using data-depending acquisition (DDA) mode, with cycles of one full-scan mass spectrum (mass resolving power of 70,000 full width at half-maximum, automatic gain control target of 1 × 10⁶, 200–1600 m/z scan range) and ten data-dependent MS/MS scans (resolution of 17,500 width at half-maximum and automatic gain control target of 1 × 10⁵) with the dynamic exclusion of 60 s and intensity threshold of 1×10⁴, repeated continuously throughout the experiments. Tandem MS fragmentation was performed by higher-energy collisional dissociation (HCD), using stepped normalized collision energy ranging between 25, 30 and 35 eV. Data acquisition was carried out using the Xcalibur data system (V3.3, Thermo Fisher Scientific, MA, USA).

4.6. Data Analysis and Lipids Identification

Data acquisition was performed using the Xcalibur data system (V3.3, Thermo Fisher Scientific, Waltham, MA, USA). Peak integration and HPLC–MS data assignments were performed using MZmine 2.42 and the predefined parameters for data processing, as described in similar approaches published by the Marine Lipidomics Group [30]. Lipid identification was performed by matching the LC retention time (shown in the total ion chromatograms, Supplementary Materials, Figure S1), with the assignment of the molecular ions observed in the LC–MS spectra (Figures S2–S8), with an accuracy of mass measurements < 5 ppm (Table 2, Table 3 and Table 4). Additionally, manual analysis of MS/MS spectra confirmed the identity of the polar head and fatty acyl composition of most of the identified lipid the molecular species (Supplementary Materials, Table S1 and Figures S2–S10). Typical fragmentation rules used to generate the assignments were included [71]. The normalization of lipid species was completed by dividing the exported values of integrated peak areas of each lipid species by the value of the peak area of a standard lipid species with the closest retention time.

4.7. Analysis of Fatty acid by Gas Chromatography–Mass Spectrometry (GC–MS)

Fatty acid methyl esters (FAMEs) were prepared by an alkaline well-established methodology [28,71,76]. A 70 µg aliquot of the lipids extracted from each sample was derivatized in a screw cap glass tube. Transesterification was performed by transferring 1 mL of a standard of methyl nonadecanoate (C19:0, 74208, Sigma-Aldrich, St. Louis, MO, USA) solution in hexane (1.27 μg mL−1) and 200 µL of KOH 2 M methanol. An aliquot of 600 μL of the upper phase was collected, dried under a stream of nitrogen gas and, subsequently, 120 μL of hexane was added to prepare the final solution for GC–MS analysis.
A 2 μL subsample of the FAME solution in hexane obtained from the derivatization was injected in an Agilent 8860 GC System gas chromatograph with GC 5977B Network Mass Selective Detector operating at 70 eV at 250 °C and equipped with a DBFFAP (Agilent 123-3232, 30 m × 320 µm × 0.25 µm) column. GC–MS was equipped with an auto sampler with a splitless injector at 220 °C. The separation of FAME was carried out with helium being used as the carrier gas (constant flow rate of 1.4 mL min−1) and using a temperature program for the column starting at 80 °C during 2 min and increasing to 160 °C at 25 °C/min, heating up to 210 °C at 2 °C/min, then to 225 °C at 20 °C/min and holding for 20 min. The system employed includes a Mass Selective Detector operating in Electron Ionization (EI) mode at 70 eV and scanning the mass range m/z 50–550 in a 1 s cycle in a full scan mode acquisition. Analyses were always replicated (at least n = 3). Methyl esters were identified using the software Agilent MassHunter Qualitative10.0, supported by NIST2014 mass spectral library, by comparing their retention time and MS spectra with those of Sigma-Aldrich standards (37 Component FAME Mix, Sigma-Aldrich) and by MS spectra comparison with online databases (AOCS lipid library). Quantitative analysis of FA was achieved from calibration curves of each methyl ester of FA from a FAME mixture (Supelco 37 Component FAME Mix, CRM47885, Sigma Aldrich, St. Louis, MO, USA), analyzed by GC–MS under the same conditions of extracts, with results being expressed as µg mg−1 of extract and µg g−1 of dry biomass. The relative amounts of FAs were calculated using the ratio of the amount of each FAME and the sum of all FAMEs identified; results are expressed as means (%, w/w). Nutritional, health and quality indices nutritive value (NVI), atherogenic (AI), thrombogenic (TI), hypocholesterolemic/hypercholesterolemic (h/H) and peroxidizability indices (PI) were determined according to the literature [56].

4.8. 2,2′-Azino-bis-3-Ethylbenzothiazoline-6-Sulfonic Acid Radical Cation Assay—ABTS Radical Scavenging Activity

The antioxidant scavenging activity against the 2,2′-azino-bis-3-ethyl benzothiazoline-6-sulfonic acid radical cation (ABTS●+) was evaluated using a previously described method [77]. The ABTS radical solution (3.5 mmol L−1) was prepared. This mixture was kept for 16 h in the dark at room temperature; then, it was diluted in ethanol to obtain an absorbance value of ~0.9, measured at 734 nm using a UV-vis spectrophotometer (Multiskan GO 1.00.38, Thermo Scientific, Hudson, NH, USA). Radical stability was determined as reported by Santos et al. [77]. For an evaluation of the radical scavenging potential, a volume of 150 µL of each lipid extract of G. turuturu (12.5-250 µmol L−1 in ethanol, n = 4), or 150 µL of Trolox standard solution (10–75 µmol L−1), was placed in each well, followed by the addition of 150 µL of ABTS●+ diluted solution. Control lipid assays were prepared by replacing 150 µL of ABTS●+ diluted solution with 150 µL of ethanol. The % of the ABTS radical remaining was determined according to Equation (1); free radical-scavenging activity of samples was calculated as the percentage of inhibition of the ABTS radical (Equation (2)). The concentration of samples reducing 50% of the ABTS radical after 120 min (IC50) were calculated by linear regression using the concentration of samples and the percentage of the inhibition curve. The activity was expressed as Trolox Equivalents (TE, µmol Trolox/g of sample) according to Equation (3). The significant differences (p < 0.05) calculated by Kruskal–Wallis with Dunn’s multiple comparisons were used to analyze the results between groups (GraphPad Prism 8).
% ABTS remaining = (Abs samples after incubation time/Abs sample at the beginning of reaction) × 100
% Inhibition = ((Abs ABTS − (Abs samples − Abs control))/Abs ABTS) × 100
(TE = IC50 Trolox (µmol L−1) × 1000/IC50 of samples (µg mL−1)

4.9. 2,2-Diphenyl-1-Picrylhydrazyl Radical Assay—DPPH Radical Scavenging Activity

The antioxidant scavenging activity against the 2,2-diphenyl-β-picrylhydrazyl radical (DPPH) was evaluated using a previously described method [77]. A stock solution of DPPH in ethanol (250 µmol L−1) was prepared and diluted to provide a working solution with an absorbance value of ~0.9, measured at 517 nm using a UV-Vis spectrophotometer (Multiskan GO 1.00.38, Thermo Scientific, Hudson, NH, USA). The evaluation of the radical stability was determined as previously reported [77]. For evaluation of the radical scavenging potential, a volume of 150 µL of each lipid extract of G. turuturu (12.5–250 µmol L−1, n = 4), or 150 µL of Trolox standard solution (10–75 µmol L−1), was placed in each well, followed by the addition of 150 µL of a DPPH diluted solution and, again, an incubation period of 120 min before measuring absorbance at 517 nm every 5 min. The % of the DPPH radical remaining was calculated according to Equation (4); free radical-scavenging activity of samples was determined as the percentage of inhibition of the DPPH radical (Equation (5)); the concentration of samples reducing 25% of the DPPH radical after 120 min (IC25) was calculated by linear regression using the concentration of samples and the percentage of the inhibition curve. The activity expressed, as TE (µmol Trolox g−1 of sample), was determined (Equation (6)). The significant differences (p < 0.05) calculated by Kruskal–Wallis with Dunn’s multiple comparisons were used to analyze the results between groups (GraphPad Prism 8).
% DPPH remaining = (Abs samples after incubation time/Abs sample at the beginning of reaction) × 100
% Inhibition = ((Abs DPPH − (Abs samples − Abs control))/Abs DPPH) × 100
TE = IC25 Trolox (µmol L−1) × 1000/IC25 of samples (µg mL−1)

4.10. Cyclooxygenase 2 (COX 2) Enzyme Inhibitory Capacity of Lipid Extract

The inhibition potential against COX-2 was carried out by enzyme immunoassay (EIA) kit (catalogue No. 701080, Cayman Chemical Company, Ann Arbor, MI, USA), as described by the manufacturer (https://www.caymanchem.com/pdfs/701080.pdf, accessed on 6 March 2021) [67,71]. Lipid extracts were dissolved in 100% DMSO and five concentrations ranging between 12.5 and 250 µg mL−1 were tested. The amount of prostaglandin F2α generated from AA in the cyclooxygenase reaction was determined by spectrophotometry at 412 nm using a Multiskan GO 1.00.38 (Thermo Scientific, Hudson, NH, USA). The results are expressed as a percentage of inhibited COX-2. The significant differences (p < 0.05) calculated by Kruskal–Wallis with Dunn’s multiple comparisons were used to analyze the results between groups (GraphPad Prism 8).

5. Conclusions

The present work provides the first insight on the G. turuturu lipidome, its nutritional value and its anti-oxidant and anti-inflammatory potential. The lipid and protein composition of this red seaweed, the profiles of fatty acids and lipid species and the health lipid indices determined demonstrated the nutritional value of G. turuturu. The biomass of this red seaweed can therefore be considered as a potential source for food, feed and other high-end uses. For industrial applications, structural characterization efforts are essential for the valorization of these lipids. The antioxidant free radical scavenging potential and cyclooxygenase-2 inhibitory activity were investigated and activities were achieved at low concentrations of extracts. The lipid extracts of G. turuturu constitute an interesting offer of natural and effective molecules to fight against pathological complications linked to free radicals and to be used in industry. Overall, our findings will likely inspire future studies targeting G. turuturu as a source of nutritive biomass and bioactive molecules for nutraceutical, pharmaceutical and cosmeceutical applications.

Supplementary Materials

The following are available online at https://www.mdpi.com/article/10.3390/md19080414/s1, Table S1: Typical fragmentation patterns observed by Tandem Mass Spectrometry used to identify the head group and fatty acyl composition of polar lipids structures from Grateloupia turuturu (NL-neutral loss; PI-product ion), Figure S1: Representative examples of HILIC–LC–MS chromatograms of the polar lipids extracts from G. turuturu acquired on positive mode (a) and negative mode (b), Figure S2: LC–MS spectra of the galactolipids classes of Grateloupia turuturu monogalactosyl diacylglycerol, MGDG (a); monogalactosyl monoacylglycerol, MGMG (c); digalactosyl diacylglycerol, DGDG (e); and digalactosyl monoacylglycerol, DGMG (g), identified as [M + NH4]+ ions, Figure S3: LC–MS spectra of the sulfolipids classes of Grateloupia turuturu sulfoquinovosyl diacylglycerol, SQDG (a) and sulfoquinovosyl monoacylglycerol SQMG (c) identified as [M − H] ions, Figure S4: LC–MS of betaine lipids of Grateloupia turuturu diacyglyceryl-O-4′-(N,N,N-trimethyl) homoserine DGTS (a) and monoacyglyceryl-O-4′-(N,N,N-trimethyl) homoserine, MGTS (c), identified as [M + H]+ ions, Figure S5: LC–MS of the phospholipids classes of Grateloupia turuturu phosphatidylcholine, PC (a) and lyso-phosphatidylcholine, LPC (d) identified as [M + H]+ ions, Figure S6: LC–MS of the phospholipids classes phosphatidylethanolamine, PE (a) and lyso- phosphatidylethanolamine, LPE (d), identified as [M − H] ions, Figure S7: LC–MS of the phospholipids classes of Grateloupia turuturu phosphatidylglycerol, PG (a) and lyso- phosphatidylglycerol, LPG (c), identified as [M − H] ions, Figure S8: LC–MS of the phospholipid class of Grateloupia turuturu phosphatidic acid, PA (a), identified as [M − H] ion, Figure S9: LC–HCD–MS/MS of the selected [M − H] ion at m/z 835.53 of the phosphatidylinositol, Figure S10: LC–HCD–MS of phosphoinositol ceramide class of Grateloupia turuturu PI-Cer (a), identified as [M − H] ions, Figure S11: GC–MS chromatogram of the esterified fatty acid (FA) of Grateloupia turuturu lipid extract.

Author Contributions

Conceptualization, E.d.C. and M.R.D.; sampling, M.R. and M.H.A., methodology, E.d.C., T.M. and M.R.; validation, all authors; formal analysis, E.d.C. and T.M.; investigation, E.d.C., T.M. and M.R.; resources, P.D., R.C., M.R.D. and M.H.A.; writing—original draft preparation, E.d.C.; writing—review and editing, all authors; visualization, E.d.C. and M.R.D.; supervision, M.R.D.; project administration, M.R.D.; funding acquisition, M.R.D. All authors have read and agreed to the published version of the manuscript.

Funding

This research was funded by OMICS4ALGAE (POCI-01-0145-FEDER-030962), funded by FEDER, through COMPETE2020—Programa Operacional Competitividade e Internacionalização (POCI) and by national funds (OE), through FCT/MCTES. This work was also supported by the MAR2020–European Fisheries Fund, the Operational Programme (OP) for the European Maritime and Fisheries Fund (EMFF) in Portugal through project AquaMMIn (16-02-01-FMP-0038) and the Integrated Programme of SR&TD ‘Smart Valorization of Endogenous Marine Biological Resources Under a Changing Climate’ (Centro-01-0145-FEDER-000018), co-funded by the Centro 2020 program, Portugal 2020, European Union, through the European Regional Development Fund.

Institutional Review Board Statement

Not applicable.

Informed Consent Statement

Not applicable.

Acknowledgments

The authors are also grateful to FCT/MCTES (Portugal) for the financial support to CESAM (UIDB/50017/2020 + UIDP/50017/2020) LAQV-REQUIMTE (UIDB/50006/2020) and RNEM (LISBOA-01-0145-FEDER-402-022125), through national funds and the co-funding by the FEDER, within the PT2020 Partnership Agreement and Compete 2020. The authors are grateful to ALGAplus- Produção e Comércio de algas e seus derivados, Lda. for supplying the seaweed samples. This study is a contribution of the Marine Lipidomics Laboratory.

Conflicts of Interest

The authors declare no conflict of interest.

References

  1. Klinger, T. The role of seaweeds in the modern ocean. Perspect. Phycol. 2015, 2, 31–39. [Google Scholar] [CrossRef]
  2. Doumeizel, V.; Aass, K.; McNevin, A.; Cousteau, A.; Yap, A.Y.; Cai, J.; Cottier-Cook, E.J.; Giercksky, E.; Chen, H.; Skjermo, J.; et al. Seaweed Revolution: A Manifesto for a Sustainable Future; Lloyd’s Register Foundation: London, UK, 2020; pp. 1–16. [Google Scholar]
  3. Rebours, C.; Marinho-Soriano, E.; Zertuche-González, J.A.; Hayashi, L.; Vásquez, J.A.; Kradolfer, P.; Soriano, G.; Ugarte, R.; Abreu, M.H.; Bay-Larsen, I.; et al. Seaweeds: An opportunity for wealth and sustainable livelihood for coastal communities. J. Appl. Phycol. 2014, 26, 1939–1951. [Google Scholar] [CrossRef] [Green Version]
  4. Chapman, A.S.; Stévant, P.; Larssen, W.E. Food or fad? Challenges and opportunities for including seaweeds in a Nordic diet. Bot. Mar. 2015, 58, 423–433. [Google Scholar] [CrossRef]
  5. Holdt, S.L.; Kraan, S. Bioactive compounds in seaweed: Functional food applications and legislation. J. Appl. Phycol. 2011, 23, 543–597. [Google Scholar] [CrossRef]
  6. Pacheco, D.; Araújo, G.S.; Cotas, J.; Gaspar, R.; Neto, J.M.; Pereira, L. Invasive Seaweeds in the Iberian Peninsula: A Contribution for Food Supply. Mar. Drugs 2020, 18, 560. [Google Scholar] [CrossRef]
  7. Cotas, J.; Leandro, A.; Pacheco, D.; Gonçalves, A.M.M.; Pereira, L. A comprehensive review of the nutraceutical and therapeutic applications of red seaweeds (Rhodophyta). Life 2020, 10, 19. [Google Scholar] [CrossRef] [Green Version]
  8. Mathieson, A.C.; Dawes, C.J.; Pederson, J.; Gladych, R.A.; Carlton, J.T. The Asian red seaweed Grateloupia turuturu (Rhodophyta) invades the Gulf of Maine. Biol. Invasions 2008, 10, 985–988. [Google Scholar] [CrossRef] [Green Version]
  9. Bárbara, I.; Cremades, J. Grateloupia lanceola versus Grateloupia doryphora (Gigartinales, Rhodophyta) en las costas de la Península Ibérica. Anales del Jardín Botánico de Madrid 2004, 61. [Google Scholar] [CrossRef]
  10. Araújo, R.; Violante, J.; Pereira, R.; Abreu, H.; Arenas, F.; Sousa-Pinto, I. Distribution and population dynamics of the introduced seaweed Grateloupia turuturu (halymeniaceae, rhodophyta) along the Portuguese coast. Phycologia 2011, 50, 392–402. [Google Scholar] [CrossRef]
  11. Mulas, M.; Bertocci, I. Devil’s tongue weed (Grateloupia turuturu Yamada) in northern Portugal: Passenger or driver of change in native biodiversity? Mar. Environ. Res. 2016, 118, 1–9. [Google Scholar] [CrossRef] [PubMed]
  12. Petrocelli, A.; Alabiso, G.; Cecere, E.; Ricci, P.; Carlucci, R. Invasive or not? The case of Grateloupia turuturu (Rhodophyta, Halymeniales) in the Northern Ionian Sea (Mediterranean Sea). Mar. Pollut. Bull. 2020, 161, 111748. [Google Scholar] [CrossRef] [PubMed]
  13. Denis, C.; Morançais, M.; Li, M.; Deniaud, E.; Gaudin, P.; Wielgosz-Collin, G.; Barnathan, G.; Jaouen, P.; Fleurence, J. Study of the chemical composition of edible red macroalgae Grateloupia turuturu from Brittany (France). Food Chem. 2010, 119, 913–917. [Google Scholar] [CrossRef]
  14. Perfeto, P.N.M. Relation between chemical composition of Grateloupia doryphora (montagne) howe, Gymnogongrus griffithsiae (turner) martius, and abiotic parameters. Acta Bot. Brasilica 1998, 12, 77–88. [Google Scholar] [CrossRef] [Green Version]
  15. Rodrigues, D.; Freitas, A.C.; Pereira, L.; Rocha-Santos, T.A.P.; Vasconcelos, M.W.; Roriz, M.; Rodríguez-Alcalá, L.M.; Gomes, A.M.P.; Duarte, A.C. Chemical composition of red, brown and green macroalgae from Buarcos bay in Central West Coast of Portugal. Food Chem. 2015, 183, 197–207. [Google Scholar] [CrossRef]
  16. Kendel, M.; Couzinet-Mossion, A.; Viau, M.; Fleurence, J.; Barnathan, G.; Wielgosz-Collin, G. Seasonal composition of lipids, fatty acids, and sterols in the edible red alga Grateloupia turuturu. J. Appl. Phycol. 2012, 25, 425–432. [Google Scholar] [CrossRef]
  17. Floreto, E.A.T.; Teshima, S. The fatty acid composition of seaweed exposed to different levels of light intensity and salinity. Bot. Mar. 1998, 41, 467–481. [Google Scholar] [CrossRef]
  18. Munier, M.; Dumay, J.; Morançais, M.; Jaouen, P.; Fleurence, J. Variation in the biochemical composition of the edible seaweed Grateloupia turuturu yamada harvested from two sampling sites on the Brittany coast (France): The influence of storage method on the extraction of the seaweed pigment r-phycoerythrin. J. Chem. 2013, 2013. [Google Scholar] [CrossRef] [Green Version]
  19. Kendel, M.; Barnathan, G.; Fleurence, J.; Rabesaotra, V.; Wielgosz-Collin, G. Non-methylene interrupted and hydroxy fatty acids in polar lipids of the alga Grateloupia turuturu over the four seasons. Lipids 2013, 48, 535–545. [Google Scholar] [CrossRef]
  20. Calder, P.C. n-3 polyunsaturated fatty acids, inflammation, and inflammatory diseases. Am. J. Clin. Nutr. 2006, 83, 1505S–1519S. [Google Scholar] [CrossRef]
  21. Simopoulos, A.P. Essential fatty acids in health and chronic disease. Am. J. Clin. Nutr. 1999, 70, 560S–569S. [Google Scholar] [CrossRef] [Green Version]
  22. Bowen, K.J.; Harris, W.S.; Kris-Etherton, P.M. Omega-3 fatty acids and cardiovascular disease: Are there benefits? Curr. Treat. Options Cardiovasc. Med. 2016, 18. [Google Scholar] [CrossRef] [Green Version]
  23. Lee, J.-C.; Hou, M.-F.; Huang, H.-W.; Chang, F.-R.; Yeh, C.-C.; Tang, J.-Y.; Chang, H.-W. Marine algal natural products with anti-oxidative, anti-inflammatory, and anti-cancer properties. Cancer Cell Int. 2013, 13, 55. [Google Scholar] [CrossRef] [PubMed] [Green Version]
  24. De Roos, B.; Mavrommatis, Y.; Brouwer, I.A. Long-chain n-3 polyunsaturated fatty acids: New insights into mechanisms relating to inflammation and coronary heart disease. Br. J. Pharmacol. 2009, 158, 413–428. [Google Scholar] [CrossRef] [Green Version]
  25. Harwood, J.L.; Guschina, I.A. The versatility of algae and their lipid metabolism. Biochimie 2009, 91, 679–684. [Google Scholar] [CrossRef] [PubMed]
  26. Vaskovsky, V.E.; Khotimchenko, S.V.; Svetlana, K.; Bangmei, X.; Hefang, L. Polar lipids and fatty acids of some marine macrophytes from Yellow Sea. Phytochemistry 1996, 42, 1347–1356. [Google Scholar] [CrossRef]
  27. Melo, T.; Alves, E.; Azevedo, V.; Martins, A.S.; Neves, B.; Domingues, P.; Calado, R.; Abreu, M.H.; Domingues, M.R. Lipidomics as a new approach for the bioprospecting of marine macroalgae—Unraveling the polar lipid and fatty acid composition of Chondrus crispus. Algal Res. 2015, 8, 181–191. [Google Scholar] [CrossRef]
  28. Da Costa, E.; Melo, T.; Moreira, A.S.P.A.; Bernardo, C.; Helguero, L.; Ferreira, I.; Cruz, M.T.M.; Rego, A.M.A.; Domingues, P.; Calado, R.; et al. Valorization of lipids from Gracilaria sp. through lipidomics and decoding of antiproliferative and anti-Inflammatory activity. Mar. Drugs 2017, 15, 62. [Google Scholar] [CrossRef] [PubMed] [Green Version]
  29. da Costa, E.; Azevedo, V.; Melo, T.; Rego, A.M.; Evtuguin, D.V.; Domingues, P.; Calado, R.; Pereira, R.; Abreu, M.H.; Domingues, M.R. High-Resolution lipidomics of the early life stages of the red seaweed Porphyra dioica. Molecules 2018, 23, 187. [Google Scholar] [CrossRef] [Green Version]
  30. Lopes, D.; Melo, T.; Rey, F.; Costa, E.; Moreira, A.S.P.; Abreu, M.H.; Domingues, P.; Lillebø, A.I.; Calado, R.; Rosário Domingues, M. Insights of species-specific polar lipidome signatures of seaweeds fostering their valorization in the blue bioeconomy. Algal Res. 2021, 55. [Google Scholar] [CrossRef]
  31. Lee, H.-G.; Lu, Y.-A.; Je, J.-G.; Jayawardena, T.U.; Kang, M.-C.; Lee, S.-H.; Kim, T.-H.; Lee, D.-S.; Lee, J.-M.; Yim, M.-J.; et al. Effects of ethanol extracts from Grateloupia elliptica, a red seaweed, and Its chlorophyll derivative on 3T3-L1 adipocytes: Suppression of lipid accumulation through dDownregulation of adipogenic protein expression. Mar. Drugs 2021, 19, 91. [Google Scholar] [CrossRef] [PubMed]
  32. Zhao, J.; Li, L. Effects of UV-B irradiation on isoforms of antioxidant enzymes and their activities in red alga Grateloupia filicina (Rhodophyta). Chinese J. Oceanol. Limnol. 2014, 32, 1364–1372. [Google Scholar] [CrossRef]
  33. Ferreira, J.; Marques, A.; Abreu, H.; Pereira, R.; Rego, A.; Pacheco, M.; Gaivão, I. Red seaweeds Porphyra umbilicalis and Grateloupia turuturu display antigenotoxic and longevity-promoting potential in Drosophila melanogaster. Eur. J. Phycol. 2019, 54, 519–530. [Google Scholar] [CrossRef]
  34. Ismail, M.M.; Alotaibi, B.S.; EL-Sheekh, M.M. Therapeutic uses of red macroalgae. Molecules 2020, 25, 4411. [Google Scholar] [CrossRef]
  35. Athukorala, Y.; Lee, K.-W.; Song, C.; Ahn, C.B.; Shin, T.-S.; Cha, Y.-J.; Shahidi, F.; Jeon, Y.-J. Potential antioxidant activity of marine red alga Grateloupia filicina extracts. J. Food Lipids 2003, 10, 251–265. [Google Scholar] [CrossRef]
  36. Athukorala, Y.; Lee, K.W.; Park, E.J.; Heo, M.S.; Yeo, I.K.; Lee, Y.D.; Jeon, Y.J. Reduction of lipid peroxidation and H2O2-mediated DNA damage by a red alga (Grateloupia filicina) methanolic extract. J. Sci. Food Agric. 2005, 85, 2341–2348. [Google Scholar] [CrossRef]
  37. Yang, E.-J.; Moon, J.-Y.; Kim, M.-J.; Kim, D.S.; Kim, C.-S.; Lee, W.J.; Lee, N.H.; Hyun, C.-G. Inhibitory effect of Jeju endemic seaweeds on the production of pro-inflammatory mediators in mouse macrophage cell line RAW 264.7. J. Zhejiang Univ. Sci. B 2010, 11, 315–322. [Google Scholar] [CrossRef] [PubMed] [Green Version]
  38. García-Bueno, N.; Turpin, V.; Cognie, B.; Dumay, J.; Morançais, M.; Amat, M.; Pédron, J.M.; Atucha, A.M.; Fleurence, J.; Decottignies, P. Can the european abalone Haliotis tuberculata survive on an invasive algae? A comparison of the nutritional value of the introduced Grateloupia turuturu and the native Palmaria palmata, for the commercial european abalone industry. J. Appl. Phycol. 2016, 28, 2427–2433. [Google Scholar] [CrossRef]
  39. Huang, W.; Fujita, Y.; Ninomiya, M.; Ohno, M. Seed production and cultivation of Grateloupia turuturu (Cryptonemiales, Rhodophyta) by callus culture. Bull. Mar. Sci. Fish. 1999, 19, 1–7. [Google Scholar]
  40. Fleurence, J. Seaweed proteins: Biochemical, nutritional aspects and potential uses. Trends Food Sci. Technol. 1999, 10, 25–28. [Google Scholar] [CrossRef]
  41. Cian, R.E.; Drago, S.R.; De Medina, F.S.; Martínez-Augustin, O. Proteins and carbohydrates from red seaweeds: Evidence for beneficial effects on gut function and microbiota. Mar. Drugs 2015, 13, 5358–5383. [Google Scholar] [CrossRef] [Green Version]
  42. Fleurence, J.; Morançais, M.; Dumay, J.; Decottignies, P.; Turpin, V.; Munier, M.; Garcia-Bueno, N.; Jaouen, P. What are the prospects for using seaweed in human nutrition and for marine animals raised through aquaculture? Trends Food Sci. Technol. 2012, 27, 57–61. [Google Scholar] [CrossRef]
  43. Kendel, M.; Wielgosz-collin, G.; Bertrand, S.; Roussakis, C.; Bourgougnon, N.; Bedoux, G. Lipid composition, fatty acids and sterols in the seaweeds Ulva armoricana, and Solieria chordalis from Brittany (France): An analysis from nutritional, chemotaxonomic, and antiproliferative activity perspectives. Mar. Drugs 2015, 13, 5606–5628. [Google Scholar] [CrossRef]
  44. Hotimchenko, S.V. Fatty acid composition of algae from habitats with varying amounts of illumination. Russ. J. Mar. Biol. 2002, 28, 218–220. [Google Scholar] [CrossRef]
  45. Kumari, P.; Kumar, M.; Gupta, V.; Reddy, C.R.K.; Jha, B. Tropical marine macroalgae as potential sources of nutritionally important PUFAs. Food Chem. 2010, 120, 749–757. [Google Scholar] [CrossRef]
  46. Lopes, D.; Melo, T.; Meneses, J.; Abreu, M.H.; Pereira, R.; Domingues, P.; Lillebø, A.I.; Calado, R.; Rosário Domingues, M. A New Look for the Red Macroalga Palmaria palmata: A seafood with polar lipids rich in EPA and with antioxidant properties. Mar. Drugs 2019, 17, 533. [Google Scholar] [CrossRef] [PubMed] [Green Version]
  47. Fleurence, J.; Gutbier, G.; Mabeau, S.; Leray, C. Fatty acids from 11 marine macroalgae of the French Brittany coast. J. Appl. Phycol. 1994, 6, 527–532. [Google Scholar] [CrossRef]
  48. Wells, M.L.; Potin, P.; Craigie, J.S.; Raven, J.A.; Merchant, S.S.; Helliwell, K.E.; Smith, A.G.; Camire, M.E.; Brawley, S.H. Algae as nutritional and functional food sources: Revisiting our understanding. J. Appl. Phycol. 2017, 29, 949–982. [Google Scholar] [CrossRef] [PubMed]
  49. Harrysson, H.; Hayes, M.; Eimer, F.; Carlsson, N.G.; Toth, G.B.; Undeland, I. Production of protein extracts from Swedish red, green, and brown seaweeds, Porphyra umbilicalis Kützing, Ulva lactuca Linnaeus, and Saccharina latissima (Linnaeus) J. V. Lamouroux using three different methods. J. Appl. Phycol. 2018, 30, 3565–3580. [Google Scholar] [CrossRef] [Green Version]
  50. Phillips, J.C.; Hurd, C.L. Nitrogen ecophysiology of intertidal seaweeds from New Zealand: N uptake, storage and utilisation in relation to shore position and season. Mar. Ecol. Prog. Ser. 2003, 264, 31–48. [Google Scholar] [CrossRef]
  51. Roleda, M.Y.; Hurd, C.L. Seaweed nutrient physiology: Application of concepts to aquaculture and bioremediation. Phycologia 2019, 58, 552–562. [Google Scholar] [CrossRef] [Green Version]
  52. Geider, R.J.; La Roche, J. Redfield revisited: Variability of C:N:P in marine microalgae and its biochemical basis. Eur. J. Phycol. 2002, 37, 1–17. [Google Scholar] [CrossRef] [Green Version]
  53. Rubio-Rodríguez, N.; Beltrán, S.; Jaime, I.; de Diego, S.M.; Sanz, M.T.; Carballido, J.R. Production of omega-3 polyunsaturated fatty acid concentrates: A review. Innov. Food Sci. Emerg. Technol. 2010, 11, 1–12. [Google Scholar] [CrossRef]
  54. Calder, P.C.; Albers, R.; Antoine, J.-M.; Blum, S.; Ferns, G.A.; Folkerts, G.; Bourdet-Sicard, R.; Friedmann, P.S.; Frost, G.S.; Guarner, F.; et al. Inflammatory disease processes and interactions with nutrition. Br. J. Nutr. 2009, 101, S2–S14. [Google Scholar] [CrossRef] [Green Version]
  55. Calder, P.C. Omega-3 fatty acids and inflammatory processes: From molecules to man. Biochem. Soc. Trans. 2017, 1–11. [Google Scholar] [CrossRef] [Green Version]
  56. Wołoszyn, J.; Haraf, G.; Okruszek, A.; Wereńska, M.; Goluch, Z.; Teleszko, M. Fatty acid profiles and health lipid indices in the breast muscles of local Polish goose varieties. Poult. Sci. 2020, 99, 1216–1224. [Google Scholar] [CrossRef]
  57. Fernandes, C.E.; Vasconcelos, M.A.D.S.; De Almeida Ribeiro, M.; Sarubbo, L.A.; Andrade, S.A.C.; Filho, A.B.D.M. Nutritional and lipid profiles in marine fish species from Brazil. Food Chem. 2014, 160, 67–71. [Google Scholar] [CrossRef] [PubMed]
  58. Plouguerné, E.; da Gama, B.A.P.; Pereira, R.C.; Barreto-Bergter, E. Glycolipids from seaweeds and their potential biotechnological applications. Front. Cell. Infect. Microbiol. 2014, 4, 1–3. [Google Scholar] [CrossRef]
  59. Küllenberg, D.; Taylor, L.A.; Schneider, M.; Massing, U. Health effects of dietary phospholipids. Lipids Health Dis. 2012, 11, 1–16. [Google Scholar] [CrossRef] [PubMed] [Green Version]
  60. Arao, T.; Yamada, M. Positional distribution of fatty acids in galactolipids of algae. Phytochemistry 1989, 28, 805–810. [Google Scholar] [CrossRef]
  61. Khotimchenko, S.V.; Vaskovsky, V.E. An inositol-containing sphingolipid from the red alga Gracilaria verrucosa. Russ. J. Bioorganic Chem. 2004, 30, 168–171. [Google Scholar] [CrossRef] [PubMed]
  62. Khotimchenko, S.V.; Klochkova, N.G.; Vaskovsky, V.E. Polar lipids of marine macrophytic algae as chemotaxonomic markers. Biochem. Syst. Ecol. 1990, 18, 93–101. [Google Scholar] [CrossRef]
  63. Lordan, R.; Tsoupras, A.; Zabetakis, I. Phospholipids of animal and marine origin: Structure, function, and anti-inflammatory properties. Molecules 2017, 22, 1964. [Google Scholar] [CrossRef] [PubMed] [Green Version]
  64. Lordan, S.; Ross, R.P.; Stanton, C. Marine bioactives as functional food ingredients: Potential to reduce the incidence of chronic diseases. Mar. Drugs 2011, 9, 1056–1100. [Google Scholar] [CrossRef] [PubMed] [Green Version]
  65. Lordan, R.; Redfern, S.; Tsoupras, A.; Zabetakis, I. Inflammation and cardiovascular disease: Are marine phospholipids the answer? Food Funct. 2020, 11, 2861–2885. [Google Scholar] [CrossRef]
  66. Burri, L.; Hoem, N.; Banni, S.; Berge, K. Marine omega-3 phospholipids: Metabolism and biological activities. Int. J. Mol. Sci. 2012, 13, 15401–15419. [Google Scholar] [CrossRef] [PubMed] [Green Version]
  67. Lopes, D.; Melo, T.; Rey, F.; Meneses, J.; Monteiro, F.L.; Helguero, L.A.; Abreu, M.H.; Lillebø, A.I.; Calado, R.; Domingues, M.R. Valuing bioactive lipids from Green, Red and Brown macroalgae from aquaculture, to foster functionality and biotechnologicala. Molecules 2020, 25, 3883. [Google Scholar] [CrossRef] [PubMed]
  68. Arulselvan, P.; Fard, M.T.; Tan, W.S.; Gothai, S.; Fakurazi, S.; Norhaizan, M.E.; Kumar, S.S. Role of antioxidants and natural products in inflammation. Oxid. Med. Cell. Longev. 2016, 2016. [Google Scholar] [CrossRef] [PubMed] [Green Version]
  69. Kebede, M.; Admassu, S. Application of antioxidants in food processing industry: Options to improve the extraction yields and market value of natural products. Adv. Food Technol. Nutr. Sci. Open J. 2019, 5, 38–49. [Google Scholar] [CrossRef]
  70. Sanches-Silva, A.; Costa, D.; Albuquerque, T.G.; Buonocore, G.G.; Ramos, F.; Castilho, M.C.; Machado, A.V.; Costa, H.S. Trends in the use of natural antioxidants in active food packaging: A review. Food Addit. Contam. Part A Chem. Anal. Control. Expo. Risk Assess. 2014, 31, 374–395. [Google Scholar] [CrossRef] [PubMed]
  71. da Costa, E.; Amaro, H.M.; Melo, T.; Guedes, A.C.; Domingues, M.R. Screening for polar lipids, antioxidant, and anti-inflammatory activities of Gloeothece sp. lipid extracts pursuing new phytochemicals from cyanobacteria. J. Appl. Phycol. 2020, 32, 3015–3030. [Google Scholar] [CrossRef]
  72. Banskota, A.H.; Stefanova, R.; Sperker, S.; Lall, S.P.; Craigie, J.S.; Hafting, J.T.; Critchley, A.T. Polar lipids from the marine macroalga Palmaria palmata inhibit lipopolysaccharide-induced nitric oxide production in RAW264.7 macrophage cells. Phytochemistry 2014, 101, 101–108. [Google Scholar] [CrossRef] [PubMed]
  73. Banskota, A.H.A.H.; Stefanova, R.; Sperker, S.; Lall, S.; Craigie, J.S.J.S.; Hafting, J.T.J.T. Lipids isolated from the cultivated red alga Chondrus crispus inhibit nitric oxide production. J. Appl. Phycol. 2014, 26, 1565–1571. [Google Scholar] [CrossRef]
  74. Sahaka, M.; Amara, S.; Wattanakul, J.; Gedi, M.A.; Aldai, N.; Parsiegla, G.; Christeller, J.T.; Gray, D.; Gontero, B.; Villeneuve, P. The digestion of galactolipids and its ubiquitous function in Nature for the uptake of the essential α-linolenic acid. Food Funct. 2020. [Google Scholar] [CrossRef] [PubMed]
  75. Araújo, R.; Vázquez Calderón, F.; Sánchez López, J.; Azevedo, I.C.; Bruhn, A.; Fluch, S.; Garcia Tasende, M.; Ghaderiardakani, F.; Ilmjärv, T.; Laurans, M.; et al. Current Status of the algae production industry in Europe: An emerging sector of the Blue Bioeconomy. Front. Mar. Sci. 2021. [Google Scholar] [CrossRef]
  76. Aued-Pimentel, S.; Lago, J.H.G.; Chaves, M.H.; Kumagai, E.E. Evaluation of a methylation procedure to determine cyclopropenoids fatty acids from Sterculia striata St. Hil. Et Nauds seed oil. J. Chromatogr. A 2004, 1054, 235–239. [Google Scholar] [CrossRef]
  77. Santos, F.; Monteiro, J.P.; Duarte, D.; Melo, T.; Lopes, D.; da Costa, E.; Domingues, M.R. Unraveling the lipidome and antioxidant activity of native Bifurcaria bifurcata and invasive Sargassum muticum seaweeds: A lipid perspective on how systemic intrusion may present an opportunity. Antioxidants 2020, 9, 642. [Google Scholar] [CrossRef]
Figure 1. The number of lipid species identified by HILIC–MS, MS/MS in Grateloupia turuturu and exact mass measurements with the assignment class of each polar lipids.
Marinedrugs 19 00414 g001
Figure 2. The relative percentage of the normalized peak area of glycolipid species of Grateloupia turuturu identified in each class, MGDG (a), MGMG (b), DGDG (c), DGMG (d), SQDG (e) and SQMG (f), calculated as normalized peak area of each lipid species / sum of normalized peak areas for all lipid species of the same class obtained after LC–MS analysis. MGDG (a), MGMG (b), DGDG (c) and DGMG (d) were identified in positive mode as [M + NH4]+ ions and SQDG (e) and SQMG (f) were identified in negative mode as [M – H] ions. The number in parentheses (C:N) indicates the number of carbon atoms (C) and the total number of double bounds (N) in the side chains of the fatty acids.
Marinedrugs 19 00414 g002
Figure 3. The relative percentage of the normalized peak area of betaine lipid species of Grateloupia turuturu identified in each DGTS (a) and MGTS (b) class, calculated after dividing the normalized peak area of each lipid species/sum of normalized peak areas for all lipid species in the same class obtained after LC–MS analysis. DGTS (a) and MGTS (b) were identified in positive mode as [M + H]+ ions. The number in parentheses (C:N) indicates the number of carbon atoms (C) and double bonds (N) in the side chains of fatty acids.
Marinedrugs 19 00414 g003
Figure 4. The relative percentage of normalized peak area of the phospholipids lipids classes of Grateloupia turuturu identified, PC (a), LPC (b), PE (c), LPE (d), PG (e), LPG (f), PA (g), PI (h) and PI-Cer (i), calculated as normalized peak area of each lipid species / sum of normalized peak areas for all lipid species in the class obtained after LC–MS analysis. PC (a) and LPC (b) were identified as [M + H]+ ions, while PE (c), LPE (d), PG (e), LPG (f), PA (g), PI (h) and PI-Cer (i) were identified as [M – H] ions. The number in parentheses (C:N) indicates the number of carbon atoms (C) and the total number of double bounds (N) in the side chains of fatty acids.
Marinedrugs 19 00414 g004
Figure 5. Free radical-scavenging activity (%) against the 2,2′-azino-bis-3-ethylbenzothiazoline-6-sulfonic acid radical cation (ABTS) (a) and the 2,2-diphenyl-1-picrylhydrazyl radical (DPPH) (b) from lipid extracts of Grateloupia turuturu. The concentration of the lipid extract was between 12.5 and 250 µg mL−1. Each value is expressed as the mean ± standard deviation (n = 4). Values with no same letter in each column have significant difference (p < 0.05).
Marinedrugs 19 00414 g005
Figure 6. Cyclooxygenase 2 (COX-2) enzyme inhibitory capacity of lipid extracts of Grateloupia turuturu at a concentration between 12.5 and 250 µg mL−1. Each value is expressed as a percentage mean ± standard deviation (n = 4). Values with no same letter in each column have significant difference (p < 0.05).
Marinedrugs 19 00414 g006
Table 1. Content of lipid, tissue carbon, tissue nitrogen and proteins expressed in g 100 g−1 of dry weight biomass (DW) and carbon-to-nitrogen ratio (C/N) of the Grateloupia turuturu biomass (means ± SD: a n = 5, b n = 3).
CompoundContent
Lipid content (g 100 g−1 DW) a0.88 ± 0.25
C (g 100 g−1 DW) b34.88 ± 0.31
N (g 100 g−1 DW) b4.20 ± 0.11
C/N8.30 ± 0.19
Protein content (N × 6.25) (g 100 g−1 DW)26.26 ± 0.69
Table 2. Grateloupia turuturu glycolipids species identified by HILIC–LC–MS and MS/MS: type of adduct, lipid identity, calculated and observed mass, error, fatty acyl composition confirmed by MS/MS and formula. MGDG, MGMG, DGDG, DGMG were identified as [M + NH4]+ ions, while SQDG and SQMG were identified as [M – H] ions. The most abundant species are indicated in italics and in bold. C represents total carbon atoms and N represents the double bonds of fatty acid substituents. Fatty acyl chains were identified by MS/MS (a, assignments by mass accuracy, but without MS/MS; b, assignments by mass accuracy, MS/MS with diagnostic ions confirming the lipid class, but without information on fatty acyl chains). The representation C:N/C:N signifies the attribution of fatty acyl to the position sn-1/sn-2 according to the nomenclature of LIPIDMAPS (www.lipidmaps.org, accessed on 25 April 2021).
Lipid Species (C:N)Calculated m/z Observed m/z Error (ppm)Fatty Acyl Chains (C:N)Formula
MGDG identified as [M + NH4]+
MGDG(30:4)712.5000712.50283.9169aC39H70NO10
MGDG(34:7)762.5156762.51580.185418:3_16:4C43H72NO10
MGDG(34:2)772.5933772.5896−4.8099aC43H82NO10
MGDG(34:1)774.609774.61031.689618:1_16:0C43H84NO10
MGDG(36:9)786.5156786.51772.6952aC45H72NO10
MGDG(36:8)788.5313788.5308−0.595320:4_16:4C45H74NO10
MGDG(36:6)792.5625792.5619−0.7124aC45H78NO10
MGDG(36:5)794.5782794.5780−0.198120:5_16:0C45H80NO10
MGDG(36:4)796.5933796.5926−0.867920:4_16:0C45H82NO10
MGDG(36:3)798.6095798.6074−2.631120:3_16:0C45H84NO10
MGDG(38:8)816.5626816.5621−0.5736aC47H78NO10
MGDG(38:7)818.5782818.58002.135aC47H80NO10
MGDG(38:5)822.6095822.61000.5639aC47H84NO10
MGDG(40:10)840.5626840.56330.824320:5/20:5C49H78NO10
MGDG(40:2)856.6878856.68790.2035aC49H94NO10
MGDG(44:10)894.6095894.61020.7878aC53H84NO10
MGMG identified as [M + NH4]+
MGMG(14:0)482.3329482.3330.2488aC23H48NO9
MGMG(16:4)502.3016502.3015−0.2407aC25H44NO9
MGMG(16:3)504.3173504.3193.3957aC25H46NO9
MGMG(16:2)506.3329506.3321−1.6151aC25H48NO9
MGMG(16:1)508.3486508.3490.9149aC25H50NO9
MGMG(16:0)510.3642510.3637−0.897216:0C25H52NO9
MGMG(18:4)530.3329530.33422.3898aC27H48NO9
MGMG(18:3)532.3486532.34972.1221aC27H50NO9
MGMG 18:2)534.3642534.3639−0.5996aC27H52NO9
MGMG(18:1)536.3799536.3793−1.1276aC27H54NO9
MGMG(20:5)556.3486556.34880.352120:5C29H50NO9
MGMG(20:4)558.3642558.36460.7432aC29H52NO9
MGMG(20:3)560.3799560.38071.5291aC29H54NO9
DGDG identified as [M + NH4]+
DGDG(32:2)906.6154906.61580.427316:2_16:0C47H88O15N
DGDG(32:1)908.6310908.63150.530418:1_14:0; 16:1_16:0C47H90O15N
DGDG(32:0)910.6467910.6465−0.2435aC47H92O15N
DGDG(34:8)922.5528922.5488−4.3802aC49H80O15N
DGDG(34:7)924.5684924.5639−4.8671aC49H82O15N
DGDG(34:4)930.6154930.6146−0.824aC49H88O15N
DGDG(34:3)932.6310932.6304−0.639518:3_16:0C49H90O15N
DGDG(34:2)934.6467934.64680.056618:2_16:0C49H92O15N
DGDG(34:1)936.6623936.66270.42218:1_16:0C49H94O15N
DGDG(36:5)956.6310956.63150.529320:5_16:0C51H90O15N
DGDG(36:2)962.6780962.6777−0.275918:1/18:1C51H96O15N
DGDG(38:5)984.6623984.66472.4117aC53H94O15N
DGDG(40:10)1002.61541002.61640.997420:5/20:5C55H88O15N
DGMG identified as [M + NH4]+
DGMG(16:1)670.4014670.40200.8999aC31H60NO14
DGMG(16:0)672.4170672.41740.523916:0C31H62NO14
DGMG(18:1)698.4327698.43320.708318:1C33H64NO14
DGMG(20:5)718.4014718.4012−0.3122aC35H60NO14
SQDG identified as [M − H]
SQDG(28:0)737.4510737.45181.091912:0_16:0C37H69O12S
SQDG(30:2)761.4510761.45191.2214aC39H69O12S
SQDG(30:1)763.4666763.46680.224614:0_16:1C39H71O12S
SQDG(30:0)765.4823765.48280.715514:0_16:0C39H73O12S
SQDG(32:4)785.4510785.4532.518914:0_18:4C41H69O12S
SQDG(32:3)787.4666787.4658−1.0089aC41H71O12S
SQDG(32:2)789.4823789.48331.281316:2_16:0C41H73O12S
SQDG(32:1)791.4979791.49911.493216:1_16:0C41H75O12S
SQDG(32:0)793.5136793.51471.359116:0/16:0C41H77O12S
SQDG(34:5)811.4666811.47014.233114:0_20:5C43H71O12S
SQDG(34:3)815.4979815.49860.839418:3_16:0C43H75O12S
SQDG(34:2)817.5136817.51511.9049aC43H77O12S
SQDG(34:1)819.5292819.53081.962118:1_16:0C43H79O12S
SQDG(34:0)821.5449821.54591.2441aC43H81O12S
SQDG(36:6)837.4823837.48442.5124bC45H73O12S
SQDG(36:5)839.4979839.49891.146220:5_16:0C45H75O12S
SQDG(36:5)OH855.4939855.49430.495320:5−OH_16:0C45H75O12SO
SQDG(38:7)863.4979863.49961.986220:4_18:3C47H75O12S
SQDG(38:5)867.5292867.52980.713820:5_18:0C47H79O12S
SQDG(40:10)885.4823885.48371.583520:5/20:5C49H73O12S
SQMG identified as [M − H]
SQMG(14:0)527.2526527.25402.7046aC23H43O11S
SQMG(16:1)553.2683553.27013.267aC25H45O11S
SQMG(16:0)555.2839555.28491.735116:0C25H47O11S
SQMG(18:1)581.2996581.30244.8607aC27H49O11S
SQMG(18:0)583.3152583.31662.340218:0C27H51O11S
SQMG(20:5)601.2683601.26962.2023aC29H45O11S
SQMG(20:4)603.2839603.28512.0425aC29H47O11S
SQMG(24:0)667.4091667.41173.9262aC33H63O11S
Table 3. Grateloupia turuturu betaine lipids species identified by HILIC–LC–MS and MS/MS: type of adduct, lipid identity, calculated and observed mass, error, fatty acyl composition confirmed by MS/MS and formula. DGTS and MGTS were identified as [M + H]+ ions. The most abundant species are indicated in italics and in bold. C represents total carbon atoms and N represents the number of double bonds of fatty acid substituents. Fatty acyl chains were identified by MS/MS (a, assignments by mass accuracy and unequivocal molecular formula, but without MS/MS; b, assignments by mass accuracy, MS/MS diagnostic ions information to confirm the lipid class, but without information on fatty acyl chains). The representation C:N/C:N signifies the attribution of fatty acyls to the position sn-1/sn-2 according to the nomenclature of LIPIDMAPS (www.lipidmaps.org, accessed on 25 April 2021).
Lipid Species (C:N)Calculated m/z Observed m/z Error (ppm)Fatty Acyl Chains (C:N)Formula
DGTS identified as [M+H]+
DGTS(32:2)708.5778708.57921.9979aC42H78O7N
DGTS(32:1)710.5935710.59390.5111aC42H80O7N
DGTS(32:0)712.6091712.6083−1.1556aC42H82O7N
DGTS(34:4)732.5778732.57840.792516:0_18:4C44H78O7N
DGTS(34:3)734.5935734.5923−1.6029aC44H80O7N
DGTS(34:2)736.6091736.61011.313718:1_16:1C44H82O7N
DGTS(34:1)738.6248738.6238−1.4067aC44H84O7N
DGTS(36:8)752.5465752.54822.2335aC46H74O7N
DGTS(36:7)754.5622754.5614−1.0468aC46H76O7N
DGTS(36:5)758.5935758.59420.9613aC46H80O7N
DGTS(36:4)760.6091760.6072−2.4467aC46H82O7N
DGTS(36:3)762.6248762.6238−1.2584aC46H84O7N
DGTS(36:2)764.6404764.64131.208918:1/18:1C46H86O7N
DGTS(38:5)786.6248786.6239−1.1346aC48H84O7N
DGTS(40:9)806.5935806.5917−2.2229aC50H80O7N
DGTS(40:8)808.6091808.60980.8873aC50H82O7N
MGTS identified as [M+H]+
MGTS(16:1)472.3638472.3631−1.615716:1C26H50O6N
MGTS(16:0)474.3795474.3795−0.094216:0C26H52O6N
MGTS(18:4)494.3482494.34860.976018:4C28H48O6N
MGTS(18:3)496.3638496.3640.282518:3C28H50O6N
MGTS(18:2)498.3795498.3794−0.1732aC28H52O6N
MGTS(18:1)500.3951500.39611.9549aC28H54O6N
Table 4. Grateloupia turuturu phospholipids species identified by HILIC–LC–MS and MS/MS: type of adduct, lipid identity, calculated and observed mass, error, fatty acyl composition confirmed by MS/MS and formula. PC and LPC were identified as [M + H]+ ions, while PE, LPE, PG, LPG, PA, LPA, PI and LPI, PI-Cer were identified as [M – H] ions. The most abundant species are indicated in italics and in bold. C represents total carbon atoms and N represents the double bonds of fatty acid substituents. Fatty acyl chains were identified by MS/MS (a, assignments by mass accuracy, but without MS/MS; b, assignments by mass accuracy, MS/MS with diagnostic ions confirming the lipid class, but without information on fatty acyl chains). The representation C:N/C:N signifies the attribution of fatty acyl to the position sn-1/sn-2 according to the nomenclature of LIPIDMAPS (www.lipidmaps.org, accessed on 25 April 2021).
Lipid Species (C:N)Calculated m/zObserved m/zError (ppm)Fatty Acyl Chains (C:N)Formula
PC identified as [M+H]+
PC(30:3)700.4917700.4902−2.1598aC38H71NO8P
PC(30:0)706.5387706.5383−0.506bC38H77NO8P
PC(32:4)726.5074726.50922.4576aC40H73NO8P
PC(32:3)728.5230728.5241.3945aC40H75NO8P
PC(32:1)732.5543732.5519−3.324916:0/16:1; 14:0/18:1C40H79NO8P
PC(32:0)734.5700734.57010.1221aC40H81NO8P
PC(34:5)752.5230752.5205−3.301614:0/20:5C42H75NO8P
PC(34:4)754.5387754.53940.904714:0/20:4C42H77NO8P
PC(34:3)756.5543756.5535−1.059316:0/18:3C42H79NO8P
PC(34:2)758.5700758.5674−3.406316:0/18:2C42H81NO8P
PC(34:1)760.5856760.5849−0.962416:0/18:1C42H83NO8P
PC(36:8)774.5074774.5039−4.519aC44H73NO8P
PC(36:7)776.5230776.5222−1.038bC44H75NO8P
PC(36:6)778.5387778.5372−1.900520:5/16:1; 18:3/18:3C44H77NO8P
PC(36:5)780.5543780.554−0.411216:0/20:5; 18:3/18:2C44H79NO8P
PC(36:4)782.5700782.5697−0.34216:0/20:4; 18:2/18:2C44H81NO8P
PC(36:3)784.5856784.5854−0.2952bC44H83NO8P
PC(36:2)786.6013786.6008−0.597818:1/18:1C44H85NO8P
PC(38:9)800.5230800.5217−1.674bC46H75NO8P
PC(38:8)802.5387802.5376−1.295518:3/20:5C46H77NO8P
PC(38:7)804.5543804.5540−0.436918:3/20:4C46H79NO8P
PC(38:6)806.5700806.5695−0.62718:1/20:5C46H81NO8P
PC(38:5)808.5856808.5850−0.792118:1/20:4C46H83NO8P
PC(40:10)826.5387826.53890.26120:5/20:5C48H77NO8P
PC(40:9)828.5543828.5542−0.210620:4/20:5C48H79NO8P
PC(40:8)830.5700830.5672−3.409120:4/20:4C48H81NO8P
PC(40:7)832.5856832.5820−4.4128bC48H83NO8P
PC(42:11)852.5543852.5510−3.9274aC50H79NO8P
LPC identified as [M+H]+
LPC(14:0)468.3090468.30930.584414:0C22H47NO7P
LPC(16:1)494.3247494.3235−2.308216:1C24H49NO7P
LPC(16:0)496.3403496.3400−0.717916:0C24H51NO7P
LPC(18:4)516.3090516.3074−3.2093aC26H47NO7P
LPC(18:3)518.3247518.3232−2.84318:3C26H49NO7P
LPC(18:2)520.3403520.34070.722818:2C26H51NO7P
LPC(18:1)522.3560522.35630.541818:1C26H53NO7P
LPC(20:5)542.3247542.3244−0.542720:5C28H49NO7P
LPC(20:4)544.3403544.34060.489220:4C28H51NO7P
LPC(20:3)546.3560546.3540−3.593120:3C28H53NO7P
LPC(20:1)550.3873550.38811.5545aC28H57NO7P
LPC(22:6)568.3403568.3397−1.1639aC30H51NO7P
LPC(22:5)570.3560570.3548−2.1309aC30H53NO7P
PE identified as [M − H]
PE(30:2)658.4448658.44642.4664aC35H65NO8P
PE(30:1)660.4604660.46202.412916:1/14:0C35H67NO8P
PE(30:0)662.4761662.47620.0882aC35H69NO8P
PE(32:3)684.4604684.46222.6111aC37H67NO8P
PE(32:2)686.4761686.47741.927416:1/16:1C37H69O8NP
PE(32:1)688.4917688.49322.153116:0/16:1C37H71NO8P
PE(34:3)712.4917712.49342.337616:0/18:3C39H71O8NP
PE(34:2)714.5074714.50871.892816:1/18:1;16:0/18:2C39H73NO8P
PE(34:1)716.5230716.52310.167616:0/18:1C39H75NO8P
PE(36:5)736.4917736.49281.465916:0/20:5C41H71O8NP
PE(36:2)742.5387742.54224.664818:1/18:1C41H77O8NP
PE(38:8)758.4760758.47802.64120:5/18:3C43H69NO8P
PE(38:7)760.4920760.49311.490520:5/18:2; 20:4/18:3C43H71NO8P
PE(38:5)764.5230764.5230−0.0385aC43H75NO8P
LPE identified as [M − H]
LPE(14:0)424.2464424.24793.6359aC19H39NO7P
LPE(16:1)450.2621450.26342.940716:1C21H41NO7P
LPE(16:0)452.2777452.27872.251116:0C21H43NO7P
LPE(18:3)474.2621474.26312.341518:3C23H41NO7P
LPE(18:2)476.2777476.27902.81118:2C23H43NO7P
LPE(18:1)478.2934478.29472.740418:1C23H45NO7P
LPE(18:0)480.3090480.31093.961aC23H47NO7P
LPE(20:5)498.2621498.26342.6089aC25H41NO7P
LPE(20:4)500.2777500.27933.265820:4C25H43NO7P
PG identified as [M − H]
PG(30:1)691.4550691.45621.728416:1/14:0C36H68O10P
PG(30:0)693.4707693.47252.5772aC36H70O10P
PG(32:2)717.4707717.47252.484116:1/16:1; 18:2/14:0C38H70O10P
PG(32:1)719.4863719.48640.225716:0/16:1C38H72O10P
PG(32:0)721.5020721.50362.2107aC38H74O10P
PG(34:4)741.4707741.4706−0.177420:4/14:0; 16:1/18:3C40H70O10P
PG(34:3)743.4863743.4854−1.175418:3/16:0C40H72O10P
PG(34:2)745.5020745.50463.498618:1/16:1C40H74O10P
PG(34:1)747.5176747.51891.691318:1/16:0C40H76O10P
PG(36:5)767.4863767.48781.957220:5/16:0; 20:4/16:1C42H72O10P
PG(36:5)OH783.4829783.48330.464820:5/16:0−OHC42H72O10PO
PG(36:4)769.5020769.50392.416620:4/ 16:0; 18:2/18:2C42H74O10P
PG(36:3)771.5176771.51810.634718:2/18:1C42H76O10P
PG(36:2)773.5333773.53461.689518:1/18:1C42H78O10P
PG(42:9)843.5176843.5169−0.8453aC48H76O10P
LPG identified as [M − H]
LPG(14:0)455.2410455.24212.505714:0C20H40O9P
LPG(16:1)481.2566481.25762.026616:1C22H42O9P
LPG(16:0)483.2723483.27342.225216:0C22H44O9P
LPG(16:0)OH499.2677499.26780.084116:0−OHC22H44O10P
LPG(18:2)507.2723507.27403.1604aC24H44O9P
LPG(18:1)509.2879509.28881.64918:1C24H46O9P
LPG(20:5)529.2566529.25771.981120:5C26H42O9P
LPG(20:4)531.2723531.27444.074920:4C26H44O9P
LPG(22:5)557.2879557.2877−0.3698aC28H46O9P
PA identified as [M − H]
PA(36:7)689.4182689.4178−0.6446aC39H62O8P
PA(36:6)691.4339691.43592.94116:1/20:5C39H64O8P
PA(36:5)693.4495693.45081.814416:0/20:5C39H66O8P
PA(40:10)739.4339739.43562.3648aC43H64O8P
PA(40:9)741.4495741.44960.045520:5/20:4C43H66O8P
PA(40:8)743.4652743.46601.181620:4/20:4C43H68O8P
LPA identified as [M − H]
LPA(20:4)457.2355457.23621.5001aC23H38O7P
PI identified as [M − H]
PI(34:3)831.5024831.50300.7891aC43H76O13P
PI(34:1)835.5337835.5307−3.575616:0/18:1C43H80O13P
PI(38:5)883.5337883.53370.0086aC47H80O13P
PI(40:10)901.4867901.48700.2814aC49H74O13P
PI(42:0)949.6745949.6721−2.567aC51H98O13P
LPI identified as [M − H]
LPI(16:0)571.2883571.28972.340016:0C25H48O12P
PI-Cer identified as [M − H]
PI−Cer(t38:0h)868.5915868.5901−1.6315aC44H87NO13P
PI−Cer(t40:1h)894.6077894.60820.6170bC46H89NO13P
PI−Cer(t40:0h)896.6228896.6218−1.0707aC46H91NO13P
PI−Cer(t42:0h)924.6541924.6509−3.5109aC48H95NO13P
PI−Cer(t42:1h)922.6390922.6378−1.2553bC48H93NO13P
PI−Cer(t42:2h)920.6233920.62400.8190t18:1/h24:1C48H91NO13P
PI−Cer(t43:2h)934.6390934.64031.3860bC49H93NO13P
PI−Cer(t44:2h)948.6546948.65530.7034bC50H95NO13P
Table 5. Fatty acid profile of lipid extracts of Grateloupia turuturu, expressed in µg mg−1 extract, µg g−1 of biomass DW and relative percentage (%, w/w) of mean ± SD, n = 3. The nutritional, health and quality parameters of the lipid extract were calculated using the fatty acid composition. Abbreviations: saturated fatty acids (SFA), monounsaturated fatty acids (MUFA), polyunsaturated fatty acids (PUFA), PUFA/SFA, PUFA n-6/n-3 and nutritive value (NVI) indices, health lipid indices, such as atherogenic (AI), thrombogenic (TI), hypocholesterolemic/hypercholesterolemic (h/H) and peroxidizability index (PI) ratios.
Fatty AcidMean ± SD
Mean
(µg mg−1 Extract)(µg g−1 DW Biomass)(Relative Percentage, %)
C14:05.48 ± 0.7557.11 ± 1.372.00 ± 0.07
C15:04.62 ± 0.2148.41 ± 3.731.70 ± 0.13
C16:060.48 ± 10.44628.89 ± 47.7022.03 ± 0.98
C16:1n-94.28 ± 0.2144.89 ± 3.431.58 ± 0.14
C16:1n-76.7 ± 0.5070.12 ± 4.232.46 ± 0.12
C16:2n-64.37 ± 0.1345.94 ± 4.811.61 ± 0.15
C17:03.78 ± 0.0239.74 ± 4.751.39 ± 0.16
C17:1 4.83 ± 0.2550.64 ± 3.881.78 ± 0.12
C18:015.02 ± 3.77155.51 ± 23.295.44 ± 0.66
C18:1n-920.3 ± 1.94212.35 ± 13.597.44 ± 0.24
C18:1n-711.2 ± 0.71117.36 ± 8.034.12 ± 0.24
C18:2n-610.85 ± 0.78113.8 ± 11.223.99 ± 0.28
C18:3n-65.79 ± 0.2060.79 ± 5.512.13 ± 0.18
C18:3n-35.15 ± 0.0754.12 ± 6.051.90 ± 0.22
C18:4n-35.14 ± 0.0754.07 ± 5.921.90 ± 0.20
C20:06.22 ± 0.0465.46 ± 8.232.30 ± 0.28
C20:3n-66.73 ± 0.2970.58 ± 5.862.48 ± 0.19
C20:4n-635.41 ± 5.76368.19 ± 20.5612.91 ± 0.56
C20:5n-357.18 ± 8.74595.19 ± 32.1720.86 ± 0.56
Sum273.52 ± 34.492853.16 ± 139.33
SFA95.6 ± 15.09995.12 ± 66.5537.49 ± 5.91
MUFA42.48 ± 3.28444.72 ± 27.6516.66 ± 1.29
PUFA126.24 ± 15.771316.74 ± 57.0749.51 ± 6.18
Σ PUFA/Σ SFA1.32 ± 0.04
Σ n-658.77 ± 6.93613.35 ± 27.28
Σ n-367.47 ± 8.84703.39 ± 30.47
n-6/n-30.87 ± 0.01
NVI0.77 ± 0.03
EPA/AA1.62 ± 0.02
AI0.49 ± 0.02
TI0.32 ± 0.02
h/H2.4 ± 0.12
PI, %218.42 ± 30.47
Publisher’s Note: MDPI stays neutral with regard to jurisdictional claims in published maps and institutional affiliations.

