New Polyketides from the Marine-Derived Fungus Letendraea Sp. 5XNZ4-2
by
 and
and
Yan Xu
1, 
Ruibao Huang
1,
Hongwei Liu
2,
Tingting Yan
1,
Wanjing Ding
1,
Yongjun Jiang
1,
Pinmei Wang
1,
Daoqiong Zheng
1 and
Jinzhong Xu
1,* 1
Ocean College, Zhoushan Campus, Zhejiang University, Zhoushan 316021, China
2
State Key Laboratory of Mycology, Institute of Microbiology, Chinese Academy of Sciences, Beijing 100101, China
*
Author to whom correspondence should be addressed.
Mar. Drugs 2020, 18(1), 18; https://doi.org/10.3390/md18010018
Submission received: 19 November 2019
/
Revised: 12 December 2019
/
Accepted: 22 December 2019
/
Published: 24 December 2019
Abstract
:Marine-derived fungi have been reported to have great potential to produce structurally unique metabolites. Our investigation on secondary metabolites from marine-derived fungi resulted in the isolation of seven new polyketides (phomopsiketones D–G (1–4) and letendronols A–C (5–7)) as well as one known xylarinol (8) in the cultural broth of Letendraea sp. Their structures and absolute configurations were elucidated using a set of spectroscopic and chemical methods, including HRESIMS, NMR, single-crystal X-ray diffraction, ECD calculation, and a modified version of Mosher’s method. Compound 2 showed weak inhibition against nitric oxide production in lipopolysaccaride-activated macrophages with an IC50 value of 86 μM.
1. Introduction
Metabolites from marine-derived microorganisms have become important pharmacological resources [1,2]. At least 2000 novel natural products have been identified in the past five years, nearly 50% of which were derived from marine-derived fungi [3,4,5]. In addition, the metabolic pathways of marine-derived fungi, which can be attributed to unique marine habitats, especially those that contain sea salts, may be significantly different from terrestrial ones [6]. Thus, marine-derived fungi have great potential to produce structurally unique metabolites and have attracted a considerable amount of attention.
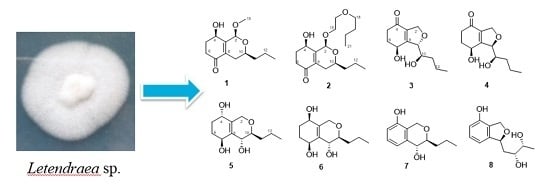
In our ongoing research on bioactive secondary metabolites from marine-derived fungi, we isolated an endophytic fungus Letendraea sp. 5XNZ4-2 from one sea crab. We obtained two novel spiroketals (letenketals A and B) from this fungus [7]. In order to obtain more structurally novel compounds, the systematic discovery of secondary metabolites for this strain was carried out. Seven new polyketides (phomopsiketones D–G (1–4) and letendronols A–C (5–7), see Figure 1) as well as one known xylarinol (8) were isolated from a Potato DFextrose Broth (1/2 PDB) cultural broth. Herein, we report the isolation, structure elucidation, and bioactivities of these compounds.
2. Results and Discussion
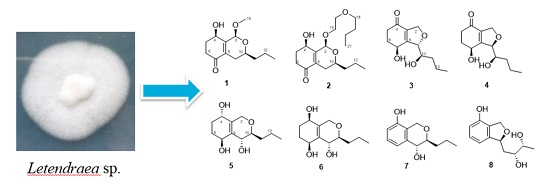
Compound 1 was obtained as a yellow amorphous powder. Its molecular formula was determined to be C13H20O4 (with 4 degrees of unsaturation) by HRESIMS (m/z 263.1256 for [M+Na]+) and NMR data. IR absorption at 3426 and 1672 cm−1 indicated the presence of a hydroxyl and unsaturated ketones. 1H-NMR (Table 1) of 1 displayed one methoxy (δH 3.50, s) and one methyl (δH 0.95, t, J = 7.0 Hz). The 13C NMR and DEPT displayed 13 carbon signals, including one α, β- unsaturated ketone (δC 198.2), two olefinic carbons (δC 132.5, 151.4), one ketal carbon (δC 95.2), two oxygenated carbons (δC 65.3, 66.7), and one methoxy (δC 55.8). Calculation of unsaturation revealed that compound 1 contained a bicyclic skeleton. An α, β-unsaturated cyclohexanone moiety was derived from the 1H-1H Correlation Spectroscopy (COSY) correlations between H-4 (δH 4.59)/H2-5 (δH 2.06, 2.28)/H2-6 (δH 2.40, 2.70), coupled with the Heteronuclear Multiple Bond Correlation (HMBC) correlations from H2-5 to C-3 (δC 151.4) and C-7 (δC 198.2) and H2-6 to C-7 and C-8 (δC 132.5) (Figure 2).
Two fragments of -CH2(12)-CH3(13) and -CH2(11)-CHO(10)-CH2(9)-, derived from 1H-1H COSY correlations of H3-13 (δH 0.95)/H2-12 (δH 1.43, 1.52) and H2-9 (δH 1.88, 2.36)/H-10 (δH 3.74)/H2-11 (δH 1.55, 1.61), were connected by the HMBC correlation from H2-12 to C-10 (δC 66.7) as one aliphatic chain. Then, this aliphatic chain of -CH2 (9)-CHO (10)-CH2 (11)-CH2 (12)-CH3 (13) was positioned at C-8 according to the HMBC correlations from H-9 to C-7 and H-10 to C-8. C-2 was connected with C-3 (δC 151.4) because of the HMBC correlations from H-2 to C-8, C-3, and C-4 (δC 65.3), and the oxygen bridge between C-2 and C-10 was determined by the HMBC correlation from H-2 to C-10. The methoxy was positioned at C-2 by the HMBC correlation from H3-15 (δH 3.50) to C-2 (δC 95.2). Compound 1 was determined to be a 5,6-deoxy and 2-methoxyated derivative of EI-1941-1 [8] and named phomopsiketone D.
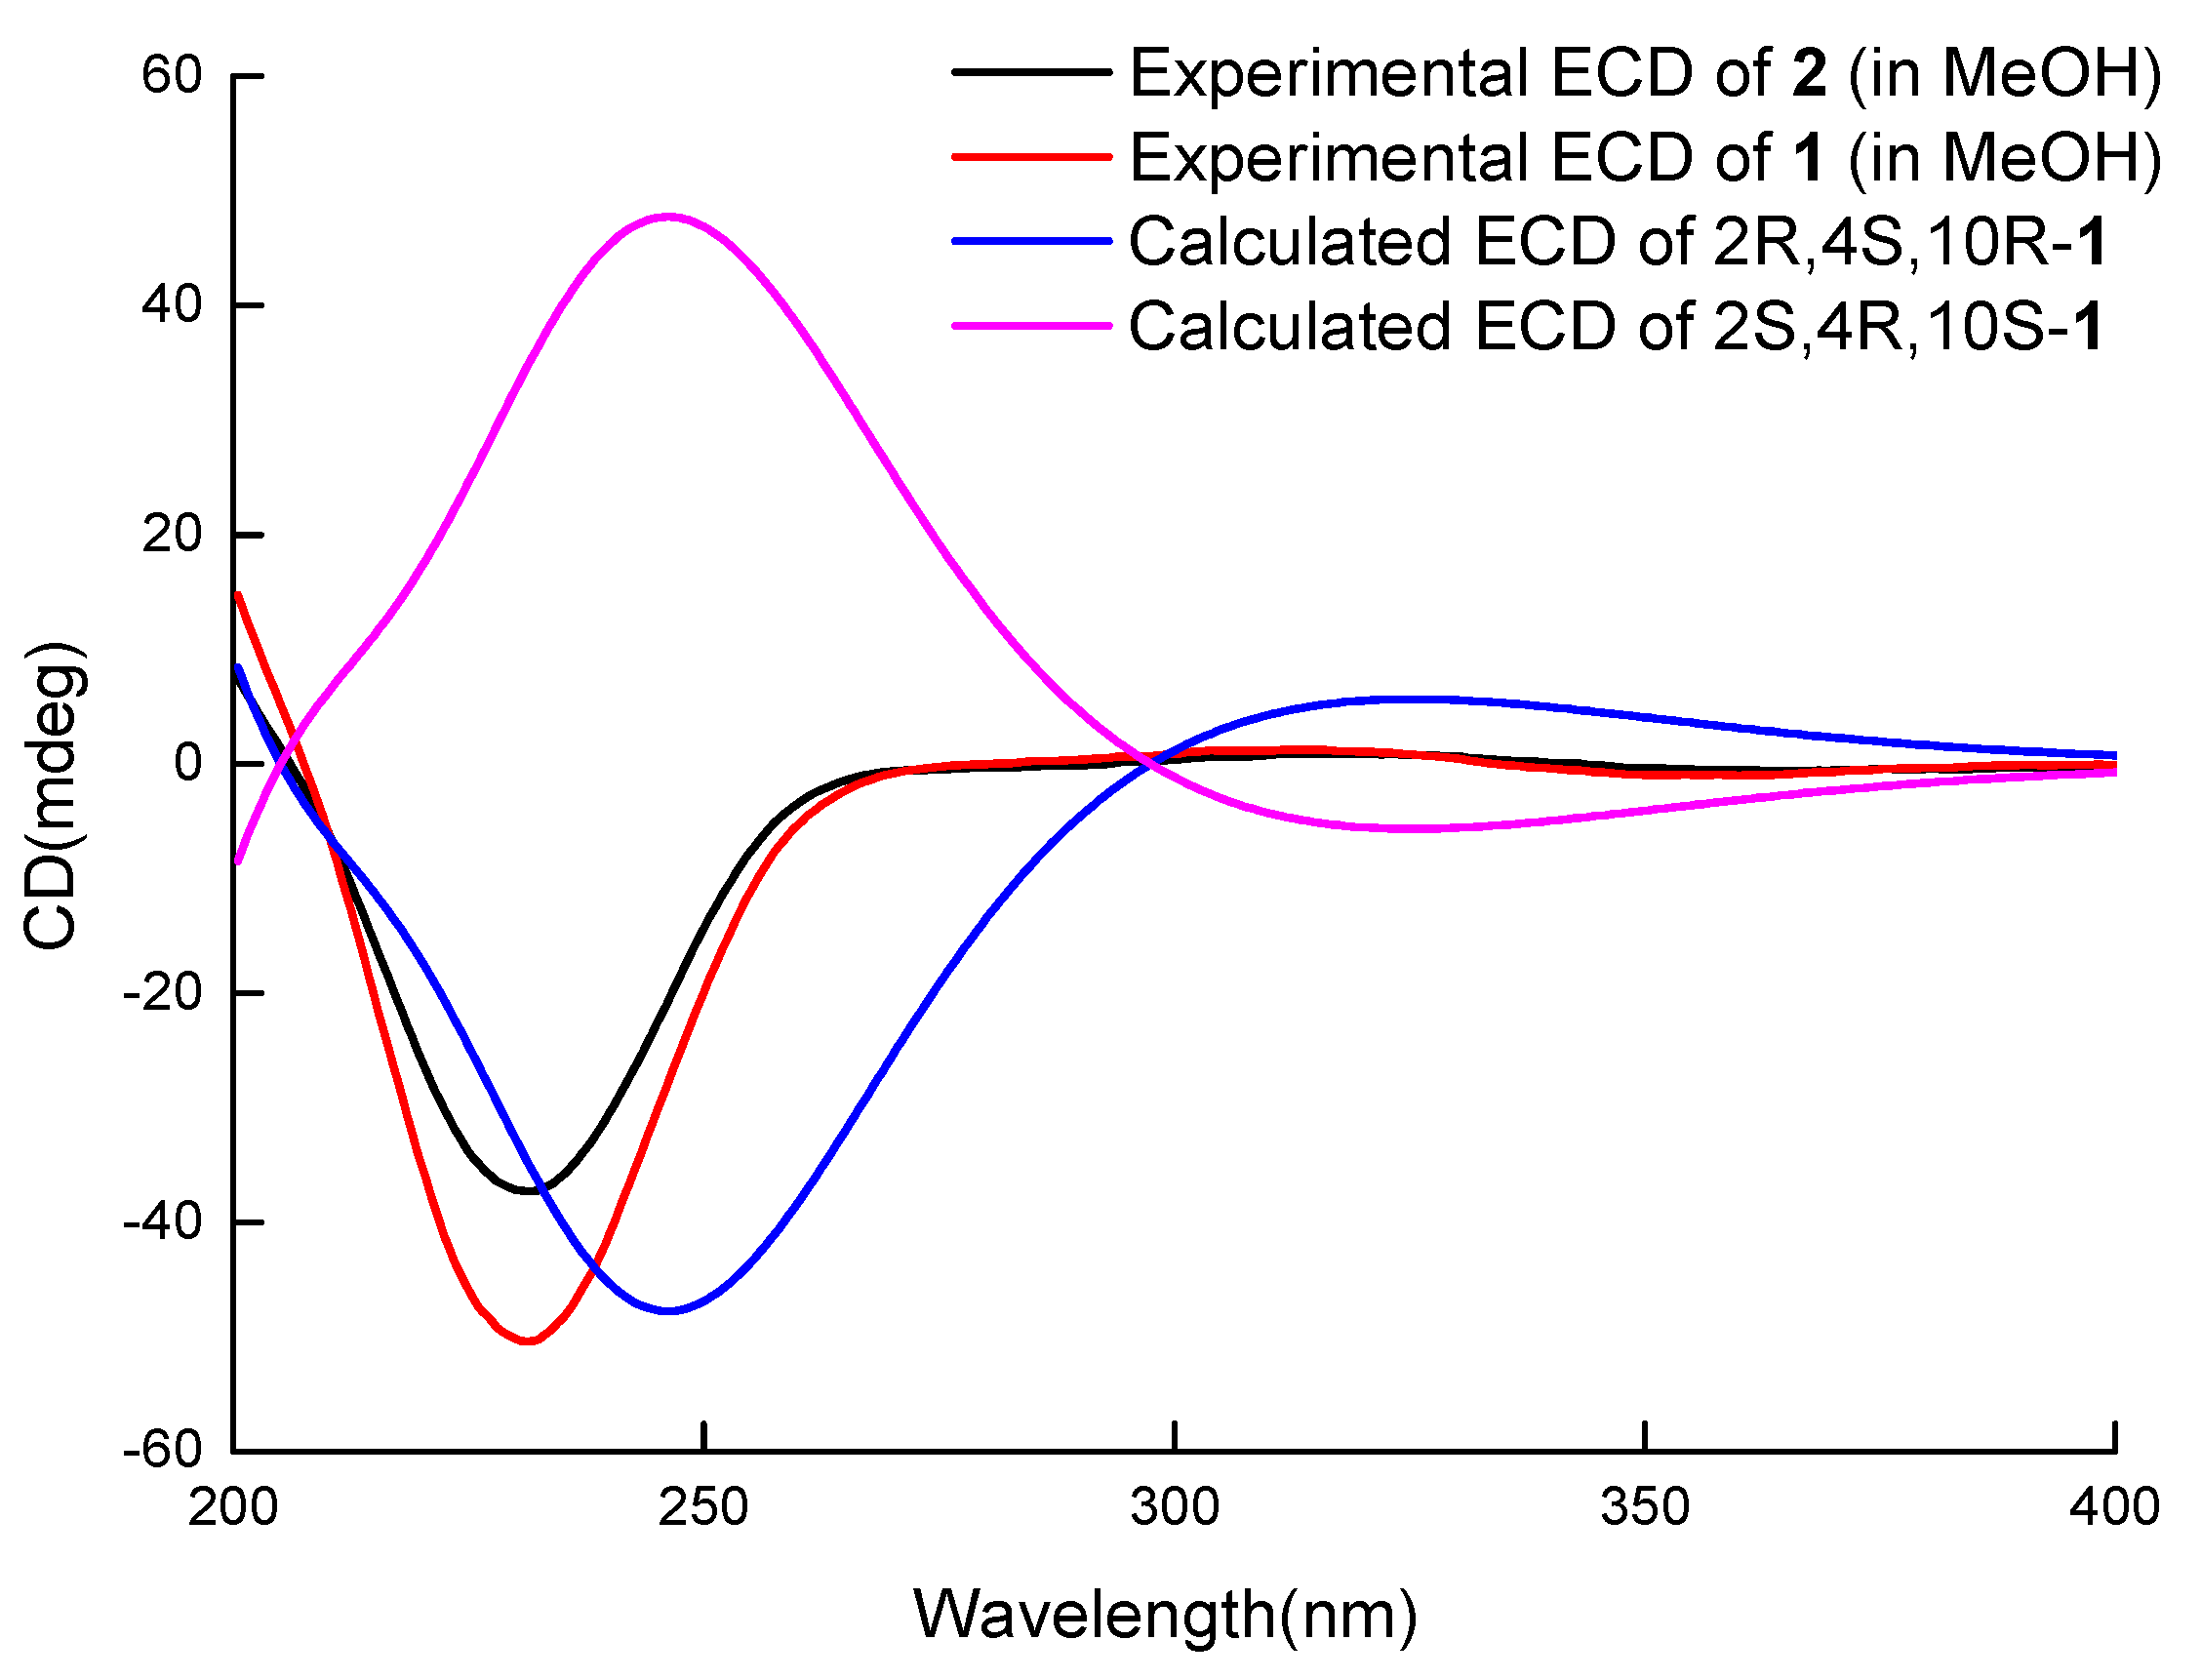
In order to establish the relative configuration of 1, the Nuclear Overhauser Effect Spectroscopy (NOESY) was measured (Figure S15). NOESY correlations between H-2/H-10 and H-6a/H-4 suggest that both of the cyclohexanone and dihydropyran (DHP) rings were in the twist chair conformation. The cross peaks between H-4/H-2/H-10 suggested that they adopted the same orientations. The absolute configuration of 1 was established by a comparison between the experimental ECD spectrum and the theoretically calculated values of two possible stereoisomers (2R, 4S, 10R)-1 and (2S, 4R, 10S)-1 [9,10]. The experimental ECD (Figure 3) of 1 showed a positive Cotton effect at 325 nm and a negative Cotton effect at 230 nm, which matched well with the calculated value of (2R, 4S, 10R)-1, and contributed to determining the absolute configuration of 1 as (2R, 4S, 10R).
Compound 2 was obtained as a light brown oil. Its molecular formula was determined to be C18H30O5 (with 4 degrees of unsaturation) on the basis of its HRESIMS (m/z 349.1989 for [M+Na]+) and NMR data. IR absorption at 3426 and 1678 cm−1 indicated the presence of a hydroxyl and unsaturated ketones. Its 13C NMR and DEPT spectra (Table 2) showed distinctive signals, including one α, β-unsaturated ketone (δC 197.9), two olefinic carbons (δC 131.5, 154.4), one ketal carbon (δC 95.6), and one oxygenated methine (δC 67.4), similar to those of 1, and indicated that compound 2 contained a similar bicyclic skeleton to that of 1. Additional signals, including three oxygenated methylenes (δC 68.4, 69.9, 71.5), two methylenes (δC 31.5, 19.3), and one methyl (δC 14.0), were observed, while the methoxy in 1 was absent in 2. These additional signals were organized as one 2-butoxyethoxy group (CH3(21)-CH2(20)-CH2(19)-CH2(18)-O-CH2(16)-CH2(15)) by 1H-1H COSY correlations of H2-15 (δH 3.86, 3.97)/H2-16 (δH 3.60, 3.66) and H2-18 (δH 3.53)/H2-19 (δH 1.61, 1.63)/H2-20 (δH 1.36, 1.39)/H3-21 (δH 0.94), combined with the HMBC correlations from H2-18 to C-16 and H2-16 to C-18 (Figure S1). The 2-butoxyethoxy group was connected to C-2 through an ether linkage according to the HMBC correlation from H2-15 to C-2 (δC 95.6). Thus, compound 2 was elucidated as shown in Figure 1 and named phomopsiketone E.
The DHP and cyclohexanone rings were also in twist chair conformations according to the NOESY correlation between H-2 and H-10 as well as the H-6 axial and H-4. The ECD spectra (Figure 3) of 1 and 2 showed similar curves (the cotton effect was positive at 325 nm (1) and 325 nm (2), and negative at 230 nm (1) and 228 nm (2)), and determined the absolute configurations of (2R, 4S, 10R) for 2.
Compound 3 was obtained as a yellow oil. Its molecular formula was determined to be C12H18O4 (with 4 degrees of unsaturation) on the basis of its HRESIMS (m/z 261.0895 for [M+Cl]-) and NMR data. Carbon NMR (Table 2) showed 12 signals, including one α, β-unsaturated ketone (δC 197.1), two olefinic carbons (δC 136.0, 163.6), nine aliphatic carbons that were grouped into one methyl (δC 14.4), five methylenes (δC 20.0, 34.5, 35.6, 37.1, and 73.8 (oxygenated)), and three oxygenated methines (δC 66.0, 74.4, 91.3), by an Heteronuclear singular Quantum Coherence (HSQC) spectrum. These signals were similar to those of phomopsiketone A [11] except that one methylene in 3 replaced one oxygenated methine in phomopsiketone A. Several NMR signals, including a multiplet for H-7 (δH 4.67) (Table 1), and 1H-1H COSY correlations of H-7/H2-6/H2-5 (Figure 2) indicated the presence of 6-CH2. Thus, 3 was determined to be 6-deoxy-phomopsiketone A and named phomopsiketone F.
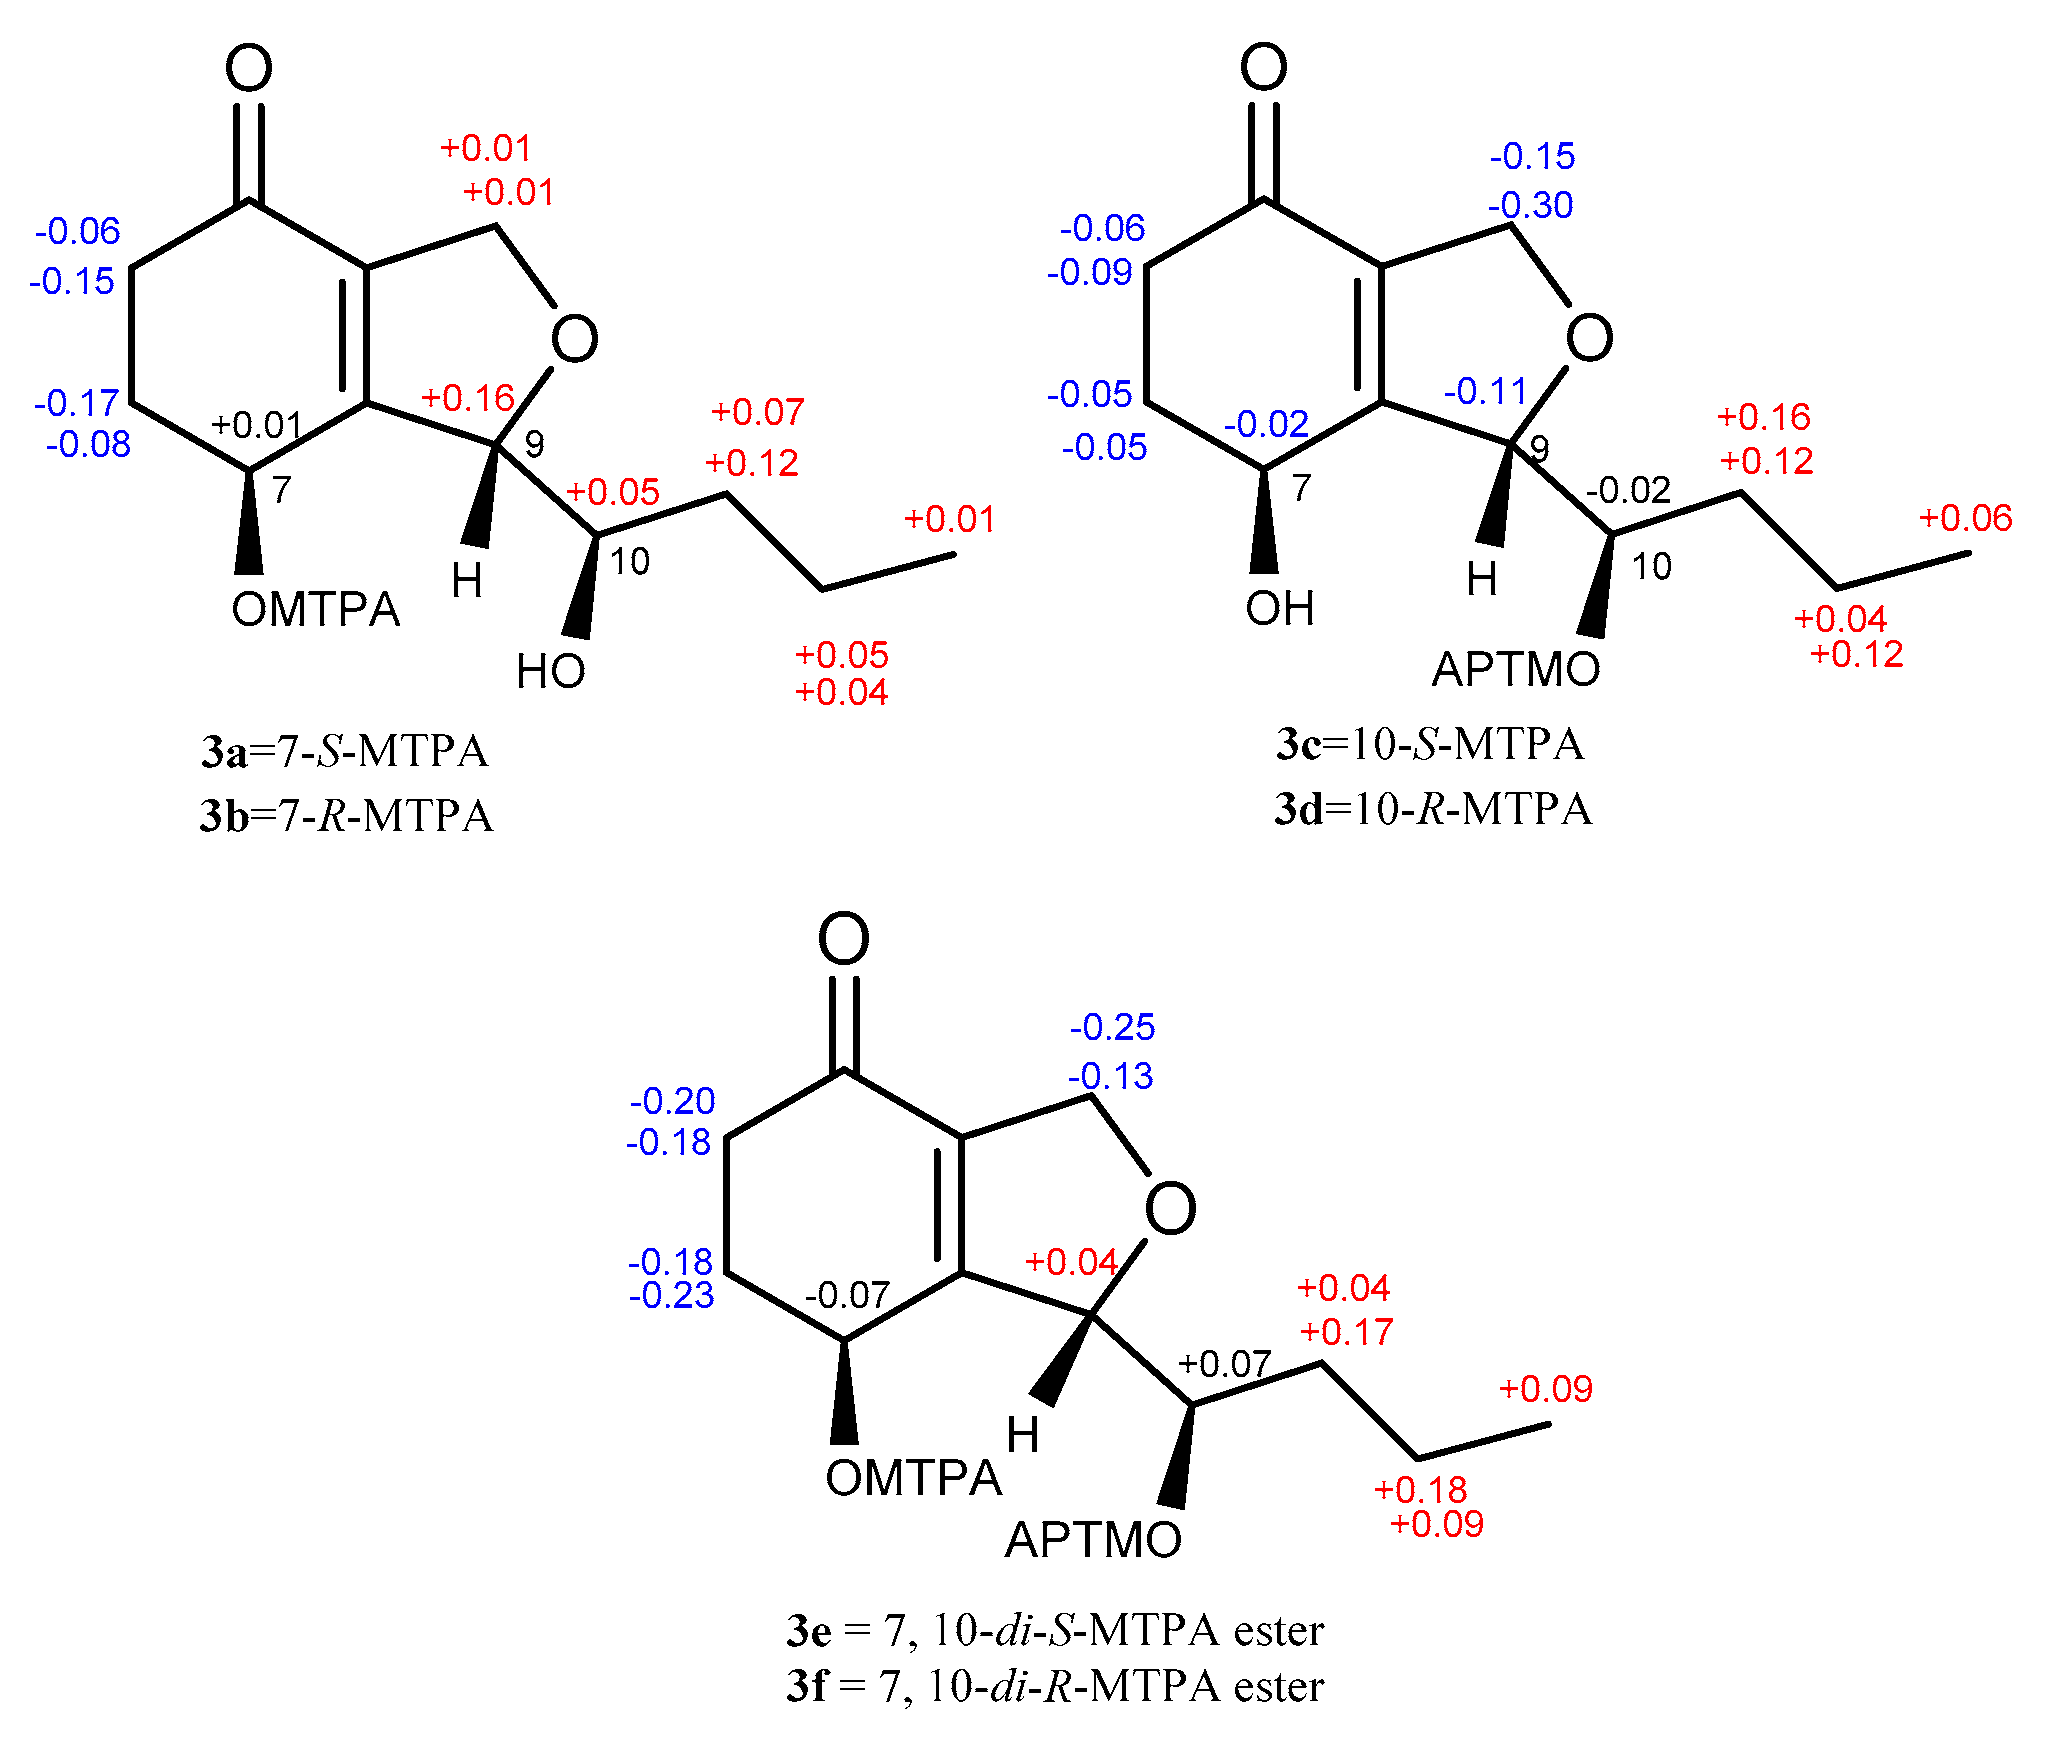
The absolute configuration of 3 was determined by a modified version of Mosher’s esterification method [12,13]. Compound 3 was acylated with R-(−)-and S-(+)-α-methoxy-α (trifluoromethyl) phenylacetyl chloride (α-MTPA-Cl). The products were separated by preparative HPLC and purified as six compounds, which were determined to be the 7-S-MTPA ester (3a), 7-R-MTPA ester (3b), 10-S-MTPA ester (3c), 10-R-MTPA ester (3d), 7,10-di-S-MTPA ester (3e), and 7,10-di-R-MTPA ester (3f) by HRESIMS (7,10-S-MTPA ester, m/z 465.1500; 7,10-R-MTPA ester, m/z 465.1497; 7,10-di-S-MTPA ester, m/z 681.1896; 7,10-di-R-MTPA ester, m/z 681.1893 for [M+Na]+, Figures S86, S87, S89, S90, S93 and S94, respectively), 1H NMR data (δH-7 6.14 for 3a, 6.13 for 3b; δH-10 5.40 for 3c, 5.42 for 3d, Figures S84 and S88, respectively), and the 1H-1H COSY correlations (Figure S85) of H-7 (δH 6.14)/H-6 (δH 2.09, 2.47) and H-10 (δH 3.67)/H-11 (δH 1.55, 1.44) in 3a. A comparison of proton chemical shifts between 3a/3b and 3c/3d (Δδ3a-3b and Δδ3c-3d, Figure 4) determined the configurations of C-7 and C-10 to be 7S and 10R, respectively. A NOESY correlation between H-7 (δH 5.92) and H-10 (δH 5.31) was observed in 3f and allowed us to deduce the configuration of C-9 as S (Figures S5 and S92). Thus, the absolute configuration of 3 was determined to be (7S, 9S, 10R).
Compound 4 was also obtained as a yellow oil. Its molecular formula was established as C12H18O4, identical to that of 3, by HRESIMS (m/z 249.1101 for [M+Na]+) and NMR data. The proton and carbon spectra were also similar to those of 3 (Table 1 and Table 2) and a two-dimensional (2D) NMR analysis (Figure S2) enabled us to deduce that it has the same planar structure as 3. Different ECD spectra of 3 and 4 (Figure S8) were used to confirm that they were stereoisomers.
A NOESY correlation between H-7 and H-9 was not observed. Then, the modified version of Mosher’s esterification method was applied to determine the absolute configuration of 4. Esterification of 4 with (R)- and (S)-MTPA-Cl yielded the 7,10-di-S-MTPA ester (4a) and the 7,10-di-R-MTPA ester (4b), respectively. The similar 1H NMR chemical shift differences (Δδ4e-4f, Figure S6 and Figure 3) around the C-7 and C-10 stereocenters as 3 indicated the 7S and 10R configurations for 4. Since 4 was the stereoisomer of 3, the configuration of C-9 in 4 was deduced to be R, contrary to that in 3. Thus, the absolute configuration of 4 was determined to be (7S, 9R, 10R) and it was named phomopsiketone G.
Compound 5 was crystallized as colorless needles in acetone. Its HRESIMS showed an ion peak [M+Na]+ at m/z 251.1258, corresponding to the molecular formula C12H20O4 and possessing two hydrogen atoms more than 3 and 4. A comparison of 13C NMR data between 3 and 5 revealed that the ketone carbonyl (δC 197.1, C-4 in 3) was replaced by one oxygenated methine (Table 2). 1H-1H COSY correlations between H-4 (δH 4.06)/H-5 (δH 1.54, 2.02)/H-6 (δH 1.56, 2.07)/ H-7(δH 4.43) (Figure S3) confirmed that the ketone carbonyl was hydrogenated. A similar C5 side chain (CH3-13/CH2-12/CH2-11/CH-10/CH-9) to that in 3 was derived from 1H-1H COSY correlations (Figure S3). Key HMBC correlations from H-2 (δH 4.02) to C-10 (δC 80.4) and H-9 (δH 3.99) to C-3 (δC 137.1) (Figure S3) indicated the presence of a dihydropyran fragment that was different from the dihydrofuran in 3. Thus, 5 was determined to be a new polyketide and named letendronol A.
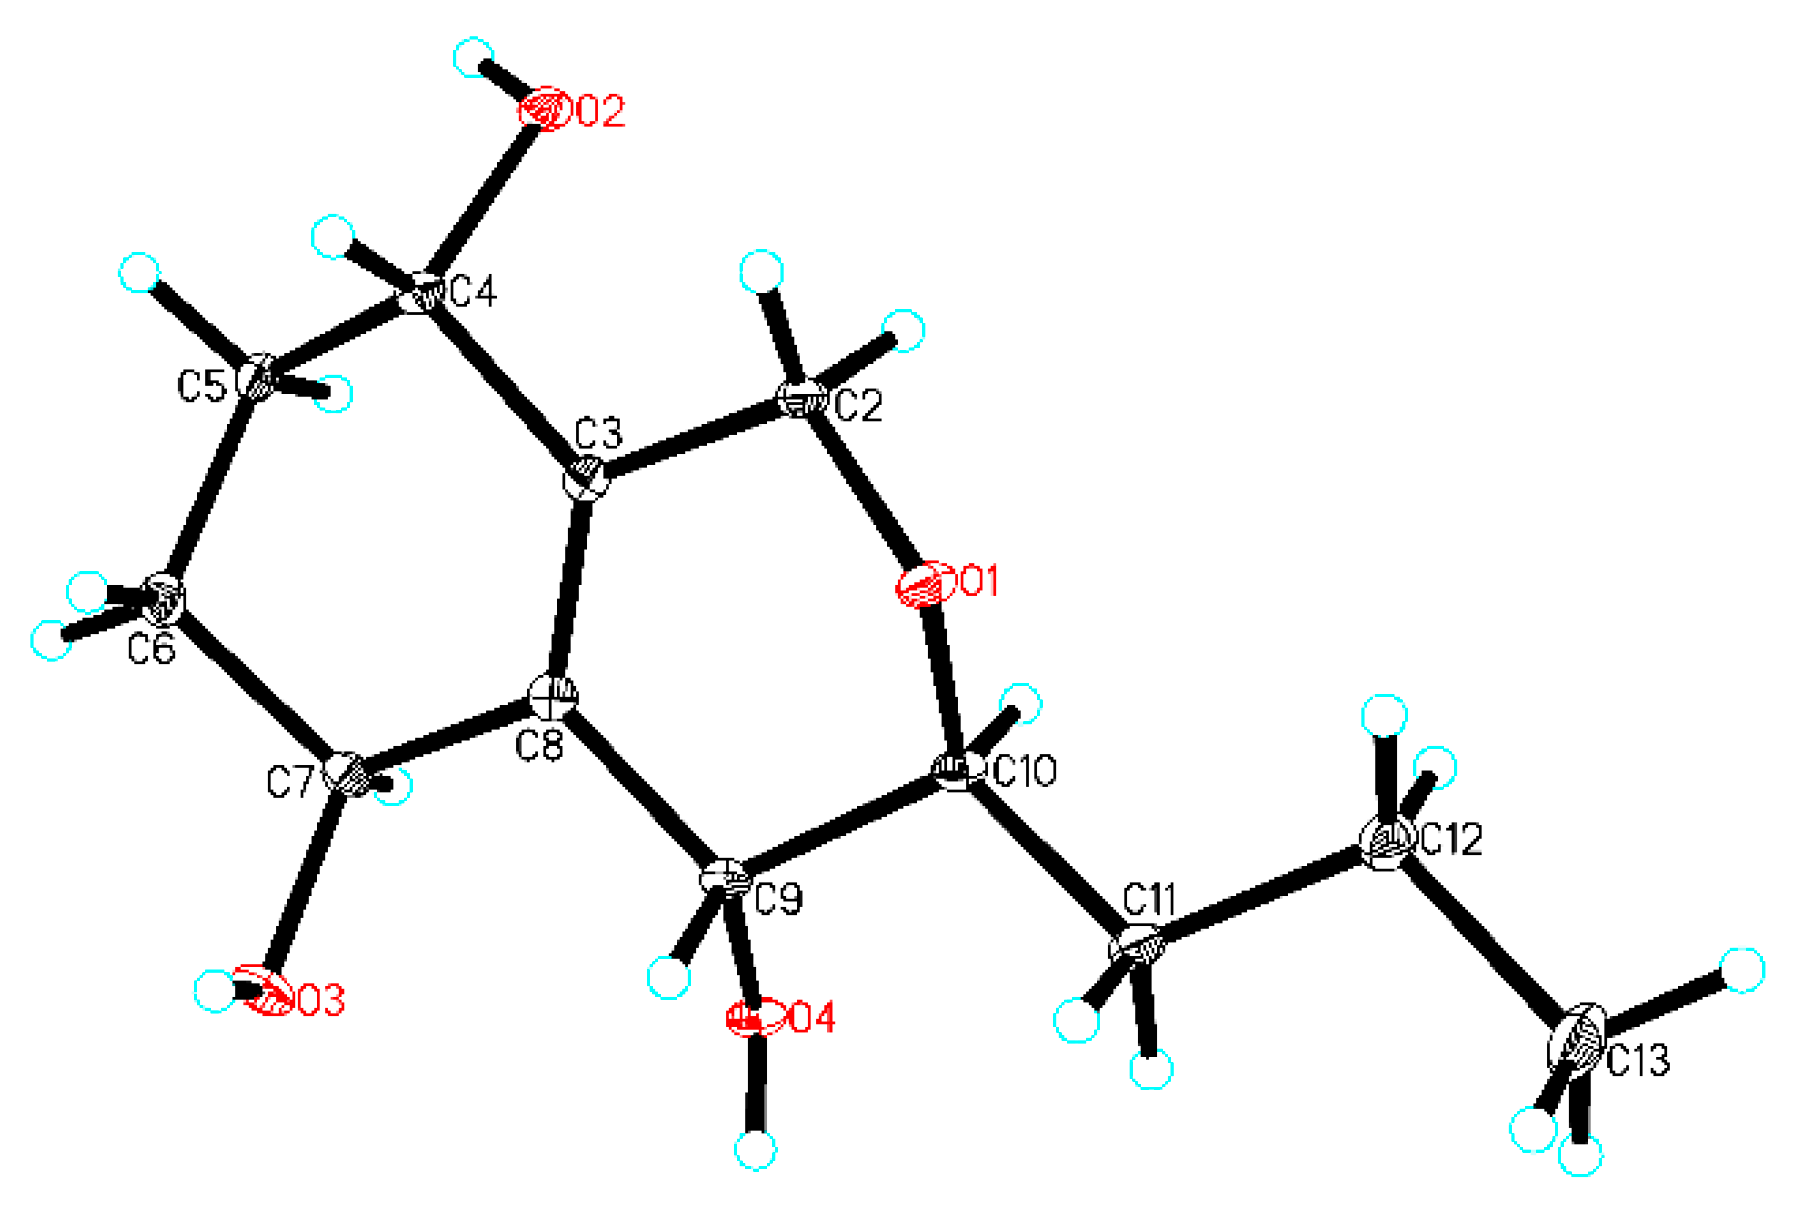
In order to establish the relative configuration, 5 was crystallized and, by use of X-ray analysis (Figure 5), H-4 and H-9 were assigned to the same orientation, and H-7 and H-10 were assigned to the opposite orientation of H-4 and H-9.
The tri-(S/R) MTPA esters (5a/5b) were obtained by the modified version of Mosher’s method together with HPLC purification. A 1H NMR data comparison of 5a and 5b (Δδ5a-5b, Figure S7) determined the absolute configurations of (4S, 7S, 9R) in 5. Finally, the configuration of 5 was unambiguously confirmed to be (4S, 7S, 9R, and 10S) by X-ray analysis combined with the modified version of Mosher’s method.
Compound 6 was contained as a colorless amorphous powder. It has the same molecular formula (C12H20O4) as 5 according to its HRESIMS (m/z 251.1260 for [M+Na]+) and 13C NMR data. One dimensional (1D) NMR data (Table 1 and Table 2) combined with a 2D NMR analysis (Figure S3) revealed 6 to have the same planar structure as 5. Compound 6 was deduced to be a stereoisomer of 5 because of their different retention times when eluted by the same HPLC program and was named letendronol B.
Compounds 6 and 5 contained different a configuration at C-4, which was assigned by the modified version of Mosher’s method. Treatment of 6 with (R)- or (S)-MTPA-Cl yielded the tri-(S/R) MTPA esters (6a/6b). The result of the application of the modified version of Mosher’s method (Δδ6a-6b, Figure S7) revealed 7S and 9R configurations, identical to 5, and a 4R configuration different from 5, in 6. H-9 and H-10 were also assigned to different orientations according to the broad singlet peaks for H-9 in 6a (δH 5.11, br s) and 6b (δH 4.78, br s) (Figure S110), similar to those in 5a (δH 5.19, br s) and 5b (δH 4.76, br s) (Figure S98). Then, the absolute configuration of 6 was determined to be (4R, 7S, 9R, and 10S).
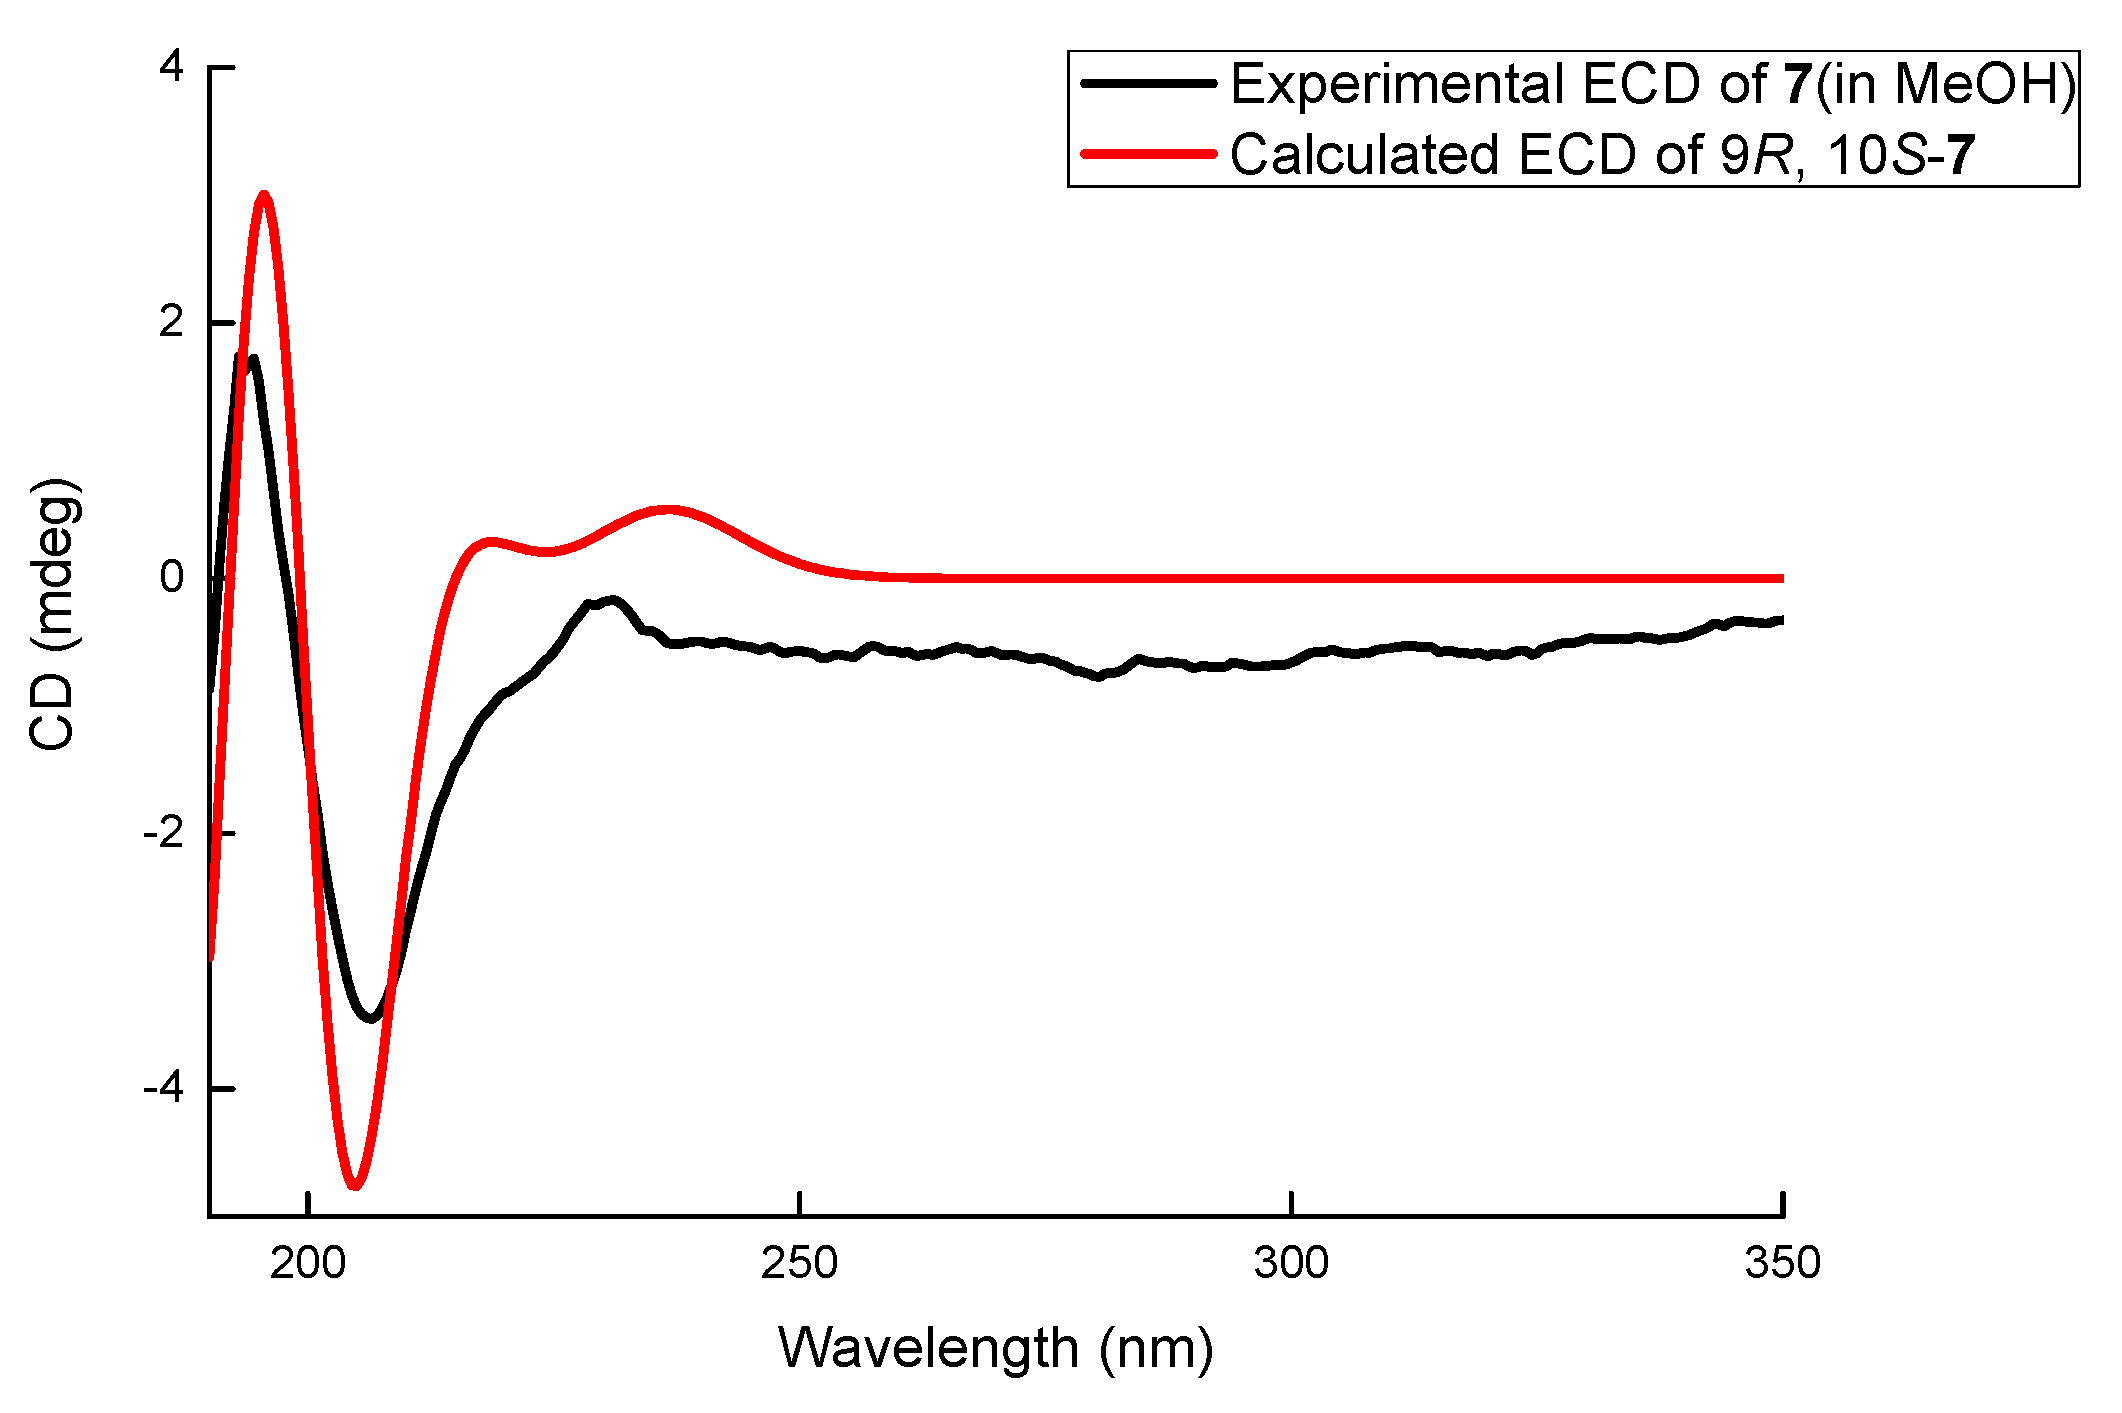
Compound 7 was obtained as a white amorphous powder. The molecular formula of 7 was determined to be C12H16O3 with 5 degrees of unsaturation by its HRESIMS (m/z 231.0995 for [M+Na]+) and NMR data. The 1H NMR (Table 1) of 7 displayed one methyl (δH 0.99, 3H, t, J = 7.2 Hz) and three aromatic protons (δH 6.63, 1H, d, J = 8.0 Hz; δH 7.07, 1H, t, J = 8.0 Hz; δH 7.01, 1H, d, J = 8.0 Hz) whose coupling constants revealed their ortho-relationship. The 13C NMR spectrum (Table 2) showed 12 signals, which were assigned by HSQC data to six aromatic carbons (δC 153.5, 113.8, 128.3, 118.9, 140.0, and 123.3), two oxygenated methines (δC 80.4, 70.1), one oxygenated methylene (δC 65.3), two methylenes (δC 35.5 and 19.8), and one methyl carbon (δC 14.4). A similar C5 side chain to those in 3–6 was derived from 1H-1H COSY correlations (Figure S4) between H-13 (δH 0.99)/H2-12 (δH 1.48, 1.65)/H2-11 (δH 1.50, 1.89)/H-10 (δH 3.37)/H-9 (δH 4.30) and connected with the aromatic ring at C-8 (δC 140.0) according to the HMBC correlations from H-9 to C-8 (δC 140.0), C-3 (δC 123.3), and C-7 (δC 118.9). Meanwhile, oxygenated CH2 (δC 65.3, C-2) was connected with C-3 (δC 123.3) because of the HMBC correlations from H2-2 (δH 4.60, 4.82) to C-3, C-8, and C-4 (δC 153.5). The oxygen bridge between C-2 and C-10 (δC 80.4) was determined by the HMBC correlation from H-2 to C-10. Thus, compound 7 was determined to be a new polyketide containing an isochroman skeleton and named letendronol C. The vicinal coupling constant JH-9/H-10 (8.5 Hz) indicated a trans relationship between H-9 and H-10. A comparison of the optical rotation of 7 ([α]20D +9) with that of (3R,4S)-6,8-Dihydroxy-1,1-dimethyl-3,4,5-trimethylisochroman [14] ([α]25D -28.5) was used to determine that the absolute configurations at C-9 and C-10 were R and S, respectively. The 9R and 10S configurations of 7 were also confirmed by a comparison between the experimental ECD spectrum and the theoretically calculated values of (9R, 10S)-7. The experimental ECD (Figure 6) of 7 showed a positive Cotton effect at 195 and a negative Cotton effect at 205 nm, which matched well with the calculated value of (9R, 10S)-7.
The known compound 8 was determined to be xylarinol by comparison of its NMR data with the reported literature [15].
Compounds 1, 2, 3, and 5 were evaluated for their inhibitory activities against Lipopolysaccharide (LPS)-activated NO production in RAW264.7 [16], and all tested compounds showed no cytotoxicity to macrophage cells at the concentration of 100 μM and 50 μM by the MTT method. Compound 2 showed weak anti-inflammatory activity with an IC50 value of 86 μΜ. Hydrocortisone was used as a positive control with the IC50 value of 22.4 μM. The other compounds showed no anti-inflammatory activity with IC50 values of >100 μM. All compounds were assayed for their cytotoxicity against the prostate cancer PC3 cell line by the MTT method [17]. Compounds 1–3, 5, 6, and 8 were also assayed for antibacterial activity against Staphylococcus aureus, Staphylococcus epidermidis, Escherichia coli, Miconia albicans and Pseudomonas aeruginosa using the Kirby−Bauer Diffusion method. Regrettably, none of these compounds showed any activities in the cytotoxicity and antibacterial tests.
3. Materials and Methods
3.1. General Experimental Procedures
Optical rotations were measured on Rudolph research analytical AUTOPOL I. The ultraviolet spectra were obtained from a Shimadzu UV-1800 spectrophotometer using MeOH as the solvent. Electronic circular dichroism (ECD) spectra were obtained on a JASCO J-1500 circular dichroism. The infrared (IR) spectra were acquired from a Bruker Vector 22. NMR spectra were recorded on a Bruker AVIII 500 MHz and JEOL 600 Hz, using TMS as the internal standard. HRESIMS spectra were obtained from an Agilent 6224 TOF LC/MS. Analytical HPLC was performed on an Agilent 1260 system using a C18 (Cosmosil, 5 μm, 4.6 × 250 mm) column. The column chromatography was carried out using Silica gel (200–300 mesh, Qing Dao Hai Yang Chemical Group Co., Qing Dao, China).
3.2. Fungal Material and Fermentation
The Letendraea sp. was isolated from the gut of a crab found on Zhairuoshan Island (N20.2920, E122.5), Zhoushan, Zhejiang Province, China, in August 2015. The fungus was determined to be Letendraea sp. by 26s rDNA sequence analysis (GenBank accession no. MK743951), and produced a sporulating, white-colored culture when growing on potato-dextrose agar (PDA). The strain was deposited (NO. 5XNZ4-2) at the Institute of Marine Biology of Zhejiang University. The strain was static cultured at 28 °C for 30 days in 500 mL Erlenmeyer flasks (100 × 200 mL, a total of 20 L) each containing 200 mL of 1/2 PDB liquid media (100 g of potato extract, 17 g of artificial sea salt, and 10 g of dextrose in 1 L pure water).
3.3. Extraction and Isolation
The culture broth (20 L) was filtered and extracted with equivoluminal EtOAc three times to obtain 2.79 g of metabolite extract, which was fractionated by column chromatography (CC) over silica gel (200−300 mesh, 60 g) and eluted in a gradient of petroleum ether (P)-EtOAc(E) (20:1–1:1) to yield 10 fractions (Frs. 1–10) based on TLC analysis. Fr. 7 was further separated via preparative HPLC with a C18 (Agilent, 10 μm, 21.2 × 250 mm) column at 210 nm, eluting with MeOH/H2O (40/60, v/v) at 8 mL/min to obtain four sub-fractions (Fr. 7.1–7.4). Fr. 7.1 (110 mg) was purified with semi-preparative HPLC (Agilent C18 column, 10 μm, 10 × 250 mm, MeCN/H2O 10:90, 4 mL/min, 210 nm) to yield 3 (73 mg). Fr. 10 was purified by CC over silica gel (200−300 mesh, 30 g) using a gradient of CH2Cl2-MeOH (50:1–1:1) as a mobile phase to provide five fractions (Fr. 11–15). Fr. 13 was also separated via preparative HPLC (Agilent C18 column, 10 μm, 21.2 × 250 mm, 210 nm), eluting with MeOH/H2O (15:85, v/v) at 10 mL/min to obtain 5 (148 mg) and other three sub-fractions (Fr. 13.1–13.3). Fr. 13.2 (64 mg) was further purified on semi-preparative HPLC (Agilent C18 column, 10 μm, 10 × 250 mm, MeOH/H2O 15:85, 4 mL/min, 210 nm) to yield 6 (14 mg). Fr. 8 was initially separated by CC over silica gel (200−300 mesh, 60 g) with a dichloromethane (D) and MeOH (M) gradient from 80:1 to 5:1 based on TLC analysis to afford 10 sub-fractions (Fr. 8.1–8.10). Sub-fractions Fr. 8.3 (142 mg), Fr. 8.5 (33 mg), Fr. 8.9 (24.2 mg), and Fr. 8.10 (45.7 mg) were all further purified by semi-preparative HPLC (Agilent C18 column, 10 μm, 10 × 250 mm, 230 nm) at 4 mL/min using MeCN/H2O (63/37, v/v), MeCN/H2O (25/75, v/v), MeOH/H2O (18/82, v/v), and MeOH/H2O (35/65, v/v) as the eluting solvents, respectively. Compounds 1 (16.4 mg) and 2 (19.2 mg) were acquired from Fr. 8.3. Compounds 7 (7.7 mg), 4 (2.7 mg), and 8 (19.4 mg) were obtained from Fr. 8.5, Fr. 8.9, and Fr. 8.10, respectively.
Phomopsiketone D (1): Yellow amorphous powder; molecular formula C13H20O4; [α] 20 D –60 (c 0.1, MeOH); ECD (0.50 mg/mL, MeOH) λmax (Δ ε) 350 (–0.97), 311 (+1.24), 230 (–50.40), 194 (+27.24) nm; UV (MeOH) λmax (log ε) 232 (3.93) nm; IR (λmax) 3426, 2957, 2933, 2874, 2830, 1672, 1422, 1380, 1332, 1280, 1189, 1172, 1095, 1066, 1040, 979, 950, 906 cm−1; 1H NMR data (500 MHz, in CDCl3) and 13C NMR data (125 MHz, in CDCl3), see Table 1 and Table 2; HRESIMS m/z [M+Na]+ 263.1256 (calcd. for C13H20O4Na, 263.1259).
Phomopsiketone E (2): Light brown oil; molecular formula C18H30O5; [α] 20 D –60 (c 0.1, MeOH); ECD (0.50 mg/mL, MeOH) λmax (Δ ε) 365 (–0.64), 311 (+0.87), 230 (–37.30), 194 (+15.31) nm; UV (MeOH) λmax (log ε) 232 (3.99) nm; IR (λmax) 3437, 2958, 2932, 2873, 1678, 1462, 1326, 1279, 1172, 1121, 1074, 1034, 924, 906 cm−1; 1H NMR data (500 MHz, in CDCl3) and 13C NMR data (125 MHz, in CDCl3), see Table 1 and Table 2; HRESIMS m/z [M+Na]+ 349.1989 (calcd. for C18H30O5Na, 349.1991).
Phomopsiketone F (3): Yellow oil; molecular formula C12H18O4; [α] 20 D –30 (c 0.1, MeOH); ECD (0.40 mg/mL, MeOH) λmax (Δ ε) 323 (+9.56), 259 (–48.72), 203 (+58.04) nm; UV (MeOH) λmax (log ε) 257 (3.75), 210 (3.80) nm; IR (λmax) 3437, 2961, 2870, 1671, 1542, 1398, 1124, 1071, 1026, 922, 849 cm−1; 1H NMR data (500 MHz, in CD3OD) and 13C NMR data (125 MHz, in CD3OD), see Table 1 and Table 2; HRESIMS m/z [M+Cl]- 261.0895 (calcd. for C12H18O4Cl, 261.0894).
Phomopsiketone G (4): Yellow oil; molecular formula C12H18O4; [α] 20 D –2 (c 0.1, MeOH); ECD (0.45 mg/mL, MeOH) λmax (Δ ε) 322 (–2.76), 255 (–12.86), 204 (+34.78) nm; UV (MeOH) λmax (log ε) 225 (4.18) nm; IR (λmax) 3386, 2958, 2932, 2872, 1665, 1460, 1395, 1125, 1074, 1003, 947, 855 cm−1; 1H NMR data (600 MHz, in CD3OD) and 13C NMR data (150 MHz, in CD3OD), see Table 1 and Table 2; HRESIMS m/z [M+Na]+ 249.1101 (calcd. for C12H18O4Na, 249.1103).
Letendronol A (5): Colorless needle-like crystal from acetone; mp 159–160 °C; molecular formula C12H20O4; [α] 20 D –5 (c 0.1, MeOH); ECD (0.50 mg/mL, MeOH) λmax (Δ ε) 213 (–60.56), 194 (+41.96) nm; UV (MeOH) λmax (log ε) 263 (2.37) nm; IR (λmax) 3338, 3295, 2953, 2921, 2866, 1459, 1322, 1292, 1155, 1120, 1070, 1034, 1005, 924, 905 cm−1; 1H NMR data (500 MHz, in CD3OD) and 13C NMR data (125 MHz, in CD3OD), see Table 1 and Table 2; HRESIMS m/z [M+Na]+ 251.1258 (calcd. for C12H20O4Na, 251.1259).
Letendronol B (6): Colorless amorphous powder; molecular formula C12H20O4; [α] 20 D –3 (c 0.1, MeOH); ECD (0.40 mg/mL, MeOH) λmax (Δ ε) 214 (–20.71), 195 (+31.03) nm; UV (MeOH) λmax (log ε) 263 (2.37) nm; IR (λmax) 3354, 2956, 2872, 1447, 1332, 1280, 1186, 1152, 1102, 1054, 1005, 970, 948 cm−1; 1H NMR data (500 MHz, in CD3OD) and 13C NMR data (125 MHz, in CD3OD), see Table 1 and Table 2; HRESIMS m/z [M+Na]+ 251.1260 (calcd. for C12H20O4Na, 251.1259).
Letendronol C (7): White amorphous powder; molecular formula C12H16O3; [α] 20 D +9 (c 0.1, MeOH); ECD (0.40 mg/mL, MeOH) λmax (Δ ε) 280 (–0.77), 206 (–3.45) nm; UV (MeOH) λmax (log ε) 275 (3.03), 205 (3.96) nm; IR (λmax) 3354, 2958, 2930, 2872, 1593, 1469, 1366, 1280, 1230, 1090, 1049, 1015, 964, 898, 840, 803, 762 cm−1; 1H NMR data (500 MHz, in CD3OD) and 13C NMR data (125 MHz, in CD3OD), see Table 1 and Table 2; HRESIMS m/z [M+Na]+ 231.0995 (calcd. for C12H16O3Na, 231.0997).
3.4. ECD Calculation of Compound 1
Monte Carlo conformational searches were carried out by means of the Spartan’s 10 software using Merck Molecular Force Field (MMFF). The conformers with a Boltzmann population of over 5% were chosen for ECD calculations, and then the conformers were initially optimized at the B3LYP/6-31+g (d, p) level in MeOH using the CPCM polarizable conductor calculation model. The theoretical calculation of ECD was conducted in MeOH using time-dependent density functional theory (TD-DFT) at the B3LYP/6-311+g (d, p) level for all conformers of compound 1. Rotatory strengths for a total of 50 excited states were calculated. ECD spectra were generated using the program SpecDis 1.6 (University of Würzburg, Würzburg, Germany) and GraphPad Prism 5 (University of California San Diego, USA) from dipole-length rotational strengths by applying Gaussian band shapes with sigma = 0.3 eV [18].
3.5. Preparation of MTPA Esters of Compound 3
Compound 3 (4 mg, 8.85 μmol each) in 1 mL of anhydrous pyridine was separated into two equal portions. (R)- or (S)-MTPA chloride (5 μL, 26.6 μmol each) was added into the two portions, respectively. Each reaction mixture was stirred at ambient temperature for 4 h and the reaction was terminated by adding 1 mL of methanol. The reaction mixtures were dried under vacuum and separated by HPLC (column: Agilent ODS column, 10.0 × 250 mm; mobile phase: MeOH-H2O, 70:30 (v/v); flow rate: 4 mL/min) to afford the 7-S-MTPA ester (3a, 0.56 mg), 7-R-MTPA ester (3b, 0.68 mg), 10-S-MTPA ester (3c, 1.02 mg), 10-R-MTPA ester (3d, 0.96 mg), 7,10-di-S-MTPA ester (3e, 0.73 mg), and 7,10-di-R-MTPA ester (3f, 0.85 mg) of 3.
3.6. Preparation of MTPA Esters of Compounds 4–6
Compounds 4 (1 mg), 5 (4 mg), and 6 (1.5 mg) in 1 mL of anhydrous pyridine were separated into two equal portions. (R)- or (S)-MTPA chloride (50 μL each) was added into each portion, respectively. Each reaction mixture was stirred at ambient temperature for 4 h and the reaction was terminated by adding 1 mL of methanol. HPLC was also used for the isolation of (S)-MTPA ester -4 (4a, 0.7 mg) and (R)-MTPA ester -4 (4b, 0.7 mg). The (S)-MTPA and (R)-MTPA esters of 5 (5a, 5.0 mg; 5b, 5.7 mg) and 6 (6a, 2.30 mg; 6b, 1.92 mg) were also prepared in a similar manner.
7-S-MTPA Ester of 3 (3a): White amorphous solid. 1H NMR (600 MHz, in CD3OD) δH 7.30−7.64 (5H, m, MTPA-Ar), 6.14 (1H, brs, H-7), 4.81 (1H, m, H-9), 4.73 (1H, ddd, J = 13.0, 6.0, 2.6 Hz, H-2a), 4.68 (1H, ddd, J = 13.0, 6.0, 1.6 Hz, H-2b), 3.67 (1H, m, H-10), 3.57 (3H, brs, MTPA-OMe), 2.51 (1H, m, H-5a), 2.47 (1H, m, H-6a), 2.38 (1H, m, H-5b), 2.09 (1H, m, H-6b), 1.58 (1H, m, H-12a), 1.55 (1H, m, H-11a), 1.44 (1H, m, H-11b), 1.39 (1H, m, H-12b), 0.94 (3H, t, J = 7.0 Hz, H-13); HRESIMS m/z [M+Na]+ 465.1500 (calcd. for C22H25F3O6Na, 465.1501).
7-R-MTPA Ester of 3 (3b): White amorphous solid. 1H NMR (600 MHz, in CD3OD) δH 7.32−7.64 (5H, m, MTPA-Ar), 6.13 (1H, brs, H-7), 4.72 (1H, ddd, J = 12.8, 6.0, 2.7 Hz, H-2a), 4.67 (1H, m, H-2b) 4.65 (1H, m, H-9), 3.62 (1H, m, H-10), 3.56 (3H, brs, MTPA-OMe), 2.57 (1H, m, H-5a), 2.55 (1H, m, H-6a), 2.53 (1H, m, H-5b), 2.26 (1H, m, H-6b), 1.54 (1H, m, H-12a), 1.43 (1H, m, H-11a), 1.37 (1H, m, H-11b), 1.34 (1H, m, H-12b), 0.93 (3H, t, J = 7.3 Hz, H-13); HRESIMS m/z [M+Na]+ 465.1497 (calcd. for C22H25F3O6Na, 465.1501).
10-S-MTPA Ester of 3 (3c): White amorphous solid. 1H NMR (600 MHz, in CD3OD) δH 7.30−7.64 (5H, m, MTPA-Ar), 5.40 (1H, ddd, J = 8.3, 5.6, 1.8 Hz, H-10), 5.30 (1H, m, H-9), 4.52 (1H, m, H-2a), 4.50 (1H, m, H-7), 4.35 (1H, ddd, J = 13.0, 5.7, 3.0 Hz, H-2b), 3.55 (3H, m, MTPA-OMe), 2.43 (1H, m, H-5a), 2.27 (1H, m, H-5b), 2.24 (1H, m, H-6a), 1.94 (1H, m, H-6b), 1.84 (1H, m, H-12a), 1.78 (1H, m, H-11a), 1.47 (1H, m, H-11b), 1.43 (1H, m, H-12b), 0.98 (3H, t, J = 7.4 Hz, H-13); HRESIMS m/z [M+Na]+ 465.1500 (calcd. for C22H25F3O6Na, 465.1501).
10-R-MTPA Ester of 3 (3d): White amorphous solid. 1H NMR (600 MHz, in CD3OD) δH 7.31−7.64 (5H, m, MTPA-Ar), 5.42 (1H, m, H-10), 5.41 (1H, m, H-9), 4.67 (1H, m, H-2a), 4.65 (1H, m, H-2b), 4.52 (1H, m, H-7), 3.54 (3H, d, J=1.0 Hz, MTPA-OMe), 2.49 (1H, m, H-5a), 2.36 (1H, m, H-5b), 2.29 (1H, m, H-6a), 1.99 (1H, m, H-6b), 1.80 (1H, m, H-12a), 1.62 (1H, m, H-11a), 1.35 (1H, m, H-11b), 1.31 (1H, m, H-12b), 0.92 (3H, t, J = 7.4 Hz, H-13); HRESIMS m/z [M+Na]+ 465.1497 (calcd. for C22H25F3O6Na, 465.1501).
7, 10-di-S-MTPA Ester of 3 (3e): White amorphous solid. 1H NMR (600 MHz, in CD3OD) δH 7.39−7.52 (10H, m, MTPA-Ar), 5.85 (1H, m, H-7), 5.38 (1H, ddd, J = 9.2, 4.8, 1.8 Hz, H-10), 5.11 (1H, ddd, J = 6.0, 3.7, 1.8 Hz, H-9), 4.58 (1H, ddd, J = 13.3, 3.8, 1.0 Hz, H-2α), 4.45 (1H, ddd, J = 13.3, 5.9, 2.1 Hz, H-2β), 3.57 (3H, d, J = 1.0 Hz, MTPA-OMe), 3.52 (3H, d, J = 1.0 Hz, MTPA-OMe), 2.34 (1H, m, H-5α), 2.30 (1H, m, H-5β), 2.19 (1H, m, H-6α), 2.13 (1H, m, H-6β), 1.78 (1H, m, H-12α), 1.66 (1H, m, H-11α), 1.46 (1H, m, H-11β), 1.41 (1H, m, H-12β), 0.97 (3H, t, J = 7.3 Hz, H-13); HRESIMS m/z [M+Na]+ 681.1896 (calcd. for C32H32F6O8Na, 681.1899).
7, 10-di-R-MTPA Ester of 3 (3f): White amorphous solid. 1H NMR (600 MHz, in CD3OD) δH 7.38−7.53 (10H, m, MTPA-Ar), 5.92 (1H, t, J = 4.9 Hz, H-7), 5.31 (1H, ddd, J = 10.3, 3.8, 2.0 Hz, H-10), 5.08 (1H, td, J = 4.8, 2.0 Hz, H-9), 4.71 (1H, m, H-2α), 4.69 (1H, m, H-2β), 3.58 (3H, d, J = 0.8 Hz, MTPA-OMe), 3.52 (3H, d, J = 0.8 Hz, MTPA-OMe), 2.54 (1H, m, H-5α), 2.48 (1H, m, H-5β), 2.42 (1H, m, H-6α), 2.31 (1H, m, H-6β), 1.69 (1H, m, H-12α), 1.43 (1H, m, H-11α), 1.29 (1H, m, H-11β), 1.23 (1H, m, H-12β), 0.88 (3H, t, J = 7.4 Hz, H-13); HRESIMS m/z [M+Na]+ 681.1893 (calcd. for C32H32F6O8Na, 681.1899).
S-MTPA Ester of 4 (4a): White amorphous solid. 1H NMR (600 MHz, in CD3OD) δH 7.39−7.48 (10H, m, MTPA-Ar), 5.96 (1H, m, H-7), 5.46 (1H, ddd, J = 9.0, 4.6, 1.9 Hz, H-10), 5.16 (1H, m, H-9), 4.72 (1H, J = 16.3, 3.6, 1.6 Hz,, H-2a), 4.65 (1H, J = 16.3, 5.9, 0.7 Hz,, H-2b), 3.49 (3H, s, MTPA-OMe), 3.38 (3H, s, MTPA-OMe), 2.54 (1H, m, H-5a), 2.49 (1H, m, H-5b), 2.47 (1H, m, H-6a), 2.03 (1H, m, H-6b), 1.70 (1H, m, H-12a), 1.52 (1H, m, H-11a), 1.36 (1H, m, H-11b), 1.30 (1H, m, H-12b), 0.88 (3H, t, J = 7.4 Hz, H-13); HRESIMS m/z [M+Na]+ 681.1898 (calcd. for C32H32F6O8Na, 681.1899).
R-MTPA Ester of 4 (4b): White amorphous solid. 1H NMR (600 MHz, in CD3OD) δH 7.38−7.53 (10H, m, MTPA-Ar), 6.02 (1H, m, H-7), 5.42 (1H, ddd, J = 10.3, 3.9, 1.9 Hz, H-10), 5.25 (1H, m, H-9), 4.67 (1H, J = 16.3, 3.7, 1.5 Hz,, H-2a), 4.48 (1H, J = 16.5, 5.9, 1.0 Hz,, H-2b), 3.54 (3H, brs, MTPA-OMe), 3.50 (3H, brs, MTPA-OMe), 2.59 (1H, m, H-5a), 2.55 (1H, m, H-5b), 2.51 (1H, m, H-6a), 2.20 (1H, m, H-6b), 1.58 (1H, m, H-12a), 1.28 (1H, m, H-11a), 1.16 (1H, m, H-11b), 1.09 (1H, m, H-12b), 0.76 (3H, t, J = 7.5 Hz, H-13); HRESIMS m/z [M+Na]+ 681.1904 (calcd. for C32H32F6O8Na, 681.1899).
S-MTPA Ester of 5 (5a): White amorphous solid. 1H NMR (600 MHz, in CD3OD) δH 7.41−7.53 (15H, m, MTPA-Ar), 5.41 (1H, br s, H-4), 5.30 (1H, br s, H-7), 5.19 (1H, br s, H-9), 4.13 (1H, d, J = 17.5 Hz, H-2a), 3.99 (1H, d, J = 17.5 Hz, H-2b), 3.69 (1H, m, H-10), 3.53 (3H, s, MTPA-OMe), 3.52 (3H, s, MTPA-OMe), 3.50 (3H, s, MTPA-OMe), 1.84 (1H, m, H-6a), 1.77 (1H, m, H-5a), 1.73 (1H, m, H-5b), 1.69 (1H, m, H-6b), 1.48 (1H, m, H-11a), 1.41 (1H, m, H-12a), 1.28 (1H, m, H-11b), 1.24 (1H, m, H-12b), 0.86 (3H, t, J = 7.1 Hz, H-13); HRESIMS m/z [M+Na]+ 899.2452 (calcd. for C42H41F9O10Na, 899.2454).
R-MTPA Ester of 5 (5b): White amorphous solid. 1H NMR (600 MHz, in CD3OD) δH 7.43−7.54 (15H, m, MTPA-Ar), 5.41 (1H, br s, H-4), 5.20 (1H, s, H-7), 4.76 (1H, br s, H-9), 3.95 (1H, d, J = 17.6 Hz, H-2a), 3.75 (1H, ddd, J = 8.9, 5.0, 2.0 Hz, H-10), 3.68 (1H, dd, J = 17.6, 2.0 Hz, H-2b), 3.60 (3H, s, MTPA-OMe), 3.56 (3H, s, MTPA-OMe), 3.48 (3H, s, MTPA-OMe), 2.04 (1H, m, H-5a), 1.99 (1H, m, H-5b), 1.95 (1H, m, H-6a), 1.81 (1H, m, H-6b), 1.32 (1H, m, H-11a), 1.27 (1H, m, H-12a), 1.12 (1H, m, H-12b), 0.95 (1H, m, H-11b), 0.82 (3H, t, J = 7.2 Hz, H-13); HRESIMS m/z [M+Na]+ 899.2449 (calcd. for C42H41F9O10Na, 899.2454).
S-MTPA Ester of 6 (6a): White amorphous solid. 1H NMR (600 MHz, in CD3OD) δH 7.42−7.52 (15H, m, MTPA-Ar), 5.55 (1H, dd, J = 8.0, 6.0 Hz, H-4), 5.38 (1H, br s, H-7), 5.11 (1H, brs, H-9), 3.78 (1H, d, J = 16.9 Hz, H-2a), 3.65 (1H, m, H-10), 3.61 (1H, d, J = 17.0 Hz, H-2b), 3.54 (3H, s, MTPA-OMe), 3.52 (3H, s, MTPA-OMe), 3.48 (3H, s, MTPA-OMe), 2.11 (1H, m, H-5a), 1.98 (1H, m, H-6a), 1.95 (1H, m, H-6b), 1.61 (1H, m, H-5b), 1.29 (1H, m, H-11a), 1.25 (1H, m, H-12a), 1.20 (1H, m, H-12b), 1.15 (1H, m, H-11b), 0.81 (3H, t, J = 7.2 Hz, H-13); HRESIMS m/z [M+Na]+ 899.2457 (calcd. for C42H41F9O10Na, 899.2454).
R-MTPA Ester of 6 (6b): white amorphous solid. 1H NMR (600 MHz, in CD3OD) δH 7.45−7.54 (15H, m, MTPA-Ar), 5.52 (1H, dd, J = 8.6, 5.3 Hz, H-4), 5.18 (1H, br s, H-7), 4.78 (1H, s, H-9), 4.05 (1H, d, J = 17.6 Hz, H-2a), 3.98 (1H, d, J = 17.4 Hz, H-2b), 3.84 (1H, m, H-10), 3.59 (3H, s, MTPA-OMe), 3.53 (3H, s, MTPA-OMe), 3.47 (3H, s, MTPA-OMe), 2.12 (1H, m, H-5a), 1.93 (1H, m, H-6a), 1.90 (1H, m, H-6b), 1.68 (1H, m, H-5b), 1.28 (1H, m, H-11a), 1.24 (1H, m, H-12a), 1.14 (1H, m, H-12b), 0.98 (1H, m, H-11b), 0.80 (3H, t, J = 7.3 Hz, H-13); HRESIMS m/z [M+Na]+ 899.2453 (calcd. for C42H41F9O10Na, 899.2454).
3.7. X-Ray Crystallographic Analysis
Compound 5 was obtained as colorless crystals from acetone–ethyl acetate (1:4) using the vapor-exchanged method [11,19,20]. X-ray single-crystal diffraction data for 5 were collected at 293 K on a Rigaku Oxford Diffraction instrument using Cu Kα (λ = 1.54184) radiation. The structures were solved by direct methods using Olex2 software [21], and the non-hydrogen atoms were refined isotropically with SHELXL-2014 [22] using a full-matrix least squares procedure based on F2. The hydrogen atoms were positioned according to the geometric calculation. Crystallographic data for the structures of 5 were deposited at the Cambridge Crystallographic Data Centre database (CCDC Number: 1890797).
Crystal data for 5: C12H20O4 (M = 228.28 g/mol), trigonal, space group P31 (no. 144), a = 14.9243(2)Å, b = 14.9243(2)Å, c = 4.49716(13)Å, V = 867.47(4)Å3, Z = 3, T = 293 (10)K, μ(CuKα) = 0.798 mm−1, Dcalc = 1.311 g/cm3, F (000) = 372.0. The final R1 was 0.0397 (wR2 = 0.1052) for 2082 unique reflections (I > 2σ (I)), and Flack = −0.01(11).
3.8. NO Inhibition Assay
Mouse monocyte-macrophages RAW 264.7 (ATCC TIB-71) were purchased from the Chinese Academy of Science. DMEM medium, penicillin, streptomycin, and fetal bovine serum were purchased from Invitrogen (N.Y., USA). Lipopolysaccharide (LPS), DMSO, 3-(4,5-dimethylthiazol-2-yl)-2,5-diphenyl-2H-tetrazolium bromide (MTT), and hydrocortisone were obtained from Sigma Co. RAW 264.7 cells were maintained in DMEM medium supplemented with penicillin, streptomycin (both 100 U/mL), and 10% heat-inactivated fetal bovine serum at 37 °C in a humidified incubator with 5% CO2 and 95% air. RAW264.7 cells were passaged until they attained confluence. The cell concentration was adjusted to 5 × 10⁵ cells/mL with 10% FBS DMEM medium, and 100 μL was seeded in each well of a 96-well plate that was maintained at 37 °C overnight. The supernatant was discarded, and the cells except for the blank control groups were treated with 100 μL of LPS DMEM (the concentration of LPS was 2 μg/mL or 5 μg/mL). After 2 h of incubation, blank and LPS model groups were treated with 100 μL of DMEM medium and the others were treated with DMEM medium containing various concentrations of test compounds for 24 h, respectively [16].
As a parameter of NO release, the nitrite concentration was measured in the supernatant of RAW 264.7 cells by the Griess reaction [16]. The inhibition rate was calculated and plotted versus test concentrations to afford the IC50.
3.9. Cytotoxic Assay
The cytotoxicity of all of the compounds was measured by the MTT assay against the prostate cancer PC3 cell line. Tumor cell lines were seeded in 96-well plates (4000 per well in 100 μL). After 24 h of incubation, cells were treated with gradient concentrations (100 μM, 50 μM, 25 μM, 12.5 μM, 6.25 μM, 3.125 μM) for another 72 h. Afterwards, MTT solution (5.0 mg/mL in RPMI-1640 media, Sigma, St. Louis, MO, USA) was added (20 μL/well) and then plates were incubated for another 4 h at 37 °C. The compounds were dissolved in DMSO and a cell growth inhibition assay was performed as reported previously. The growth inhibitory abilities of the compounds were calculated and expressed using the IC50 value by the Dose-Effect Analysis software. Doxorubicin (ADR) was used as a positive control.
3.10. Antibacterial Assay
The antibacterial activities of all compounds except for 4 and 7 were evaluated with S. aureus, S. epidermidis, E. coli, M. albicans, and P. aeruginosa using the Kirby−Bauer Diffusion method. Gentamicin, vancomycin, ampicillin, amphotericin B, and gentamicin served as the positive drugs, respectively.
The stock solution of compounds 1, 2, 3, 5, and 8 was prepared in methanol with a series of concentrations (25, 5.0, 1, and 0.2 mg/mL). The stock solution of compound 6 was prepared in methanol with a series of concentrations (5.0, 1, and 0.2 mg/mL). The positive control drugs gentamicin, vancomycin, and ampicillin were dissolved in purified water at a concentration of 500 ug/mL. Amphotericin B was dissolved in DMSO at a concentration of 100 ug/mL.
S. aureus, S. epidermidis, E. coli, M. albicans, and P. aeruginosa were activated in nutrient broth at 37 °C for 6~8 h with 200 rpm. The culture broth was poured on the surface of Malt Extract Broth (MEB) Agar (20 g MEB and 20 g agar in 1 L of water) plates inside the cabinet, making sure that there was a uniform distribution of cells on the plates. The location of the negative control (methanol), the positive drugs, and different contents of tested compounds (100 µg, 20 µg, 4 µg, and 0.8 µg for 1, 2, 3, 5, and 8; 20 µg, 4 µg, and 0.8 µg for 6) was labeled on the agar side of the plate and outside the lid. The discs were arranged so as to mimic their positions outside the lid and 4 µL of the corresponding concentrations of the tested compounds and methanol was added to the discs. The contents of the positive drugs gentamicin, ampicillin, and amphotericin B were 3 ug, 1.5 ug, and 0.35 ug, respectively. The discs were transferred from the lid to the agar plate using sterile forceps. Finally, the plates were placed in an incubator agar side up at 37 °C for 12 h and the inhibition zone was observed.
The estimations of the purity of compounds 1–8 for biological appraisals were 92.21%, 98.26%, 95.82%, 98.60%, 99.1%, 95.36%, and 99.05%, respectively.
4. Conclusions
With the aim of discovering structurally novel secondary metabolites, seven new polyketides (phomopsiketones D–G (1–4) and letendronols A–C (5–7)) were isolated from the marine endophytic fungus Letendraea sp. in 1/2 PDB medium. The structures and absolute configurations of the new compounds were sufficiently elucidated through HRESIMS, NMR, single-crystal X-ray diffraction, ECD calculation, and a modified version of Mosher’s method. Compound 2 showed weak anti-inflammatory activity.
Supplementary Materials
The following are available online at https://www.mdpi.com/1660-3397/18/1/18/s1, Tables S1–S7: 1D and 2D NMR data for 1–7, Figures S1–S4: 1H-1H COSY and key HMBC correlations of 2, 4, 5, 6, and 7, Figure S5: NOESY correlation of 7, 10-di-R-MTPA ester (3f), Figures S6 and S7: Δδ S-R values for the MTPA esters (4a and 4b, 5a and 5b, 6a and 6b), Figure S8: comparison of CD spectra of 3 and 4, Figures S9–S81: 1D and 2D NMR, HRESIMS, IR, and CD spectra for the compounds (1–7), Figures S82–S83: 1H NMR and 13C NMR spectra of 8, Figures S84, S86, and S87: 1H NMR and HRESIMS of 3a and 3b, Figure S85: 1H–1H COSY spectrum of 3a, Figures S88–S90: 1H NMR and HRESIMS of 3c and 3d, Figures S91, S93, and S94: 1H NMR and HRESIMS of 3e and 3f, Figure S92: NOESY spectrum of 3f, Figures S95–S97: 1H NMR and HRESIMS data for 4a and 4b, Figures S98–S109: 1D and 2D NMR and HRESIMS data for 5a and 5b, Figure S110–S112: 1H NMR and HRESIMS data for 6a and 6b. The 26s rDNA sequence information of Letendraea sp. Crystallographic data of 5 (CIF).
Author Contributions
Y.X. performed the experiments for the isolation, structure determination, and antimicrobial evaluation, and prepared the manuscript; H.L. performed the NO inhibition assay; Y.J. contributed to part of the structure determination; R.H. contributed to the preparation of the fermentation; W.D. performed the cytotoxic assay; T.Y. contributed to part of the isolation; P.W. and D.Z. conducted the isolation of strain 5XNZ4-2 and jointly supervised the research; J.X. supervised the research work and revised the manuscript. All authors have read and agreed to the published version of the manuscript.
Funding
This research was supported by the Natural Science Foundation of China (NSFC No.41406141) and the Senior User Project of RV KEXUE (No. KEXUE2019GZ05) of the Center for Ocean Mega-Science, Chinese Academy of Sciences.
Acknowledgments
We thank Jianyang Pan (Pharmaceutical Informatics Institute, Zhejiang University) and Ying Liu (Ocean college, Zhejiang University) for performing the NMR spectrometry.
Conflicts of Interest
The authors declare no conflict of interest.
References
- Gudina, E.J.; Teixeira, J.A.; Rodrigues, L.R. Biosurfactants Produced by Marine Microorganisms with Therapeutic Applications. Mar. Drugs 2016, 14, 38. [Google Scholar] [CrossRef] [PubMed] [Green Version]
- Tortorella, E.; Tedesco, P.; Palma Esposito, F.; January, G.G.; Fani, R.; Jaspars, M.; de Pascale, D. Antibiotics from Deep-Sea Microorganisms: Current Discoveries and Perspectives. Mar. Drugs 2018, 16, 355. [Google Scholar] [CrossRef] [PubMed] [Green Version]
- Blunt, J.W.; Carroll, A.R.; Copp, B.R.; Davis, R.A.; Keyzers, R.A.; Prinsep, M.R. Marine natural products. Nat. Prod. Rep. 2018, 35, 8–53. [Google Scholar] [CrossRef] [PubMed] [Green Version]
- Blunt, J.W.; Copp, B.R.; Keyzers, R.A.; Munro, M.H.; Prinsep, M.R. Marine natural products. Nat. Prod. Rep. 2016, 33, 382–431. [Google Scholar] [CrossRef] [PubMed] [Green Version]
- Blunt, J.W.; Copp, B.R.; Keyzers, R.A.; Munro MH, G.; Prinsep, M.R. Marine natural products. Nat. Prod. Rep. 2017, 34, 235–294. [Google Scholar] [CrossRef] [Green Version]
- Imhoff, J.F. Natural Products from Marine Fungi—Still an Underrepresented Resource. Mar. Drugs 2016, 14, 19. [Google Scholar] [CrossRef]
- Huang, R.; Xu, Y.; Ye, B.; Ding, W.; Wang, P.; Xu, J. Letenketals A and B, two novel spirocyclic polyketides from a marine crab-derived Letendraea sp. fungus. Phytochem. Lett. 2019, 30, 165–168. [Google Scholar] [CrossRef]
- Koizumi, F.; Takahashi, Y.; Ishiguro, H.; Tanaka, R.; Ohtaki, S.; Yoshida, M.; Nakanishi, S.; Ikeda, S.I. Structure elucidation of EI-1941-1 and -2, novel interleukin-1β converting enzyme inhibitors produced by Farrowia sp. E-1941. Tetrahedron Lett. 2004, 45, 7419–7422. [Google Scholar] [CrossRef]
- Petrovic, A.G.; Navarro-Vazquez, A.; Lorenzo Alonso-Gomez, J. From Relative to Absolute Configuration of Complex Natural Products: Interplay between NMR, ECD, VCD, and ORD Assisted by ab initio Calculations. Curr. Org. Chem. 2010, 14, 1612–1628. [Google Scholar] [CrossRef]
- Cerra, B.; Carotti, A.; Passer, D.; Sardella, R.; Moroni, G.; Di Michele, A.; Macchiarulo, A.; Pellicciar, R.; Gioielle, A. Exploiting Chemical Toolboxes for the Expedited Generation of Tetracyclic Quinolines as a Novel Class of PXR Agonists. ACS Med. Chem. Lett. 2019, 10, 677–681. [Google Scholar] [CrossRef]
- Tang, J.W.; Wang, W.G.; Li, A.; Yan, B.C.; Chen, R.; Li, X.N.; Du, X.; Sun, H.D.; Pu, J.X. Polyketides from the endophytic fungus Phomopsis sp. sh917 by using the one strain/many compounds strategy. Tetrahedron 2017, 73, 3577–3584. [Google Scholar] [CrossRef]
- Fischer, T.C.; Cerra, B.; Fink, M.J.; Rudroff, F.; Horkel, E.; Mihovilovic, M.D. First Total Synthesis of Piperenol B and Configuration Revision of the Enantiomers Piperenol B and Uvarirufol A. Eur. J. Org. Chem. 2015, 1464–1471. [Google Scholar] [CrossRef]
- Seco, J.M.; Quinoa, E.; Riguera, R. Assignment of the Absolute Configuration of Polyfunctional Compounds by NMR Using Chiral Derivatizing Agents. Chem. Rev. 2012, 112, 4603–4641. [Google Scholar] [CrossRef] [PubMed]
- Khamthong, N.; Rukachaisirikul, V.; Phongpaichit, S.; Preedanon, S.; Sakayaroj, J. Bioactive polyketides from the sea fan-derived fungus Penicillium citrinum PSU-F51. Tetrahedron 2012, 68, 8245–8250. [Google Scholar] [CrossRef]
- Mullapudi, V.; Ramana, C.V. The Total Synthesis and Structural Assignment of Hexaketide Xylarinol B and its C1’-Epimer. Asian J. Org. Chem. 2016, 5, 417–422. [Google Scholar] [CrossRef]
- Han, J.J.; Chen, Y.H.; Bao, L.; Yang, X.L.; Liu, D.; Li, S.J.; Zhao, F.; Liu, H. Anti-inflammatory and cytotoxic cyathane diterpenoids from the medicinal fungus Cyathus africanus. Fitoterapia 2013, 84, 22–31. [Google Scholar] [CrossRef]
- Li, X.; Zhao, Z.; Ding, W.; Ye, B.; Wang, P.; Xu, J. Aspochalazine A, a Novel Polycyclic Aspochalasin from the Fungus Aspergillus sp. Z4. Tetrahedron Lett. 2017, 58, 2405–2408. [Google Scholar] [CrossRef]
- Li, Q.; Zhu, R.; Yi, W.; Chai, W.; Zhang, Z.; Lian, X.Y. Peniciphenalenins A–F from the culture of a marine-associated fungus Penicillium sp. ZZ901. Phytochemistry 2018, 152, 53–60. [Google Scholar] [CrossRef]
- Van der Sluis, P.; Hezemans, A.M.F.; Kroon, J. Crystallization of low-molecular-weight organic compounds for X-ray crystallography. J. Appl. Crystallogr. 1989, 22, 340–344. [Google Scholar] [CrossRef] [Green Version]
- Spingler, B.; Schnidrig, S.; Todorova, T.; Wild, F. Some thoughts about the single crystal growth of small molecules. CrystEngComm 2012, 14, 751–757. [Google Scholar] [CrossRef]
- Dolomanov, O.V.; Bourhis, L.J.; Gildea, R.J.; Howard, J.A.K.; Puschmann, H. OLEX2: A complete structure solution, refinement and analysis program. J. Appl. Crystallogr. 2009, 42, 339–341. [Google Scholar] [CrossRef]
- Kratzert, D.; Holstein, J.J.; Krossing, I. DSR: Enhanced modelling and refinement of disordered structures with SHELXL. J. Appl. Crystallogr. 2015, 48, 933–938. [Google Scholar] [CrossRef] [PubMed] [Green Version]
Figure 1.
Chemical structures of compounds 1–8 isolated from Letendraea sp. 5XNZ4-2.
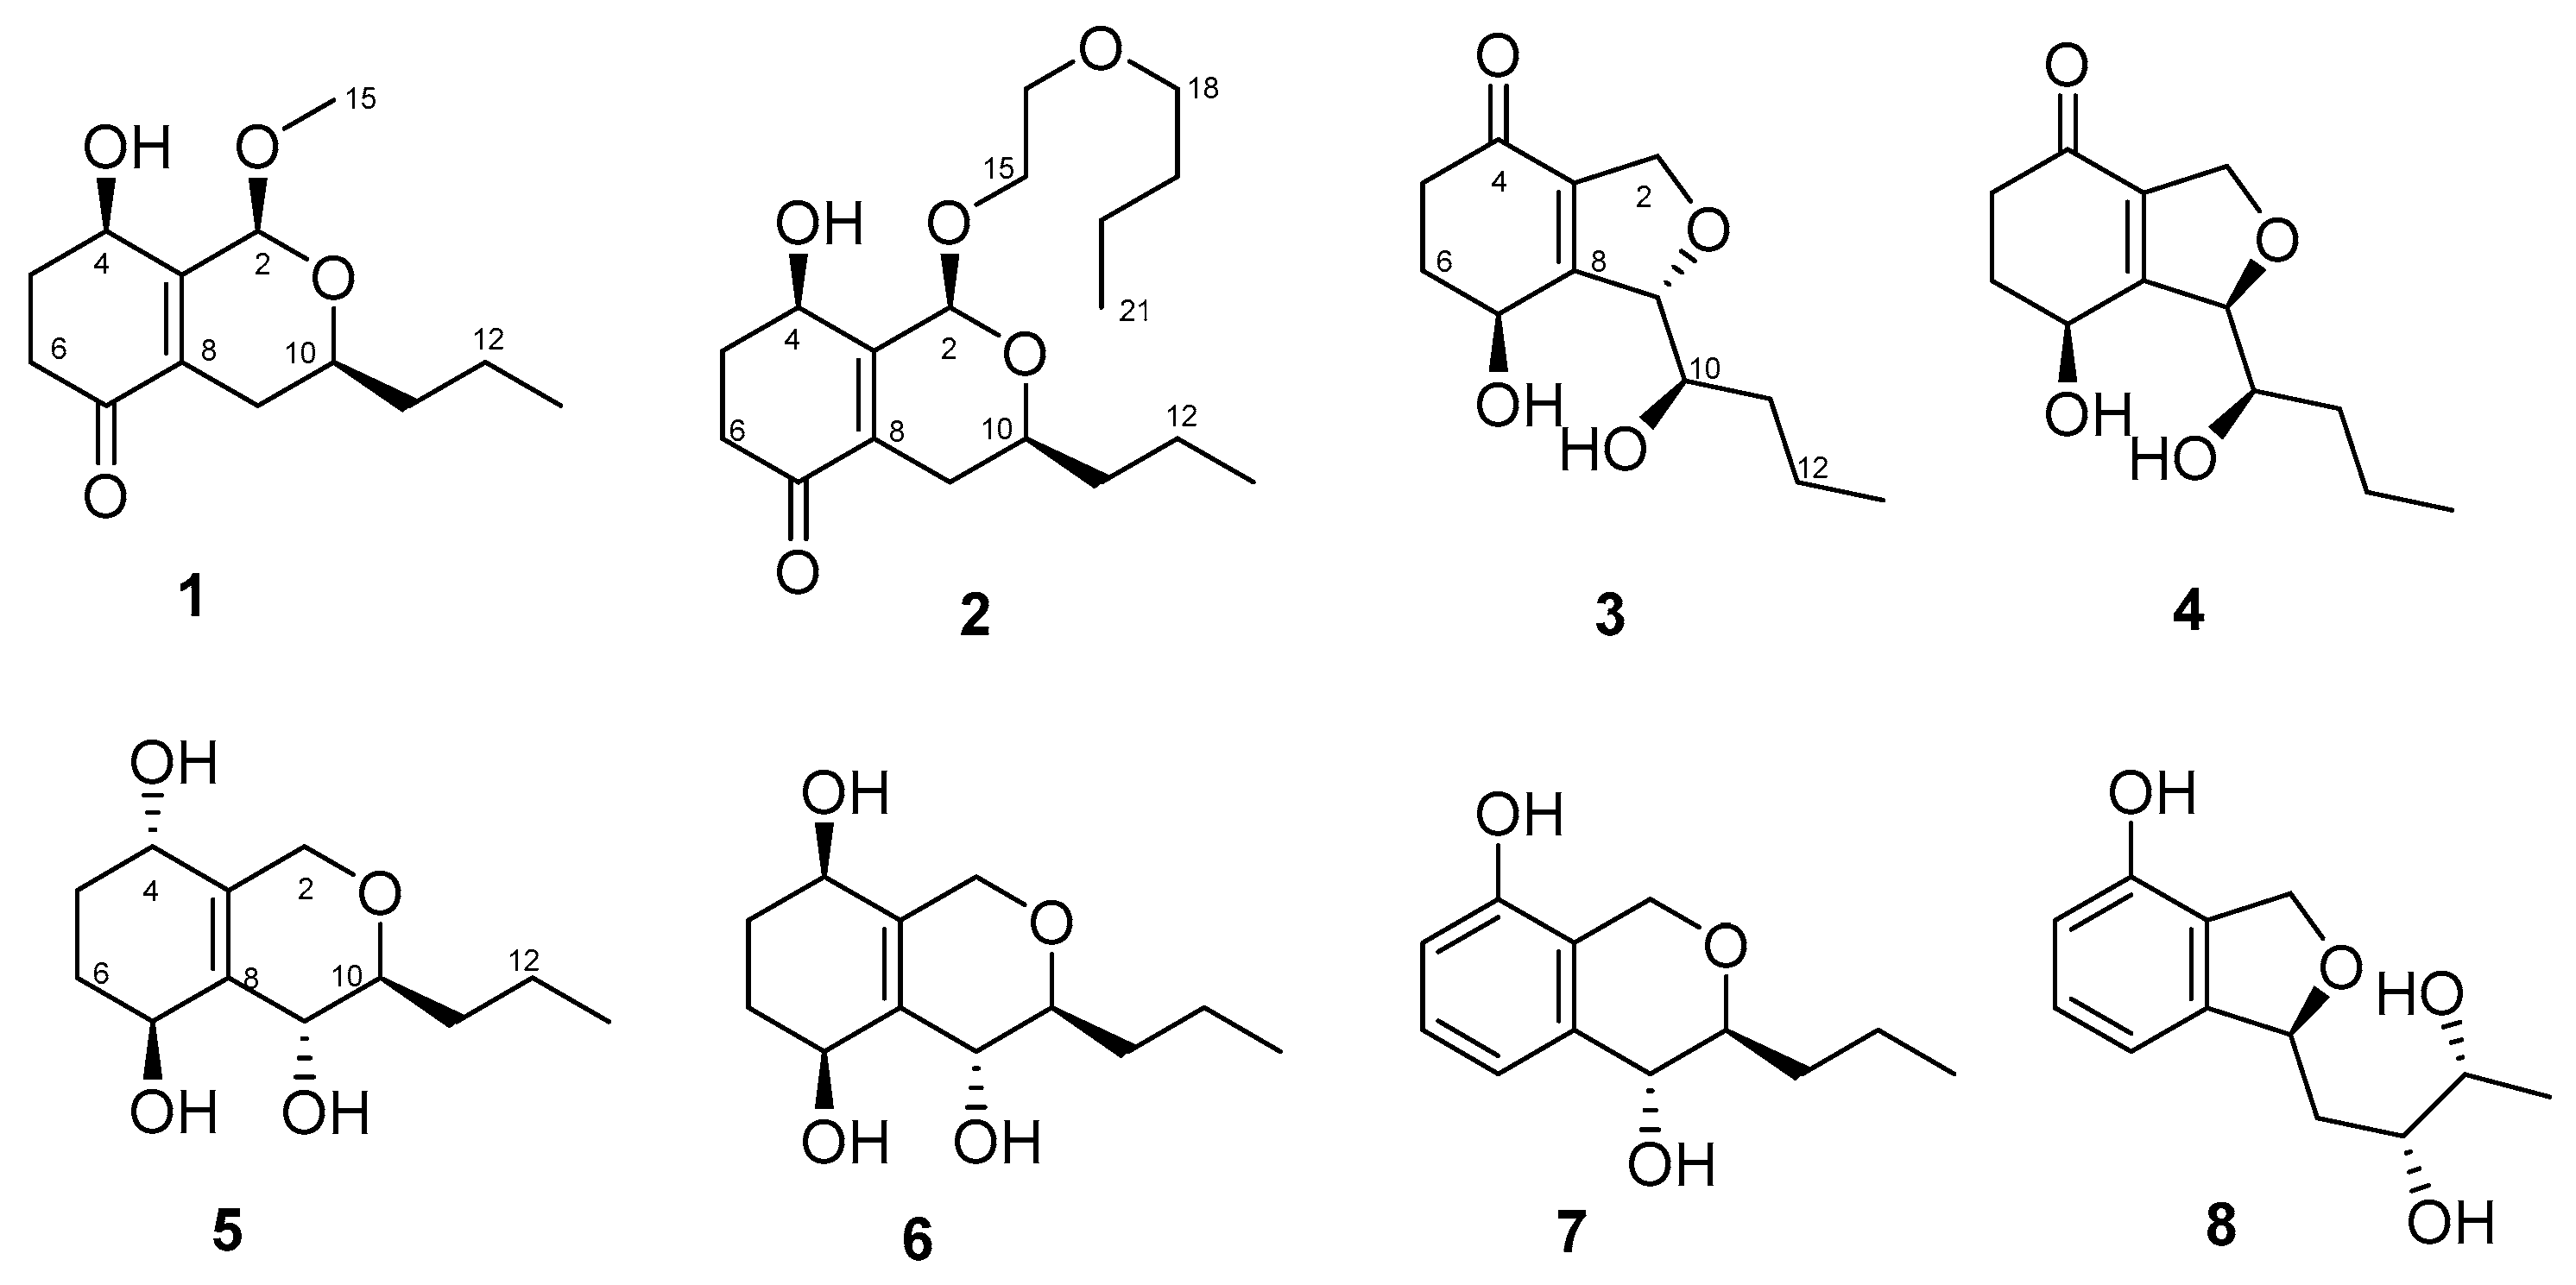
Figure 2.
1H-1H COSY and key HMBC correlations of 1 and 3.

Figure 3.
Comparison between calculated ECD spectra of 1 and experimental curves of 1–2.

Figure 4.
Δδ S-R values for the MTPA esters (3a/3b, 3c/3d, and 3e/3f).

Figure 5.
The X-ray crystal structure of 5 (the thermal ellipsoid was 30%).

Figure 6.
The comparison between calculated ECD spectra and the experimental curve of 7.


Table 1.
NMR data for compounds 1–7.
| No. | 1 a | 2 a | 3 b | 4 c | 5 b | 6 b | 7 b |
|---|---|---|---|---|---|---|---|
| δH (J in Hz) | δH (J in Hz) | δH (J in Hz) | δH (J in Hz) | δH (J in Hz) | δH (J in Hz) | δH (J in Hz) | |
| 2 | 5.29, s | 5.48, s | 4.69, ddd (12.5, 3.1, 2.2) 4.74, ddd (12.0, 5.5, 3.0) | 4.76, m 4.97, m | 4.02, overlapped 4.30, dt (16.5, 2.3) | 4.00, overlapped 4.37, overlapped | 4.60, d (15.6) 4.82, d (15.6) |
| 4 | 4.59, br s | 4.63, d (9.2) | 4.06, m | 3.95, dd (4.5, 5.6) | |||
| 5 | 2.06, m 2.28, m | 2.01, m 2.30, m | 2.48, m 2.52, m | 2.47, m 2.53, dt (16.0, 4.7) | 1.54, m 2.02, m | 1.74, m 1.79, m | 6.63, d (8.0) |
| 6 | 2.40, m 2.70, ddd (17.0, 7.0, 5.0) | 2.40, m 2.65, dt (17.0, 4.0) | 2.01, m 2.34, ddd (12.6, 9.4, 4.7) | 2.01, m 2.31, ddd (12.8, 9.4, 4.8) | 1.56, m 2.07, m | 1.72, m 1.82, m | 7.07, t (8.0) |
| 7 | 4.67, m | 4.64, m | 4.43, m | 4.35, overlapped | 7.01, d (8.0) | ||
| 9 | 1.88, m 2.36, m | 1.84, m 2.36, m | 5.10, m | 4.94, m | 3.99, overlapped | 3.98, overlapped | 4.30, d (8.5) |
| 10 | 3.74, m | 3.70, m | 3.80, dt (8.0, 4.0) | 3.83, dt (9.5, 3.2) | 3.33, overlapped | 3.30, overlapped | 3.37, m |
| 11 | 1.55, m 1.61, m | 1.54, m 1.59, m | 1.52, m 1.54, m | 1.39, m 1.44, m | 1.46, m 1.75, m | 1.48, m 1.72, m | 1.50, m 1.89, m |
| 12 | 1.43, m 1.52, m | 1.43, m 1.50, m | 1.58, m 1.42, m | 1.53, m 1.33, m | 1.41, m 1.59, m | 1.40, m 1.56, m | 1.48, m 1.65, m |
| 13 | 0.95, t (7.0) | 0.94, t (7.0) | 0.96, t (7.0) | 0.96, t (7.0) | 0.96, t (7.2) | 0.96, t (7.3) | 0.99, t (7.2) |
| 15 | 3.50, s | 3.86, ddd (12.1,8.8,2.8) 3.97, dt (12.0, 3.0) | |||||
| 16 | 3.60, dt (11.0, 3.0) 3.66, m | ||||||
| 18 | 3.53, m 3.53, m | ||||||
| 19 | 1.61, m 1.63, m | ||||||
| 20 | 1.36, m 1.39, m | ||||||
| 21 | 0.94, t (7.0) |
a Measured in CDCl3 and at 500 MHz NMR. b Measured in CD3OD and at 500 MHz NMR. c Measured in CD3OD and at 600 MHz NMR.
Table 2.
13C NMR data for compounds 1–7.
| No. | 1 a | 2 a | 3 b | 4 c | 5 b | 6 b | 7 b |
|---|---|---|---|---|---|---|---|
| δC, Type | δC, Type | δC, Type | δC, Type | δC, Type | δC, Type | δC, Type | |
| 2 | 95.2, CH | 95.6, CH | 73.8, CH2 | 76.0, CH2 | 67.1, CH2 | 65.6, CH2 | 65.3, CH2 |
| 3 | 151.4, C | 154.4, C | 136.0, C | 134.6, C | 137.1, C | 137.0, C | 123.3, C |
| 4 | 65.3, CH | 66.5, CH | 197.1, C | 197.1, C | 67.2, CH | 66.1, CH | 153.5, C |
| 5 | 31.3, CH2 | 30.9, CH2 | 37.1, CH2 | 37.6, CH2 | 29.6, CH2 | 29.1, CH2 | 113.8, CH |
| 6 | 34.4, CH2 | 36.1, CH2 | 34.5, CH2 | 34.1, CH2 | 29.8, CH2 | 29.2, CH2 | 128.3, CH |
| 7 | 198.2, C | 197.9, C | 66.0, CH | 65.7, CH | 64.2, CH | 64.4, CH | 118.9, CH |
| 8 | 132.5, C | 131.5, C | 163.6, C | 167.0, C | 135.5, C | 135.3, C | 140.0, C |
| 9 | 27.4, CH2 | 27.2, CH2 | 91.3, CH | 90.0, CH | 67.0, CH | 67.0, CH | 70.1, CH |
| 10 | 66.7, CH | 67.4, CH | 74.4, CH | 74.0, CH | 80.4, CH | 80.2, CH | 80.4, CH |
| 11 | 37.4, CH2 | 37.2, CH2 | 35.6, CH2 | 34.1, CH2 | 35.2, CH2 | 35.0, CH2 | 35.5, CH2 |
| 12 | 18.9, CH2 | 18.8, CH2 | 20.0, CH2 | 20.1, CH2 | 20.0, CH2 | 19.9, CH2 | 19.8, CH2 |
| 13 | 14.1, CH3 | 14.0, CH3 | 14.4, CH3 | 14.4, CH3 | 14.4, CH3 | 14.4, CH3 | 14.4, CH3 |
| 15 | 55.8, CH3 | 68.4, CH2 | |||||
| 16 | 69.9, CH2 | ||||||
| 18 | 71.5, CH2 | ||||||
| 19 | 31.5, CH2 | ||||||
| 20 | 19.3, CH2 | ||||||
| 21 | 14.0, CH3 |
a Measured in CDCl3 and at 125 MHz NMR. b Measured in CD3OD and at 125 MHz NMR. c Measured in CD3OD and at 150 MHz NMR.
© 2019 by the authors. Licensee MDPI, Basel, Switzerland. This article is an open access article distributed under the terms and conditions of the Creative Commons Attribution (CC BY) license (http://creativecommons.org/licenses/by/4.0/).
Share and Cite
MDPI and ACS Style
Xu, Y.; Huang, R.; Liu, H.; Yan, T.; Ding, W.; Jiang, Y.; Wang, P.; Zheng, D.; Xu, J. New Polyketides from the Marine-Derived Fungus Letendraea Sp. 5XNZ4-2. Mar. Drugs 2020, 18, 18. https://doi.org/10.3390/md18010018
AMA Style
Xu Y, Huang R, Liu H, Yan T, Ding W, Jiang Y, Wang P, Zheng D, Xu J. New Polyketides from the Marine-Derived Fungus Letendraea Sp. 5XNZ4-2. Marine Drugs. 2020; 18(1):18. https://doi.org/10.3390/md18010018
Chicago/Turabian StyleXu, Yan, Ruibao Huang, Hongwei Liu, Tingting Yan, Wanjing Ding, Yongjun Jiang, Pinmei Wang, Daoqiong Zheng, and Jinzhong Xu. 2020. "New Polyketides from the Marine-Derived Fungus Letendraea Sp. 5XNZ4-2" Marine Drugs 18, no. 1: 18. https://doi.org/10.3390/md18010018
Note that from the first issue of 2016, this journal uses article numbers instead of page numbers. See further details here.