Article

Experimental and Computational Study to Reveal the Potential of Non-Polar Constituents from Hizikia fusiformis as Dual Protein Tyrosine Phosphatase 1B and α-Glucosidase Inhibitors

1
Department of Food and Life Science, Pukyong National University, Busan 48513, Korea
2
College of Pharmacy, Drug Research and Development Center, Catholic University of Daegu, Gyeongsan 38430, Korea
3
Department of Food Science and Human Nutrition, Chonbuk National University, Jeonju 54896, Korea
*
Authors to whom correspondence should be addressed.
These authors contributed equally to this work.
Mar. Drugs 2019, 17(5), 302; https://doi.org/10.3390/md17050302
Submission received: 11 April 2019 / Revised: 20 May 2019 / Accepted: 21 May 2019 / Published: 22 May 2019

Abstract

:
Hizikia fusiformis (Harvey) Okamura is an edible marine alga that has been widely used in Korea, China, and Japan as a rich source of dietary fiber and essential minerals. In our previous study, we observed that the methanol extract of H. fusiformis and its non-polar fractions showed potent protein tyrosine phosphatase 1B (PTP1B) and α-glucosidase inhibition. Therefore, the aim of the present study was to identify the active ingredient in the methanol extract of H. fusiformis. We isolated a new glycerol fatty acid (13) and 20 known compounds including 9 fatty acids (13, 712), mixture of 24R and 24S-saringosterol (4), fucosterol (5), mixture of 24R,28R and 24S,28R-epoxy-24-ethylcholesterol (6), cedrusin (14), 1-(4-hydroxy-3-methoxyphenyl)-2-[2-hydroxy -4-(3-hydroxypropyl)phenoxy]-1,3-propanediol (15), benzyl alcohol alloside (16), madhusic acid A (17), glycyrrhizin (18), glycyrrhizin-6’-methyl ester (19), apo-9′-fucoxanthinone (20) and tyramine (21) from the non-polar fraction of H. fusiformis. New glycerol fatty acid 13 was identified as 2-(7′- (2″-hydroxy-3″-((5Z,8Z,11Z)-icosatrienoyloxy)propoxy)-7′-oxoheptanoyl)oxymethylpropenoic acid by spectroscopic analysis using NMR, IR, and HR-ESI-MS. We investigated the effect of the 21 isolated compounds and metabolites (22 and 23) of 18 against the inhibition of PTP1B and α-glucosidase enzymes. All fatty acids showed potent PTP1B inhibition at low concentrations. In particular, new compound 13 and fucosterol epoxide (6) showed noncompetitive inhibitory activity against PTP1B. Metabolites of glycyrrhizin, 22 and 23, exhibited competitive inhibition against PTP1B. These findings suggest that H. fusiformis, a widely consumed seafood, may be effective as a dietary supplement for the management of diabetes through the inhibition of PTP1B.

1. Introduction

Diabetes mellitus (DM) is a serious chronic disease and an important public health problem. DM occurs when the pancreas does not produce enough insulin or when the body cannot effectively use insulin. In 2014, 422 million adults worldwide had DM and the prevalence of DM has been rising steadily for the past three decades [1]. Several underlying mechanisms contribute to the pathogenesis of Type 2 DM (T2DM), which include hereditary disease, gene mutation, and obesity, among others [2]. One of the therapeutic remedies to decrease post-prandial hyperglycemia in T2DM is by preventing the absorption of carbohydrates from food during consumption [3]. This can be achieved by inhibiting carbohydrate hydrolyzing-enzymes such as α-glucosidase and α-amylase in the digestive tract [4]. Inhibition of these enzymes causes delay in digestion of dietary polysaccharides, prolonging the overall carbohydrate digestion time, which ultimately reduces the rate of glucose absorption [5,6]. Other attractive targets in treating T2D are protein tyrosine phosphatases (PTPs), and intracellular PTP1B may be a target for drugs in T2D. PTP1B is mainly expressed in insulin-sensitive tissues and negatively regulates insulin signaling by acting on insulin receptors [7]. Insulin is the key regulator of glucose homeostasis, and insulin receptors are activated by auto-phosphorylation of the tyrosine residues in the insulin receptor activation loop, which causes signaling via insulin receptor substrate proteins, followed by downregulation of the insulin signaling pathway [8]. Interestingly, bioactive compounds that simultaneously block the activity of α-glucosidase and PTP1B exhibit synergistic effects to prevent hyperglycemia and hence effectively improve insulin sensitization [9]. Therefore, active compounds with this dual enzyme inhibition profile, such as geranylated flavonoids [9], Diels-Alder type adducts [10], and plastoquinones [11], may be promising scaffolds that could effectually contribute to the cure of T2D and suppress accompanied risks. In this era of lead drug development, the unique biochemical components of marine sources have gained much attention due to their diverse range of biological activities. Recently, marine-derived active compounds including bromophenols, phlorotannins, terpenes, and sterols were reported as potent PTP1B or α-glucosidase inhibitors [12].
Hizikia fusiformis (Harvey) Okamura is an edible brown seaweed in the Sargassaceae family that is widely distributed in the northwest coasts of the Pacific Ocean [13]. H. fusiformis has been reported to exhibit antioxidant [14], anti-inflammatory [15], and anti-Alzheimer’s disease activities [16] along with gastrointestinal protective effects [17]. In addition, H. fusiformis extract increased glucose uptake and activated insulin signaling pathway in muscle cells [18]. Several compounds from H. fusiformis have been isolated and shown to exhibit different bioactivities. Polysaccharide and glycoprotein from H. fusiformis showed protective effects against ethanol-induced gastric injury and acetaminophen-induced liver injury, respectively [17,19], and 4-hydroxyphenethyl alcohol from boiled H. fusiformis possessed whitening effects [20]. In our previous study to find anti-T2D materials from marine sources, we found that the crude methanol extract of H. fusiformis and its non-polar fractions showed potent PTP1B and α-glucosidase inhibition [15]. However, the active ingredient in the H. fusiformis extract has been unknown.
In this study, we isolated 21 compounds including fatty acids (FAs), sterols, phenolic compounds, homomonoterpene, and triterpenoid glycosides from the non-polar fraction of H. fusiformis and evaluated the PTP1B and α-glucosidase inhibitory activity of the isolated compounds. We also assessed the enzyme inhibitory activity of aglycone isomers of triterpenoid glycosides based on many references that describe triterpenoid as a representative scaffold for PTP1B inhibition [21]. To characterize the roles of the active compounds as a source of PTP1B and α-glucosidase inhibitors, detailed enzyme kinetic analysis and automated docking simulation were conducted.

2. Results

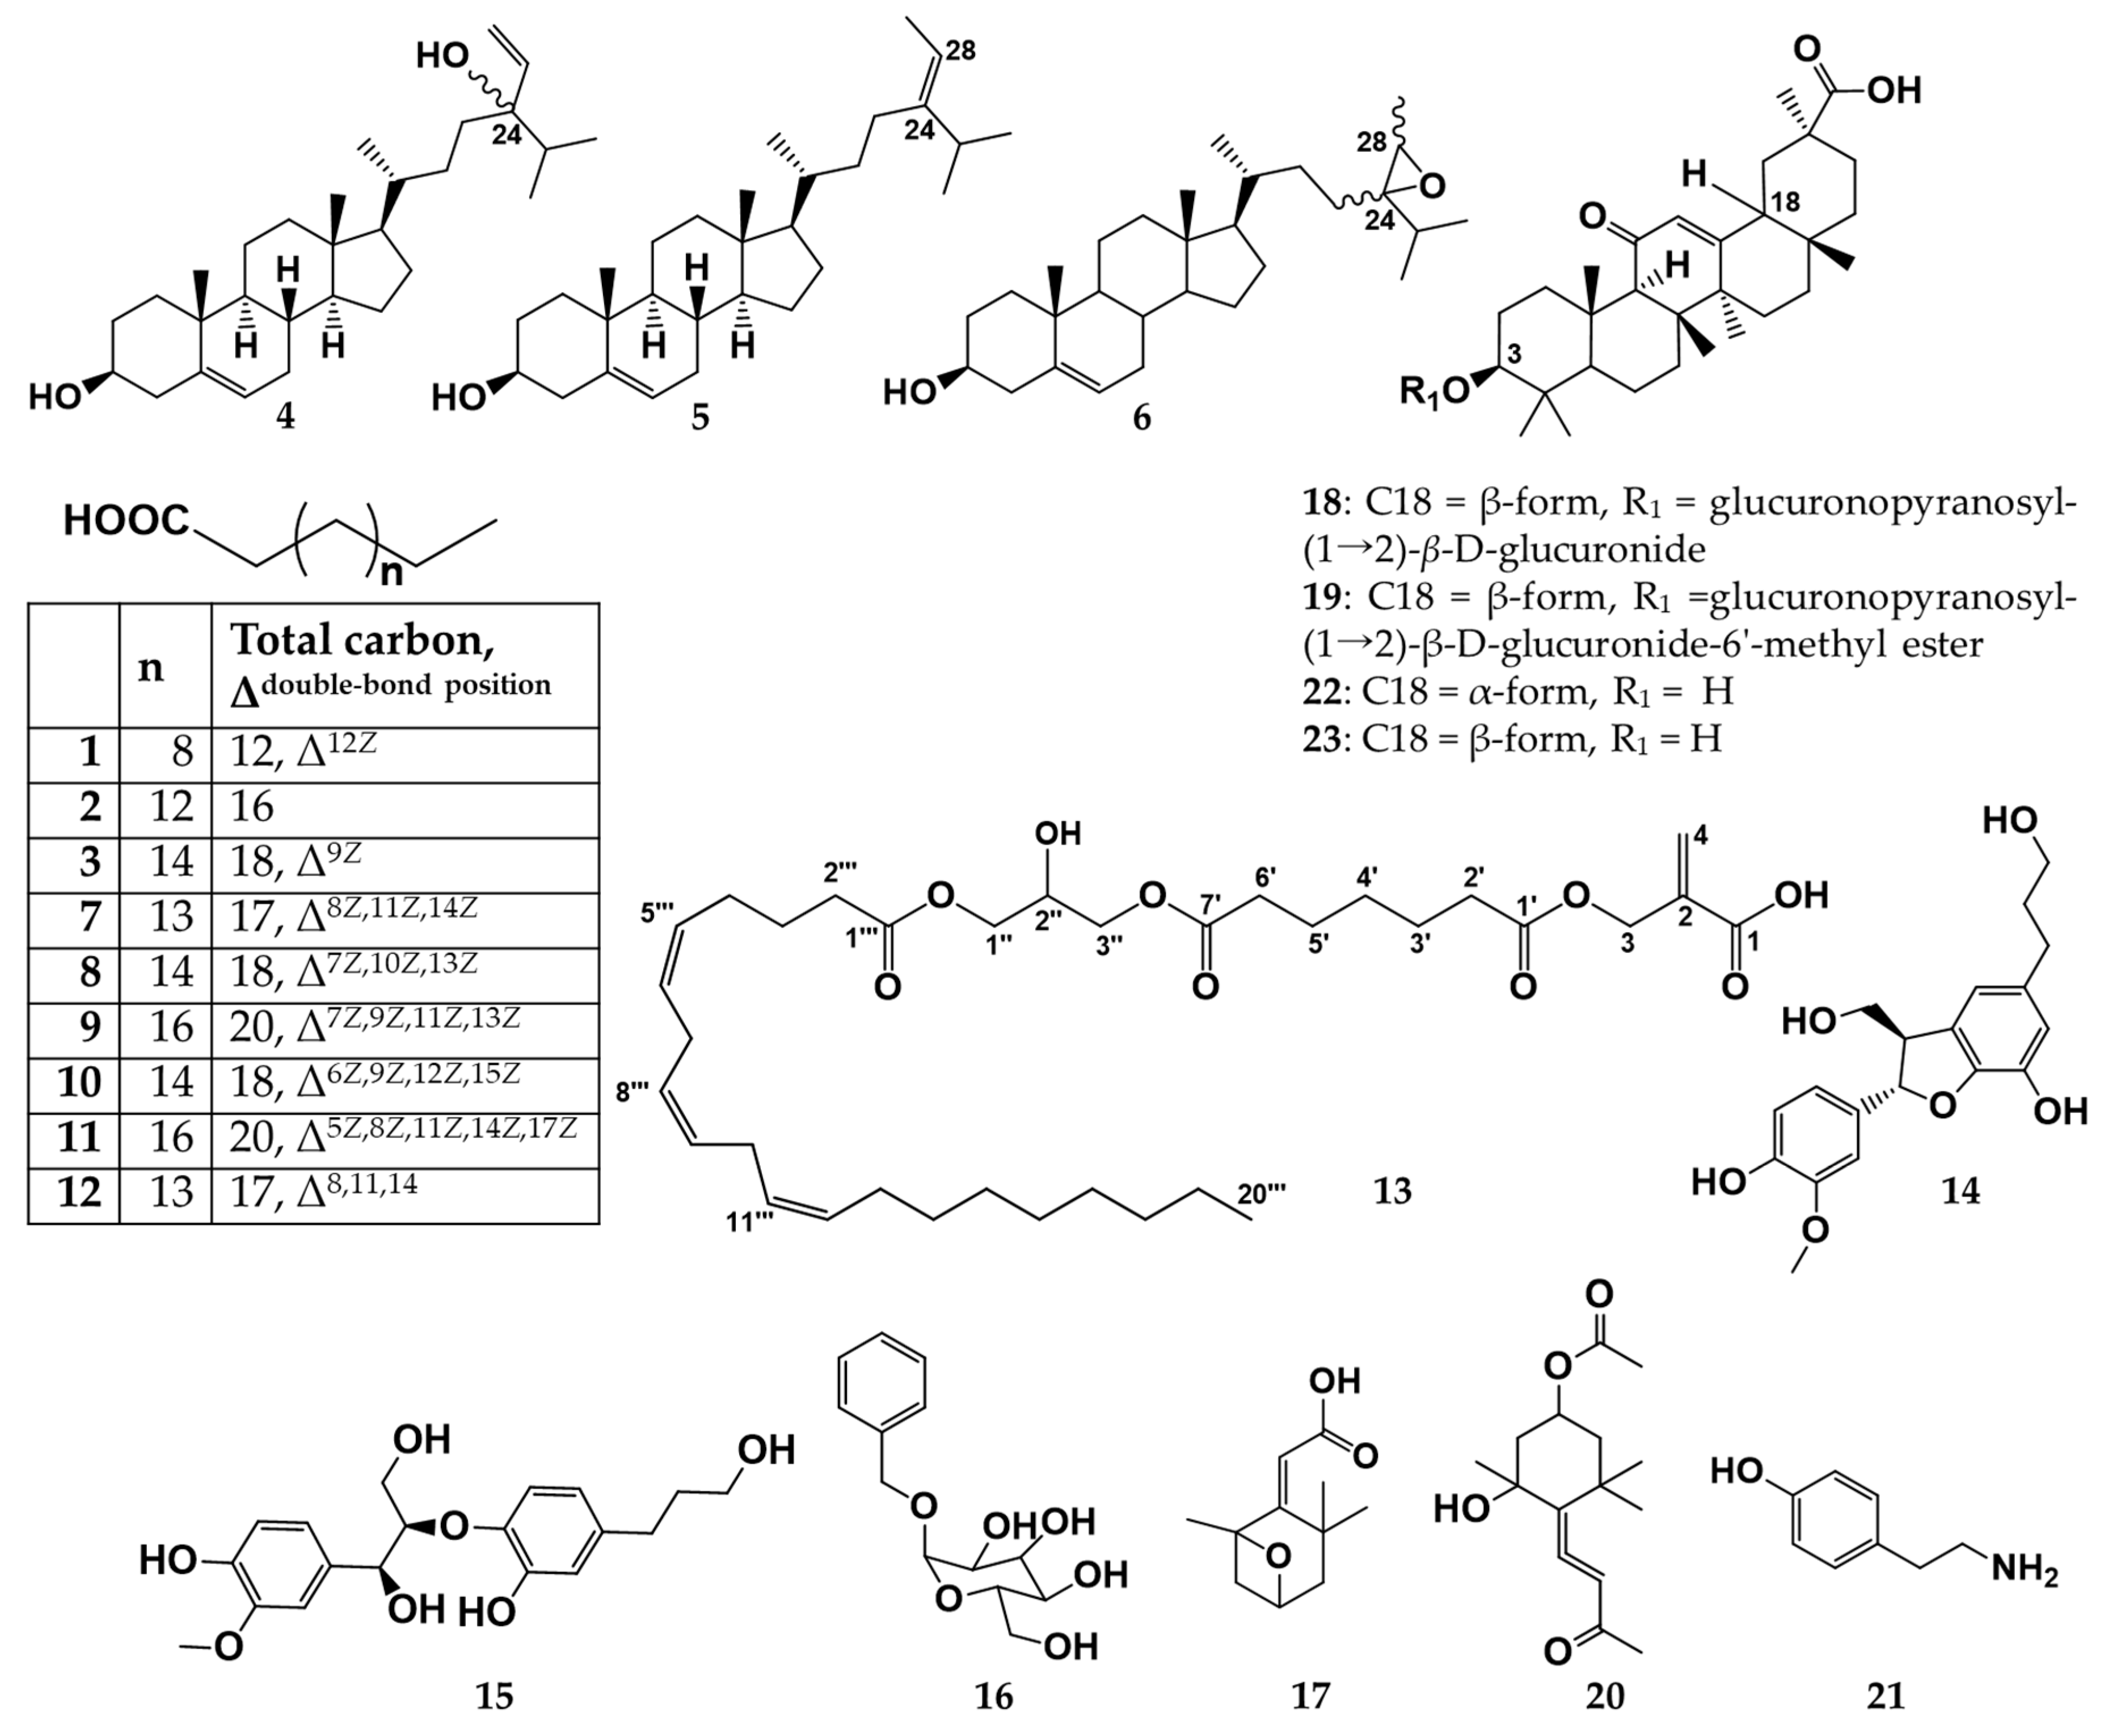
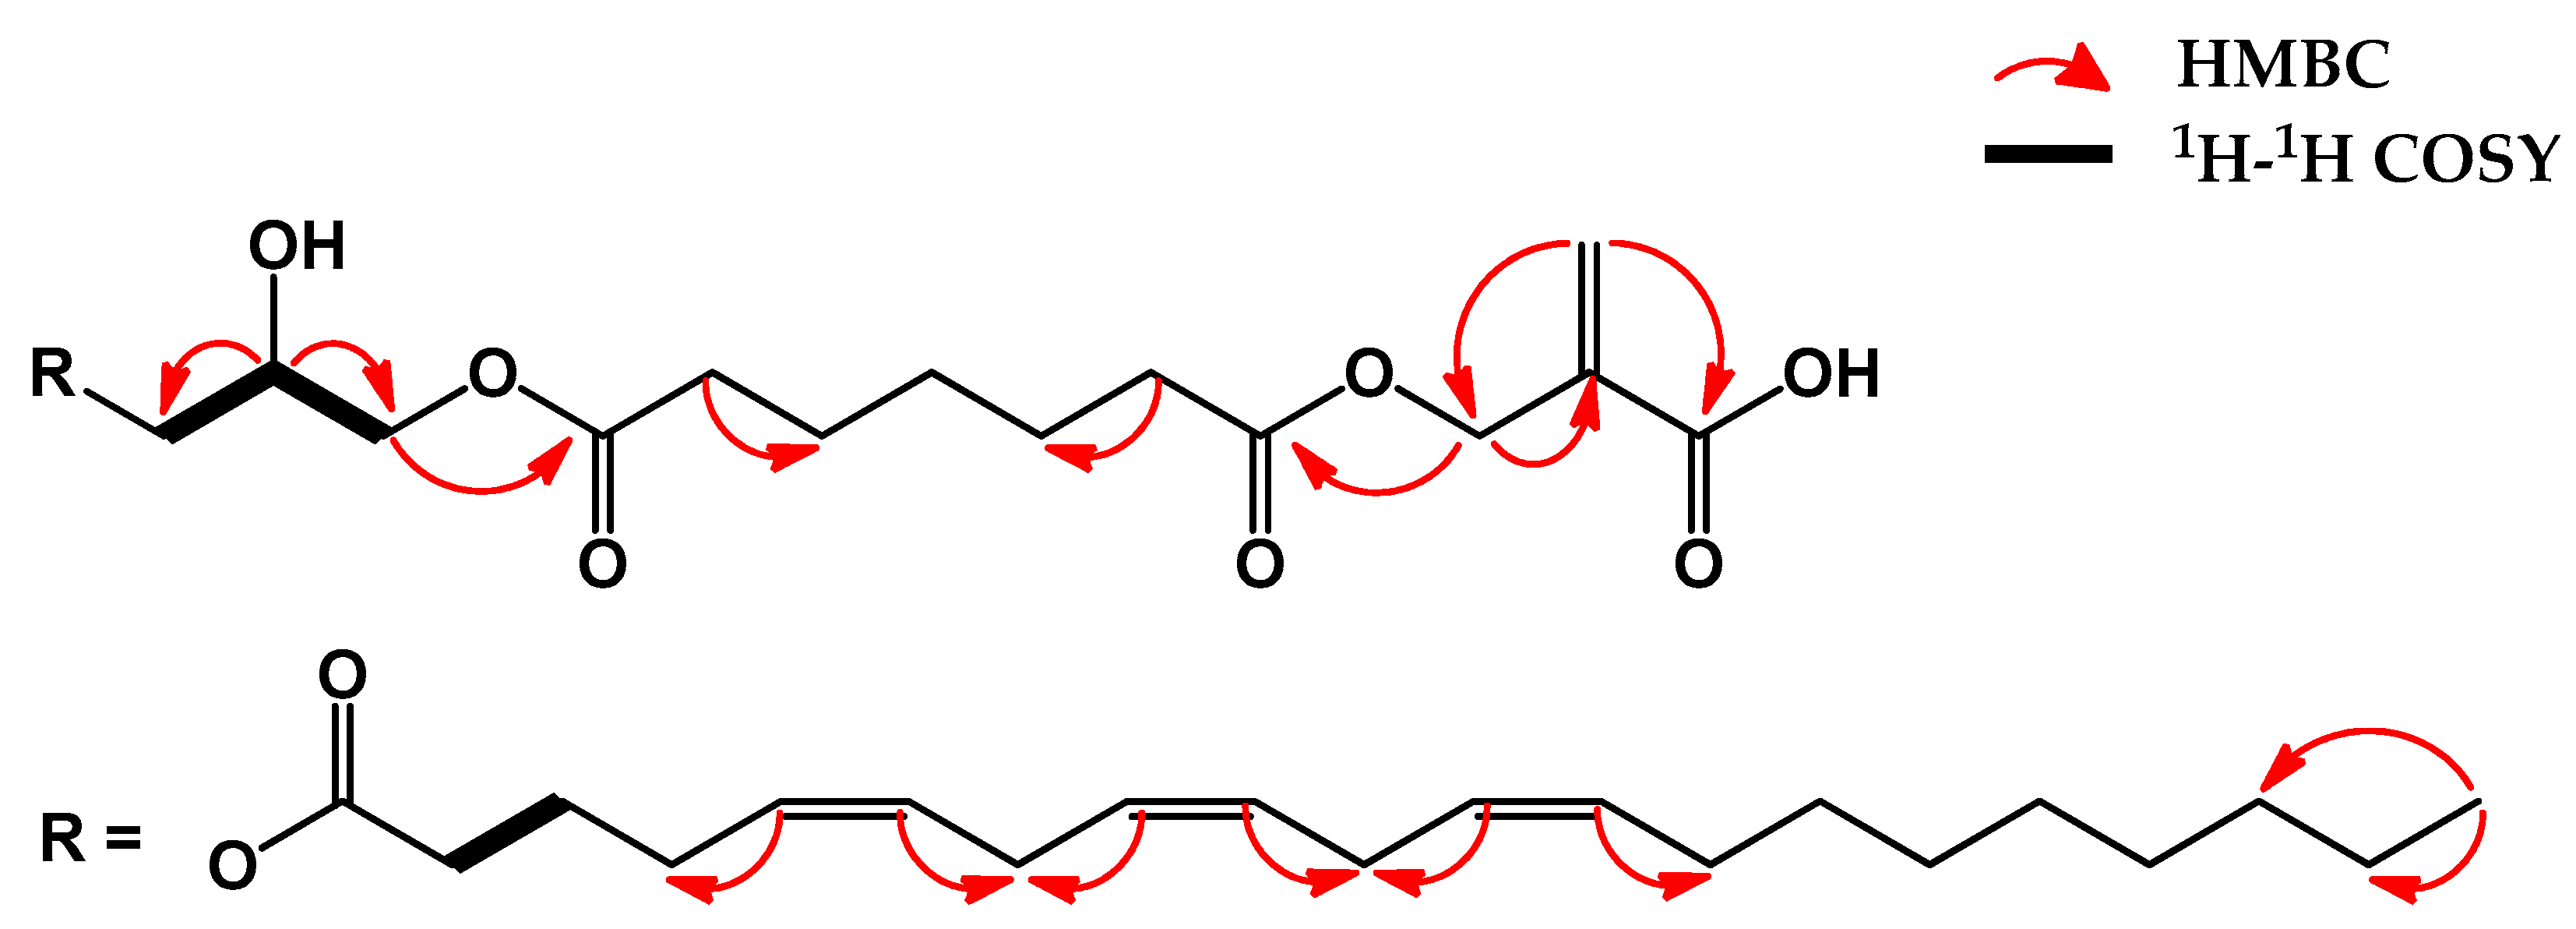
2.1. Structure Elucidation of Isolated Compounds

Here we sought to identify the active ingredient in the H. fusiformis methanol extract responsible for the potent PTP1B and α-glucosidase inhibitory activity [15]. We isolated 21 compounds from the non-polar fraction, including a new glycerol FA 2-(7′-(2″-hydroxy-3″-((5Z,8Z,11Z)-icosatrienoyloxy)propoxy)-7′-oxoheptanoyl)oxymethylpropenoic acid (13) and 20 known compounds (Figure 1).
Compound 13 was obtained as a yellow syrup, and the HR-ESI-MS showed a pseudo molecular ion peak at m/z 607.3820 [M + H]+ (calculated for C34H55O9, 607.3846), confirming a molecular formula of C34H54O9. The 1H- and 13C-NMR spectra for 13 indicated the presence of diacylglycerol, aliphatic chain with three double bonds, alkane dicarboxylic acid, and 2-methylpropenoic acid, strongly suggesting a glycerol FA derivative.
The detailed 1H- and 13C-NMR spectra for 13 showed signals characteristic of an unsymmetrical diacylglycerol [unit: δH 4.16 (m, H3″), 3.64 (d, J = 5.38, H3″), 5.24 (m, H2″), 4.36 (dd, J = 3.7 and 12 Hz, H1″), 4.14 (m, H1″); δC 69.3 (C3″), 70.1 (C2″), 62.7 (C1″)]. As shown in Figure 2, the H-2″ showed correlation to H-3″ in the COSY spectrum, which was further connected to H-1″. The HMBC correlations of diacylglycerol were also observed from H-2″ to C-1″ and C-3″. The H-1″ and H-3″ of diacylglycerol were correlated with carbonyl carbon (δC 173.2, C-1‴) of eicosatrienoic acid and carbonyl carbon (δC 173.6, C-7′) of heptane-1,7-dioic acid by HMBC spectrum, respectively.
Similarly, typical absorptions for acylglycerol and FA with aliphatic chains were detected in the FT-IR data: 3705.55-3680.48-3651.07 (O-H stretching), 3005.52-3022.39 (C-H olefins), 2957.79-2923.07-2892.7-2852.69 (aliphatic C-H stretching), 1737.07 (C=O stretching), and 1055.35-1033.18-1011.96 (C-O stretching) cm−1.
One methyl (δc 14.2, C-20‴), 12 methylenes (δc 22.8, 25.1, 25.8 × 2, 27.3, 27.4, 29.3, 29.6, 29.8 × 2, 32.1, 34.4), six olefinic carbons (δC 128.2, 128.3, 129.8, 130.1 × 2, 130.4), and one carbonyl carbon at δC 173.2 in the 13C-NMR spectra and a methyl signal at δH 0.88, overlapping methylene protons between δH 1.25 and 2.31, and six olefinic protons (δH 5.36) in the 1H-NMR spectra explain the presence of eicosatrienoic acid. The 1H-NMR spectrum showed two methylene groups lying between three double bonds of eicosatrienoic acid at δH 2.79 (2H), which could be assigned to H-7‴ and H-10‴. The HMBC correlations of eicosatrienoic acid were also observed from H-5‴ to C4‴, from H6‴ to C-7‴, H-8‴ to C-7‴, H-9‴ to C-10‴, H-11‴ to C-10‴, H-12‴ to C-13‴, and from H-20‴ to C-18‴ and C-19‴. The geometry of the three double bonds in this FA moiety was presumed to be cis-form based on the 13C-NMR spectrum (δC 25.8, 27.3, 27.4). The signals of carbons next to a double bond usually appear at δC 27 to 28 in a cis-configuration, whereas those of a trans-configuration appear at δC 32 to 33 [22,23].
Five methylene characteristic signals including two low field values at δH 34.3 × 2, 25.0 × 2, and 29.2 and two carboxyl carbons at δC 173.6 × 2 indicated the presence of heptane-1,7-dioic acid [24]. The HMBC correlations were observed from C-3 (δC 69.3) of 2-methylpropenoic acid to carbonyl carbon (δC 173.6, C-1′) of heptane-1,7-dioic acid. The HMBC correlations of 2-methylpropenoic acid were detected from two olefin protons (δH 5.96, 6.42, H-4a and 4b) to C-1 (δC 170.2) and C-3 (δC 69.3) and from H-3 (δH 4.20) to C-2 (δC 136.3).
Therefore, the chemical structure of compound 13 was identified as 2-(7′-(2″-hydroxy-3″- ((5Z,8Z,11Z)-icosatrienoyloxy)propoxy)-7′-oxoheptanoyl)oxymethylpropenoic acid. The chemical structure of compound 13 is described in Figure 1; Figure 2.
On the other hand, the 1H- and 13C-NMR spectra for compounds 1, 3, 7, 8, 9, 10, 11, and 12 indicated the presence of aliphatic chains with more than one double bond, carboxylic acid, and methyl group, signifying unsaturated FAs (Figures S7, S11, S16, S18, S20, S22, S24, and S26). The molecular weight of these compounds was confirmed by EI-MS analysis. The geometry of the double bonds in these FAs was presumed to be cis-form based on the 13C-NMR spectrum, as described above [22]. Precise chemical structures of these FAs were identified as (Z)-hexadec-12-enoic acid (1), (Z)-octaec-9-enoic acid (3), (8Z,11Z,14Z)-heptadeca-8,11,14-trienoic acid (7), (7Z,10Z,13Z)-octadeca-7,10,13-trienoic acid (8), (7Z,9Z,11Z13Z)-eicosa-7,9,11,13-tetraenoic acid (9), (6Z,9Z,12Z,15Z)-octadeca-6,9,12,15-tetraenoic acid (10), (5Z,8Z,11Z,14Z,17Z)-eicosa- 5,8,11,14,17- pentaenoic acid (11), and (8Z,11Z,14Z)-heptadeca-8,11,14-trienoic acid (12), respectively, by comparison with previously published data [23].
The 1H-NMR spectra of compounds 46 exhibited olefin methine, one oxygenated methine, five methyl signals, indicating a steroidal structure (Figures S13–S15). The 13C-NMR spectrum of 46 showed 29 carbon signals including olefin methine carbon (C-6), one oxygenated methine carbon (C-3), two quaternary carbons (C-10 and 13), seven methine carbons (C-8, 9, 13, 14, 17, 20, and 25), 10 methylene carbons (C-1, 2, 4, 7, 11, 12, 15, 16, 22, and 23), and five methyl carbons (C-18, 19, 21, 26, and 27). By comparison with the literature [25,26], structure of 5 was identified as fucosterol, very common sterol in algae. The additional olefin methine and exo-methylene carbon signals between C-24 and C-28 were observed in 13C-NMR spectra of sterol 4. In case of sterol 6, epoxy signals were observed at δc 66.48 and 66.38 (C-24) and δc 56.88 and 56.92 (C-28). The duplicate signals (C-17: δC 56.07/55.87 ppm, C-24: 89.23/89.18, C-28: 137.38/137.27, and C-29: 116.44/116.38) in the 13C-NMR spectrum of sterol 4 were in accordance with the occurrence of the two C-24 epimers (Figure S13). Similarly, the duplicate signals (C-17: δC 56.88/56.66 ppm, C-24: 66.48/66.38, C-25: 32.06/31.81, C-28: 57.08/56.92) in the 13C-NMR spectrum of sterol 6 were in accordance with the occurrence of the two C-24/C-28 epimers (Figure S15). The configuration at C-24/C-28 of compound 6 was determined by comparison with published data [26]. Finally, the chemical structures of sterols 4 and 6 were identified as mixture of 24R and 24S-saringosterol (4) and mixture of 24R,28R and 24S,28R-epoxy-24-ethylcholesterol (6), respectively, by interpretation of spectroscopic data and comparison with literature [25,26].
The 13C-NMR spectra of compounds 14 and 15 exhibited benzylic methylene carbon of n-propanol chain. In the 1H- and 13C-NMR spectra of 14 (Figure S28), one aryl-substituted benzofuran methine carbon (δC 88.68), one oxymethylene carbon (δC 65.12), and one methoxyl carbon (δC 56.33) were observed. In the 1H- and 13C-NMR spectra of 15 (Figure S29), one phenoxy methine proton (δH 4.00), one benzyl hydroxymethine proton (δc 4.87), one aromatic methoxyl carbon (δC 56.43), one oxymethylene carbon and two protons (δC 62.2 and δH 3.67 and 3.46) were observed. These spectral data and published data [27,28] establish the structures of 14 and 15 as cedrusin (14) and 1-(4-hydroxy-3-methoxyphenyl)-2-[2-hydroxy-4- (3-hydroxypropyl)phenoxy]-1,3- propanediol (15), respectively.
In addition, the 13C-and 1H-NMR spectra of compounds 1621 and previously published data [29,30,31,32,33,34] establish the structures of 1621 as benzyl alcohol alloside (16), madhusic acid A (17), glycyrrhizin (18), 18β-glycyrrhetinic acid-3-O-β-d-glucuronopyranosyl-1(→2)-β-d-glucuronide -6’-methyl ester (19), apo-9′-fucoxanthinone (20), and tyramine (21), respectively.
Notably, compounds 712, 1417, 19, and 20 were isolated from H. fusiformis for the first time.

2.2. PTP1B and α-Glucosidase Inhibitory Activity of the Isolated Compounds from H. fusiformis

As a result, all FAs showed potent PTP1B inhibition with IC50 values in the range of 4.86–49.39 μM. Among the FAs, compound 7 showed the highest inhibitory activity followed by compound 13 and 1 with IC50 values of 4.86 ± 1.36, 4.92 ± 0.01, and 6.59 ± 0.09 μM, respectively. Among the sterols, compound 6, which is an epoxide of fucosterol (5), exhibited 3 times stronger PTP1B inhibitory activity than 5 (IC50 = 16.70 ± 0.36 and 50.58 ± 1.86 μM for sterols 6 and 5, respectively). However, sterol 4 showed no activity under the tested concentration. Among the triterpenoid derivatives, compound 19, which is a 6′-methyl ester of compound 18, showed 2.2 times stronger PTP1B inhibition than compound 18 (IC50 = 110.33 ± 0.39 and 49.39 ± 1.39 μM for compounds 18 and 19, respectively). Due to the moderate effect of triterpenoid glycoside 18, we further evaluated the activity of the metabolites of 18 including 18α-glycyrrhetinic acid (22) and 18β-glycyrrhetinic acid (23). As shown in Table 1, 22 showed potent inhibitory activity against PTP1B having an IC50 value of 10.40 ± 0.75 µM followed by 23 with an IC50 of 26.07 ± 0.59 µM with ursolic acid as a positive control (IC50 = 7.31 ± 0.16 µM). In contrast, other compounds (1517, 20, and 21) exhibited weak or no inhibitory activity against PTP1B.
In the case of α-glucosidase, compounds 22 and 23 exhibited effective inhibitory activity with IC50 values of 113.30 ± 0.70 and 128.72 ± 3.88 µM, respectively, which are slightly less than the positive control acarbose (IC50 = 158.41 ± 1.05 µM). However, compounds 18 and 19 showed no activity under the tested concentration. Interestingly, unsaturated FAs C20:4 (Δ7,9,11,13) (9) and C17:3 (Δ8,11,14) (12) showed potent inhibition against α-glucosidase with IC50 values of 34.85 ± 2.39 and 43.90 ± 0.77 µM, respectively. In addition, neolignan 14 and trace amine 21 also showed moderate inhibition with IC50 values of 133.84 ± 3.86 and 273.23 ± 5.65 µM, respectively. In contrast, other compounds exhibited weak or no activity against α-glucosidase inhibition.

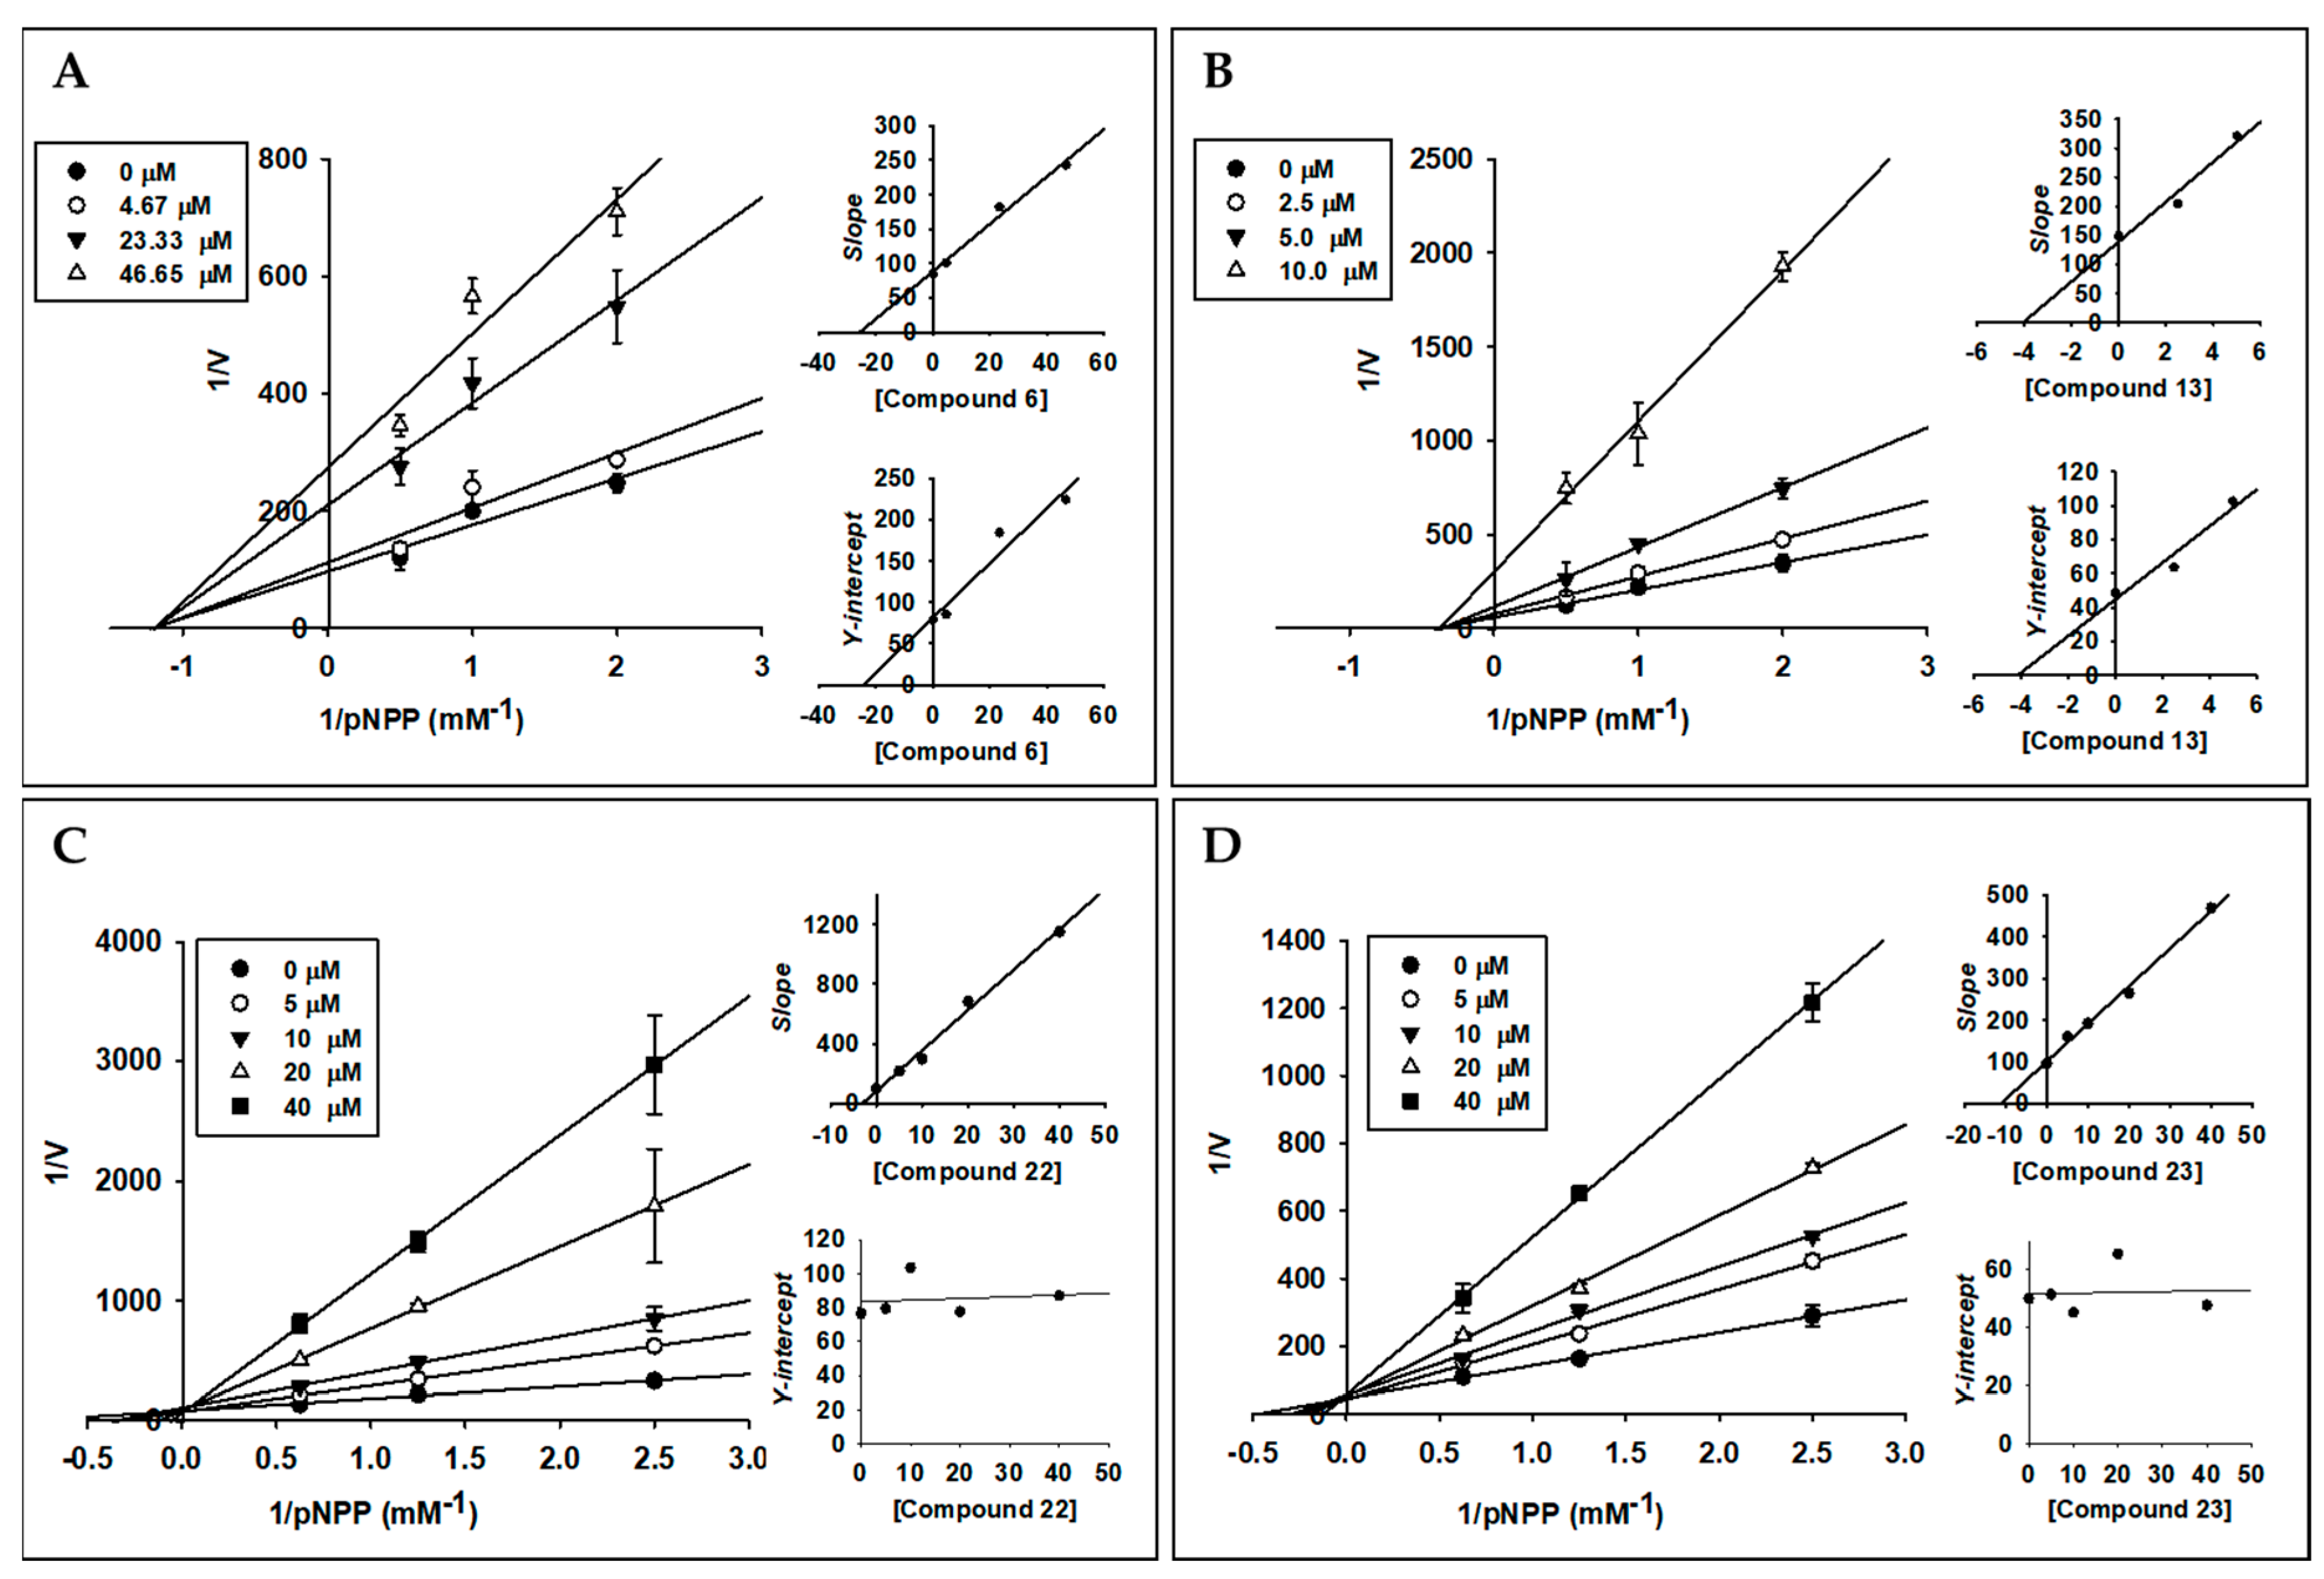
2.3. Enzyme Kinetic Analysis of Active Compounds with PTP1B

Compounds 6, 13, 22 and 23 were subjected to enzyme kinetic study, since these compounds demonstrated potent activity against PTP1B. According to the Lineweaver-Burk plot and secondary plot of y-intercept (Table 1 and Figure 3), compounds 22 and 23 showed general competitive type inhibition against PTP1B, whereas compounds 6 and 13 showed inhibition in a non-competitive manner. The binding constant of inhibitor with enzyme-substrate complex (Kiu) and free enzyme (Kic) was determined using the secondary plot of 1/Vmax,app (Y-intercept) and Km,app/Vmax,app (slope) of the respective linear regression of Lineweaver-Burk plot, respectively. As shown in Figure 3, Kic values for the inhibition of PTP1B were 3.17 and 10.17 µM for 22 and 23, respectively, and Kiu values for inhibition of PTP1B by 6 and 13 were 24.43 and 4.13 µM, respectively.

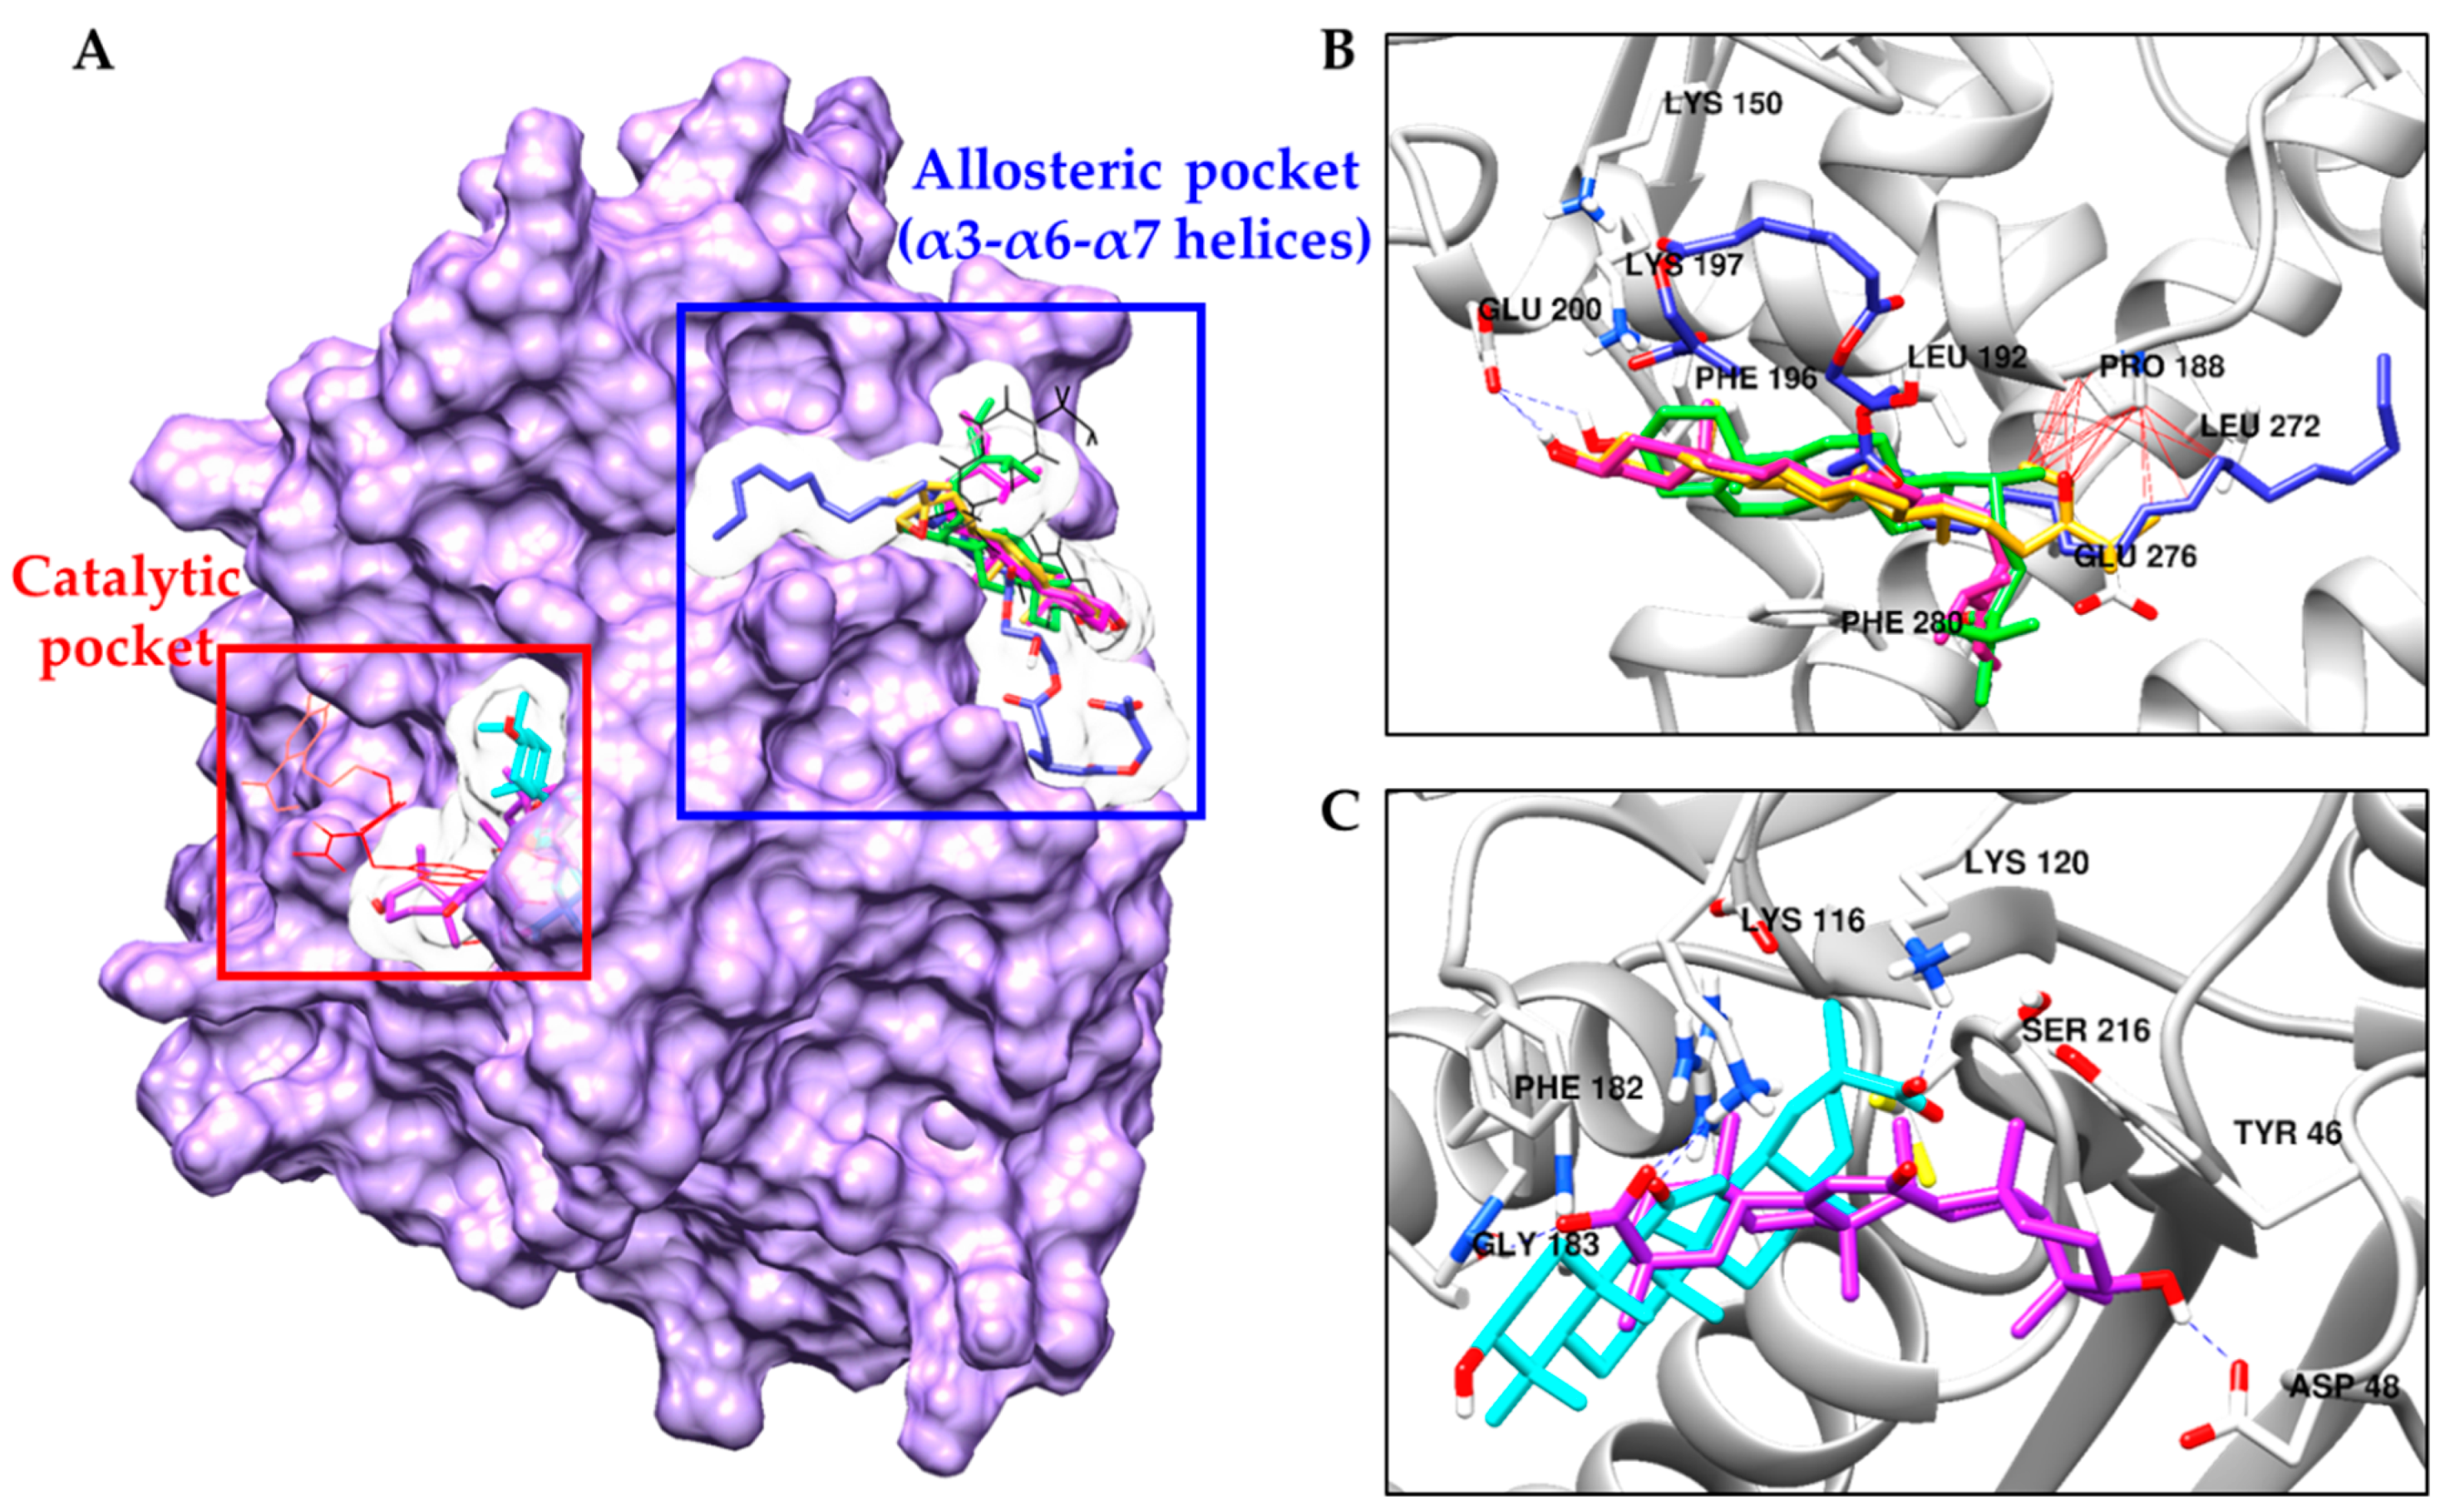
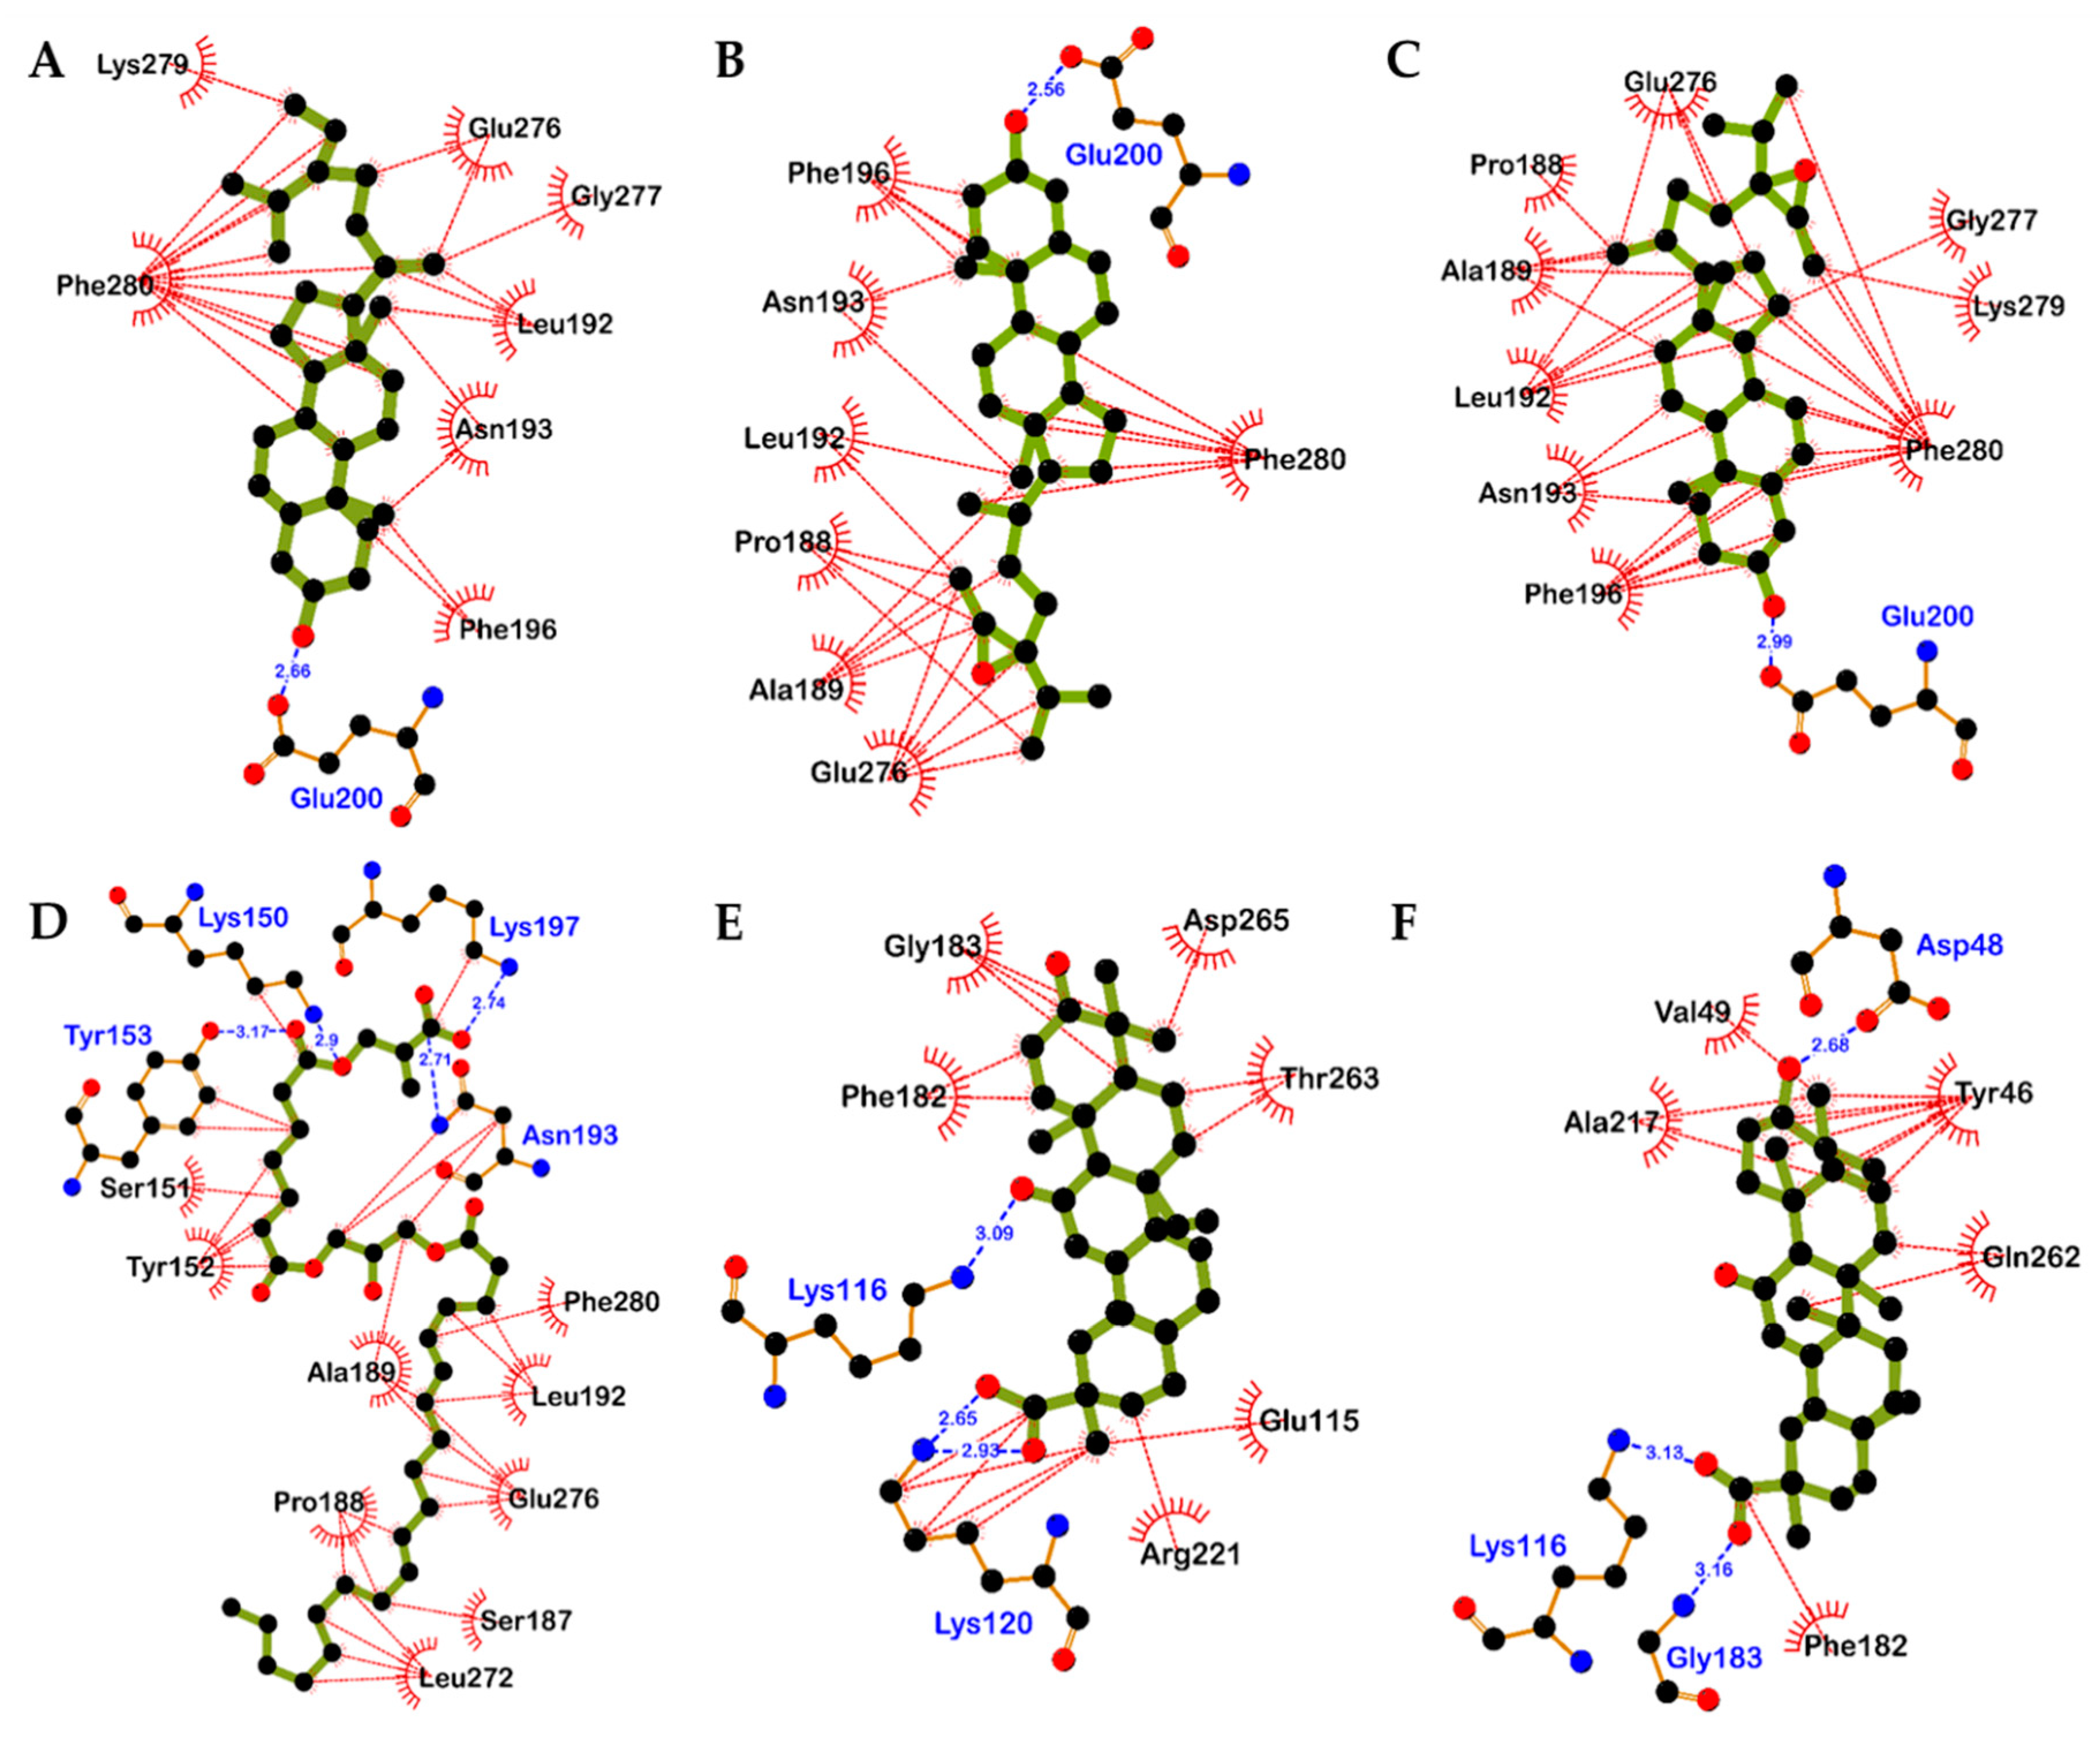
2.4. Molecular Docking Simulation in PTP1B Inhibition

Due to the potent inhibitory activity of 5, 6, 13, 22, and 23 against PTP1B, we conducted computational docking analysis using these compounds to evaluate binding affinities and aspects. Sterols 5 and 6 and compound 13 are well docked into the allosteric pocket of PTP1B (α3, α6, and α7 helices), whereas triterpenoids 22 and 23 are docked into the catalytic site (Figure 4). Because 6 is mixture of 24R,28R and 24S,28R-epoxy-24-ethylcholesterol (6a and 6b), we also compared the binding aspect between the two isomers. Compound A (catalytic inhibitor) and compound B (allosteric inhibitor) were used as positive controls to verify the docking protocol.
As shown in Figure 4; Figure 5, best fitted models of 5, 6a, and 6b interacted with Glu200 in the α3 helix via H-bond and surrounded by hydrophobic residues in α3 (Phe196, Asn193, and Leu192) and α6 (Glu276 and Phe280) helices of enzyme with negative B-scores of −8.10, −7.90, and −8.66 kcal/mol, respectively. Interestingly, one difference was observed between the 5-PTP1B complex and the 6a/6b-PTP1B complex. Both 6a and 6b interacted with Pro188 residue via a hydrophobic bond (Figure 5B,C), but the aliphatic side chain of 5 did not reach near Pro188 (Figure 5A). Docking examination showed that 13 interacted with the allosteric site of the enzyme by positioning the long aliphatic chain toward the center of α3 and α6 helices of the enzyme, whereas the methacrylic acid moiety of 13 was located at the edge of the α3 helix and interacted with Asn193 and Lys197 via H-bond interactions (Figure 5D). Although 13 showed strong potency against PTP1B inhibition in vitro, its binding affinity was poor due to the long aliphatic chain. However, four tight H-bond interactions between compound 13 and PTP1B residues including Tyr153, Lys150, Lys197, and Asn193 may play key roles in PTP1B inactivation.
In contrast to sterols and compound 13, the best docked models of compounds 22 and 23 were placed into the catalytic site of PTP1B. As shown in Figure 4C, binding orientations of 22 and 23 were slightly different. The PTP1B-22 complex had a negative B-score (Table 2) of −9.09 kcal/mol with two H-bonds with Lys116 and Lys 120 as well as a salt-bridge interaction with Lys120 residue. Hydrophobic interactions between 22 and Phe182, Gly183, Arg221, Glu115, Thr263, Asp265, and Lys120 residues were also observed (Figure 5E). However, the PTP1B-23 complex had a B-score of –8.90 kcal/mol with two H-bonds with Gly183 and Asp48 residues and a salt-bridge interaction between carboxyl moiety of 23 and Lys116. As shown in Figure 5F, 23 was surrounded by Tyr46, Val49, Ala217, Phe182, and Gln262 residues via hydrophobic interaction.

3. Discussion

Growing evidence has linked PTP1B with insulin resistance, T2DM, and obesity. Numerous studies have revealed that PTP1B negatively controls leptin and insulin signaling pathways [12]. Therefore, a considerable effort has been expended on generating small molecule inhibitors of PTP1B to promote the insulin signaling pathway in insulin resistant states. By following the conventional method of producing inhibitors that target the catalytic site of an enzyme, many selective and reversible PTP1B inhibitors were discovered [35]. However, these small molecule inhibitors, which often possessed phospho-Tyr mimetic moieties, were highly charged and lacked oral bioavailability, showing limitations in their potential for drug development. Therefore, the development of an allosteric inhibitor is urgently needed to develop orally bioavailable inhibitors of PTP1B [36]. We previously demonstrated that non-polar fractions of H. fusiformis methanol extract showed potent PTP1B and α-glucosidase inhibition [15]. Various non-polar components such as 24-ketocholesterol, fucosterol, 24,28-epoxyfucosterol, fucoxanthin, and saringosterol have been isolated from this seaweed [14,37]. However, the systematic extraction and isolation of compounds from H. fusiformis as well as the mechanisms of PTP1B and α-glucosidase inhibition through detailed enzyme kinetics and molecular docking simulation have not been reported. In this study, we isolated one new and 20 known compounds from the non-polar fraction of H. fusiformis methanol extract and evaluated the PTP1B and α-glucosidase inhibitory activity of the isolated compounds. Enzyme assay results revealed that unsaturated and saturated FAs, sterols, and triterpenoid glycosides showed good inhibitory activity against PTP1B. Shibata et al. reported that unsaturated FAs at 10 μM drastically inhibited PTP1B, whereas saturated FAs showed moderate inhibition [38]. Interestingly, in rat adipocytes, long-time treatment of saturated free FAs inhibited insulin-stimulated glucose uptake, but short-time treatment enhanced glucose transport [39]. Similarly, in our results, unsaturated FAs showed significantly strong PTP1B inhibitory activity with IC50 values in the range of 4.86–16.43 μM. In contrast, among saturated FAs, palmitic acid (2) showed moderate activity with an IC50 value of 49.39 ± 1.39 μM. In addition, C17:3 (Δ8,11,14) (7) and the new compound 13 showed notable inhibition among the isolated 22 compounds. Together, our results and the previously reported data suggest that FAs could be an important factor responsible for T2DM.
A previous study showed that fucosterol (5) from Pelvetia siliquosa possessed anti-diabetic activity in streptozotocin-induced Sprague-Dawley rats [40]. Another report demonstrated that 5 is a non-competitive PTP1B inhibitor in vitro and improved insulin resistance by inhibition of PTP1B and stimulation of insulin signaling pathway in insulin-resistant HepG2 cells [41]. However, information on the biological activity of fucosterol epoxide (6) is limited. As shown in Table 1, 5 and its epoxide (6) showed PTP1B inhibitory activities. Interestingly, 6 showed 3 times stronger activity than 5. Enzyme kinetic analysis using Lineweaver-Burk plot and its secondary plot and computational docking analysis demonstrated that 5, 6, and 13 are non-competitive inhibitors and well docked into the allosteric pocket placed ~20 Å away from the catalytic site of PTP1B [42]. Best fitted models of 5 and 6 interacted with Glu200 in the α3 helix via H-bond and surrounded by hydrophobic residues in α3 and α6 helices of enzymes such as Phe280, Phe196, Leu192, and Ala189. However, the lack of interaction between compound 5 and Pro188 explains its lower PTP1B inhibitory potency compared to 6.
PTP1B enzyme exists in two conformations: open and closed forms. In the open form, the WPD loop, which contains Trp179‒Asp181 residues, is beside the catalytic site to form an open-binding pocket, which is accessible for the substrate. In the closed-form, the WPD loop covers the substrate-binding site of the enzyme, forming a catalytically competent state. For the WPD loop to close, Pro188-Phe191-Leu192 residues must move to accommodate Trp179 [42]. However, this movement is blocked by compound 6 directly via hydrophobic interaction. Thus, the allosteric inhibitor 6 could prevent the movement of the WPD loop and maintain the loop in an open (inactive) form. In the case of 13, this compound also hydrophobically interacted with Pro188 residue with four H-bond interactions with Tyr153, Lys150, Lys197 and the key allosteric site residue Asn193. These interactions may play critical roles in PTP1B inactivation in the PTP1B-13 complex.
We also found that triterpenoid glycosides 19 and 18 are effective and moderate PTP1B inhibitors, respectively. Compound 19, which is a 6′-methyl ester of 18, showed 2.2 times stronger PTP1B inhibition than compound 18. In addition, 18α and 18β-glycyrrhetinic acids (22 and 23), metabolites of 18 and 19, are stronger PTP1B inhibitors compared with 18 and 19. Although the PTP1B inhibitory activities of 22 and 23 were previously described by Na et al. [43], the inhibitory mechanisms and structure-activity relationships have not been reported. In our enzyme kinetic and computational study, triterpenoids 22 and 23 showed competitive inhibition activity against the PTP1B enzyme and were strongly fitted into the catalytic site of the enzyme. Due to the different configuration (α and β) of the hydrogen atom at C-18 position, binding aspect was slightly changed. The carboxyl moiety of 22 and Lys120, Lys116, Tyr46 and Ser216 residues interacted via hydrogen bonds including salt bridge and conventional H-bonds, respectively. These interactions may contribute to the strong PTP1B inhibitory activity of 22.
Regarding α-glucosidase inhibitory activity, 9 showed notable inhibitory activity among the FAs. However, we could not define the correlation among α-glucosidase inhibitory activity, unsaturation, and number of carbon atoms. In addition, sterols and triterpenoid glycosides did not show any inhibition against α-glucosidase under the tested concentrations, but triterpenoids 22 and 23 exhibited similar effect with the positive control, acarbose.
This study has four important findings: (i) the isolation and structure identification of compounds from H. fusiformis, (ii) the identification of FAs as PTP1B and α-glucosidase inhibitors, (iii) the demonstration that sterols derived from H. fusiformis function as PTP1B inhibitors, and (iv) the demonstration that glycyrrhizin and its metabolites function as PTP1B and α-glucosidase inhibitors. Notably, glycyrrhizin (18) is metabolized by β-d-glucuronidase or intestinal flora to glycyrrhetinic acid [44,45]. Therefore, the in vivo anti-diabetic activity of 18 may be attributed to the PTP1B and α-glucosidase inhibitory activity of its metabolite, glycyrrhetinic acid.
In conclusion, the in vitro experimental and in silico computational results from this study confirmed that compounds isolated from H. fusiformis exhibit potent PTP1B and α-glucosidase inhibitory activity. Among the isolated compounds, FAs and triterpenoid derivatives showed potent inhibitory activity against both enzymes. However, sterols did not show any inhibition activity against α-glucosidase. Taken together, these results suggest that constituents of H. fusiformis could be used as promising anti-diabetic materials to delay the absorption of glucose via inhibition of α-glucosidase enzyme in the digestive organs and to enhance the insulin signaling pathway via inhibition of the PTP1B enzyme in insulin-sensitive organs.

4. Materials and Methods

4.1. General Experimental Procedures

The specific rotations were operated on a JASCO DIP-370 digital polarimeter. The 1H- and 13C-NMR spectra were recorded in methanol-d4 and chloroform-d on a JEOL JNM ECP-400 spectrometer (Tokyo, Japan) at 400 MHz and 100 MHz, respectively. The infrared (IR) spectra were measured on a Mattson Polaris FT/IR-300E spectrophotometer. Mass spectra were recorded using a Quattro II mass spectrometer. Column chromatography was conducted using Diaion HP-20, Sephadex LH-20 (20–100 µM, Sigma, St. Louis, MO, USA), silica (Si) gel 60 (70–230 mesh, Merck, Darmstadt, Germany), and LiChroprep RP-18 (40–63 µM, Merck). All TLC was performed on precoated Merck Kiesel gel 60 F254 plates (20 × 20 cm, 0.25 mm) and RP-18 F254S plates (5 × 10 cm, Merck). The spray reagent was 25% H2SO4.

4.2. Chemicals and Reagents

Yeast α-glucosidase, p-nitrophenyl α-d-glucopyranoside (pNPG), acarbose, p-nitrophenyl phosphate (pNPP), ursolic acid, ethylenediaminetetraacetic acid (EDTA), 18α-glycyrrhetinic acid, and 18β-glycyrrhetinic acid were purchased from Sigma Aldrich. A truncated form of human recombinant PTP1B (amino acid 1-322) was purchased from Enzo Life Sciences (Farmingdale, NY, USA) and dithiothreitol (DTT) was purchased from Bio-Rad Laboratories (Hercules, CA, USA). All other chemicals and solvents were purchased from E. Merck, Fluka, and Sigma-Aldrich, unless otherwise stated.

4.3. Plant Material

Seaweed H. fusiformis was purchased from Wando, Republic of Korea. A whole plant voucher specimen was registered and deposited at the Department of Food and Life Science, Pukyong National University, Busan, South Korea (Professor Jae Sue Choi).

4.4. Extraction, Fractionation, and Isolation

The H. Fusiformis plant (25 kg) was extracted with 95% MeOH (10 L × 3 times) for 3 h at 70 °C. Then, the total filtrate was concentrated to dryness in vacuo at 70 °C to give a MeOH extract. The MeOH extract (4.8 kg) was suspended in water (5 L) and subjected to Diaion HP-20 column chromatography (CC) eluted with solvent systems of MeOH:H2O (0:1, 1:3, 1:1, 3:1, 1:0) and acetone (100%) to give seven fractions (HF-A–F). Fraction HF-F (40 g) was subjected to SiO2 CC eluted with the solvent system of n-hexane-acetone gradient (1:0 to 0:1) to afford 16 sub-fractions (HF-1–16). Sub-fraction HF-1 (3.6 g) was chromatographed on SiO2 CC with a mobile phase gradient of n-hexane:CH2Cl2:EtOAc (H:C:E, 6:2:1–5:5:5) to give (Z)-hexadec-12-enoic acid (1) (6.4 mg) and palmitic acid (2) (31 mg) [46]. The last fraction of HF-1 (980 mg) was chromatographed over a RP C18 column eluted with MeOH:H2O (8:1) to give compound 2 (61 mg) and (Z)-octaec-9-enoic acid (3) (20 mg) [23]. Fraction HF-2 (3.1 g) was subjected to SiO2 open CC eluted with H:C:E gradient (10:1:1 to 1:1:1) to give six sub-fractions (HF-2A–2F). Sub-fractions HF-2B (420 mg) and HF-2C (735 mg) were chromatographed over open column SiO2 with a solvent system of H:C:E (4:4:1) to yield a mixture of 24R and 24S-saringosterol (4) (70 mg) and fucosterol (5) (200 mg), respectively [25,26]. Sub-fraction HF-2E (345 mg) was chromatographed over a RP C18 open column eluted with MeOH:H2O (6:1) to yield mixture of 24R,28R and 24S,28R-epoxy-24-ethylcholesterol (6) (6.2 mg) and (8Z,11Z,14Z)-heptadeca-8,11,14-trienoic acid (7) (90 mg) [23]. Sub-fraction HF-2F (980 mg) was subjected to RP C18 open CC to give (7Z,10Z,13Z)-octadeca-7,10,13-trienoic acid (8) (19 mg) and (7Z,9Z,11Z,13Z)-icosa-7,9,11,13-tetraenoic acid (9) (61 mg). Fraction HF-3 (1.2 g) was chromatographed to open column SiO2 using a solvent system of H:C:E (1:4:0.5–1:4:5) to afford six fractions (HF-3A–3F). Sub-fraction HF-3C (512 mg) was further chromatographed over a RP C18 open column eluted with a solvent system acetonitrile:MeOH:H2O (A:M:H, 4:4:1) to yield compounds (6Z,9Z,12Z,15Z)-octadeca-6,9,12,15-tetraenoic acid (10) (14 mg) and (5Z,8Z,11Z,14Z,17Z)-eicosa-5,8,11,14,17-pentaenoic acid (11) (50 mg) [23]. Sub-fraction HF-8 (307 mg) was subjected to SiO2 CC eluted with solvent systems of H:C:E (4:4:0.5 to 4:4:4) to give four sub-fractions (HF-8A–8D). Sub-fraction HF-8C (41 mg) was purified by RP C18 open column using a solvent system A:M:H (5:4:1) to afford (8Z,11Z,14Z)-heptadeca-8,11,14-trienoic acid (12) (10 mg). Sub-fraction HF-8B (89 mg) was chromatographed over RP C18 open column eluted with A:M:H (4:4:2) to yield 2-(7′-(2″-hydroxy-3″-((5Z,8Z,11Z)-icosatrienoyloxy)propoxy)-7′-oxoheptanoyl) oxymethylpropenoic acid (13) (25 mg). Fraction HF-15 (1.32 g) was subjected to RP C18 open CC eluted with a solvent system of acetone:H2O (1:2) to give four fractions (HF-15A–15D). Sub-fractions HF-15A (48 mg) and HF-15B (56 mg) were purified by a RP C18 open column using mobile phase acetone:H2O (1:3) to yield cedrusin (14) (3.0 mg) and 1-(4-hydroxy-3-methoxyphenyl)-2 -[2-hydroxy-4-(3-hydroxypropyl)phenoxy]-1,3-propanediol (15) (5.5 mg), respectively [27,28]. Sub-fraction HF-15C (206 mg) was chromatographed over a RP C18 open CC eluted with acetone:H2O (1:3) to give benzyl alcohol alloside (16) (7.8 mg) and madhusic acid A (17) (5.0 mg) [29,30]. Fraction HF-16 (623 mg) was chromatographed over a RP C18 open column using solvent systems of MeOH:H2O (1:5–1:1) to give four fractions (HF-16A–16D). Sub-fraction HF-16A (41 mg) was purified over a RP C18 open column using a solvent system MeOH:H2O (1:6) to yield 18β-glycyrrhetinic acid-3-O-β-d-glucuronopyranosyl-1(→2)-β-d-glucuronide (18, glycyrrhizin) (5.1 mg) [31]. Sub-fractions HF-16B (73 mg) and HF-16C (38 mg) were chromatographed by RP C18 open CC using mobile phase A:M:H (1:1:10) to give 18β-glycyrrhetinic acid-3-O-β-d-glucuronopyranosyl- 1(→2)-β-d-glucuronide-6’-methyl ester (19) (2.5 mg) and (3R)-4-[(2R,4S)-4-acetoxy-2-hydroxy- 2,6,6-trimethylcyclohexylidene]but-3-en -2-one (20, apo-9′-fucoxanthinone) (1.6 mg), respectively [32,33]. Sub-fraction HF-16D (463 mg) was chromatographed by RP C18 open CC to give tyramine (21) (2.9 mg) [34]. By comparison with previously published data, the isolated compounds 121 were identified by GC-MS and 1H- and 13C-NMR analysis. The chemical structures of the isolated compounds are shown in Figure 1. In the Table S1, molecular weight and molecular formulas of all the isolated compounds were mentioned.
Compound 13: Yellow syrup; [ α ] D 23 −50.55° (c 0.1, MeOH); IR (KBr, νmax, cm−1): 3705.55, 3680.48, 3651.07 (O-H stretching), 3005.52-3022.39 (C-H olefins), 2957.79-2923.07-2892.7-2852.69 (aliphatic C-H stretching), 1737.07 (C=O stretching), 1055.35-1033.18-1011.96 (C-O stretching); HR-ESI-MS: m/z 607.3820 [M + H]+ (calcd. for C34H55O9, 607.3846). 1H-NMR (400 MHz in CDCl3): 6.42 (1H, s, H4a), 5.96 (1H, s, H4b), 5.36 (6H, overlapped, H5‴, H6‴, H8‴, H9‴, H11‴, H12‴), 5.24 (1H, m, H2″), 4.36 (1H, dd, J = 3.7 and 12 Hz, H1″), 4.20 (2H, overlapped, H3), 4.16 (1H, overlapped, 3″), 4.14 (1H, overlapped, H1″), 3.64 (1H, d, J = 5.38 Hz, H3″), 2.79 (4H, overlapped, H7‴, H10‴), 2.31 (6H, t, J = 7.84 Hz, H2′, H6′, H2‴), 2.06 (4H, overlapped, H4‴, H13‴), 1.59 (2H, m, H3‴), 1.25 (16H, overlapped, H3′-5′, H14‴-17‴), 0.88 (3H, t, J = 6.74 Hz, H20‴); 13C-NMR (100 MHz in CDCl3): 173.6 (C1′ and C7′), 173.2 (C1‴), 170.2 (C1), 136.3 (C2), 130.4, (C12‴), 130.1 (C6‴, C11‴), 129.8 (C9‴), 128.3 (C8‴), 128.2 (C5‴), 70.1 (C2″), 69.3 (C3″, C3), 62.7 (C1″), 34.4 (C2‴), 34.3 (C2′, C6′), 32.1 (C18‴), 29.8 (C14‴, C15‴), 29.7 (C5′), 29.6 (C16‴), 29.5 (C18‴), 29.4 (C8‴), 29.3 (C17‴), 29.2 (C4′), 27.4 (C4‴), 27.3 (C13‴), 25.8 (C7‴, C10‴), 25.1 (C3′, C3‴), 25.0 (C3′, C5′), 22.8 (C19‴), 14.2 (C20‴, CH3). See Figure 2 for COSY and HMBC correlation.
Compound 15: Yellowish powder; 1H-NMR (400 MHz in CD3OD): 7.00 (1H, d, J = 1.36 Hz, H2′), 6.88 (1H, d, J = 1.4 Hz, H5′), 6.87 (1H, s, H6″), 6.83 (1H, s, H5′), 6.75 (1H, s, H3′), 6.70 (1H, d, J = 8.23 Hz, H5″), 4.85 (1H, s, H1), 4.00 (1H, m, H2), 3.87 (3H, s, O-CH3, H7″), 3.67 (1H, dd, J = 2.29 and 12.24 Hz, H3a), 3.55 (2H, t, J = 6.48 Hz, H9″), 3.46 (1H, dd, J = 4.57 and 12.31 Hz, H3b), 2.58 (2H, t, J = 8 Hz, 2H, H7″), 1.79 (2H, dt, J = 6 and 14 Hz, H8″); 13C-NMR (100 MHz in CD3OD): 149.2 (C3′), 148.4 (C4′), 145.0 (C2″), 142.9 (C1″), 136.4 (C4″), 129.6 (C1′), 126.4 (C5′), 122.4 (C5″), 121.6 (C6′), 117.6 (C3″ and C6″), 111.9 (C2′), 80.0 (C2), 77.8 (C1), 62.2 (C3 and C9″), 56.4 (C7′, O-CH3) 35.6 (C8″), 32.4 (C7″).

4.5. In Vitro α-Glucosidase Inhibitory Activity Assay

Enzyme inhibition studies were carried out spectrophotometrically in a 96-well micro-plate reader using a procedure reported by Li et al. [47]. Acarbose was used as a positive control.

4.6. In Vitro PTP1B Inhibitory Activity Assay

The inhibitory activity of isolated compounds against truncated form of human recombinant PTP1B was evaluated using pNPP as a substrate [48]. The amount of p-nitrophenyl produced after enzymatic dephosphorylation of pNPP was estimated by measuring the absorbance at 405 nm using a micro-plate spectrophotometer (Molecular Devices, Sunnyvale, CA, USA). Ursolic acid was used as a positive control.

4.7. Kinetic Parameters of Active Compounds towards PTP1B Inhibition

The inhibition constant (Ki) and inhibition mode for the inhibition of PTP1B was calculated by the Lineweaver-Burk plot and its secondary plot of the slope and the y-intercept of compounds [49,50]. The kinetic parameters were obtained over various concentrations of substrate (0 to 2 mM) and inhibitors (0, 4.7, 23.3, and 116.6 µM for compound 6; 0, 2.5, 5, and 10 µM for compound 13; 0, 5, 10, 20, and 40 µM for compounds 22 and 23). Graphs were generated using SigmaPlot 12.0 (Systat Software Inc., San Jose, CA, USA).

4.8. PTP1B Molecular Docking Simulations

For docking studies, the crystal structure of the truncated form of PTP1B protein target (amino acid 1-282) was obtained from the RCSB Protein Data Bank (PDB) with the accession code 1T49 [42]. The co-crystallized ligand, 3-(3,5-dibromo-4-hydroxy-benzoyl)-2-ethyl- benzofuran-6-sulfonic acid (4-sulfamoyl-phenyl)-amide (compound B), was used to generate the grid box for allosteric inhibition mode, whereas the reported catalytic ligand, 3-({5-[(N-acetyl-3-{4-[(carboxycarbonyl)(2-carboxyphenyl)amino] -1-naphthyl}-L-alanyl)amino] pentyl}oxy)-2-naphthoic acid (compound A) (PDB ID: 1NNY), was used to generate the grid box for catalytic inhibition mode. The 3D structures of 5, 22, and 23 were downloaded from PubChem Compound (NCBI) with compound CIDs of 5281328, 12193680 and 10114, respectively. The 3D structures of 24R,28R epoxy-24-ethylcholesterol (6a), 24S,28R-epoxy-24-ethylcholesterol (6b), and 13 were generated by Chem3D pro (v12.0, Cambridge Soft Corporation, Cambridge, MA, USA). The structures of ligands were adjusted to neutral (pH 7.0) using MarvinSketch (ChemAxon, Budapest, Hungary) and minimized using Chem3D pro. The results were visualized and analyzed using UCSF Chimera (v1.13.1, http://www.cgl.ucsf.edu/chimera/), Discovery Studio (v16.1, Accelrys, San Diego, CA, USA), and Ligplot+ (v1.4.5, European Bioinformatics Institute, London, England).

4.9. Statistical Analysis

All experiments were carried out in triplicate and repeated on three separate days. All data are expressed as the mean ± standard deviation (SD) (n = 3).

Supplementary Materials

The following are available online at https://www.mdpi.com/1660-3397/17/5/302/s1, Figure S1: 13C (100MHz in CDCl3)- and 1H (400MHz in CDCl3)-NMR spectrum of compound 13, Figure S2: HMBC-NMR spectrum of compound 13, Figure S3: COSY-NMR spectrum of compound 13, Figure S4: HSQC-NMR spectrum of compound 13, Figure S5: HR-ESI-MS data of compound 13, Figure S6: FT-IR spectrum of compound 13. Figure S7: 13C (100MHz in CDCl3)- and 1H (400MHz in CDCl3)-NMR spectrum of compound 1. Figure S8: EI-MS data of compound 1. Figure S9: 13C (100MHz in CDCl3)- and 1H (400MHz in CDCl3)-NMR spectrum of compound 2. Figure S10: EI-MS data of compound 2. Figure S11: 13C (100MHz in CDCl3)- and 1H (400MHz in CDCl3)-NMR spectrum of compound 3. Figure S12: EI-MS data of compound 3. Figure S13: 13C (100MHz in CDCl3)- and 1H (400MHz in CDCl3)-NMR spectrum of compound 4. Figure S14: 13C (100MHz in CDCl3)- and 1H (400MHz in CDCl3)-NMR spectrum of compound 5. Figure S15: 13C (100MHz in CDCl3)- and 1H (400MHz in CDCl3)-NMR spectrum of compound 6. Figure S16: 13C (100MHz in CDCl3)- and 1H (400MHz in CDCl3)-NMR spectrum of compound 7. Figure S17: EI-MS data of compound 7. Figure S18: 13C (100MHz in CDCl3)- and 1H (400MHz in CDCl3)-NMR spectrum of compound 8. Figure S19: EI-MS data of compound 8. Figure S20: 13C (100MHz in CDCl3)- and 1H (400MHz in CDCl3)-NMR spectrum of compound 9. Figure S21: EI-MS data of compound 9. Figure S22: 13C (100MHz in CDCl3)- and 1H (400MHz in CDCl3)-NMR spectrum of compound 10. Figure S23: EI-MS data of compound 10. Figure S24: 13C (100MHz in CDCl3)- and 1H (400MHz in CDCl3)-NMR spectrum of compound 11. Figure S25: EI-MS data of compound 11. Figure S26: 13C (100MHz in CDCl3)- and 1H (400MHz in CDCl3)-NMR spectrum of compound 12. Figure S27: EI-MS data of compound 12. Figure S28: 13C (100MHz in CD3OD)- and 1H (400MHz in CD3OD)-NMR spectrum of compound 14. Figure S19: 13C (100MHz in CD3OD)- and 1H (400MHz in CD3OD)-NMR spectrum of compound 15. Figure S30: 13C (100MHz in CD3OD)- and 1H (400MHz in CD3OD)-NMR spectrum of compound 16. Figure S31: 13C (100MHz in CD3OD)- and 1H (400MHz in CD3OD)-NMR spectrum of compound 17. Figure S32: 13C (100MHz in CD3OD)- and 1H (400MHz in CD3OD)-NMR spectrum of compound 18. Figure S33: 13C (100MHz in CD3OD)- and 1H (400MHz in CD3OD)-NMR spectrum of compound 19. Figure S34: 13C (100MHz in CD3OD)- and 1H (400MHz in CD3OD)-NMR spectrum of compound 20. Figure S35: 13C (100MHz in CD3OD)- and 1H (400MHz in CD3OD)-NMR spectrum of compound 21. Table S1. Molecular weight and molecular formula of isolated compounds.

Author Contributions

Conceptualization, enzyme assay, molecular docking, and writing—original draft preparation, S.H.S.; isolation and structure-elucidation, D.H.N. and M.H.W.; writing—review and editing, A.W. and H.A.J.; supervision, J.S.C. All authors read and approved the final manuscript.

Funding

This research was supported by the Basic Science Research Program through the National Research Foundation of Korea (NRF) funded by the Ministry of Science (2012R1A6A1028677).

Conflicts of Interest

The authors declare no conflict of interest.

References

  1. World Health Organization. Diabetes Fact Sheet. Available online: https://www.who.int/news-room/fact-sheets/detail/diabetes (accessed on 28 December 2018).
  2. Sun, J.; Cu, C.; Wang, Y.; Huang, H.; Zhang, M.; Li, H.; Zhang, Y.; Wang, Y.; Zou, W. PTP1B, a potential target of type 2 diabetes mellitus. Mol. Biol. 2016, 5, 1–6. [Google Scholar] [CrossRef]
  3. Shim, Y.J.; Doo, H.K.; Ahn, S.Y.; Kim, Y.S.; Seong, J.K.; Park, I.S.; Min, B.H. Inhibitory effect of aqueous extract from the gall of Rhus chinensis on alpha-glucosidase activity and postprandial blood glucose. J. Ethnopharmacol. 2013, 85, 283–287. [Google Scholar] [CrossRef]
  4. Seong, S.H.; Roy, A.; Jung, H.A.; Jung, H.J.; Choi, J.S. Protein tyrosine phosphatase 1B and α-glucosidase inhibitory activities of Pueraria lobata root and its constituents. J. Ethnopharmacol. 2016, 194, 706–716. [Google Scholar] [CrossRef]
  5. Bischoff, H. The mechanism of alpha-glucosidase inhibition in the management of diabetes. Clin. Invest. Med. 1995, 18, 303–311. [Google Scholar] [PubMed]
  6. Dabhi, A.S.; Bhatt, N.R.; Shah, M.J. Voglibose: An alpha glucosidase inhibitor. J. Clin. Diagn. Res. 2013, 7, 3023–3027. [Google Scholar]
  7. Wubshet, S.G.; Tahtah, Y.; Heskes, A.M.; Kongstad, K.T.; Pateraki, I.; Hamberger, B.; Møller, B.M.; Staerk, D. Identification of PTP1B and α-glucosidase inhibitory serrulatanes from Eremophila spp. by combined use of dual high-resolution PTP1B and α-glucosidase inhibition profiling and HPLC-HRMS-SPE-NMR. J. Nat. Prod. 2016, 79, 1063–1072. [Google Scholar] [CrossRef] [PubMed]
  8. Johnson, T.O.; Ermolieff, J.; Jirousek, M.R. Protein tyrosine phosphatase 1B inhibitors for diabetes. Nat. Rev. Drug Discov. 2002, 1, 696. [Google Scholar] [CrossRef]
  9. Song, Y.H.; Uddin, Z.; Jin, Y.M.; Li, Z.; Curtis-Long, M.S.; Kim, K.D.; Cho, J.K.; Park, K.H. Inhibition of protein tyrosine phosphatase (PTP1B) and α-glucosidase by geranylated flavonoids from Paulownia tomentosa. J. Enzyme Inhib. Med. Chem. 2017, 32, 1195–1202. [Google Scholar] [CrossRef]
  10. Ha, M.T.; Seong, S.H.; Nguyen, T.D.; Cho, W.K.; Ah, K.J.; Ma, J.Y.; Woo, M.H.; Choi, J.S.; Min, B.S. Chalcone derivatives from the root bark of Morus alba L. act as inhibitors of PTP1B and α-glucosidase. Phytochemistry 2018, 155, 114–125. [Google Scholar] [CrossRef]
  11. Ali, M.Y.; Kim, D.H.; Seong, S.H.; Kim, H.-R.; Jung, H.A.; Choi, J.S. α-Glucosidase and protein tyrosine phosphatase 1B inhibitory activity of plastoquinones from marine brown alga Sargassum serratifolium. Mar. Drugs 2017, 15, 368. [Google Scholar] [CrossRef]
  12. Ezzat, S.M.; Bishbishy, M.H.E.; Habtemariam, S.; Salehi, B.; Sharifi-Rad, M.; Martins, N.; Sharifi-Rad, J. Looking at marine-derived bioactive molecules as upcoming anti-diabetic agents: A special emphasis on PTP1B inhibitors. Molecules 2018, 23, 3334. [Google Scholar] [CrossRef]
  13. Ma, Z.; Wu, M.; Lin, L.; Thring, R.W.; Yu, H.; Zhang, X.; Zhao, M. Allelopathic interactions between the macroalga Hizikia fusiformis (Harvey) and the harmful blooms-forming dinoflagellate Karenia mikimotoi. Harmful Algae 2017, 65, 19–26. [Google Scholar] [CrossRef]
  14. Karawita, R.; Siriwardhana, N.; Lee, K.W.; Heo, M.S.; Yeo, I.K.; Lee, Y.D.; Jeon, Y.J. Reactive oxygen species scavenging, metal chelating, reducing power and lipid peroxidation inhibition properties of different solvent fractions from Hizikia fusiformis. Eur. Food Res. Technol. 2005, 220, 363–371. [Google Scholar] [CrossRef]
  15. Han, Y.R.; Ali, M.Y.; Woo, M.H.; Jung, H.A.; Choi, J.S. Anti-diabetic and anti-inflammatory potential of the edible brown alga Hizikia fusiformis. J. Food Biochem. 2015, 39, 417–428. [Google Scholar] [CrossRef]
  16. Wagle, A.; Seong, S.H.; Zhao, B.T.; Woo, M.H.; Jung, H.A.; Choi, J.S. Comparative study of selective in vitro and in silico BACE1 inhibitory potential of glycyrrhizin together with its metabolites, 18α- and 18β-glycyrrhetinic acid, isolated from Hizikia fusiformis. Arch. Pharm. Res. 2018, 41, 409–418. [Google Scholar] [CrossRef]
  17. Choi, E.Y.; Hwang, H.J.; Nam, T.J. Protective effect of a polysaccharide from Hizikia fusiformis against ethanol-induced cytotoxicity in IEC-6 cells. Toxicol. In Vitro 2010, 24, 79–84. [Google Scholar] [CrossRef] [PubMed]
  18. Kang, S.Y.; Kim, E.; Kang, I.; Lee, M.; Lee, Y. Anti-diabetic effects and anti-inflammatory effects of Laminaria japonica and Hizikia fusiforme in skeletal muscle: in vitro and in vivo model. Nutrients 2018, 10, 491. [Google Scholar] [CrossRef]
  19. Hwang, H.J.; Kim, I.H.; Nam, T.J. Effect of a glycoprotein from Hizikia fusiformis on acetaminophen-induced liver injury. Food Chem. Toxicol. 2008, 46, 3475–3481. [Google Scholar] [CrossRef] [PubMed]
  20. Jang, M.S.; Park, H.Y.; Nam, K.H. Whitening effects of 4-hydroxyphenethyl alcohol isolated from water boiled with Hizikia fusiformis. Food Sci. Biotechnol. 2014, 23, 555–560. [Google Scholar] [CrossRef]
  21. Zhao, B.T.; Nguyen, D.H.; Le, D.D.; Choi, J.S.; Min, B.S.; Woo, M.H. Protein tyrosine phosphatase 1B inhibitors from natural sources. Arch. Pharm. Res. 2018, 41, 130–161. [Google Scholar] [CrossRef] [PubMed]
  22. Fang, Z.; Jeong, S.Y.; Jung, H.A.; Choi, J.S.; Min, B.S.; Woo, M.H. Capsofulvesins A–C, cholinesterase inhibitors from Capsosiphon fulvescens. Chem. Pharm. Bull. 2012, 60, 1351–1358. [Google Scholar] [CrossRef] [PubMed]
  23. Gunstone, F.D.; Pollard, M.R.; Scrimgeour, C.M.; Vedanayagam, H.S. 13C nuclear magnetic resonance studies of olefinic fatty acids and esters. Chem. Phys. Lipids 1977, 18, 115–129. [Google Scholar] [CrossRef]
  24. Jagannathan, N.R.; Rao, C.N.R. A 13C NMR spectroscopic study of the phase transitions of alkane dicarboxylic acids in the solid state. Chem. Phys. Lett. 1987, 140, 46–50. [Google Scholar] [CrossRef]
  25. Huh, G.W.; Lee, D.Y.; In, S.J.; Lee, D.G.; Park, S.Y.; Yi, T.H.; Kang, H.C.; Seo, W.D.; Baek, N.I. Fucosterols from Hizikia fusiformis and their proliferation activities on osteosarcoma-derived cell MG63. J. Korean Soc. Appl. Biol. Chem. 2012, 55, 551–555. [Google Scholar] [CrossRef]
  26. Catalan, C.A.N.; Kokke, W.C.M.C.; Duque, C.; Djerassi, C. Synthesis of (24R)- and (24S)-5,28-stigmastadien-3β-ol and determination of the stereochemistry of their 24-hydroxy analogs, the saringosterols. J. Org. Chem. 1983, 48, 5207–5214. [Google Scholar] [CrossRef]
  27. Manners, G.D.; Penn, D.D.; Jurd, L.; James, L.F. Chemistry of toxic range plants. Water-soluble lignols of Ponderosa pine needles. J. Agric. Food Chem. 1982, 30, 401–404. [Google Scholar] [CrossRef]
  28. Agrawal, P.K.; Rastogi, R.P.; Osterdahl, B.G. 13C NMR spectral analysis of dihydrobenzofuran lignans. Org. Magn. Reson. 1983, 21, 119–121. [Google Scholar] [CrossRef]
  29. Seigler, D.S.; Pauli, G.F.; Nahrstedt, A.; Leen, R. Cyanogenic allosides and glucosides from Passiflora edulis and Carica papaya. Phytochemistry 2002, 60, 873–882. [Google Scholar] [CrossRef]
  30. Hoang, L.S.; Tran, M.H.; Nguyen, V.T.; Ngo, Q.M.T.; Lee, J.S.; Rho, S.S.; Kim, J.A.; Lee, J.H.; Woo, M.H.; Min, B.S. Isolation of a new homomonoterpene from Madhuca pasquieri and effect of isolated compounds on NO production. Nat. Prod. Commun. 2016, 11, 729–732. [Google Scholar] [CrossRef]
  31. Farag, M.A.; Porzel, A.; Wessjohann, L.A. Comparative metabolite profiling and fingerprinting of medicinal licorice roots using a multiplex approach of GC-MS, LC-MS and 1D NMR techniques. Phytochemistry 2012, 76, 60–72. [Google Scholar] [CrossRef]
  32. Zheng, Y.F.; Qi, L.W.; Cui, X.B.; Peng, G.P.; Peng, Y.B.; Ren, M.T.; Cheng, X.L.; Li, P. Oleanane-type triterpene glucuronides from the roots of Glycyrrhiza uralensis. Fischer. Planta Med. 2010, 76, 1457–1463. [Google Scholar] [CrossRef]
  33. Doi, Y.; Ishibashi, M.; Yamaguchi, N.; Kobayashi, J. Isolation of apo-9′-fucoxanthinone from the cultured marine dinoflagellate Amphidinium sp. J. Nat. Prod. 1995, 58, 1097–1099. [Google Scholar] [CrossRef]
  34. Darr, A.; Calabro, A. Synthesis and characterization of tyramine-based hyaluronan hydrogels. J. Mater. Sci. Mater. Med. 2009, 20, 33–44. [Google Scholar] [CrossRef] [PubMed]
  35. Krishnan, N.; Konidaris, K.F.; Gasser, G.; Tonks, N.K. A potent, selective and orally bioavailable inhibitor of the protein tyrosine phosphatase PTP1B improves insulin and leptin signaling in animal models. J. Biol. Chem. 2018, 293, 1517–1525. [Google Scholar] [CrossRef]
  36. Maheswari, N.; Karthikeyan, C.; Trivedi, P.; Moorthy, N.S. Recent advances in protein tyrosine phosphatase 1B targeted drug discovery for type II diabetes and obesity. Curr. Drug Targets 2018, 19, 551–575. [Google Scholar] [CrossRef]
  37. Okano, M.; Fukamiya, N.; Fujita, T.; Matsumoto, H.; Aratani, T. Constituents of marine algae VIII. Non polar constituents of Hizikia fusiformis (Harvey) Okamura. Bull. Jpn. Soc. Sci. Fish. 1985, 51, 1305–1310. [Google Scholar] [CrossRef]
  38. Shibata, E.; Kanno, T.; Tsuchiya, A.; Kuribayashi, K.; Tabata, C.; Nakano, T.; Nishizaki, T. Free fatty acids inhibit protein tyrosine phosphatase 1B and activate Akt. Cell. Physiol. Biochem. 2013, 32, 871–879. [Google Scholar] [CrossRef]
  39. Hunnicutt, J.W.; Hardy, R.W.; Williford, J.; McDonald, J.M. Saturated fatty acid-induced insulin resistance in rat adipocytes. Diabetes 1994, 43, 540–545. [Google Scholar] [CrossRef]
  40. Lee, Y.S.; Shin, K.H.; Kim, B.K.; Lee, S. Anti-diabetic activities of fucosterol from Pelvetia siliquosa. Arch. Pharm. Res. 2004, 27, 1120–1122. [Google Scholar] [CrossRef]
  41. Jung, H.A.; Bharkta, H.K.; Min, B.S.; Choi, J.S. Fucosterol activates the insulin signaling pathway in insulin resistant HepG2 cells via inhibiting PTP1B. Arch. Pharm. Res. 2016, 39, 1454–1464. [Google Scholar] [CrossRef]
  42. Wiesmann, C.; Barr, K.J.; Kung, J.; Zhu, J.; Erlanson, D.A.; Shen, W.; Fahr, B.J.; Zhong, M.; Taylor, L.; Randal, M.; McDowell, R.S.; Hansen, S.K. Allosteric inhibition of protein tyrosine phosphatase 1B. Nat. Struct. Mol. Biol. 2004, 11, 730–737. [Google Scholar] [CrossRef]
  43. Na, M.K.; Cui, L.; Min, B.S.; Bae, K.H.; Yoo, J.K.; Kim, B.Y.; Oh, W.K.; Ahn, J.S. Protein tyrosine phosphatase 1B inhibitory activity of triterpenes isolated from Astilbe koreana. Bioorg. Med. Chem. Lett. 2006, 16, 3273–3276. [Google Scholar] [CrossRef] [PubMed]
  44. Akao, T.; Hattori, M.; Kanaoka, M.; Yamamoto, K.; Namba, T.; Kobashi, K. Hydrolysis of glycyrrhizin to 18β-glycyrrhetyl monoglucuronide by lysosomal β-d-glucuronidase of animal livers. Biochem. Pharmacol. 1991, 41, 1025–1029. [Google Scholar] [CrossRef]
  45. Takeda, S.; Ishihara, K.; Wakui, Y.; Amagaya, S.; Maruno, M.; Akao, T.; Kobashi, K. Bioavailability study of glycyrrhetic acid after oral administration of glycyrrhizin in rats; relevance to the intestinal bacterial hydrolysis. J. Pharm. Pharmacol. 1996, 48, 902–905. [Google Scholar] [CrossRef] [PubMed]
  46. Villorbina, G.; Roura, L.; Camps, F.; Joglar, J.; Fabriàs, G. Enzymatic desaturation of fatty acids: Δ11 desaturase activity on cyclopropane acid probes. J. Org. Chem. 2003, 68, 2820–2829. [Google Scholar] [CrossRef]
  47. Li, T.; Zhzng, X.D.; Song, Y.W.; Liu, W.A. A microplate based screening method for a-glucosidase inhibitors. Chin. J. Clin. Pharmacol. Ther. 2005, 10, 1128–1134. [Google Scholar]
  48. Cui, L.; Na, M.; Oh, H.; Bae, E.Y.; Jeong, D.G.; Ryu, S.E.; Kim, S.; Kim, B.Y.; Oh, W.K.; Ahn, J.S. Protein tyrosine phosphatase 1B inhibitors from Morus root bark. Bioorg. Med. Chem. Lett. 2006, 16, 1426–1429. [Google Scholar] [CrossRef] [PubMed]
  49. Lineweaver, H.; Burk, D. The determination of enzyme dissociation constants. J. Am. Chem. Soc. 1934, 56, 658–666. [Google Scholar] [CrossRef]
  50. Seong, S.H.; Ha, M.T.; Min, B.S.; Jung, H.A.; Choi, J.S. Moracin derivatives from Morus Radix as dual BACE1 and cholinesterase inhibitors with antioxidant and anti-glycation capacities. Life Sci. 2018, 210, 20–28. [Google Scholar] [CrossRef]
Figure 1. Structures of compounds isolated from Hizikia fusiformis and 18α and 18β-glycyrrhetinic acids.
Marinedrugs 17 00302 g001
Figure 2. The key 2D NMR correlations for compound 13.
Marinedrugs 17 00302 g002
Figure 3. Enzyme kinetic analysis of compounds 6 (A), 13 (B), 22 (C), and 23 (D) using Lineweaver-Burk plots and its secondary plots (1/Vmax,app (Y-intercept) and Km,app/Vmax,app (slope) of the respective linear regression of Lineweaver-Burk plot).
Marinedrugs 17 00302 g003
Figure 4. Best docked models of compounds from H. fusiformis in the catalytic (A and C) and allosteric (A and B) pocket of PTP1B (1T49) along with positive ligands, compounds A (red line) and B (black line). Fucosterol (5), 24R,28R-epoxy-24-ethylcholesterol (6a), 24S,28R-epoxy-24-ethylcholesterol (6b), compound 13, and 18α and 18β-glycyrrhetinic acids (22 and 23) are shown as pink, yellow, green, blue, cyan, and purple stick, respectively. The residues forming inter H-bond with the ligands are shown as blue dotted lines. Hydrophobic interactions between Pro188 residue and compounds are shown as black lines.
Marinedrugs 17 00302 g004
Figure 5. Detailed binding interactions visualized by docking simulation for the compounds 5 (A), 6a (B), 6b (C), 13 (D), 22 (E), and 23 (F).
Marinedrugs 17 00302 g005
Table 1. PTP1B and α-glucosidase inhibitory activity of compounds isolated from Hizikia fusiformis.
CompoundsIC50 (μM) aEnzyme Kinetics
PTP1Bα-Glucosidase Ki (μM) bInhibition Type c
16.59 ± 0.0948.05 ± 3.37
249.39 ± 1.3993.63 ± 3.68
313.65 ± 0.49113.44 ± 2.47
4> 150> 150
550.58 ± 1.86> 150
616.70 ± 0.36> 15024.43Non-competitive
74.86 ± 1.36> 200
813.58 ± 0.10111.51 ± 1.44
910.68 ± 0.1734.85 ± 2.39
1016.43 ± 0.07> 200
11NTNT
1211.51 ± 0.5243.90 ± 0.77
134.92 ± 0.01> 1504.13Non-competitive
14174.19 ± 5.44133.84 ± 3.86
15>400> 250
16>400> 250
17>400> 300
18110.33 ± 0.39> 150
1949.39 ± 1.39> 150
20323.21 ± 0.84> 250
21188.06 ± 3.21273.23 ± 5.65
2210.40 ± 0.75113.30 ± 0.703.17Competitive
2326.07 ± 0.59128.72 ± 3.8816.23Competitive
Ursolic acid d7.31 ± 0.16
Acarbose d158.41 ± 1.05
a The IC50 values (μM) were calculated from a log dose inhibition curve and are expressed as mean ± SD of triplicate experiments. b PTP1B inhibition constants (μM) of tested compounds determined using secondary plot of the slopes and y-intercept of each linear regression of Lineweaver-Burk plot c PTP1B inhibition types of tested compounds determined using Lineweaver–Burk plots. d Positive controls. NT Not tested due to low solubility in 10% dimethyl sulfoxide (DMSO). (‒) Not tested.
Table 2. Molecular interaction residues and binding energy (B-Score) of compounds from Hizikia fusiformis as well as reported inhibitors against PTP1B (PDB ID: 1T49).
CompoundsB-Score (kcal/mol)H-Bonds Interacting ResiduesHydrophobic Interacting Residues
5−8.10Glu200 Leu192, Asn193, Glu276, Gly277, Lys279, Phe196, Phe280
6a (24R and 28R)−7.90Glu200 Pro188, Ala189, Leu192, Asn193, Glu276, Phe196, Phe280
6b (24S and 28R)−8.66Glu200Pro188, Ala189, Leu192, Asn193, Phe196, Glu276, Gly277, Lys279, Phe280
13−5.03Lys150, Tyr153, Asn193, Lys197Lys150, Ser151, Tyr152, Tyr153, Ala189, Pro188, Leu272, Ser187, Glu276, Leu192, Asn193, Lys197, Phe280
22−9.09Lys116, Lys120 (Salt bridge)Lys120, Phe182, Gly183, Asp265, Thr263, Glu115, Arg221
23−8.81Asp48, Lys116 (Salt bridge), Gly183Tyr46, Val49, Ala217, Gln262, Phe182
Standard A a−11.23Arg24, Tyr46, Asp48, Ser216, Ala217, Arg221, Arg254, Gln262Ser28, Val49, Lys116, Lys120, Cys215, Ile219, Gly220, Met258, Gly259
Standard B a−10.98Asn193, Glu276Ala189, Leu192, Phe196, Gly277, Lys279, Phe280, Ile281, Met282
a Standard A (3-({5-[(N-acetyl-3-{4-[(carboxycarbonyl)(2-carboxyphenyl)amino]-1-naphthyl}-L-alanyl)amino] pentyl}oxy)-2-naphthoic acid) and B (3-(3,5-dibromo-4-hydroxy-benzoyl)-2-ethyl-benzofuran-6-sulfonic acid (4-sulfamoyl-phenyl)-amide) are positive catalytic and allosteric compounds for docking simulation, respectively.

