Article

Determination of the μ-Conotoxin PIIIA Specificity Against Voltage-Gated Sodium Channels from Binding Energy Calculations

1
Key Laboratory of Marine Drugs, Chinese Ministry of Education, School of Medicine and Pharmacy, Ocean University of China, Qingdao 266003, China
2
Laboratory for Marine Drugs and Bioproducts, Qingdao National Laboratory for Marine Science and Technology, Qingdao 266003, China
*
Author to whom correspondence should be addressed.
Mar. Drugs 2018, 16(5), 153; https://doi.org/10.3390/md16050153
Submission received: 30 March 2018 / Revised: 25 April 2018 / Accepted: 28 April 2018 / Published: 7 May 2018

Abstract

:
Voltage-gated sodium (NaV) channels generate and propagate action potentials in excitable cells, and several NaV subtypes have become important targets for pain management. The μ-conotoxins inhibit subtypes of the NaV with varied specificity but often lack of specificity to interested subtypes. Engineering the selectivity of the μ-conotoxins presents considerable complexity and challenge, as it involves the optimization of their binding affinities to multiple highly conserved NaV subtypes. In this study, a model of NaV1.4 bound with μ-conotoxin PIIIA complex was constructed using homology modeling, docking, molecular dynamic simulations and binding energy calculations. The accuracy of this model was confirmed based on the experimental mutagenesis data. The complex models of PIIIA bound with varied subtypes of NaV1.x (x = 1, 2, 3, 5, 6, 7, 8, or 9) were built using NaV1.4/PIIIA complex as a template, and refined using molecular dynamic simulations. The binding affinities of PIIIA to varied subtypes of NaV1.x (x = 1 to 9) were calculated using the Molecular Mechanics Generalized Born/Surface Area (MMGB/SA) and umbrella sampling, and were compared with the experimental values. The binding affinities calculated using MMGB/SA and umbrella sampling are correlated with the experimental values, with the former and the latter giving correlation coefficient of 0.41 (R2) and 0.68 (R2), respectively. Binding energy decomposition suggests that conserved and nonconserved residues among varied NaV subtypes have a synergistic effect on the selectivity of PIIIA.

Graphical Abstract

1. Introduction

The μ-conotoxins are short snail peptide toxins specifically targeting subtypes of NaV and are considered as important drug leads. The first step for engineering the specificity of μ-conotoxins is understanding of the molecular interaction mechanism between the μ-conotoxins and varied subtypes of the NaV. Accurate determination of the molecular determinants that confer the specificity of the μ-conotoxin PIIIA to different NaV subtypes is essential for further engineering the specificity of the μ-conotoxins for therapeutic purposes.

1.1. Function of NaV

Voltage-gated sodium (NaV) channels play important roles in cell excitability and mediation of the ionic conductance through the cells [1,2,3]. Members of the NaV channel family are classified as NaV1.1–1.9 according to the α subunit sequences [4]. Different NaV subtypes usually distribute in different areas and have distinctive functions. NaV1.1, 1.2, 1.3 and 1.6 mainly exist in the central and peripheral nervous systems, while the NaV1.7, 1.8 and 1.9 are wildly distributed in peripheral sensory neurons [5,6]. The NaV1.4 is mainly existing in skeletal muscle [5,6], and NaV1.5 is essentially distributed in the cardiac muscle [5,6]. The NaV1.7, 1.8 and 1.9 are associated with neuropathic pain, and are considered as promising analgesic targets with a minimal side effect profile [5,6].

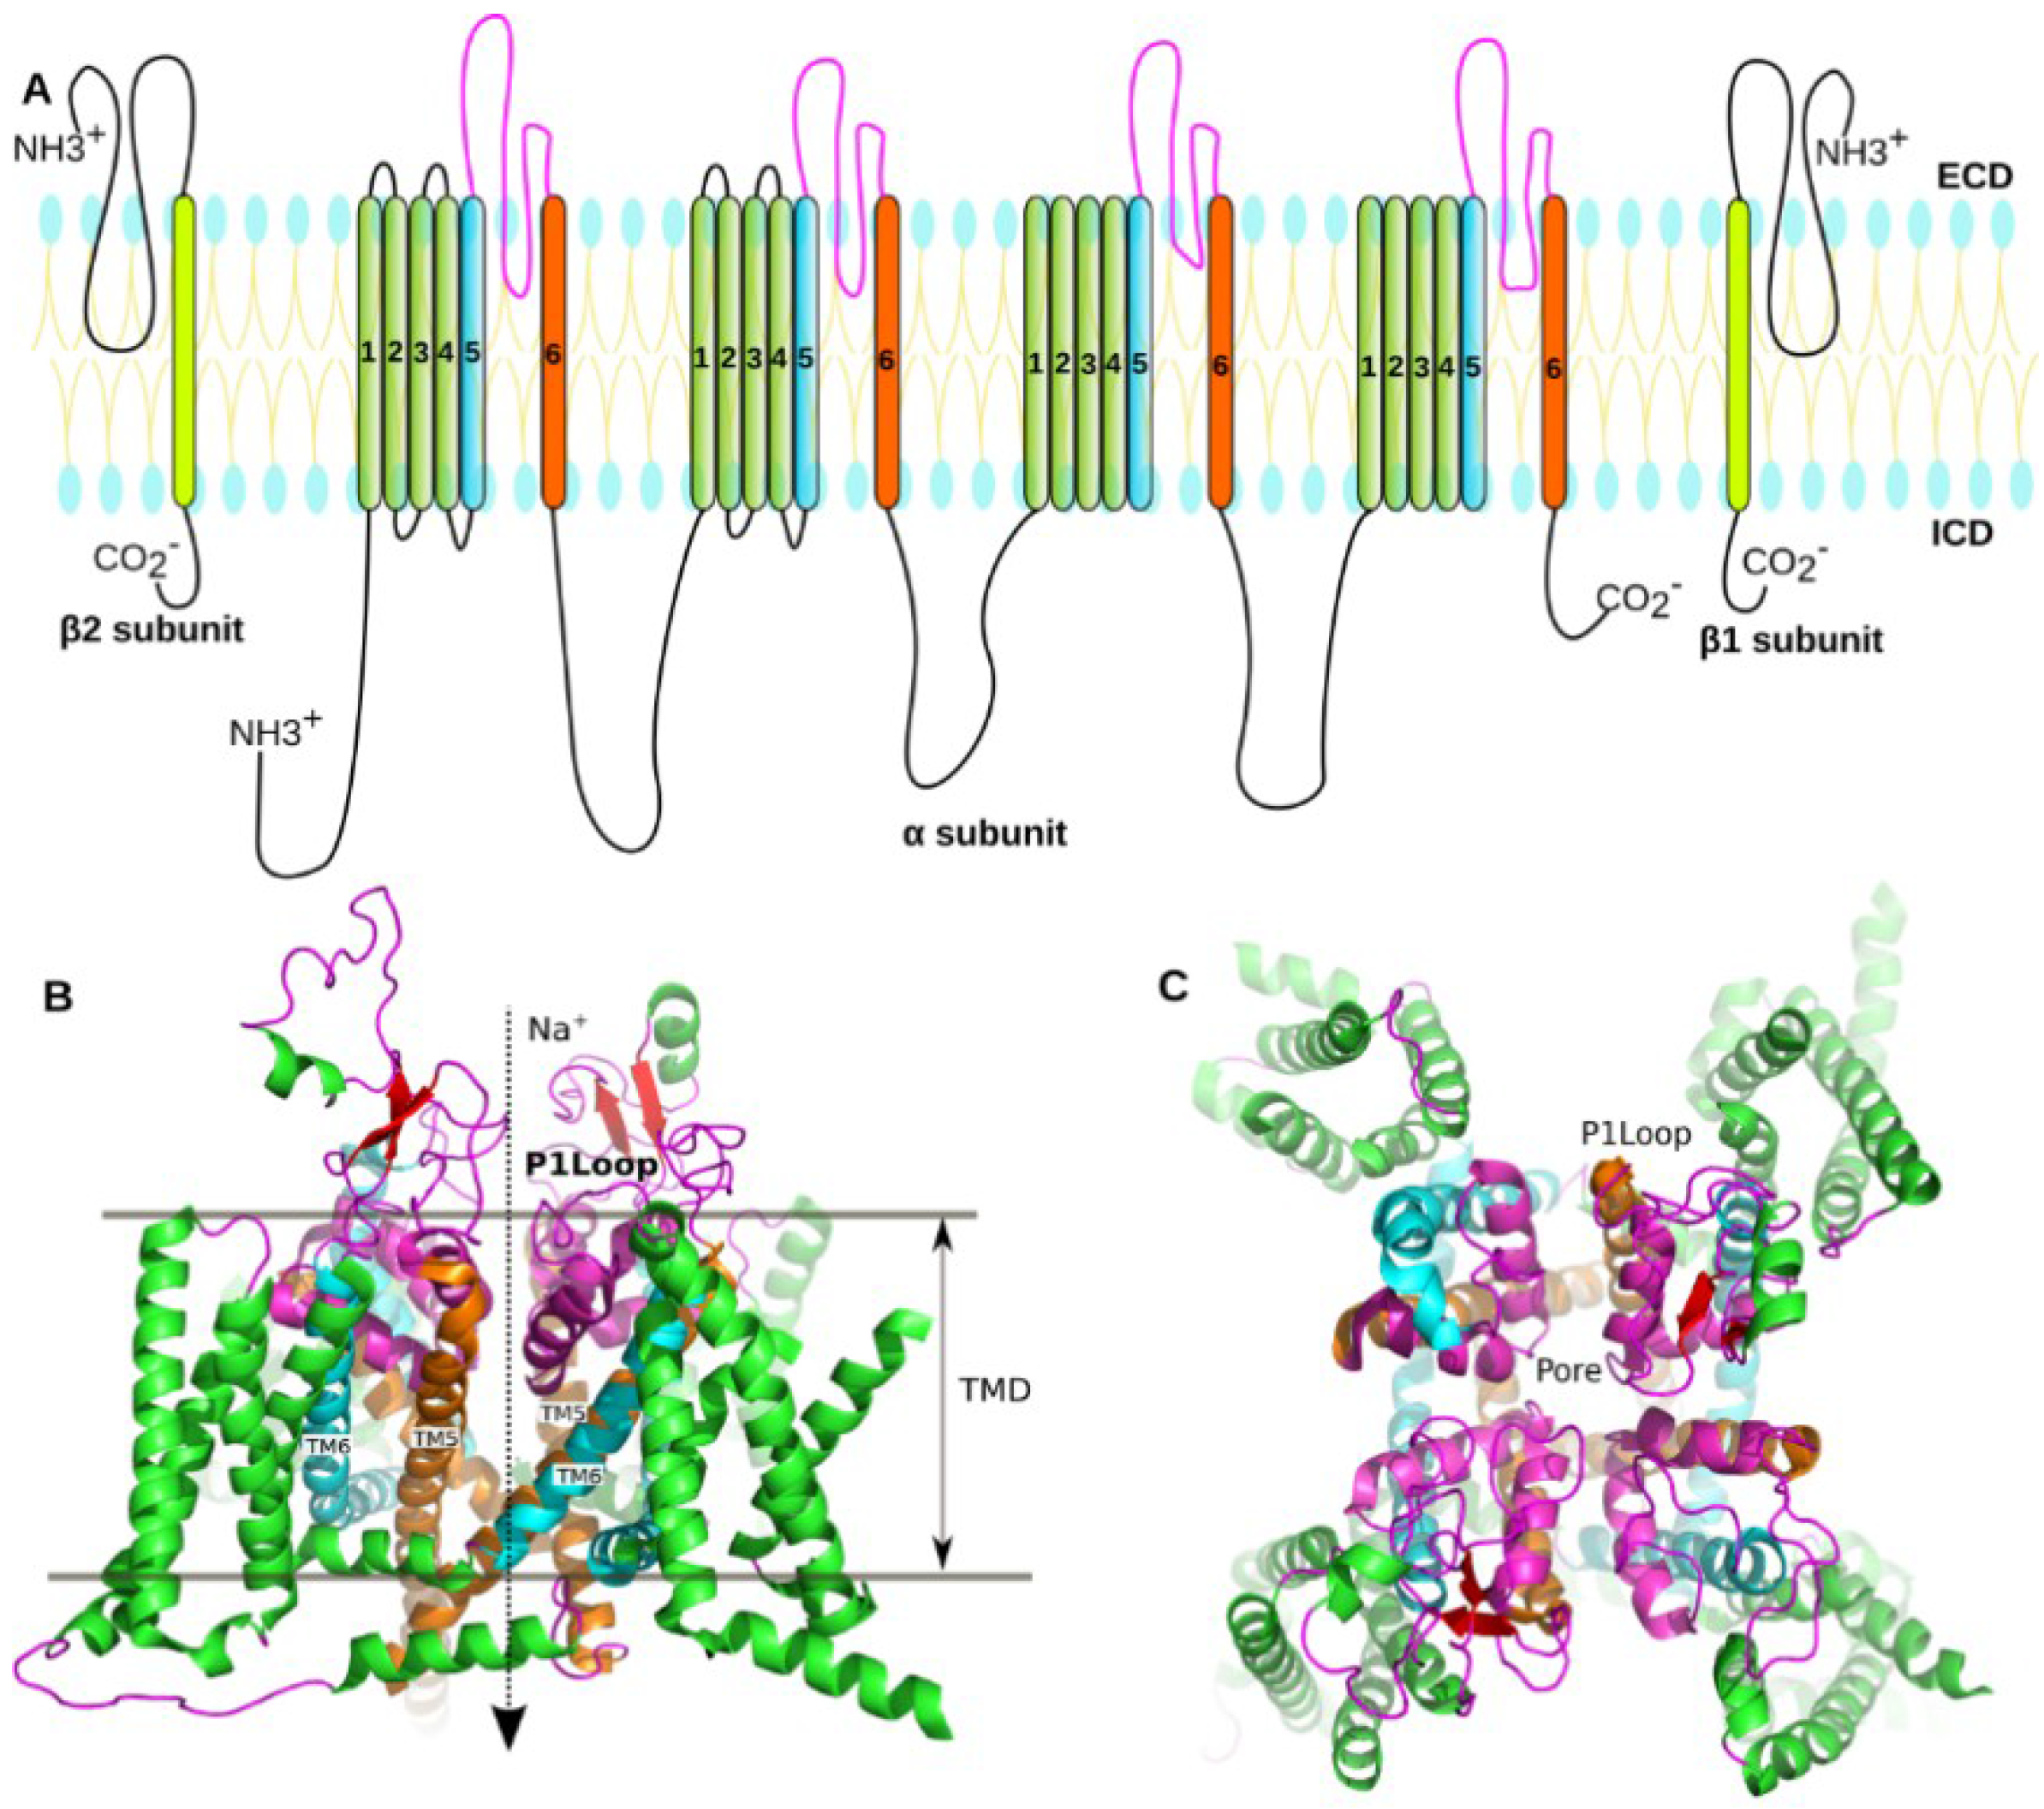
1.2. Structure of the NaV
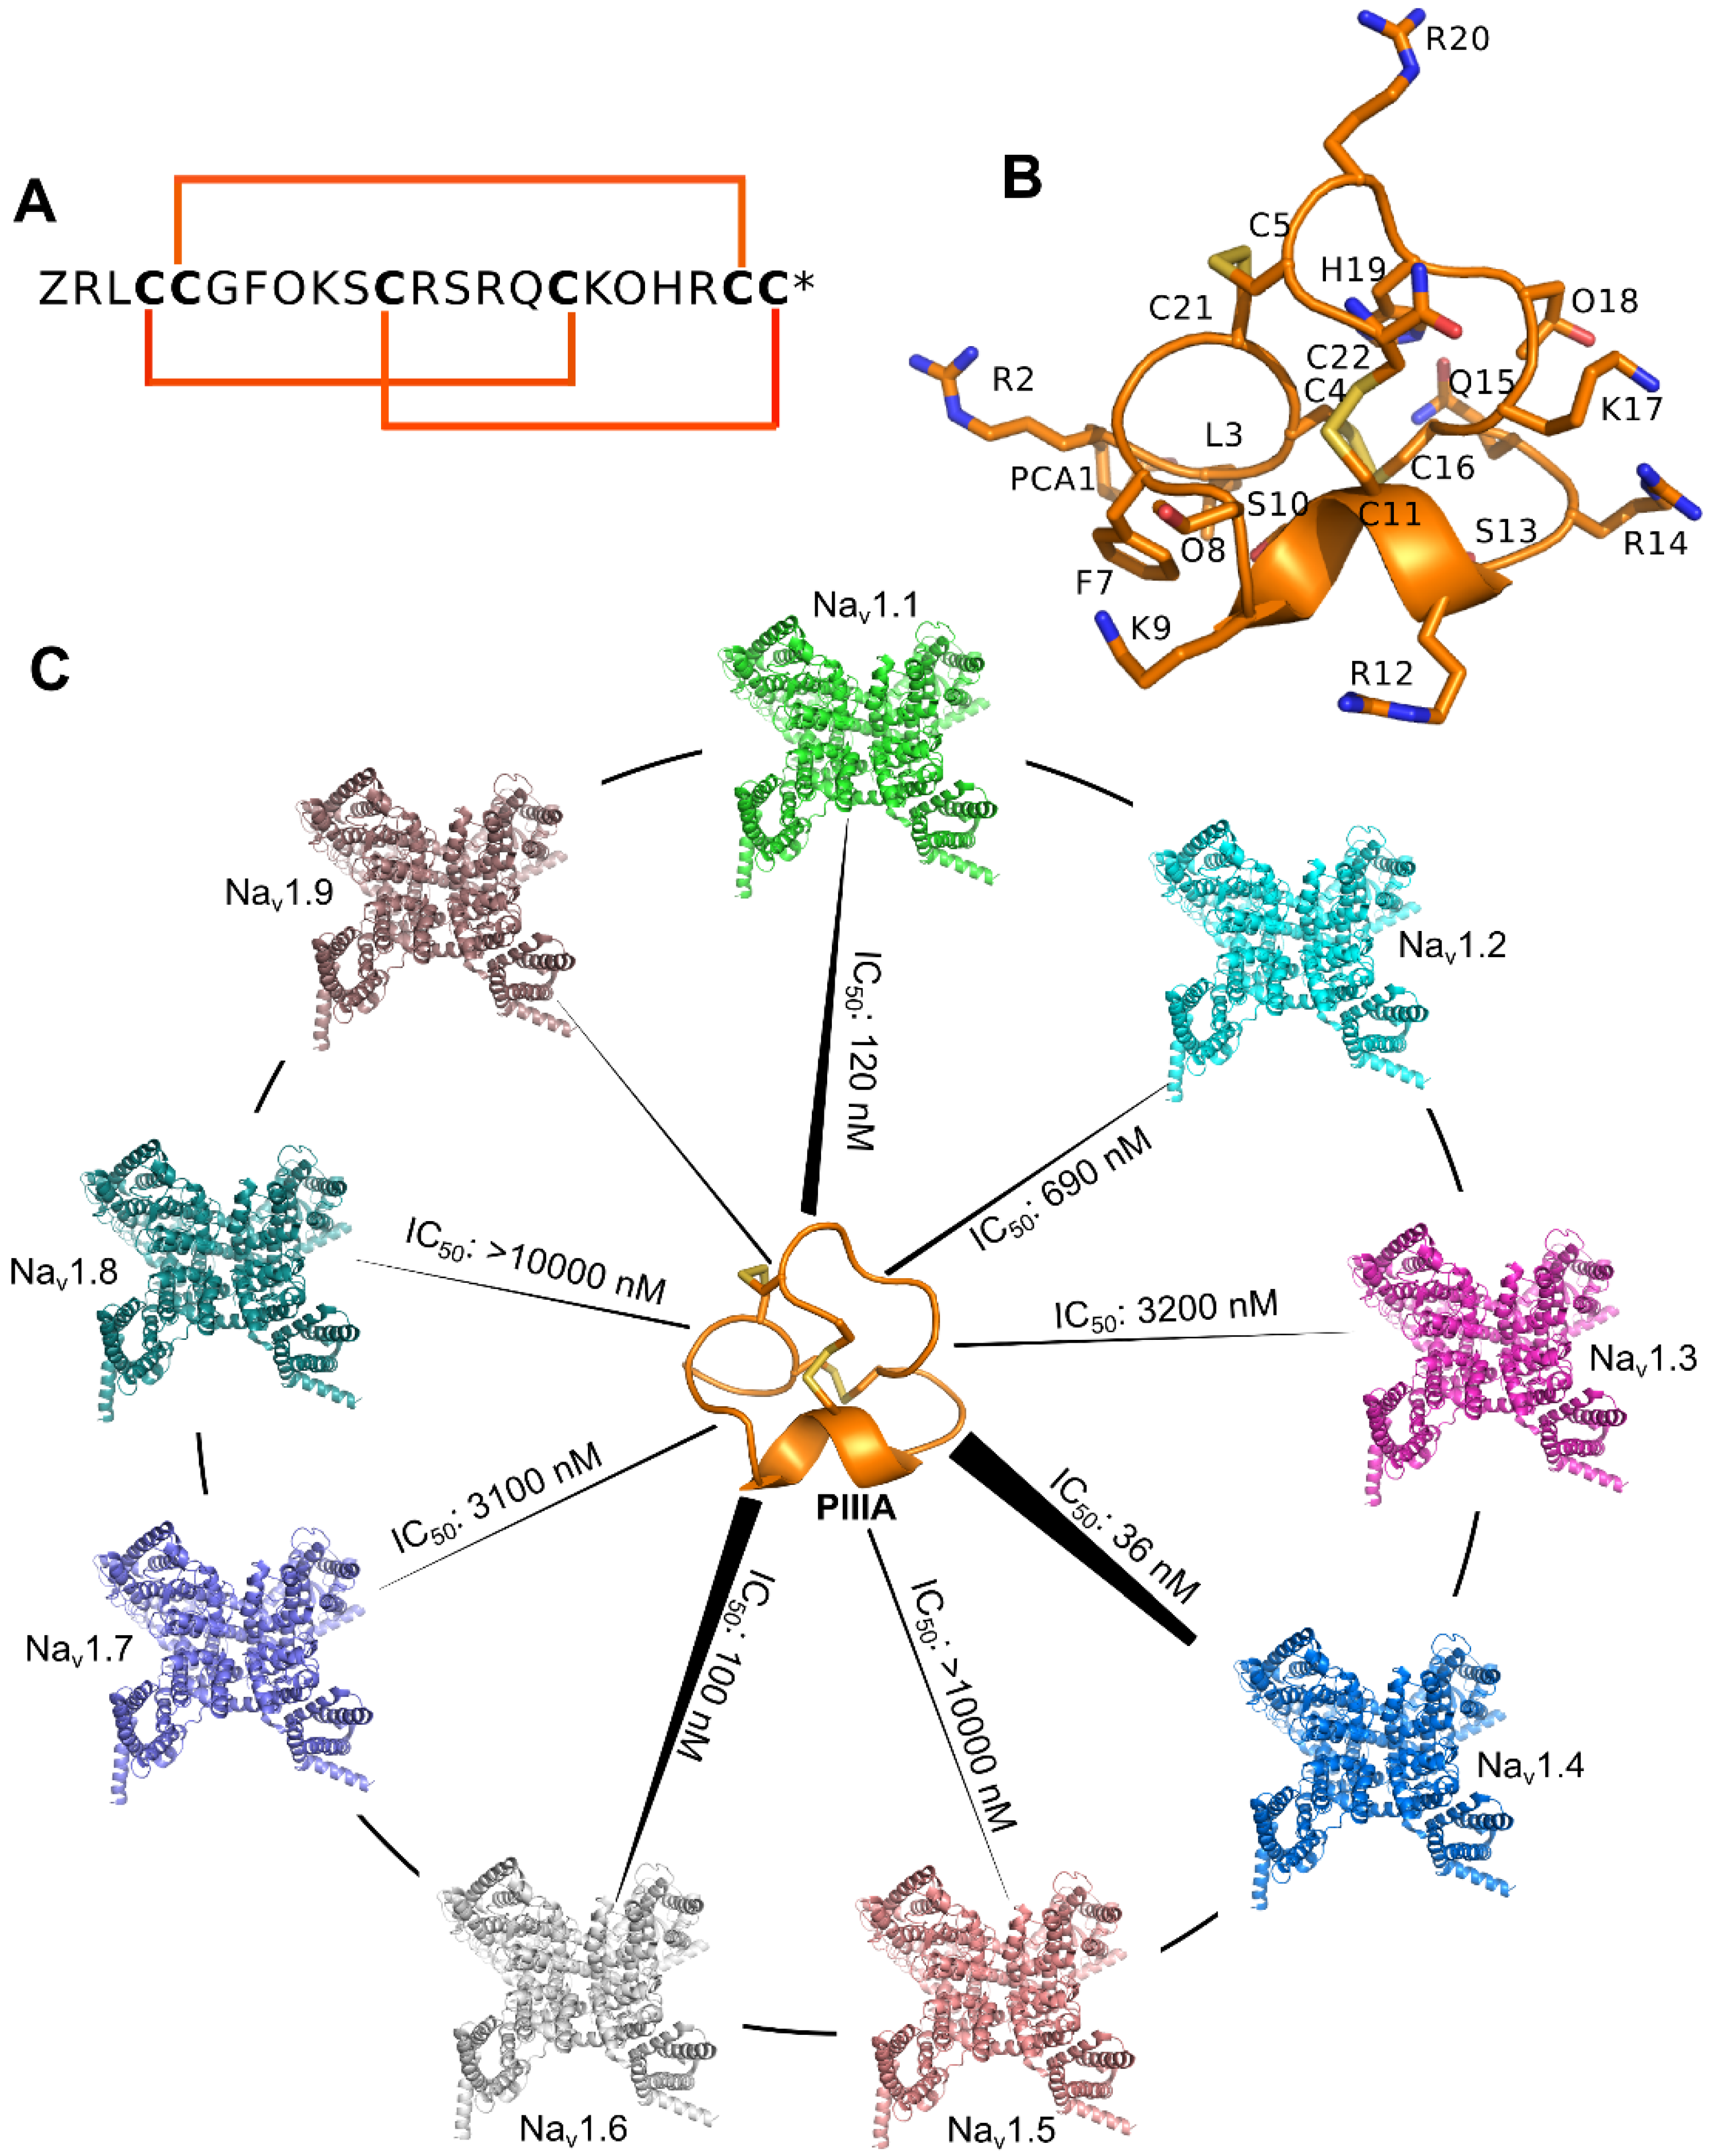
The eukaryotic NaV channels comprise a pore-forming α subunit and one or two β subunits (Figure 1A). The α-subunit controls sodium ion selection, voltage sensing and inactivation, while the β subunit that includes an N-terminal extracellular immunoglobulin-like fold, a transmembrane segment, and intracellular fragments that help regulate channel dynamics, such as activation and inactivation of voltage dependence. The α subunit is a single chain with about 260 kDa in size, and it folds into four homologous repeats (domains I to IV), each containing six transmembrane segments, S1 to S6 (Figure 1). The central pore of NaV is enclosed by S5 and S6 segments, and the selectivity filter (SF) of the pore is constituted of the intervening sequences of S5 and S6 (Figure 1B,C). The cryogenic electron microscopy (cryo-EM) structure of a putative NaV channel from American cockroach (designated NaVPaS) at 3.8 angstrom resolution [7] (Figure 1B) as well as the cryo-electron microscopy (cryo-EM) structure of Ee NaV1.4 from the electric eel [8] give more detailed description of the structure composition of the NaV channels.

1.3. Conotoxins

Conotoxins are short disulfide-rich peptide toxins comprising 12–30 amino acid residues and possess varied selectivity on ion channels [9]. μ-Conotoxins are selective and active blockers of the voltage-gated sodium channels. The μ-conotoxin PIIIA was isolated from Conus purpurascens, an Eastern Pacific fish hunting species of cone snails [10]. The PIIIA possesses varied potency towards TTX sensitive NaV channels [11,12], and therefore the PIIIA serves as a valuable probe to distinguish NaV channel subtypes when used in conjunction with other selective toxins [11,13] (Figure 2).
Without the high-resolution crystal structure of the eukaryotic voltage-gated sodium channel, crystal structures of the prokaryotic sodium channel NaVAb have been widely used as templates to model the interactions between μ-conotoxins and NaV1.4 [14,15]. These models were used to predict the binding affinities of μ-conotoxins against NaV1.4, and explained their interaction mechanism [14,15]. However, the molecular determinants that confer the specificity of the μ-conotoxins to varied NaV subtypes are still elusive, and no effective computational methodologies are available to predict the specificity of the μ-conotoxins.
In this study, the molecular determinants that confer the specificity of PIIIA to varied subtypes (hNaV1.1–1.9) of the NaV were determined through extensive molecular dynamics simulations and binding energy calculations. And a computational method that could be used to predict the specificity of the μ-conotoxin PIIIA against different NaV subtypes was proposed.

2. Methods

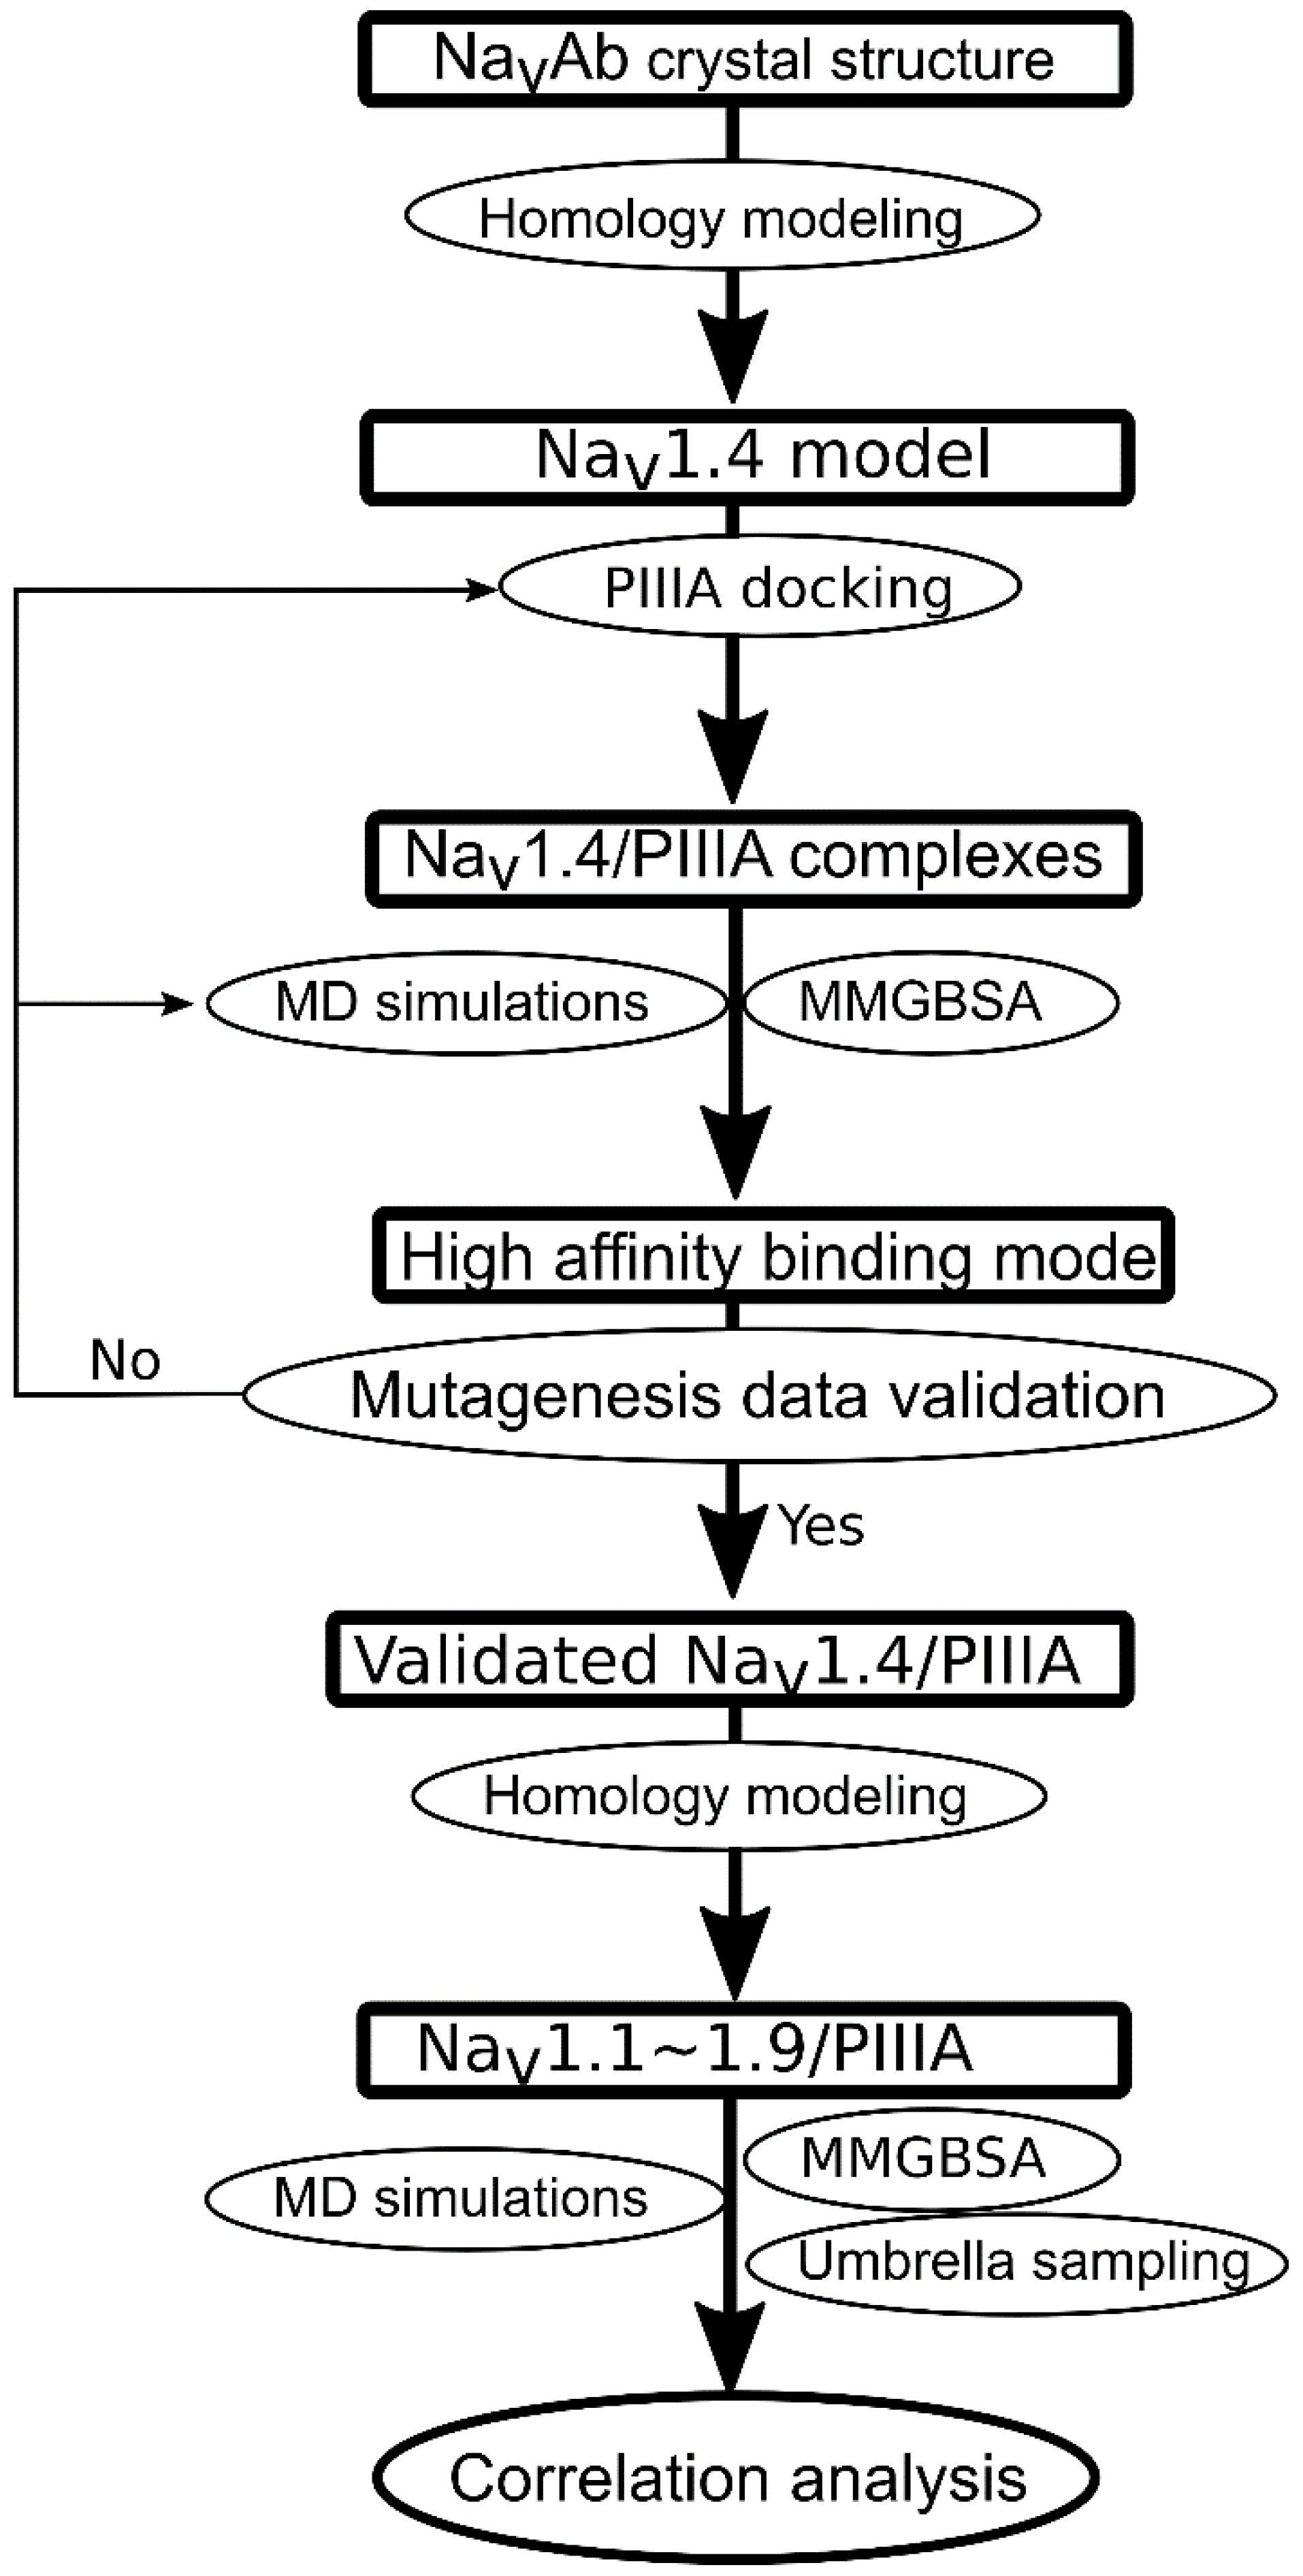
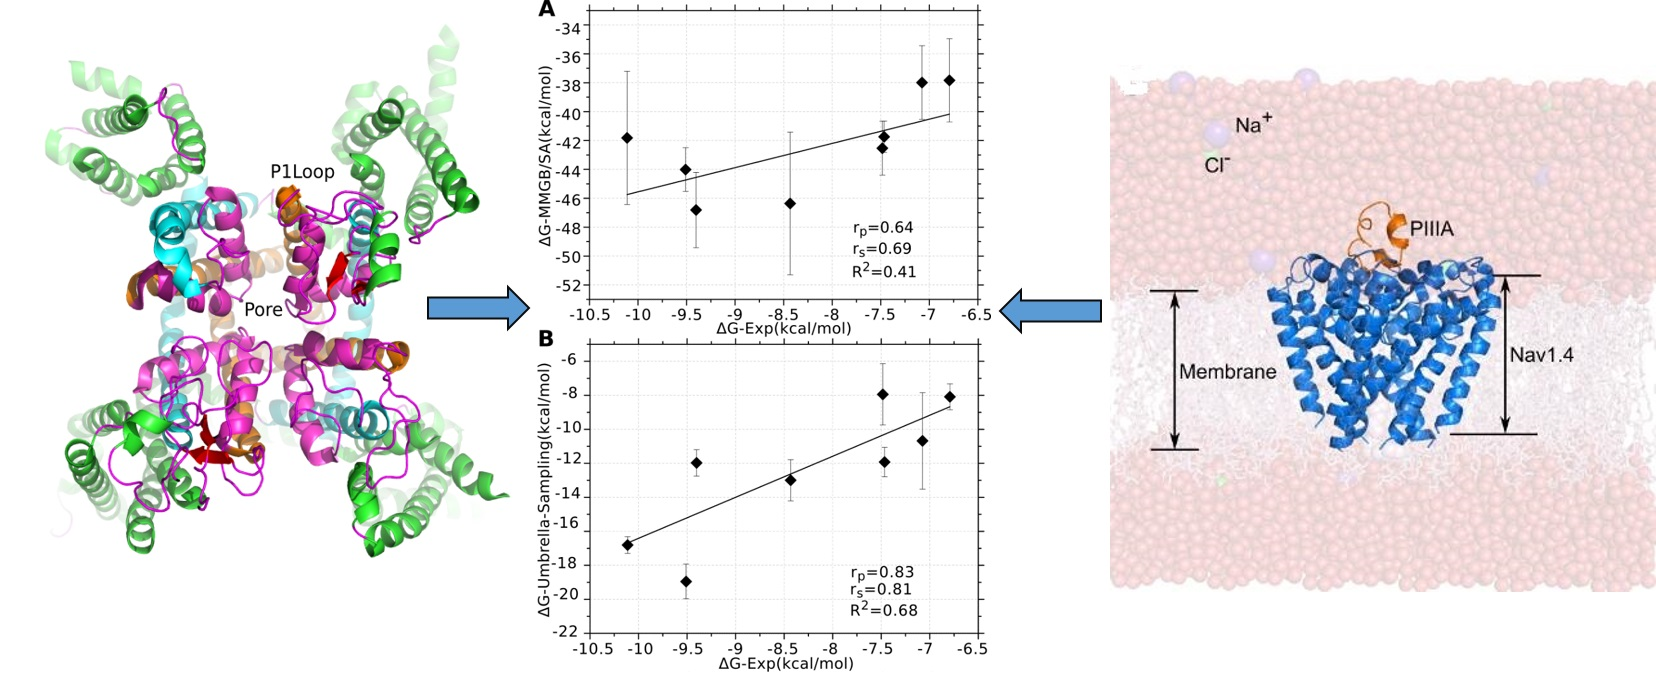
2.1. Flowchart for Specificity Prediction

Despite millions of years of divergent evolution between the NaVMs and eukaryotic sodium channel, they both still possess similar pharmacological profiles to the channel blockers as shown by the functional electrophysiological studies [16]. Indeed, previous computational modeling studies suggested that crystal structure of NaChBac (Na(+)-selective channel of bacteria) could be used as template to model the pore domain of the human or rat NaV1.4 due to the relatively high sequence identity and structural similarity at the SF domain of the channel. In this study, the crystal structure of the NaV Ms in open (PDB code 4CBC) was used as template to model the pore domain of the human NaV1.4. After building the homology model of NaV1.4, the NMR structure of the PIIIA (PDB code 1R9I) was docked into the extracellular pore domain of the NaV 1.4 model [17]. Ten conformations of the PIIIA with minimum docking score were maintained and subjected to further molecular dynamics (MD) refinement and binding energy calculations using MMGB/SA method. The Molecular Mechanics/Poisson Boltzmann Surface Area (MM/PBSA) and Molecular Mechanics/Generalized Born Surface Area (MM/GBSA) approaches are more computationally efficient which estimate protein-protein binding free energies. Conformations of the PIIIA at NaV 1.4 were ranked based on the binding energies calculated using MMGB/SA. And relatively higher energy conformations of the PIIIA at NaV1.4 were discarded, whereas the low energy conformations were maintained and further validated based on the known mutagenesis data [10,11]. Once the determined binding mode of PIIIA prokaryotic NaV1.4 was validated by the experimental data, it could be used as template to model interactions of PIIIA with other NaV subtypes.
The binding modes of PIIIA against NaV1.x (x = 1, 2, 3, 5, 6, 7, 8, 9) were determined based on homology modeling using PIIIA/NaV1.4 as the template. The produced models were further refined using MD simulations. The binding energies of PIIIA against NaV1.x (x = 1, 2, 3, 5, 6, 7, 8, 9) were calculated using MMGB/SA method and umbrella sampling. The final step is the analysis of the correlation between the calculated and experimental derived binding affinities. The flowchart for PIIIA specificity prediction was summarized in Figure 3.

2.2. Homology Modeling of the NaV1.4

Models of the NaV1.4 were built using the crystal structure of prokaryotic NaVMs channel (PDB code: 4P9O) as template in MODELLER (version 9v12) [18,19], as described previously [20]. The sequence of NaV1.4 was retrieved from the UniProt database [21], and was divided into four homologue sequence fragments based on the sequence of prokaryotic NaVMs. The sequence alignment between the four homologue sequence fragments of NaV1.4 and sequence of the prokaryotic NaVMs (Figure S1) was used to build 100 homology models of the NaV1.4, and the model with the lowest dope score [22] was selected for PIIIA docking.

2.3. PIIIA Docking

Docking the NMR structure of PIIIA (PDB Code: 1R9I) to NaV1.4 model was performed using AutoDock 4.2 [23]. Gasteiger charges were used, and nonpolar hydrogens of the macromolecule and ligand were merged. A grid box with dimensions of 60 Å × 60 Å × 60 Å and a grid spacing of 0.375 Å was set up and centered on the geometry center of the “P1 loop” of the four domains. Docking was performed using a Lamarckian genetic algorithm (LGA), with the receptor treated as rigid, the docking results were analyzed by AutoDock Tools. The produced conformations with top 10 docking score were selected for the MD refinement.

2.4. Restraint Molecular Dynamics Simulations

The selected 10 NaV1.4/PIIIA complexes were subjected to MD simulations for refinement of the PIIIA binding mode in AMBER 16 [24]. The MD simulations are performed using the ff14SB force field for the proteins and the peptide [25]. Parameters for the pyroglutamic acid (PCA) residue were prepared using the antechamber module in AMBER 16. Atom partial charges for PCA (pyroglutamic acid) were produced using the R.E.D Tools [26]. The PCA was incorporated into the PIIIA peptide as an unnatural amino acid. After building the whole system in LEaP that is a module of AMBER16, minimization was performed to remove the van der Waals clashes between PIIIA and NaV1.4. The 2000 steps of steepest descent minimization and 3000 conjugate gradient minimum were performed with the solute restrained using a harmonic force potential with a spring constant of 100 kcal/mol−1−2. After the first round of minimization, the restraints were withdrawn and the whole system was minimized using the same parameters as above. MD simulations were carried out after minimization. First, the whole system was gradually heated from 50 K to 300 K at constant volume and temperature ensemble for 100 ps with the solute restrained with a harmonic force of 5 kcal/mol−1−2. The simulations were then switched to constant pressure and temperature ensemble by maintaining the harmonic restraints in 100 ps. For the production run, the restraints on PIIIA as well as the P1 loop were withdrawn and 20 ns MD simulations were performed with the temperature and pressure maintained at 300 K and 1 bar, respectively. All bonds involving hydrogen atoms were constrained with the SHAKE algorithm with a time step of 2 fs [27]. The particle-mesh Ewald (PME) method was used to model long-range electrostatic interactions [28]. The following MD simulations on PIIIA/ NaV1.x (x = 1, 2, 3, 5, 6, 7, 8, 9) used the same parameters setting up as PIIIA/NaV1.4 system.

2.5. Molecular Dynamics Simulation of the NaV1.4 in Membrane

For evaluation of the membrane influences on the conformation of the NaV1.4 and the bound PIIIA, MD simulations were performed on NaV1.4 in apo and in complex with PIIIA. The NaV1.4 in apo or bound with PIIIA were inserted a bilayer containing a 2:2:1 mixture of POPC (1-palmitoyl-2-oleoyl-sn-glycero-3-phosphocholine):POPE (1-palmitoyl-2-oleoyl-sn-glycero-3-phosphoethanolamine):Cholesterol as suggested in previous study [29] with dimension of 80 × 80 × 80 Å3 and the system solvated with TIP3P [30] water molecules and Na+ and Cl ions such that the system was neutral with an overall concentration of 0.15 M in CHARMM-GUI that is a webserver for preparing MD simulation system (http://www.charmm-gui.org). The temperature of the system was gradually increased to 310 K and was equilibrated for 500 ps in NVT (constant-volume, constant-temperature) and NPT (constant-pressure, constant-temperature) ensembles, respectively, with the protein and lipids restrained with 10 kcal/mol/Å2 force. Langevin thermostat is used for the initial heating. For the second phase heating, an anisotropic Berendsen weak-coupling barostat is used to equilibrate the pressure in addition to the use of the Langevin thermostat to equilibrate the temperature. Then, the restraint of the membrane was withdrawn and the whole system was simulated for 20 ns in NPT for properly equilibrating the membrane system. And the restraint on the protein was gradually withdrawn in 10 steps in 5 ns MD simulations. Afterwards, 150 ns production run was performed on the NaV1.4 in apo and in complex with PIIIA, respectively. In production run, the temperature was controlled using the Langevin thermostat while pressure was controlled using the anisotropic Berendsen barostat. All simulations were performed using the Lipid14 force field [31] for the lipid, AMBER14SB force field for the protein [31]. The MD simulations used a time step of 2 fs and, all bonds involving hydrogen atoms were maintained to their standard length using the SHAKE algorithm [32]. Particle Mesh Ewald (PME) [33] was used with a cutoff of 10 Å for non-bonded atoms interactions and neighbor lists were updated every 10 steps.

2.6. Binding Energy Calculations Using MMGB/SA

Molecular mechanics generalized Born surface area (MMGB/SA) [34] were applied to calculate the binding affinities of PIIIA against the NaV channels. The energies were averaged on the 50 frames extracted from the last 10 ns MD simulations. The parameters are as previously reported [20]. Briefly, the internal dielectric and external dielectric constants were set to 2.0 and 80.0, respectively. A probe radius of 1.4 Å, a grid spacing of 0.5 Å and ionic strength 0.1 mol/L were set up for the calculations.

2.7. Decomposition of the Binding Energies

The binding energies calculated using MMGB/SA were decomposed into energy contributions from each residue of the binding site using the MMPB/SA.py script in AMBER16. Parameters setting up was the same as above.

2.8. Binding Energies Calculations Using Umbrella Sampling

Umbrella sampling is one biased MD method that provides free energy along a reaction coordinate [35]. In umbrella sampling, a bias potential is applied to drive a system from one thermodynamic state to another along a reaction coordinate. Here, the distance between the center of mass of the PIIIA and the center of mass of the five symmetric CA atoms in the transmembrane domain were selected as the reaction coordinate, and along which a harmonic potential was added (Equation (1)).
F(x) = k(x − x0)2
where the k is 100 kcal/mol/Å2 and x0 is the initial distance.
When the reaction coordinate (x − x0) reached 15 Å, the PIIIA was considered completely unbound from the channel. The reaction coordinate was divided into 30 windows, and in each window, 2 ns MD simulations were performed. The windows were then combined by the weighted histogram analysis method (WHAM) [36]. Conformations in the last 1.5 ns were used to derive the potential of mean force along the coordinate using WHAM. The binding/unbinding free energy of PIIIA was calculated using the PMF values at the end of unbinding.

3. Results and Discussion

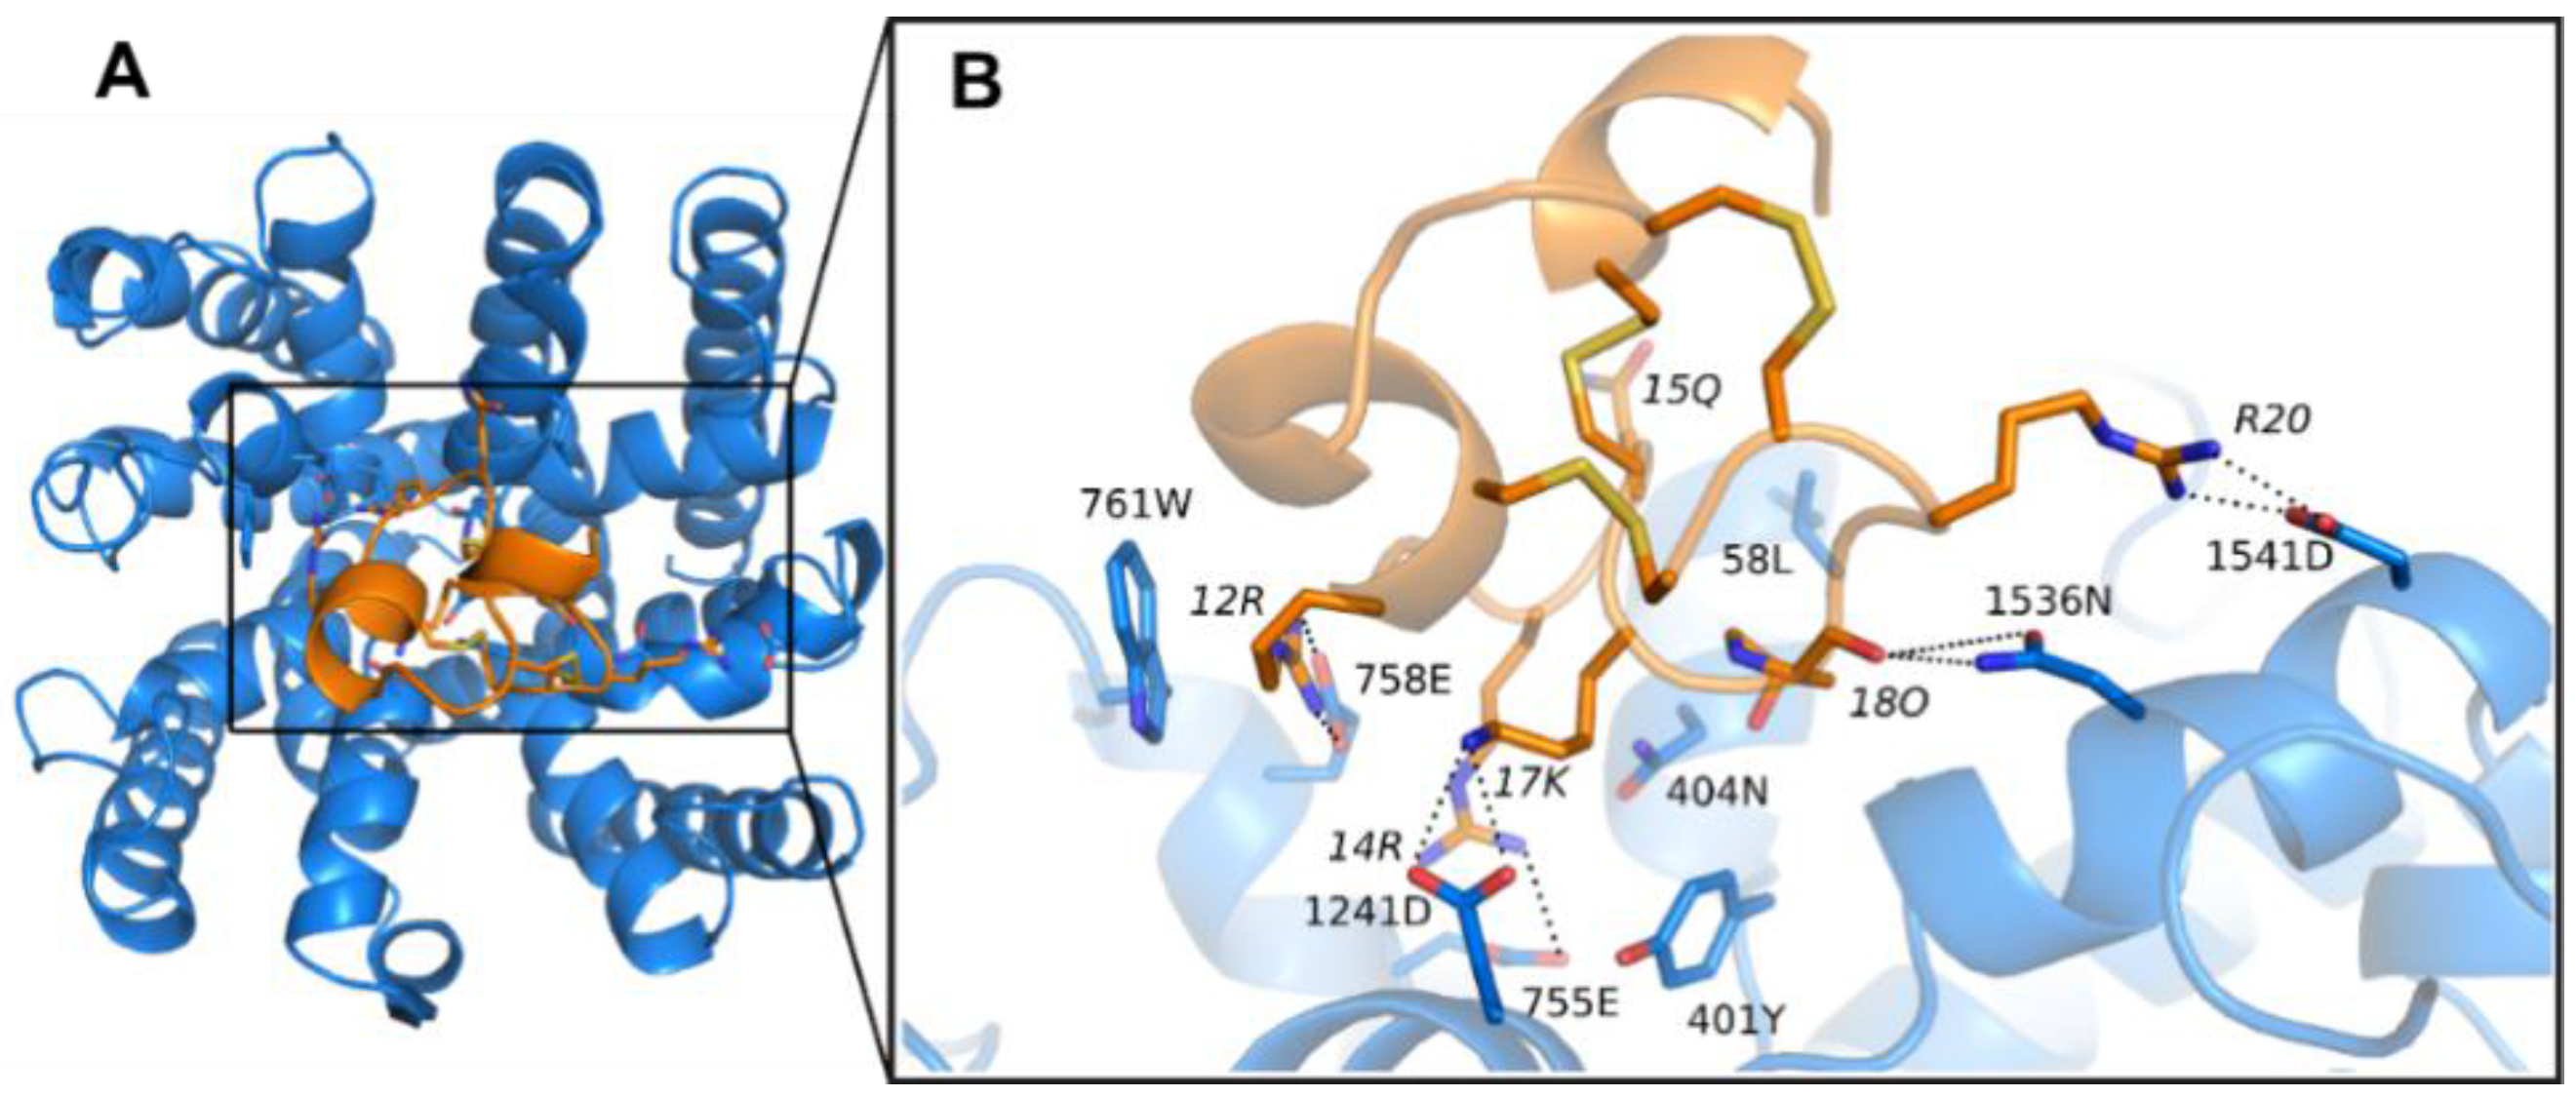
3.1. Prediction of the Binding Mode of the PIIIA at NaV1.4

μ-Conotoxin PIIIA was positioned on the pore surface of the extracellular domain of NaV1.4 based on docking. During docking, the top 10 conformations were retained (Figure S2) for MD refinement and binding energy calculations. The PIIIA was positioned at the surface of the NaV1.4 with varied conformations (Figure S2A,B). The binding energies predicted using Autodock are considerably higher than the experimental values. The unfavorable binding energies given by the docking technique are originated from the poor accuracy when dealing with the flexibility of the protein and the peptide by AutoDock. During docking, only side chains of the PIIIA were considered as flexible, whereas side chains of the NaV1.4 were considered as rigid. As a consequence, the predicted binding affinities were underestimated using docking. Thus, it is prerequisite to refine the binding mode of PIIIA at NaV1.4 using MD, and re-rank the binding affinities of PIIIA at NaV1.4 using more rigorous energy estimation method, like MMGB/SA or MMPB/SA.
Here, the MMGB/SA method was used to calculate the binding affinities of the 10 conformations of PIIIA at NaV1.4 due to its slightly better performance than MMPB/SA method to rank the binding affinities of the α-conotoxin analogues in a previous study [20]. The ranking order for the 10 conformations significantly changed after re-ranking based on the MMGB/SA method (Table S1), and their backbone orientation at the binding site of NaV1.4 in some cases significantly varied (Figure S3). Conformation for the side chains of PIIIA varied significantly after MD simulations in most cases (not shown).
Conformations of PIIIA with optimum binding energy were selected for accuracy validation by comparison with the mutagenesis data [37]. We found that the minimum binding energy conformation of PIIIA was the most consistent with the mutagenesis data, and its binding mode to NaV1.4 was shown in Figure 3. The PIIIA was positioned at the pore surface of the ECD with the axis of the helix between residue 6 and 15 tilted to the pore, resulting in the N-termini outward tilted from the binding site forming no direct interactions with residues of the binding site. The predicted binding mode of PIIIA is consistent with the previously determined binding mode of PIIIA at the NaV1.4 using restraint docking method [14]. The PIIIA is rich with positively charged residues, whereas the binding site of NaV1.4 possesses an abundance of negatively charged residues (Figure S4). Thus, the net charge of the PIIIA is overall complementary to the NaV1.4. Indeed, there are numerous salt-bridges formed at the interface between PIIIA and NaV 1.4 (Figure 4). The R14 and K17 of PIIIA form salt-bridges with E755 and D1241, two of the filter residues at the pore domain, respectively. The R12 of PIIIA forms salt-bridges with E758 that is near the pore filter, while the R20 forms salt-bridges with D1541 at the periphery of the binding site. Besides, the hydroxyl group of O18 forms a pair of hydrogen bonds with N1536. Thus, our predicted binding mode of PIIIA against the NaV1.4 suggests that the salt-bridges as well as the hydrogen bonds are the dominant binding determinants for PIIIA binding to NaV1.4. Indeed, the previous mutagenesis data also supports that R14, R12, K17, and R20 contribute most to the binding affinity of PIIIA to NaV1.4 [37]. More detailed pairwise interactions between PIIIA and NaV1.4 were listed in Table 1.

3.2. Influences of the Membrane to the Conformation of the NaV1.4 in apo and NaV1.4 in Complex with PIIIA

For consideration of the influences of the membrane to the conformation of NaV1.4 and PIIIA/NaV1.4 complex model, nonrestraint molecular dynamic simulations were performed on the NaV1.4 model in apo or in complex with PIIIA embedded in the membrane. MD simulations results suggest that conformation of the NaV1.4 model in apo and in complex with PIIIA is stable in 100 ns MD. The RMSD (root-mean-square deviation) value of the NaV1.4 model in complex with PIIIA is lower than that in apo (Figure S5A). Obviously, binding PIIIA to NaV1.4 has a stabilization effect on this model. After 150 ns of non-restraint MD the binding mode of PIIIA at NaV1.4 is essentially the same to that determined using restraint MD without adding the membrane (Figure S5B). Thus, it is applicable to use more efficient restraint MD for the refinement of the binding mode of PIIIA at NaV1.4 without incorporation of the membrane.

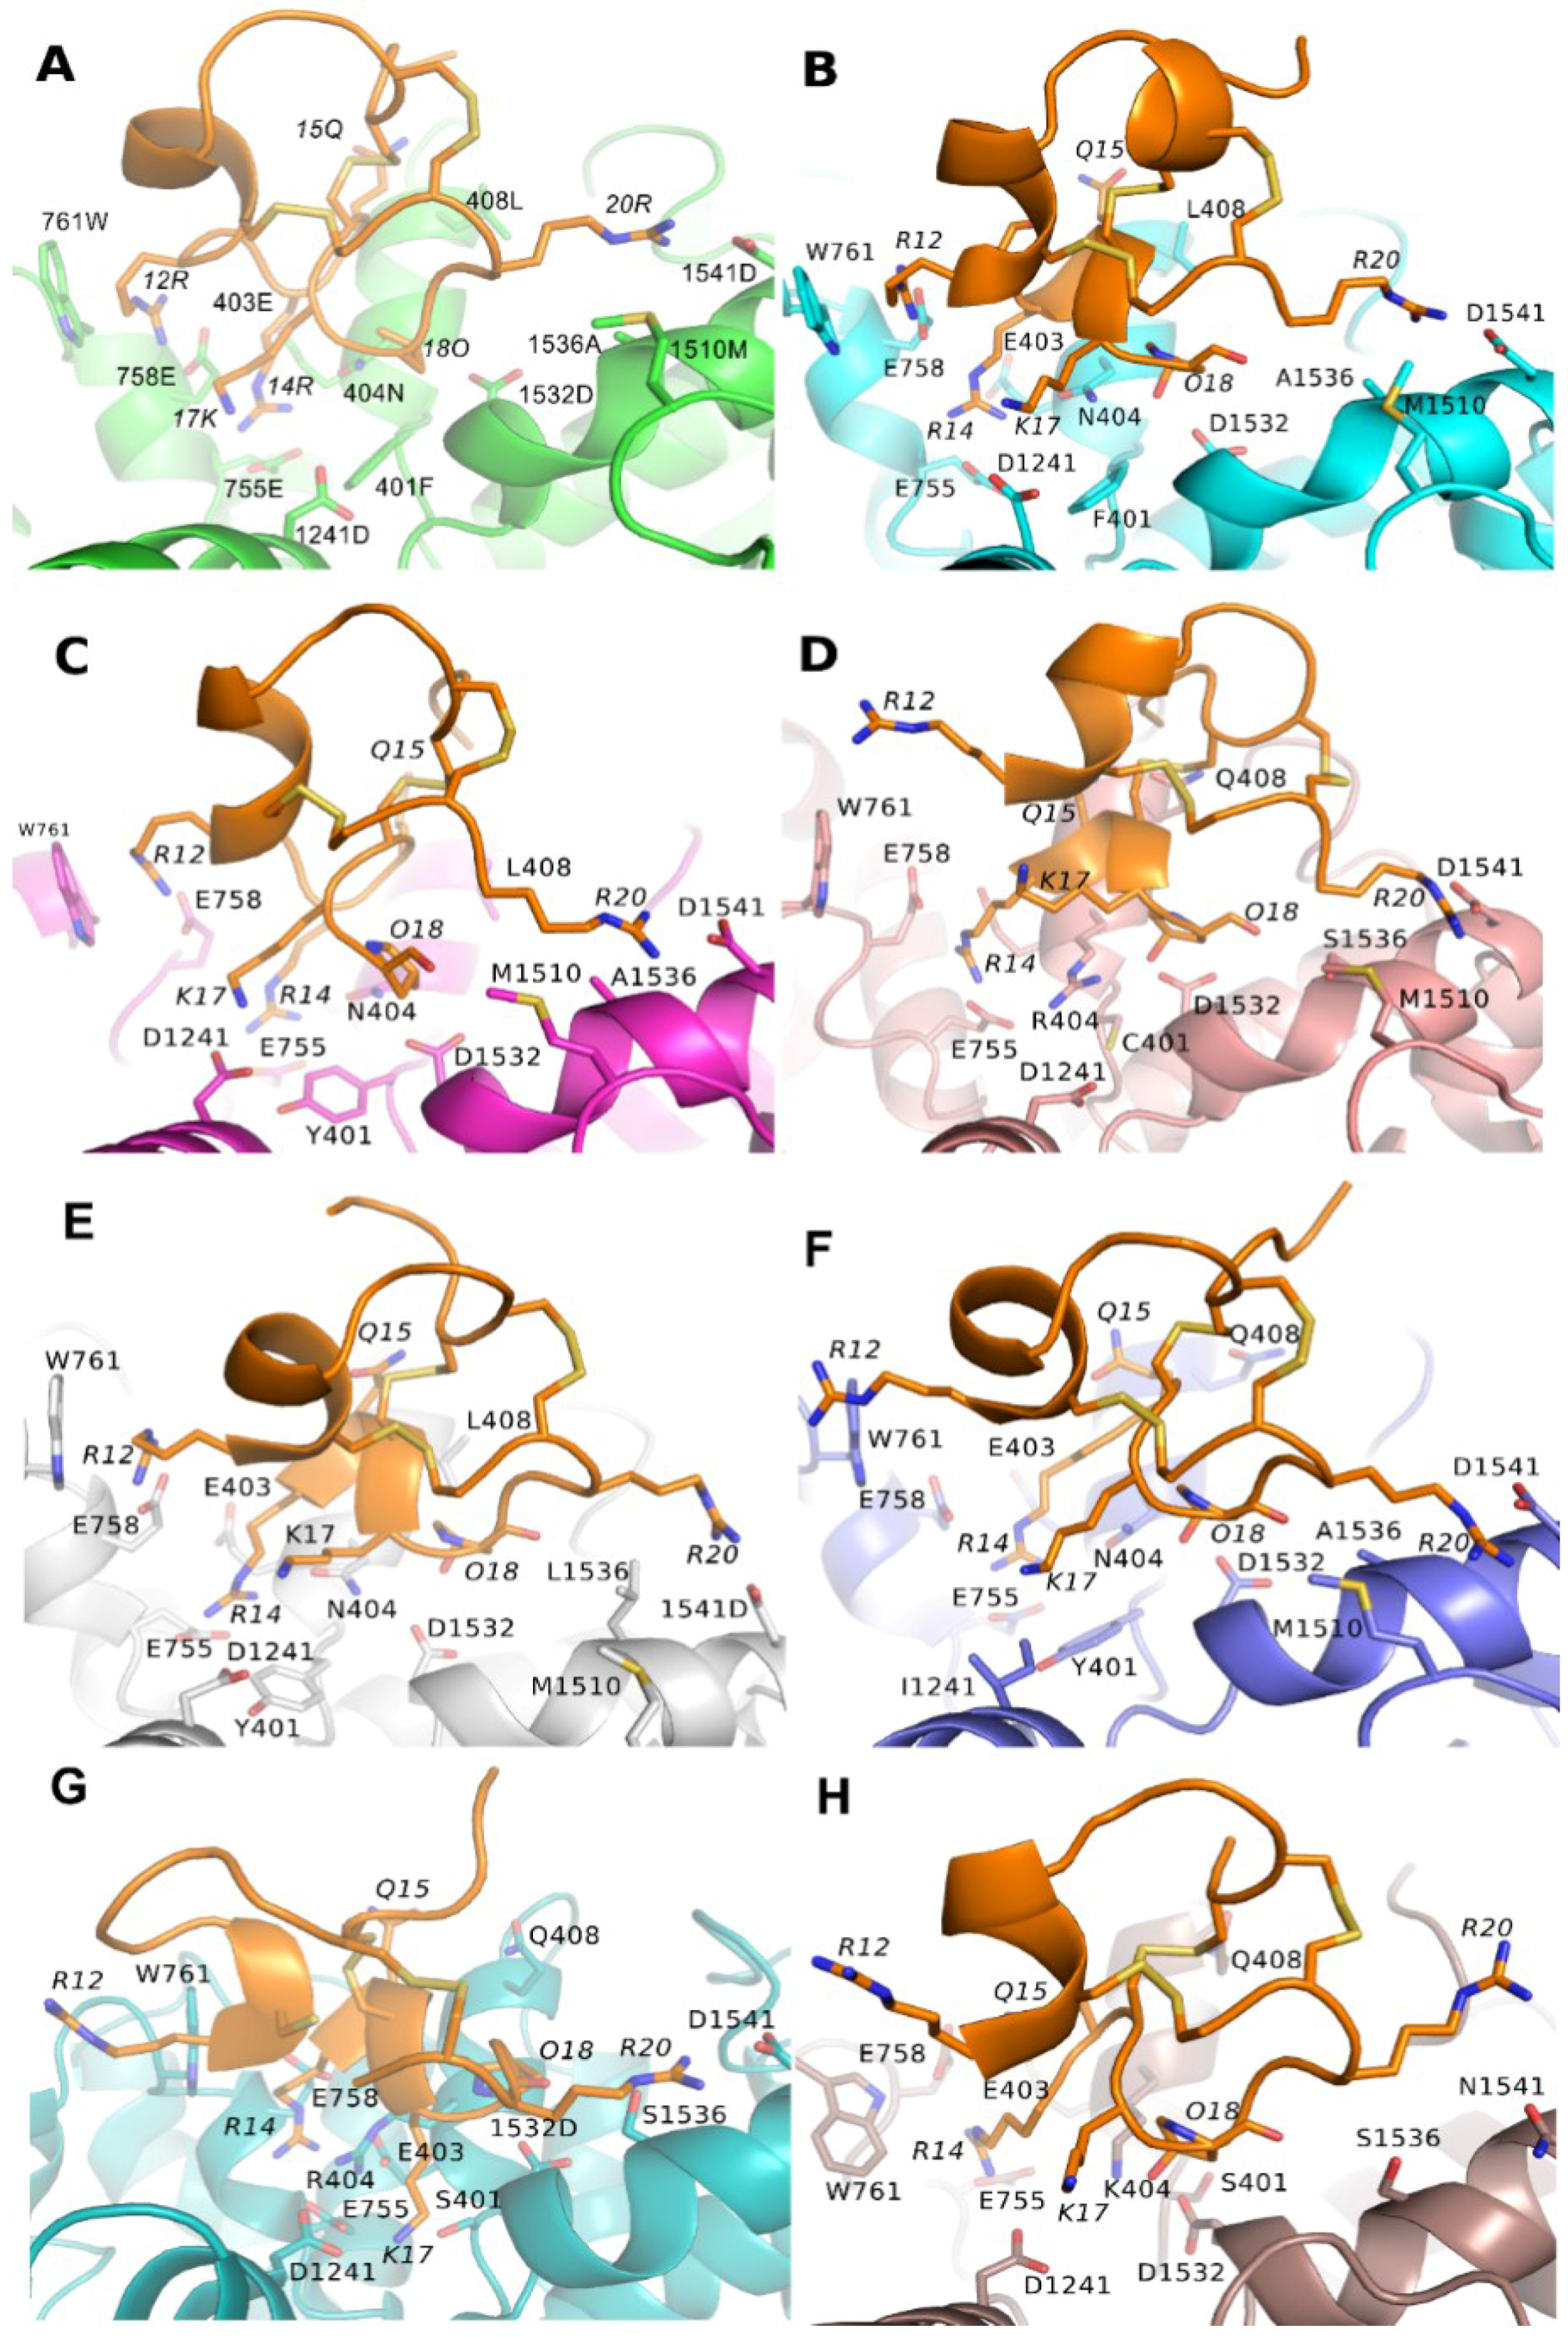
3.3. Binding Modes of PIIIA at Other Subtypes of NaV

PIIIA possesses broad inhibitory spectra on NaV, from NaV1.1 to NaV1.8 [10,11,12,38,39,40]. Residues at the binding site of the α subunit of NaV is highly conserved, and it might be applicable to homology model the binding modes of PIIIA to NaV1.x (x = 1, 2, 3, 5, 6, 7, 8, 9) by using PIIIA/NaV1.4 as the template. In this study, the PIIIA was directly modelled into the binding site of NaV1.x (x = 1, 2, 3, 5, 6, 7, 8, 9) using PIIIA/NaV1.4 as a template instead of using the docking method in considering of its incapacity for dealing with the flexibility of the protein and the peptide and its inaccuracy for prediction the binding affinity of the peptide ligands. Then the binding modes of PIIIA to NaV1.x (x = 1, 2, 3, 5, 6, 7, 8, 9) were refined using MD simulations.
Binding modes of PIIIA to NaV1.x (x = 1, 2, 3, 5, 6, 7, 8, 9) are essentially the same to NaV1.4 (Figure 5). However, some of the key pairwise interactions at PIIIA/NaV1.4 are absent at PIIIA/NaV1.x (x = 2, 3, 5, 7, 8), whereas they are all conserved at PIIIA/NaV1.x (x = 1, 6). Because of presence of all these key pairwise interactions at PIIIA/NaV1.x (x = 1, 6), the PIIIA possesses comparable inhibitory activity between NaV1.x (x = 1, 6) and NaV1.4. By contrast, one to three of the key pairwise interactions were absent at PIIIA/NaV1.x (x = 2, 3, 5, 7, 8), which might explain the insensitivity of these NaV subtypes to PIIIA. More detailed pairwise interactions between PIIIA and NaV1.x (x= 1, 2, 3, 5, 6, 7, 8, 9) are shown in Table 1.

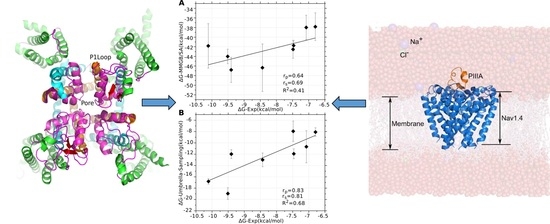
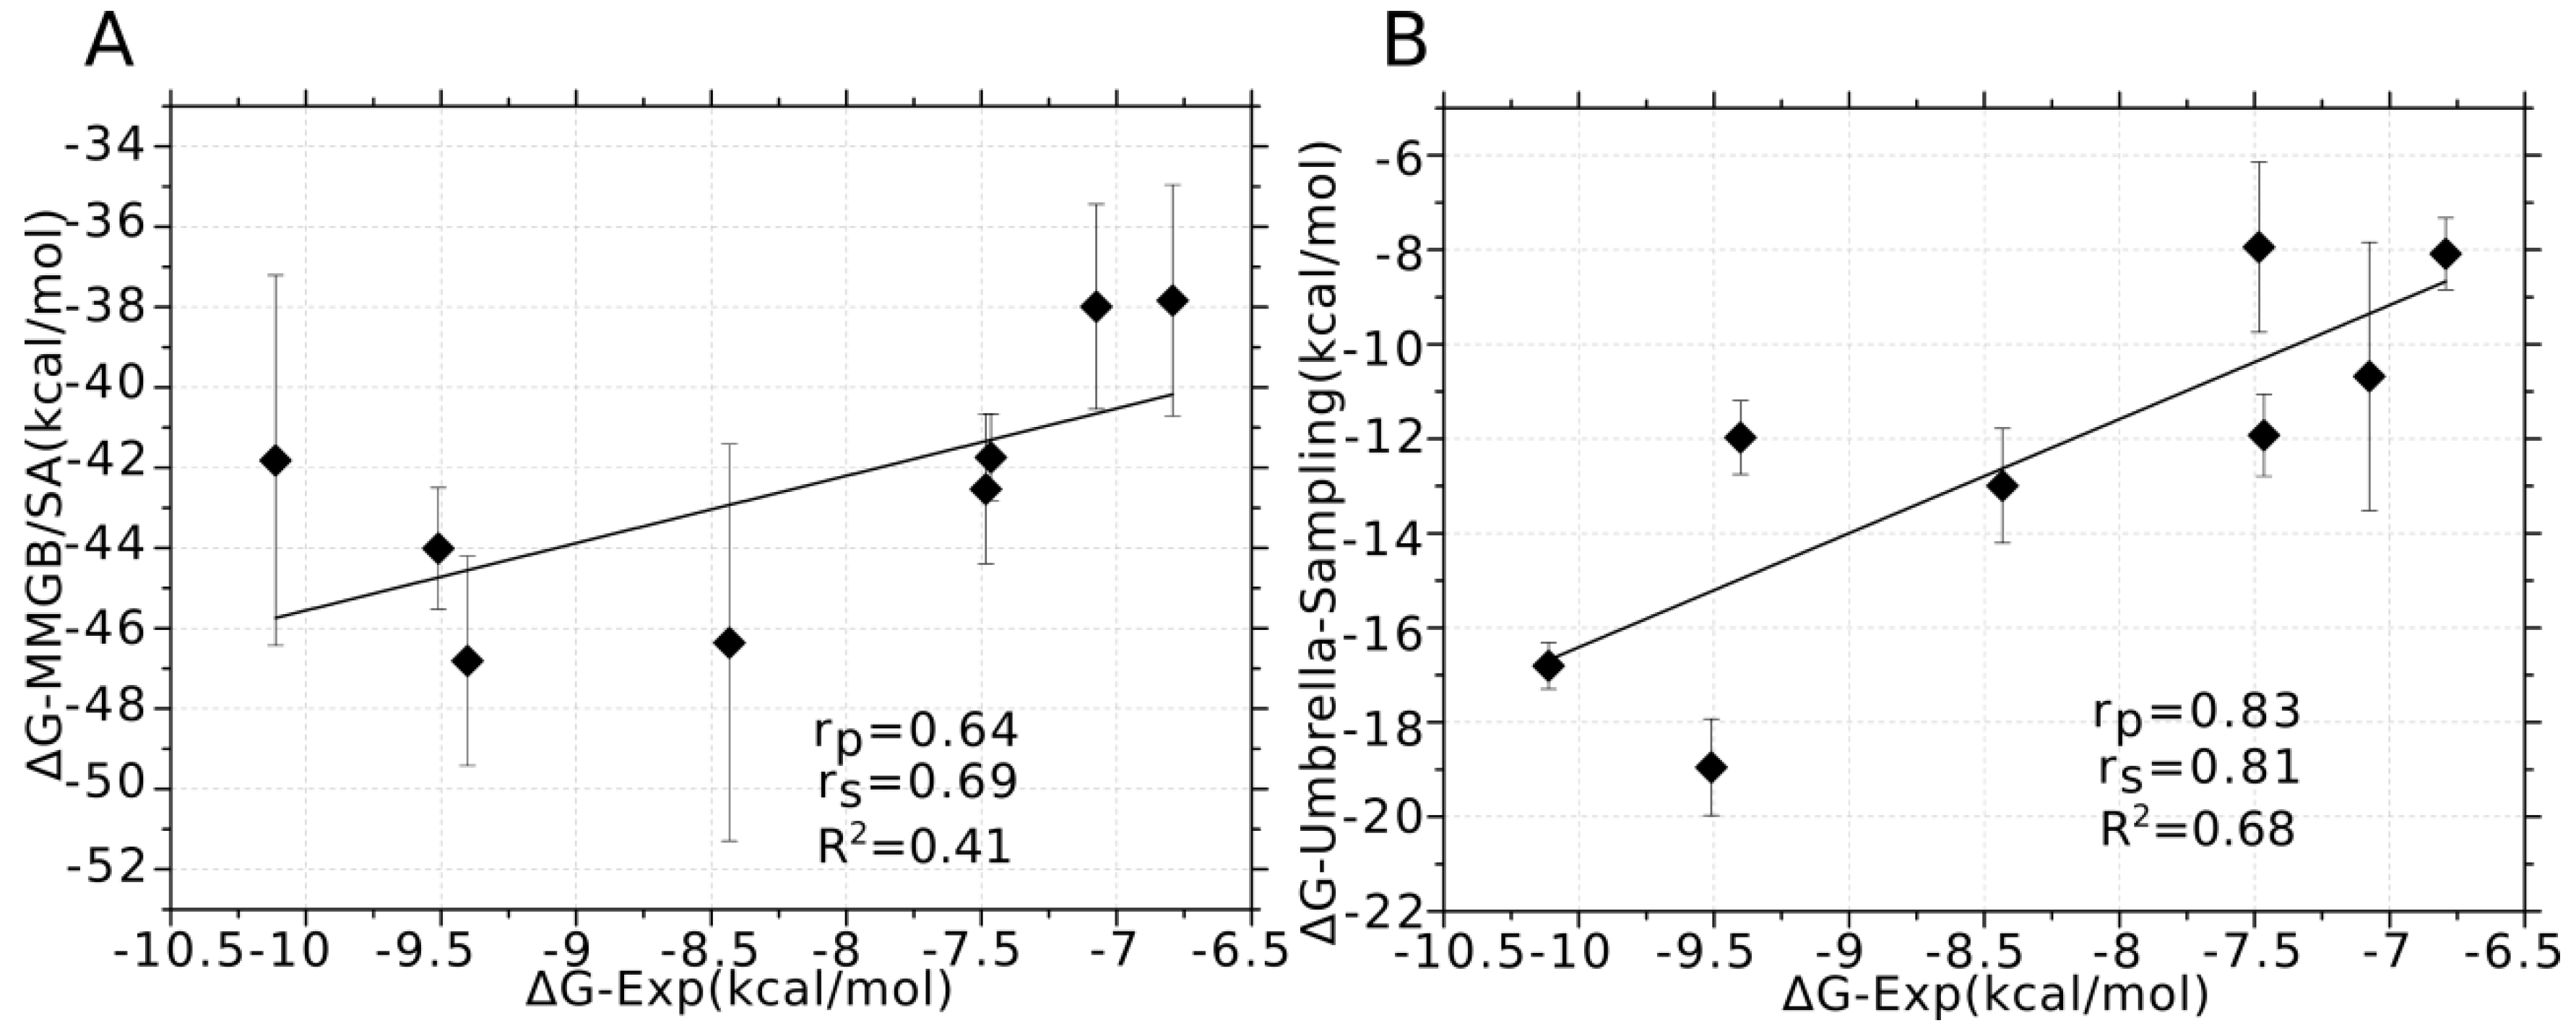
3.4. Prediction of the Specificity of PIIIA to Varied NaV Subtypes

Prediction of the specificity of PIIIA to different NaV subtypes presents a challenge, as it involves in differentiation of the binding affinity of PIIIA to several highly conserved NaV subtypes. In this study, we used two computational methods, MMGB/SA and umbrella sampling to predict the binding affinities of PIIIA to NaV subtypes from NaV1.1 to NaV1.9.
The MMGB/SA was used to predict the binding affinities of PIIIA to varied NaV subtypes due to its better performance than MMPB/SA at ranking the binding affinities of α-conotoxin analogues in our previous study [21]. For sufficiently sampling the conformation of PIIIA at varied NaV subtypes, the top three DOPE score PIIIA/ NaV1.x (x = 1, 2, 3, 5, 6, 7, 8, 9) models were selected for MD simulations, and 20 ns MD simulations were performed on each of the PIIIA/NaV1.4 systems. Frames from the last 10 ns MD were used to calculate the binding energy using MMGB/SA method. The calculated binding affinities were averaged on the three MD trajectories for each of PIIIA/NaV1.x (x = 1, 2, 3, 4, 5, 6, 7, 8, 9) systems. In a previous study, we found that incorporation of the entropy component to the G-free energy gave slightly worse ranking of the binding affinity of the α-conotoxin analogues despite of the significantly increased consumption of the computational resources [21]. Thus, only the enthalpy rather than the entropy was calculated and used for ranking the binding affinity of PIIIA to varied NaV subtypes. As shown by Table 2, the predicted binding energies without entropy using MMGB/SA are much lower than the experimental values, whereas they are modestly correlated with the experimental values giving a correlation coefficient of 0.41 (R2) (Figure 6). Thus, MD simulations coupling of MMGB/SA energy calculation could give modestly accurate predictions of the specificity of PIIIA to varied NaV subtypes.
The umbrella sampling is more efficient than MD simulations for conformation sampling, and it has been frequently applied to predict the binding free energies of the conotoxins to their target proteins [41,42,43,44,45,46]. In this study, umbrella sampling was used to predict the binding affinities of PIIIA against varied NaV subtypes. The above MD refined the top three models of the PIIIA/NaV systems, and were used as the initial for umbrella sampling simulations. The predicted binding free energies of PIIIA against varied NaV subtypes were derived from the calculation of potential of mean force (PMF) and were shown in Table 2. The absolute values of the predicted binding free energies using umbrella sampling are quite similar to the experimental values, and are high correlated to the experimental values with a correlation efficient of 0.68 (R2). Thus, umbrella sampling could give a highly accurate ranking of the inhibition activity of PIIIA to different NaV subtypes. Umbrella sampling gave a better prediction of the specificity of PIIIA to varied NaV subtypes due to its more efficient conformation sampling.
There is no binding or IC50 data for PIIIA to NaV1.9. Binding energies calculation from both MMGB/SA and umbrella sampling together predict that PIIIA possesses poor binding affinity to the NaV1.9.

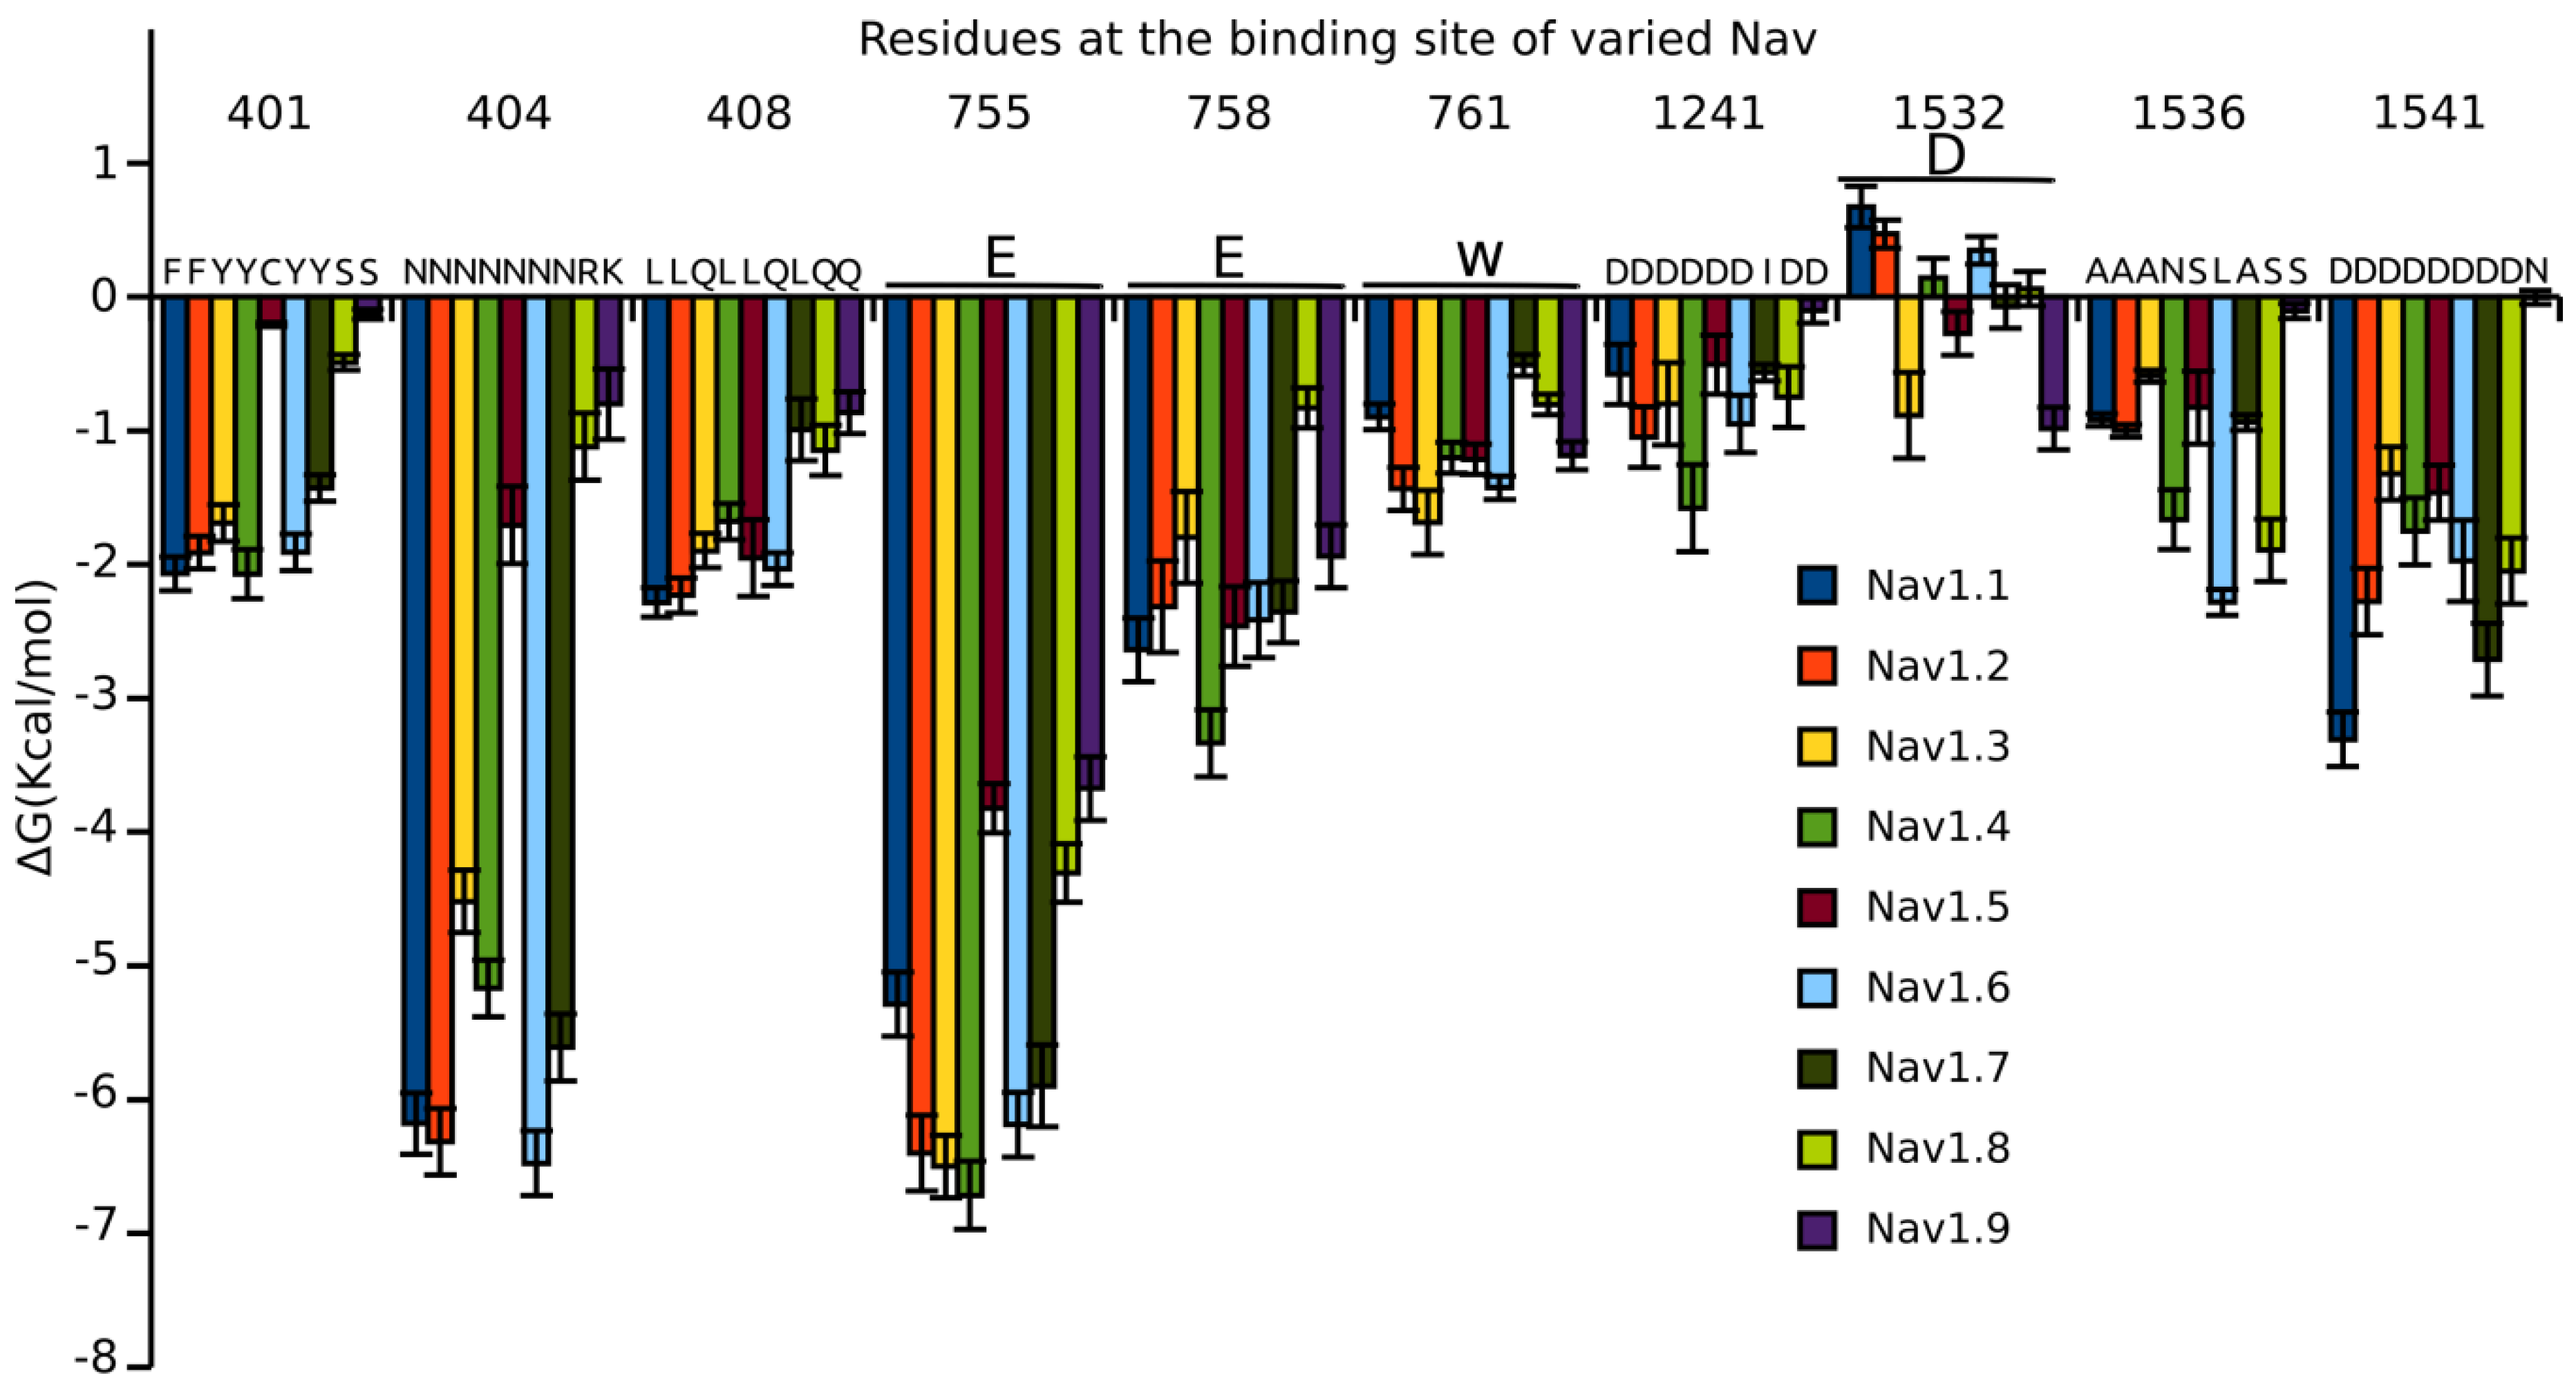
3.5. Binding Energy Decomposition Using MMGB/SA

The binding energy calculated using MMGB/SA was decomposed into energetic contributions from each residue of the binding site (Figure 7 and Table S2). Binding energy decomposition suggests that all residues of the binding site except for D1532 significantly contributes to the binding affinity of PIIIA to NaV. Binding mode analysis suggests that the D1532 locates in the binding site forming van der Waals contacts with the backbone of the PIIIA (Figure 4). The high desolvation energy of D1532 might result in its unfavorable binding to most of the NaV subtypes, except for NaV1.3 in which the D1532 forms an unstable hydrogen bond with PIIIA O18. An aromatic residue such as Y or F at 401 significantly contributes to the binding affinity of PIIIA to NaV1.1, NaV1.2, NaV1.3, NaV1.4, NaV1.6 and NaV1.7. In our model, the side chain of the aromatic residue at 401 stacks with the side chain of K17, forming favorable van der Waals contacts (Figure 4). By contrast, the C and S merely form few contacts with the side chain of K17, explaining their little energetic contribution to the binding affinity of PIIIA to NaV1.5, NaV1.8 and NaV1.9. A neutral N at 404 is more energetically favorable for the binding of PIIIA to NaV1.x (x = 1, 2, 3, 4, 6, 7) than the positively charged R or K of NaV1.x (x = 5, 8, 9). Binding mode analysis indicates that side chain of N can form a hydrogen bond with R14, whereas this hydrogen bond is absent when a positively charged residue is present at 404 (Figure 4). The L and Q at 408 showed only a little difference to the binding affinity of PIIIA to varied subtypes of NaV, despite of their side chain hydrophobicity difference. The L and Q at 408 are at the periphery of the binding site where they both form few van der Waals contacts with the PIIIA explaining their little difference to the binding affinity of PIIIA. The conserved E755 is located at the center of the binding site, substantially contributing to the binding affinity of PIIIA by forming salt bridges with the side chain of R14 with energetic contribution varied from −4 kcal/mol to −7 kcal/mol (Figure 5). By contrast, the conserved E758 contributes less than E755 to the binding affinity of PIIIA to subtypes of NaV by forming an electrostatic interaction with R12 of PIIIA. A conserved aromatic residue, W761, contributes −2~−1 kcal/mol binding energy to PIIIA by forming van der Waal contacts with side chain of R12. A D at 1241 is conserved among varied subtypes of NaV1 except for NaV1.7, on which an I is present this position. The D1241 locates at the periphery of the binding site where it only contributes −2~0 kcal/mol binding energy to the total binding affinity of PIIIA. The side chain of K17 on PIIIA tilted to the D1241 and could form favorable electrostatic interaction in MD. The D at 1532 is conserved across all NaV subtypes. The D1532 contributes little or even unfavorable binding energy to the binding affinity of PIIIA to different subtypes of NaV1 except for to the NaV1.3 in which D1532 can form a hydrogen bond with the hydroxyl group of O18. Residues at 1536 are not conserved across different subtypes of NaV. An N at 1536 of NaV1.4 can form a hydrogen bond with the hydroxyl group of O18, whereas this hydrogen bond is absent when A, S or L are present at the same position. The side chain of L1536 at NaV1.6 stacks with the side chain of R20 as well as the backbone of PIIIA, and significantly contributes to its binding affinity. A S at 1536 can form hydrogen bond with R20 and significantly contributes to its binding to NaV1.8, whereas such pairwise interaction is absent at the NaV1.9. Thus, the same residue at the same positions of different subtypes of NaV might play different roles to the binding affinity of PIIIA. The D at 1541 is conserved across all NaV subtypes from NaV1.1 to NaV1.8, whereas an N is at the same position of NaV1.9. Either an D or an N at 1541 of NaV subtypes contributes to about −2 kcal/mol energy to the binding affinity of PIIIA by forming salt bridges or hydrogen bonds with R20 of PIIIA.
Overall, the binding site of NaV is rich of negatively charged residues such as D and E, and thus the binding site shows an overall negative electrostatic potential (Figure S4). By contrast, the PIIIA contains six positively charged residues and shows the positive electrostatic potential that is complementary to that of the NaV (Figure S4). Thus, the long range electrostatic interaction can be the driving force for the binding of PIIIA to the NaV at long range distance. At short range distance, the pairwise electrostatic interactions and hydrogen bond interactions contribute most to the binding affinity of PIIIA to NaV subtypes. Binding energy decomposition clearly shows that the conserved residues and the non-conserved residues have synergistic effects to affect the binding affinity of PIIIA to NaV subtypes.

4. Conclusions

A computational method combining homology modeling, docking, molecular dynamics simulations and binding energy calculations was established and successfully applied to determine the specificity of PIIIA to varied NaV subtypes from NaV1.1 to NaV1.9. The predicted binding free energies using umbrella sampling and MMGB/SA were correlated with experimental values giving a correlation coefficient (R2) of 0.68 and 0.41, respectively. The performance of umbrella sampling is superior to MMGB/SA due to the more powerful conformation sampling of the former. Interestingly, the predicted binding affinities given by umbrella sampling is very similar to the experimental values.
Binding modes analysis identified nonconserved residues existing at the interface between PIIIA and NaV1.x (x = 1 to 9). These nonconserved residues formed nonconserved interactions at the interface between PIIIA and NaV subtypes, which might confer the specificity of PIIIA. Indeed, results from binding energy decomposition showed that these nonconserved residues contributed varied binding energies to the binding affinity of PIIIA to varied NaV subtypes. Intriguingly, we also found that even the conserved residues could contribute varied binding energies to the binding of PIIIA to varied NaV subtypes. Therefore, the conserved and nonconserved residues might play synergistic effects together to influence the specificity of PIIIA to varied NaV subtypes. Overall, results from this study are valuable for our understanding the molecular determinants that confer the specificity of PIIIA to varied NaV subtypes and for further engineering the specificity of the μ-conotoxins to the interested NaV subtypes.

Supplementary Materials

The following are available online at https://www.mdpi.com/1660-3397/16/5/153/s1.

Author Contributions

R.Y. and T.J. conceived and designed the experiments; F.C. performed the simulations; W.H. assisted with the umbrella sampling simulations; F.C. and R.Y. analyzed the data and wrote the paper.

Acknowledgments

This work was supported by the Fundamental Research Funds for the Central Universities (No. 201762011 for R.Y.), and the grant from National Natural Science Foundation of China (NSFC) (No. 81502977 for R.Y.), the Scientific and Technological Innovation Project Financially Supported by Qingdao National Laboratory for Marine Science and Technology (No. 2015ASKJ02) and the Taishan Scholars Program of Shandong, China.

Conflicts of Interest

The authors declare no conflict of interest. The founding sponsors had no role in the design of the study; in the collection, analyses, or interpretation of data; in the writing of the manuscript, and in the decision to publish the results.

References

  1. Hodgkin, A.L.; Huxley, A.F. A quantitative description of membrane current and its application to conduction and excitation in nerve. J. Physiol. 1952, 117, 500–544. [Google Scholar] [CrossRef] [PubMed]
  2. Noda, M.; Ikeda, T.; Suzuki, H.; Takeshima, H.; Takahashi, T.; Kuno, M.; Numa, S. Expression of functional sodium channels from cloned cDNA. Nature 1986, 322, 826–828. [Google Scholar] [CrossRef] [PubMed]
  3. Rudy, B. Slow inactivation of the sodium conductance in squid giant axons. Pronase resistance. J. Physiol. 1978, 283, 1–21. [Google Scholar] [CrossRef] [PubMed]
  4. Drenth, J.P.; Waxman, S.G. Mutations in sodium-channel gene SCN9A cause a spectrum of human genetic pain disorders. J. Clin. Investig. 2007, 117, 3603–3609. [Google Scholar] [CrossRef] [PubMed]
  5. Catterall, W.A.; Goldin, A.L.; Waxman, S.G. International Union of Pharmacology. XLVII. Nomenclature and structure-function relationships of voltage-gated sodium channels. Pharmacol. Rev. 2005, 57, 397–409. [Google Scholar] [CrossRef] [PubMed]
  6. Goldin, A.L. Diversity of mammalian voltage-gated sodium channels. Ann. N. Y. Acad. Sci. 1999, 868, 38–50. [Google Scholar] [CrossRef] [PubMed]
  7. Shen, H.; Zhou, Q.; Pan, X.; Li, Z.; Wu, J.; Yan, N. Structure of a eukaryotic voltage-gated sodium channel at near-atomic resolution. Science 2017, 355. [Google Scholar] [CrossRef] [PubMed]
  8. Yan, Z.; Zhou, Q.; Wang, L.; Wu, J.; Zhao, Y.; Huang, G.; Peng, W.; Shen, H.; Lei, J.; Yan, N. Structure of the NaV 1.4-beta1 Complex from Electric Eel. Cell 2017, 170, 470.e11–482.e11. [Google Scholar] [CrossRef] [PubMed]
  9. Terlau, H.; Olivera, B.M. Conus venoms: A rich source of novel ion channel-targeted peptides. Physiol. Rev. 2004, 84, 41–68. [Google Scholar] [CrossRef] [PubMed]
  10. Shon, K.J.; Olivera, B.M.; Watkins, M.; Jacobsen, R.B.; Gray, W.R.; Floresca, C.Z.; Cruz, L.J.; Hillyard, D.R.; Brink, A.; Terlau, H.; et al. mu-Conotoxin PIIIA, a new peptide for discriminating among tetrodotoxin-sensitive Na channel subtypes. J. Neurosci. 1998, 18, 4473–4481. [Google Scholar] [CrossRef] [PubMed]
  11. Safo, P.; Rosenbaum, T.; Shcherbatko, A.; Choi, D.Y.; Han, E.; Toledo-Aral, J.J.; Olivera, B.M.; Brehm, P.; Mandel, G. Distinction among neuronal subtypes of voltage-activated sodium channels by mu-conotoxin PIIIA. J. Neurosci. 2000, 20, 76–80. [Google Scholar] [CrossRef] [PubMed]
  12. Wilson, M.J.; Yoshikami, D.; Azam, L.; Gajewiak, J.; Olivera, B.M.; Bulaj, G.; Zhang, M.M. mu-Conotoxins that differentially block sodium channels NaV1.1 through 1.8 identify those responsible for action potentials in sciatic nerve. Proc. Natl. Acad. Sci. USA 2011, 108, 10302–10307. [Google Scholar] [CrossRef] [PubMed]
  13. Munasinghe, N.R.; Christie, M.J. Conotoxins That Could Provide Analgesia through Voltage Gated Sodium Channel Inhibition. Toxins 2015, 7, 5386–5407. [Google Scholar] [CrossRef] [PubMed]
  14. Korkosh, V.S.; Zhorov, B.S.; Tikhonov, D.B. Folding similarity of the outer pore region in prokaryotic and eukaryotic sodium channels revealed by docking of conotoxins GIIIA, PIIIA, and KIIIA in a NaVAb-based model of NaV1.4. J. Gen. Physiol. 2014, 144, 231–244. [Google Scholar] [CrossRef] [PubMed]
  15. Zhorov, B.S.; Tikhonov, D.B. Computational Structural Pharmacology and Toxicology of Voltage-Gated Sodium Channels. Curr. Top. Membr. 2016, 78, 117–144. [Google Scholar] [PubMed]
  16. Bagneris, C.; DeCaen, P.G.; Naylor, C.E.; Pryde, D.C.; Nobeli, I.; Clapham, D.E.; Wallace, B.A. Prokaryotic NaVMs channel as a structural and functional model for eukaryotic sodium channel antagonism. Proc. Natl. Acad. Sci. USA 2014, 111, 8428–8433. [Google Scholar] [CrossRef] [PubMed]
  17. Nielsen, K.J.; Watson, M.; Adams, D.J.; Hammarstrom, A.K.; Gage, P.W.; Hill, J.M.; Craik, D.J.; Thomas, L.; Adams, D.; Alewood, P.F.; et al. Solution structure of mu-conotoxin PIIIA, a preferential inhibitor of persistent tetrodotoxin-sensitive sodium channels. J. Biol. Chem. 2002, 277, 27247–27255. [Google Scholar] [CrossRef] [PubMed]
  18. Sali, A.; Blundell, T.L. Comparative protein modelling by satisfaction of spatial restraints. J. Mol. Biol. 1993, 234, 779–815. [Google Scholar] [CrossRef] [PubMed]
  19. Webb, B.; Sali, A. Comparative Protein Structure Modeling Using MODELLER. Curr. Protoc. Bioinform. 2016, 54, 5.6.1–5.6.37. [Google Scholar]
  20. Yu, R.; Craik, D.J.; Kaas, Q. Blockade of neuronal alpha7-nAChR by alpha-conotoxin ImI explained by computational scanning and energy calculations. PLoS Comput. Biol. 2011, 7, e1002011. [Google Scholar] [CrossRef] [PubMed]
  21. Magrane, M.; UniProt, C. UniProt Knowledgebase: A hub of integrated protein data. Database (Oxford) 2011, 2011, bar009. [Google Scholar] [CrossRef] [PubMed]
  22. Shen, M.Y.; Sali, A. Statistical potential for assessment and prediction of protein structures. Protein Sci. 2006, 15, 2507–2524. [Google Scholar] [CrossRef] [PubMed]
  23. Morris, G.M.; Huey, R.; Lindstrom, W.; Sanner, M.F.; Belew, R.K.; Goodsell, D.S.; Olson, A.J. AutoDock4 and AutoDockTools4: Automated docking with selective receptor flexibility. J. Comput. Chem. 2009, 30, 2785–2791. [Google Scholar] [CrossRef] [PubMed]
  24. Case, D.A.; Cerutti, D.S.; Cheatham, T.; Darden, T.; Duke, R.; Giese, T.J.; Gohlke, H.; Götz, A.; Greene, D.; Homeyer, N.; et al. AMBER 2017; University of California: San Francisco, CA, USA, 2017. [Google Scholar]
  25. Maier, J.A.; Martinez, C.; Kasavajhala, K.; Wickstrom, L.; Hauser, K.E.; Simmerling, C. ff14SB: Improving the Accuracy of Protein Side Chain and Backbone Parameters from ff99SB. J. Chem. Theory Comput. 2015, 11, 3696–3713. [Google Scholar] [CrossRef] [PubMed]
  26. Dupradeau, F.Y.; Pigache, A.; Zaffran, T.; Savineau, C.; Lelong, R.; Grivel, N.; Lelong, D.; Rosanski, W.; Cieplak, P. The R.E.D. tools: Advances in RESP and ESP charge derivation and force field library building. Phys. Chem. Chem. Phys. 2010, 12, 7821–7839. [Google Scholar] [CrossRef] [PubMed]
  27. Frias Nunez, M. Plans for the establishment of central vaccination committees in the institutionalization of Medicine in Colombia. Cuad. Complut. Hist. Med. Cienc. 1993, 1, 89–102. [Google Scholar] [PubMed]
  28. Lavery, R.; Zakrzewska, K.; Beveridge, D.; Bishop, T.C.; Case, D.A.; Cheatham, T., 3rd; Dixit, S.; Jayaram, B.; Lankas, F.; Laughton, C.; et al. A systematic molecular dynamics study of nearest-neighbor effects on base pair and base pair step conformations and fluctuations in B-DNA. Nucleic Acids Res. 2010, 38, 299–313. [Google Scholar] [CrossRef] [PubMed]
  29. Grossfield, A.; Pitman, M.C.; Feller, S.E.; Soubias, O.; Gawrisch, K. Internal hydration increases during activation of the G-protein-coupled receptor rhodopsin. J. Mol. Biol. 2008, 381, 478–486. [Google Scholar] [CrossRef] [PubMed]
  30. Huggins, D.J. Correlations in liquid water for the TIP3P-Ewald, TIP4P-2005, TIP5P-Ewald, and SWM4-NDP models. J. Chem. Phys. 2012, 136, 064518. [Google Scholar] [CrossRef] [PubMed]
  31. Dickson, C.J.; Madej, B.D.; Skjevik, A.A.; Betz, R.M.; Teigen, K.; Gould, I.R.; Walker, R.C. Lipid14: The Amber Lipid Force Field. J. Chem. Theory Comput. 2014, 10, 865–879. [Google Scholar] [CrossRef] [PubMed]
  32. Miyamoto, S.; Kollman, P.A. Settle—An Analytical Version of the Shake and Rattle Algorithm for Rigid Water Models. J. Comput. Chem. 1992, 13, 952–962. [Google Scholar] [CrossRef]
  33. Darden, T.; York, D.; Pedersen, L. Particle Mesh Ewald—An N·Log(N) Method for Ewald Sums in Large Systems. J. Chem. Phys. 1993, 98, 10089–10092. [Google Scholar] [CrossRef]
  34. Wittayanarakul, K.; Hannongbua, S.; Feig, M. Accurate prediction of protonation state as a prerequisite for reliable MM-PB(GB)SA binding free energy calculations of HIV-1 protease inhibitors. J. Comput. Chem. 2008, 29, 673–685. [Google Scholar] [CrossRef] [PubMed]
  35. Northrup, S.H.; Pear, M.R.; Lee, C.Y.; McCammon, J.A.; Karplus, M. Dynamical theory of activated processes in globular proteins. Proc. Natl. Acad. Sci. USA 1982, 79, 4035–4039. [Google Scholar] [CrossRef] [PubMed]
  36. Kumar, S.; Bouzida, D.; Swendsen, R.H.; Kollman, P.A.; Rosenberg, J.M. The Weighted Histogram Analysis Method for Free-Energy Calculations on Biomolecules. 1. The Method. J. Comput. Chem. 1992, 13, 1011–1021. [Google Scholar] [CrossRef]
  37. McArthur, J.R.; Singh, G.; O’Mara, M.L.; McMaster, D.; Ostroumov, V.; Tieleman, D.P.; French, R.J. Orientation of mu-conotoxin PIIIA in a sodium channel vestibule, based on voltage dependence of its binding. Mol. Pharmacol. 2011, 80, 219–227. [Google Scholar] [CrossRef] [PubMed]
  38. Tietze, A.A.; Tietze, D.; Ohlenschlager, O.; Leipold, E.; Ullrich, F.; Kuhl, T.; Mischo, A.; Buntkowsky, G.; Gorlach, M.; Heinemann, S.H.; et al. Structurally Diverse mu-Conotoxin PIIIA Isomers Block Sodium Channel NaV1.4. Angew. Chem. Int. Ed. 2012, 51, 4058–4061. [Google Scholar] [CrossRef] [PubMed]
  39. Wilson, M.J.; Zhang, M.M.; Gajewiak, J.; Azam, L.; Rivier, J.E.; Olivera, B.M.; Yoshikami, D. alpha- And beta-subunit composition of voltage-gated sodium channels investigated with mu-conotoxins and the recently discovered mu O-conotoxin GVIIJ. J. Neurophysiol. 2015, 113, 2289–2301. [Google Scholar] [CrossRef] [PubMed]
  40. Zhang, M.M.; Wilson, M.J.; Azam, L.; Gajewiak, J.; Rivier, J.E.; Bulaj, G.; Olivera, B.M.; Yoshikami, D. Co-expression of Na(V)beta subunits alters the kinetics of inhibition of voltage-gated sodium channels by pore-blocking mu-conotoxins. Br. J. Pharmacol. 2013, 168, 1597–1610. [Google Scholar] [CrossRef] [PubMed]
  41. Chen, R.; Chung, S.H. Complex Structures between the N-Type Calcium Channel (Ca(V)2.2) and omega-Conotoxin GVIA Predicted via Molecular Dynamics. Biochemistry 2013, 52, 3765–3772. [Google Scholar] [CrossRef] [PubMed]
  42. Mahdavi, S.; Kuyucak, S. Why the Drosophila Shaker K+ channel is not a good model for ligand binding to voltage-gated Kv1 channels. Biochemistry 2013, 52, 1631–1640. [Google Scholar] [CrossRef] [PubMed]
  43. Patel, D.; Mahdavi, S.; Kuyucak, S. Computational Study of Binding of mu-Conotoxin GIIIA to Bacterial Sodium Channels Na(V)Ab and NaVRh. Biochemistry 2016, 55, 1929–1938. [Google Scholar] [CrossRef] [PubMed]
  44. Rashid, M.H.; Mahdavi, S.; Kuyucak, S. Computational Studies of Marine Toxins Targeting Ion Channels. Mar. Drugs 2013, 11, 848–869. [Google Scholar] [CrossRef] [PubMed]
  45. Suresh, A.; Hung, A. Molecular simulation study of the unbinding of alpha-conotoxin [Upsilon4E]GID at the alpha7 and alpha4beta2 neuronal nicotinic acetylcholine receptors. J. Mol. Graph. Model. 2016, 70, 109–121. [Google Scholar] [CrossRef] [PubMed]
  46. Yu, R.L.; Tabassum, N.; Jiang, T. Investigation of alpha-conotoxin unbinding using umbrella sampling. Bioorg. Med. Chem. Lett. 2016, 26, 1296–1300. [Google Scholar] [CrossRef] [PubMed]
Figure 1. Structure of the voltage-gated sodium channel. (A) The topology of the eukaryotic NaV channel. The voltage-sensing domains (VSDs) comprise four repeated segments (1–4) were colored in green. The segments 5 and 6, as well as the sequence between TM5 and TM6 (P1 loop) (Display in the B), that enclose to form the pore domain of the NaV were colored in cyan, orange, and magenta, respectively; (B) The cryo-EM structure of a eukaryotic NaV channel (PDB code: 5X0M). The structure contains four voltage-sensing domains and one pore domain. TMD represents transmembrane domain, while TM5 and TM6 represent the segments 5 and 6 of transmembrane domain; (C) Crystal structure of the prokaryotic sodium channel from Magnetococcus marinus (NaVMs) (PDB code: 4OXS). The structure of the NaVMs was colored according to the topology of the eukaryotic NaV channel.
Marinedrugs 16 00153 g001
Figure 2. Sequence, structure and function of μ-conotoxin PIIIA. (A) Sequence of the PIIIA, the 6 bold characters “C” represent cysteine residues allowing the formation of three disulfide bonds; (B) Nuclear magnetic resonance (NMR) structure of the PIIIA (PDB Code: 1R9I); (C) Varied specificity of PIIIA to different subtypes of the NaV.
Marinedrugs 16 00153 g002
Figure 3. Flowchart for prediction of the specificity of the μ-conotoxin PIIIA to varied NaV subtypes.
Marinedrugs 16 00153 g003
Figure 4. The binding modes of μ-conotoxin PIIIA at NaV1.4. The PIIIA and NaV1.4 were colored in orange and blue, respectively. The dashed lines show the hydrogen bonds or salt bridges. (A) The binding modes of NaV1.4/PIIIA; (B) The magnified show of the binding modes of NaV1.4/PIIIA in binding box.
Marinedrugs 16 00153 g004
Figure 5. Binding modes of PIIIA at different NaV subtypes. The PIIIA was shown in orange, and binding site of varied NaV subtype from NaV1.1 to NaV1.9 was colored in green (NaV1.1), cyan (NaV1.2), magenta (NaV1.3), light pink (NaV1.5), gray (NaV1.6), blue (NaV1.7), teal (NaV1.8) and chocolate (NaV1.9). Residues at PIIIA were labeled in italics. For clarity, the hydrogen bonds were not shown. (A) Binding modes of NaV1.1/PIIIA; (B) Binding modes of NaV1.2/PIIIA; (C) Binding modes of NaV1.3/PIIIA ; (D) Binding modes of NaV1.5/PIIIA; (E) Binding modes of NaV1.6/PIIIA; (F) Binding modes of NaV1.7/PIIIA; (G) Binding modes of NaV1.8/PIIIA; (H) Binding modes of NaV1.9/PIIIA.
Marinedrugs 16 00153 g005
Figure 6. Correlation between the binding energies derived from experiment and calculated using MM/GBSA and umbrella sampling. (A) The binding affinity of PIIIA to varied NaV subtypes was calculated using MMGB/SA method based on three MD trajectories of the top three models; (B) the binding affinity of PIIIA to varied NaV subtypes was calculated using umbrella sampling on the top three models. The Pearson relation coefficient (rp) and Spearman relation coefficient (rs) were used to characterize the correlation between the calculated binding affinities and experimentally derived values.
Marinedrugs 16 00153 g006
Figure 7. Energetic contribution of the residues at the binding site of varied NaV to the binding affinity of PIIIA. Residues at position 755, 758, 761, 1532 are conserved and are shown in bold. Residue side chain energetic contribution to the binding affinity of PIIIA to varied NaV subtypes from NaV1.1 to NaV1.9 are shown in different colors.
Marinedrugs 16 00153 g007
Table 1. Key pairwise interacting residues from PIIIA and binding site of the NaV1.1 to NaV1.9.
NaVR12 aR14 aQ15 aK17 aO18 aR20 a
NaV1.1E758, W761F401, N404, E755L408-N404, D1533A1536, D1541
NaV1.2E758, W761F401, N404, E758L408D1241N404, D1533A1536, D1541
NaV1.3E758, W761E755L408D1241N404, D1533A1536, D1541
NaV1.4E758, W761F401, N404, E755, E758L408D1241N404, D1533, N1536D1541
NaV1.5W761E755, E758Q408-R404D1541
NaV1.6E758, W761Y401, N404, E755L408-R1533L1536, D1541
NaV1.7W761F401, N404, E755, E758Q408-N404, D1533A1536, D1541
NaV1.8W761N404, E755Q408D1241, G1536D1532, D1536S1541
NaV1.9W761E755, E758Q408-D1532, S1536N1541
a Residues of the NaV within 4 Å from the key residues of PIIIA were listed in the table.
Table 2. Calculated binding affinities of PIIIA to varied NaV subtypes from NaV1.1 to NaV1.9.
NaVIC50MMGB/SA aUmbrella Sampling bExperimental (kcal/mol) c
NaV1.1120 nm−46.81 ± 2.61−11.97 ± 0.78−9.40
NaV1.2620 nm−46.36 ± 4.94−12.99 ± 1.21−8.43
NaV1.33.2 μm−41.74 ± 1.08−11.93 ± 0.87−7.46
NaV1.436 nm−41.82 ± 4.61−16.81 ± 0.49−10.11
NaV1.510 μm−37.83 ± 2.88−8.09 ± 1.44−6.79
NaV1.6100 nm−44.01 ± 1.51−18.95 ± 1.02−9.51
NaV1.7>10 μm−42.53 ± 1.86−7.94 ± 1.80−7.48
NaV1.8>10 μm−38.00 ± 2.55−10.68 ± 2.84−7.07
NaV1.9-−29.24 ± 5.03−9.41 ± 2.01-
a The binding affinities of PIIIA to varied NaV subtypes were calculated using MMGB/SA method. Twenty MD simulations were performed on the top 3 PIIIA/NaV models from homology modeling. The MMGB/SA calculation was performed on the last 10 ns of the five MD trajectories; b The binding affinities of PIIIA were calculated using umbrella sampling (US) on the top 3 PIIIA/NaV models; c Binding affinities of PIIIA were derived from the IC50 of PIIIA to varied NaV subtypes from NaV1.1 to NaV1.9 using ∆G = −RTln(IC50).

