Microginins from a Microcystis sp. Bloom Material Collected from the Kishon Reservoir, Israel


Abstract

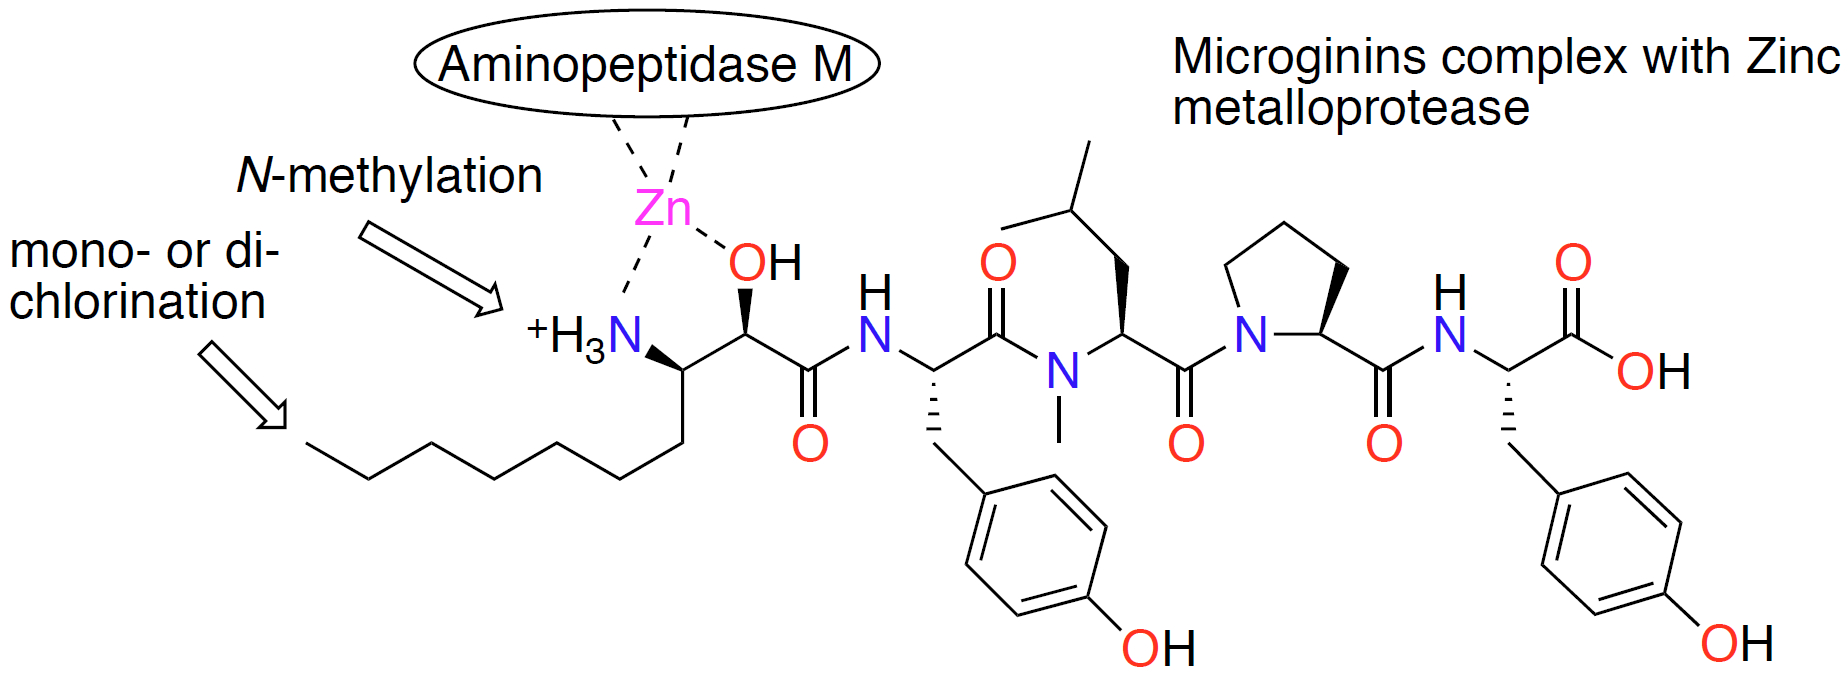
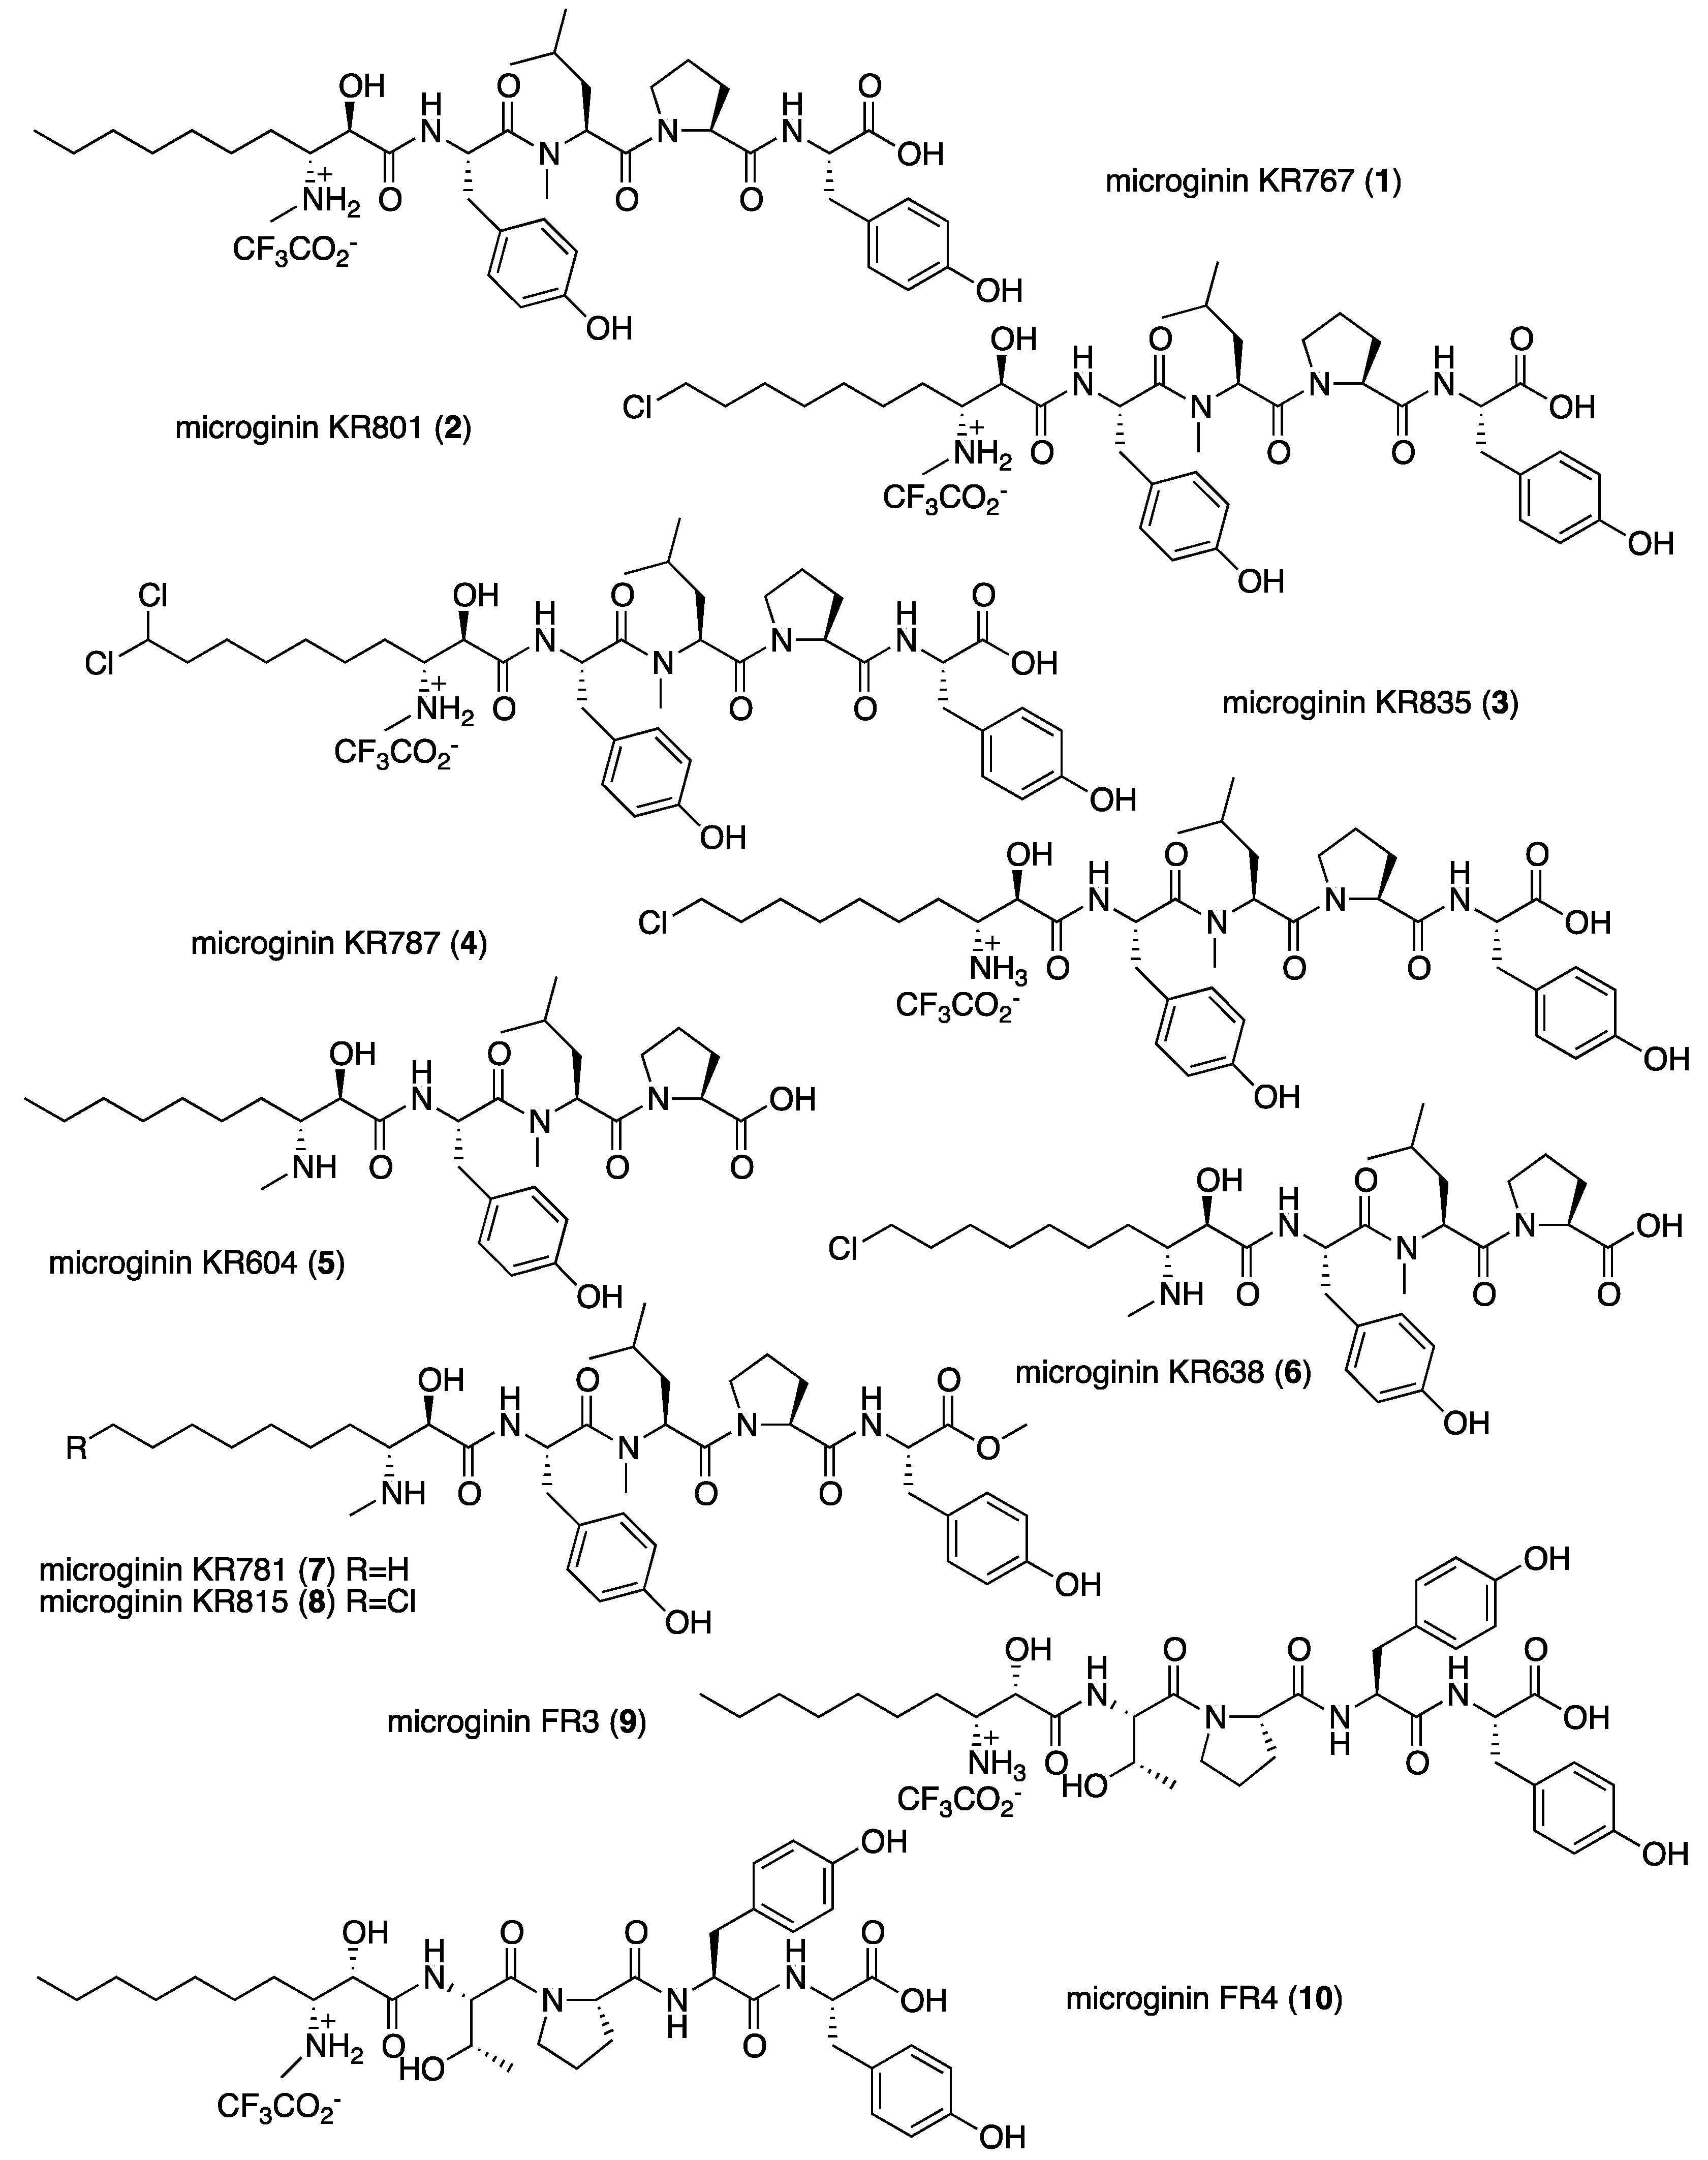
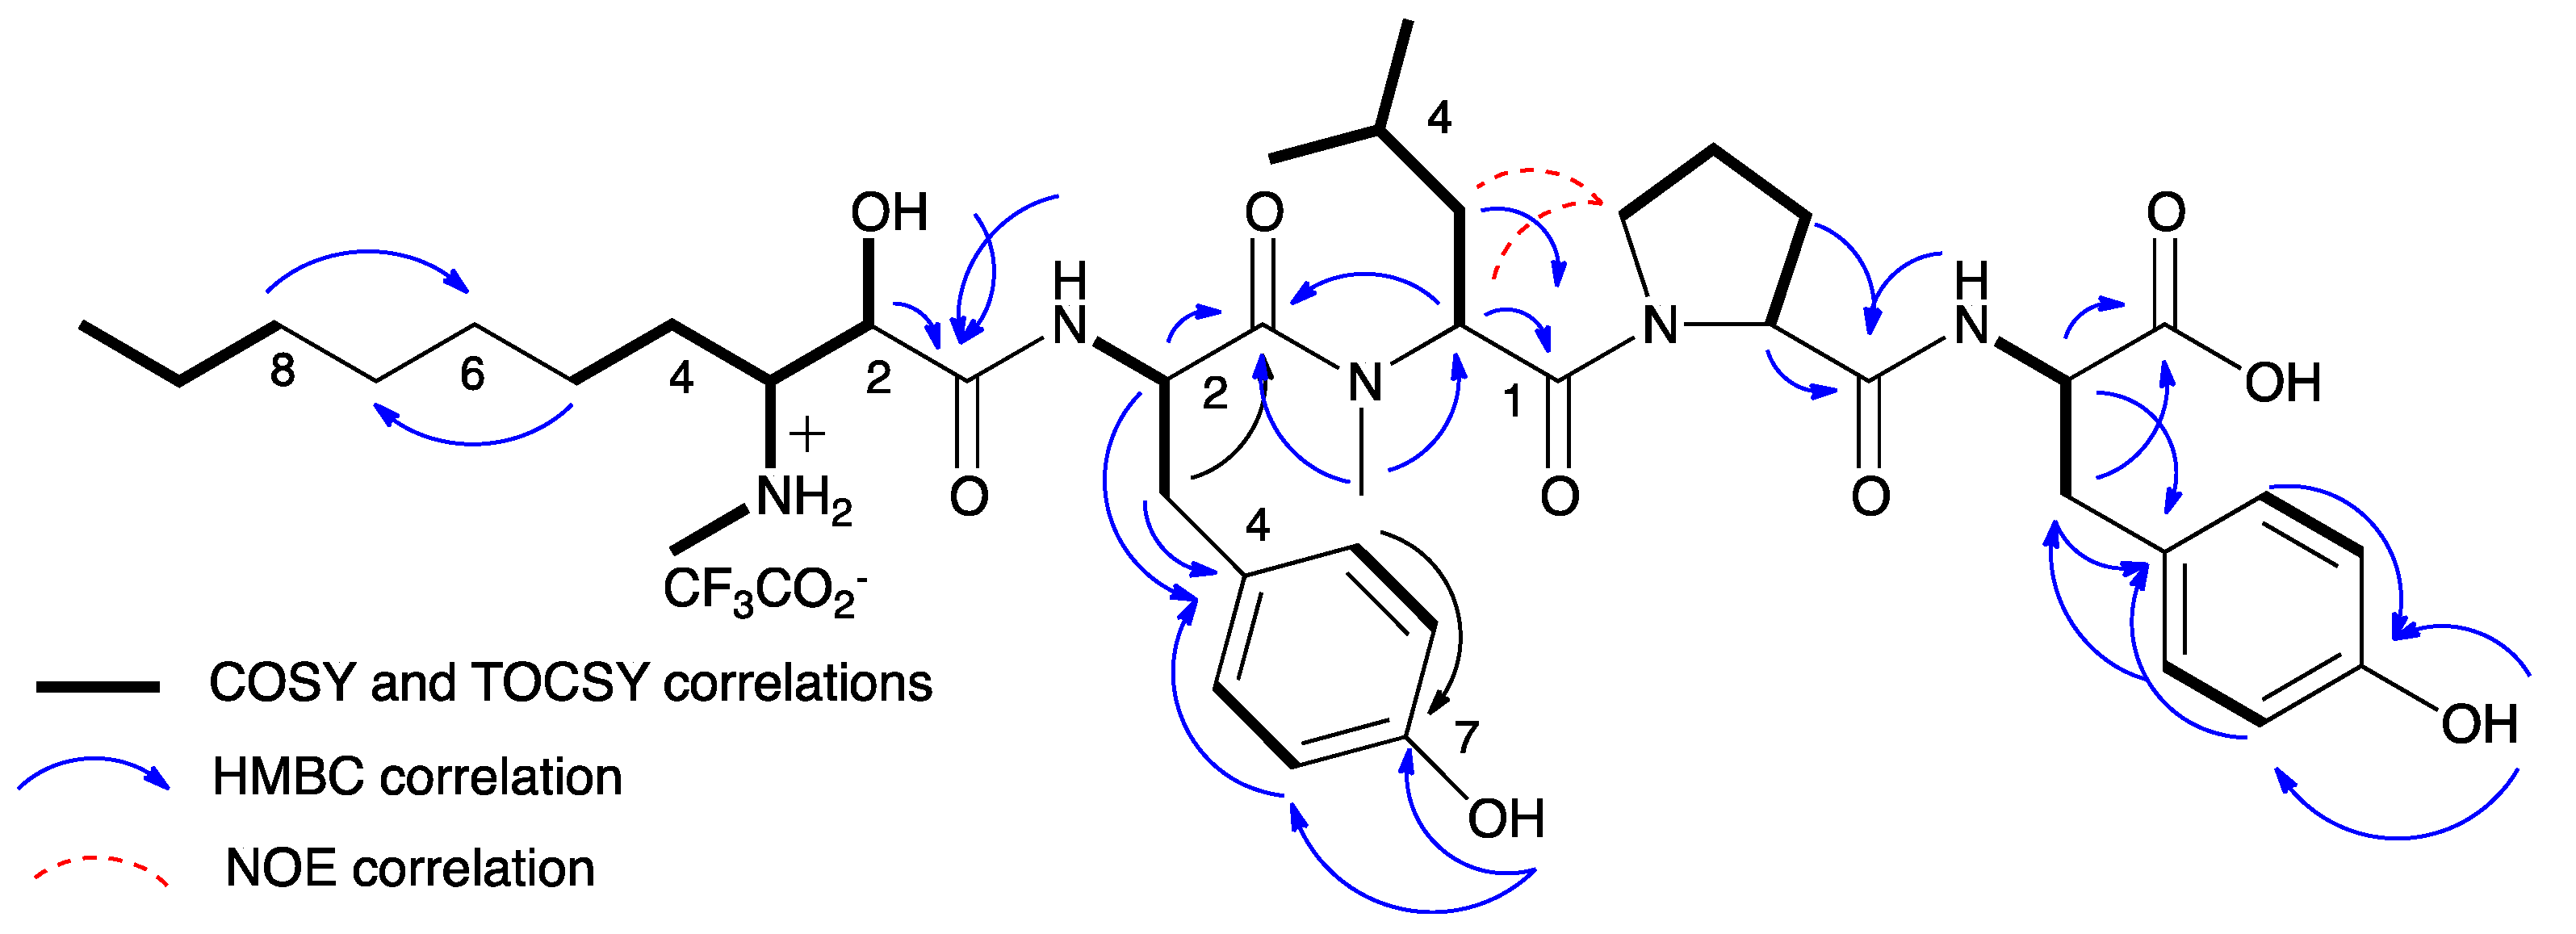
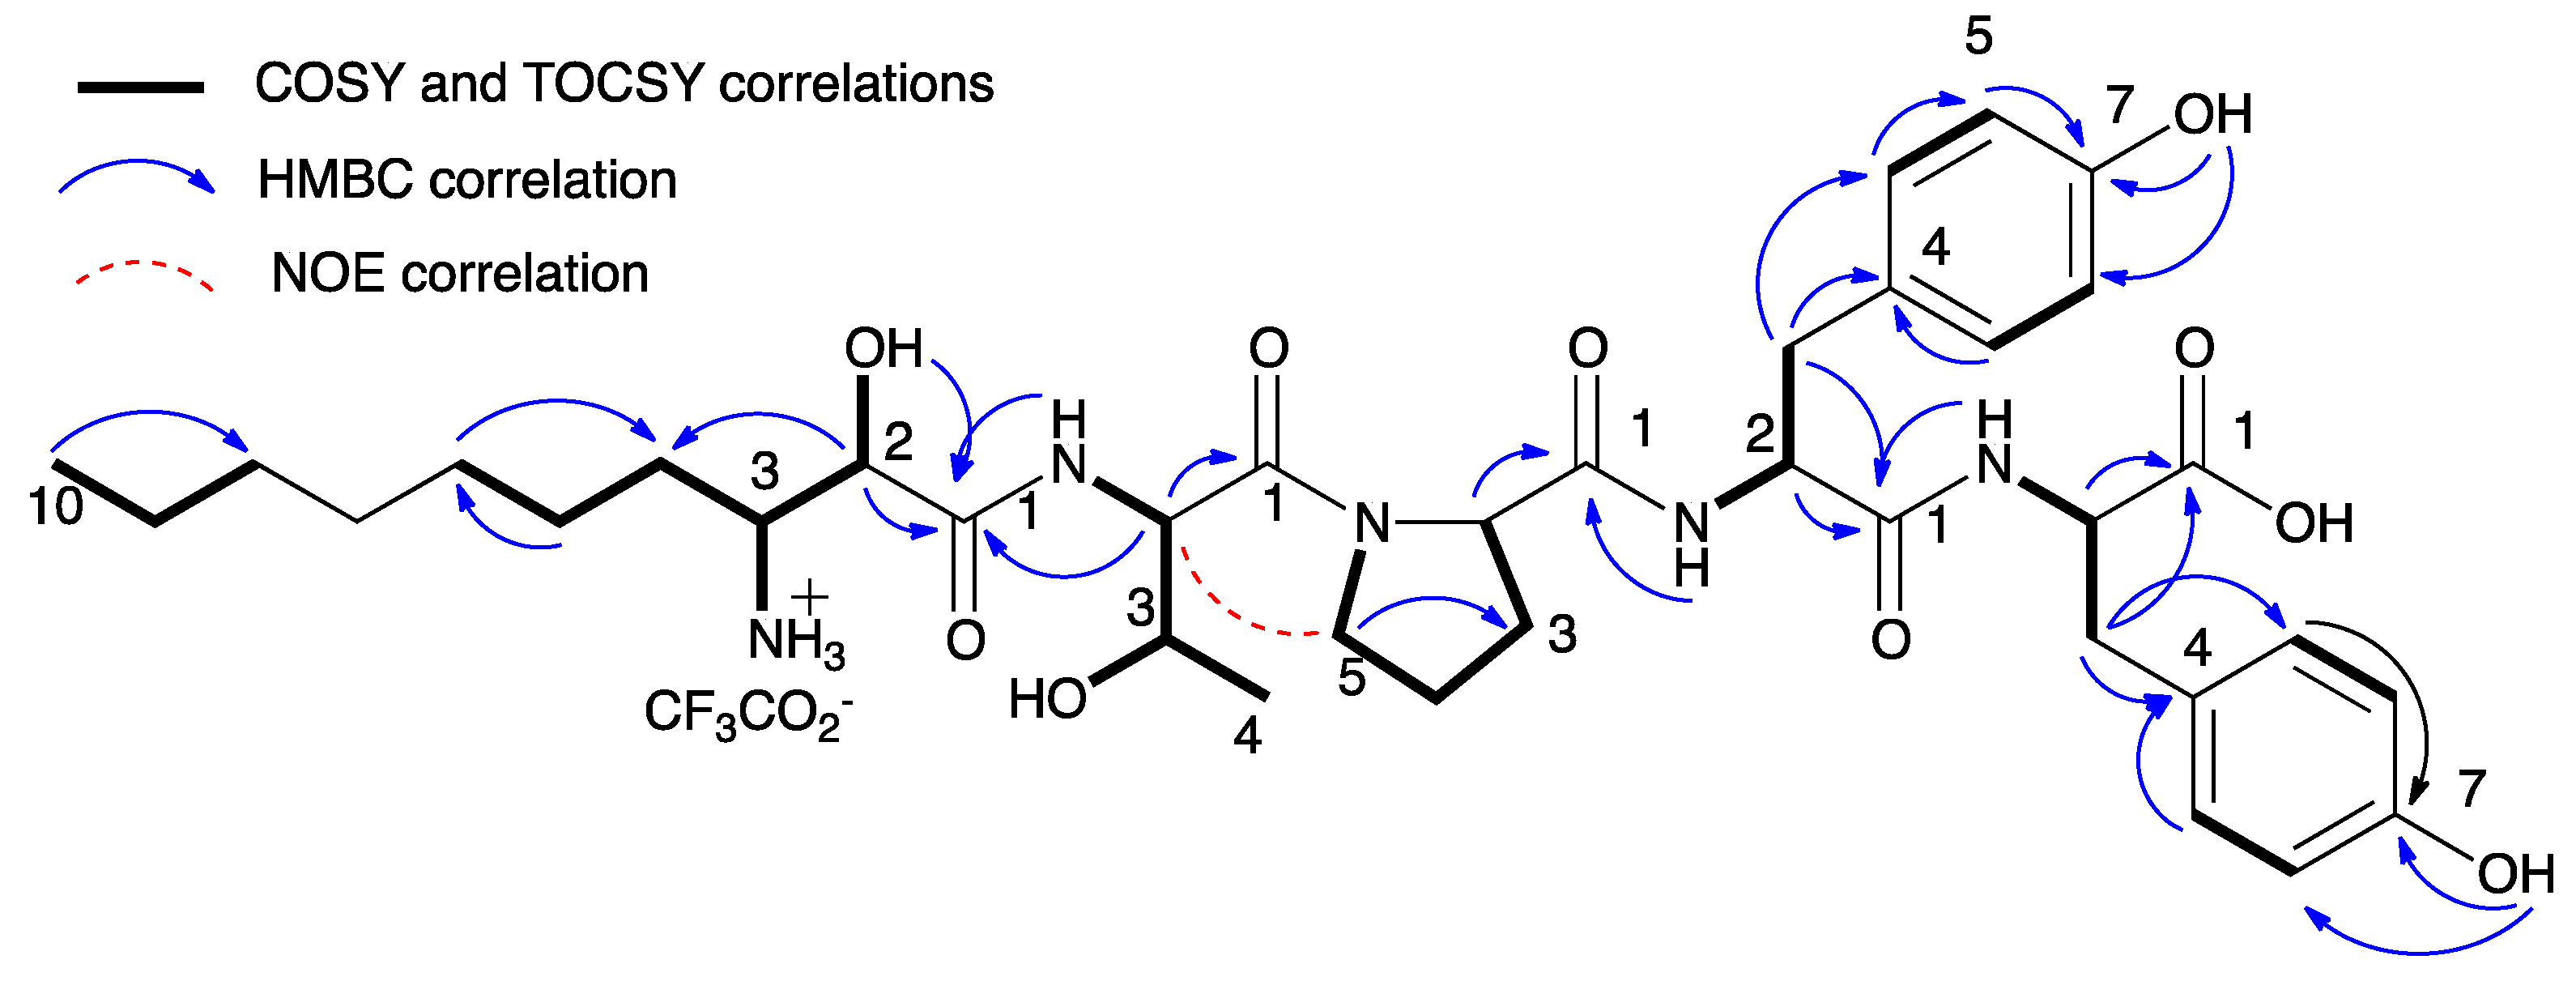
1. Introduction
2. Results and Discussion
3. Materials and Methods
3.1. General Experimental Procedures
3.2. Biological Material
3.3. Isolation Procedure
3.4. Determination of the Absolute Configuration of the Amino Acids by Marfey’s Method
3.5. Aminopeptidase M Inhibitory Assay
4. Conclusions
Supplementary Materials
Acknowledgments
Author Contributions
Conflicts of Interest
References
- Chlipala, G.E.; Mo, S.; Orjala, J. Chemodiversity in freshwater and terrestrial cyanobacteria—A source for drug discovery. Curr. Drug Targets 2011, 12, 1654–1673. [Google Scholar] [CrossRef] [PubMed]
- Sivonen, K.; Jones, G. Cyanobacterial toxins. In Toxic Cyanobacteria in Water; Chorus, I., Bartram, J., Eds.; E&FN Spon: London, UK, 1999; pp. 41–111. [Google Scholar]
- Martin, C.; Oberer, L.; Ino, T.; Konig, W.A.; Busch, M.; Weckesser, J. Cyanopeptolins, new depsipeptides from the cyanobacterium Microcystis sp. PCC 7806. J. Antibiot. 1993, 46, 1550–1556. [Google Scholar] [CrossRef] [PubMed]
- Murakami, M.; Okita, Y.; Matsuda, H.; Okino, T.; Yamaguchi, K. Aeruginosin 298-A, a thrombin and trypsin inhibitor from the blue-green alga Microcystis aeruginosa (NIES-298). Tetrahedron Lett. 1994, 35, 3129–3132. [Google Scholar] [CrossRef]
- Harada, K.; Fujii, K.; Shimada, T.; Suzuki, M.; Sano, H.; Adachi, K.; Carmichael, W.W. Two cyclic peptides, anabaenopeptins, a third group of bioactive compounds from the cyanobacterium Anabaena flos-aquae NRC 525-17. Tetrahedron Lett. 1995, 36, 1511–1514. [Google Scholar] [CrossRef]
- Ishitsuka, M.O.; Kusumi, T.; Kakisawa, H.; Kaya, K.; Watanabe, M.M. Microviridin: A novel tricyclic depsipeptide from the toxic cyanobacterium Microcystis viridis. J. Am. Chem. Soc. 1990, 112, 8180–8182. [Google Scholar] [CrossRef]
- Okino, T.; Matsuda, H.; Murakami, M.; Yamaguchi, K. Microginin, an angiotensin-converting enzyme inhibitor from the blue-green alga Microcystis aeruginosa. Tetrahedron Lett. 1993, 34, 501–504. [Google Scholar] [CrossRef]
- Ishida, K.; Matsuda, H.; Murakami, M. Four new microginins, linear peptides from the cyanobacterium Microcystis aeruginosa. Tetrahedron 1998, 54, 13475–13484. [Google Scholar] [CrossRef]
- Strangman, W.K.; Wright, J.L.C. Microginins 680, 646, and 612—New chlorinated Ahoa-containing peptides from a strain of cultured Microcystis aeruginosa. Tetrahedron Lett. 2016, 57, 1801–1803. [Google Scholar] [CrossRef]
- Ishida, K.; Kato, T.; Murakami, M.; Watanabe, M.; Watanabe, M.F. Microginins, zinc metalloproteases inhibitors from the cyanobacterium Microcystis aeruginosa. Tetrahedron 2000, 56, 8643–8656. [Google Scholar] [CrossRef]
- Welker, M.; Marsalek, B.; Sejnohova, L.; von Doehren, H. Cyanobacterial peptides—Nature’s own combinatorial biosynthesis. Peptides 2006, 27, 2090–2103. [Google Scholar] [CrossRef] [PubMed]
- Carneiro, R.L.; Dorr, F.A.; Dorr, F.; Bortoli, S.; Delherbe, N.; Vasquez, M.; Pinto, E. Co-occurrence of microcystins and microginin congeners in Brazilian strains of Microcystis sp. FEMS Microbiol. Ecol. 2012, 82, 692–702. [Google Scholar] [CrossRef] [PubMed]
- Vegman, R.; Carmeli, S. Three aeruginosins and a microviridin from a bloom assembly of Microcystis spp. collected from a fishpond near Kibbutz Lehavot HaBashan, Israel. Tetrahedron 2014, 70, 6817–6824. [Google Scholar] [CrossRef]
- Marfey, P. Determination of d-amino acids. II. Use of a bifunctional reagent, 1,5-difluoro-2,4-dinitrobenzene. Carlsberg Res. Commun. 1984, 49, 591–596. [Google Scholar] [CrossRef]
- Fujii, K.; Ikai, Y.; Mayumi, T.; Oka, H.; Suzuki, M.; Harada, K. A nonempirical method using LC/MS for determination of the absolute configuration of constituent amino acids in a peptide: Elucidation of limitations of Marfey’s method and of its separation mechanism. Anal. Chem. 1997, 69, 3346–3352. [Google Scholar] [CrossRef]
- Dale, J.A.; Mosher, H.S. Nuclear magnetic resonance enantiomer reagents. Configurational correlations via nuclear magnetic resonance chemical shifts of diastereomeric mandelate, O-methylmandelate and α-methoxy-α-trifluoromethylphenylacetate (MTPA) esters. J. Am. Chem. Soc. 1973, 95, 512–519. [Google Scholar] [CrossRef]
- Gesner-Apter, S.; Carmeli, S. Three novel metabolites from a bloom of the cyanobacterium Microcystis sp. Tetrahedron 2008, 64, 6628–6634. [Google Scholar] [CrossRef]
- Kraft, M.; Schleberger, C.; Weckesser, J.; Schultz, G.E. Binding structure of the leucine aminopeptidase inhibitor microginin FR1. FEBS Lett. 2006, 580, 6943–6947. [Google Scholar] [CrossRef] [PubMed]
- Sebaugh, J.L. Guidelines for accurate EC50/IC50 estimation. Pharm. Stat. 2011, 10, 128–134. [Google Scholar] [CrossRef] [PubMed]
- Burja, A.M.; Banaigs, B.; Abou-Mansour, E.; Burgess, J.G.; Wright, P.C. Marine cyanobacteria—A prolific source of natural products. Tetrahedron 2001, 57, 9347–9377. [Google Scholar] [CrossRef]
- Tan, L.T. Bioactive natural products from marine cyanobacteria for drug discovery. Phytochemistry 2007, 68, 954–979. [Google Scholar] [CrossRef] [PubMed]


| Position | 1 | 2 | 3 | 4 | 5 | 6 | 7 | 8 | Position | 9 | 10 |
|---|---|---|---|---|---|---|---|---|---|---|---|
| Ahda 2 | 4.30 | 4.30 | 4.30 | 4.14 | 4.26 | 4.29 | 4.30 | 4.30 | Ahda 2 | 4.10 | 4.18 |
| 2-OH | 6.47 | 6.47 | 6.46 | 6.35 | 6.35 | 6.41 | 6.35 | 6.40 | 2-OH | 6.61 | 6.82 |
| 3 | 3.27 | 3.27 | 3.27 | 3.27 | 3.14 | 3.24 | 3.22 | 3.24 | 3 | 3.22 | 3.30 |
| 3-NH1/2/3 | 8.35 | 8.36 | 8.35 | 7.83 | 8.00 | 7.24 | 8.42 | 8.42 | 3-NH2/3 | 7.71 | 8.17 |
| 8.49 | 8.49 | 8.48 | 8.36 | ||||||||
| 3-NCH3 | 2.56 | 2.56 | 2.56 | - | 2.51 | 2.55 | 2.53 | 2.55 | 3-NCH3 | - | 2.50 |
| 4 | 1.39 | 1.39 | 1.40 | 1.37 | 1.34 | 1.41 | 1.36 | 1.39 | 4 | 1.59 | 1.58 |
| 1.33 | 1.32 | 1.33 | 1.22 | 1.28 | 1.33 | 1.32 | 1.31 | 1.44 | 1.55 | ||
| 5 | 1.25 | 1.23 | 1.24 | 1.26 | 1.27 | 1.38 | 1.24 | 1.24 | 5 | 1.34 | 1.33 |
| 1.13 | 1.11 | 1.14 | 1.12 | 1.13 | 1.14 | 1.13 | 1.13 | 1.29 | 1.30 | ||
| 6 | 1.18 | 1.13 | 1.22 | 1.13 | 1.14 | 1.15 | 1.17 | 1.13 | 6 | 1.23 | 1.23 |
| 1.13 | 1.15 | 1.13 | |||||||||
| 7 | 1.19 | 1.18 | 1.24 | 1.22 | 1.19 | 1.22 | 1.20 | 1.22 | 7 | 1.23 | 1.23 |
| 8 | 1.20 | 1.33 | 1.43 | 1.34 | 1.20 | 1.34 | 1.20 | 1.33 | 8 | 1.23 | 1.23 |
| 9 | 1.24 | 1.68 | 2.13 | 1.68 | 1.26 | 1.68 | 1.25 | 1.67 | 9 | 1.24 | 1.24 |
| 10 | 0.84 | 3.60 | 6.29 | 3.60 | 0.84 | 3.60 | 0.84 | 3.60 | 10 | 0.85 | 0.85 |
| 1Tyr 2 | 4.86 | 4.86 | 4.86 | 4.84 | 4.87 | 4.86 | 4.86 | 4.86 | Thr 2 | 4.48 | 4.47 |
| 2-NH | 8.10 | 8.09 | 8.09 | 8.04 | 8.03 | 8.09 | 8.05 | 8.09 | 2-NH | 7.86 | 7.91 |
| 3 | 2.86 | 2.86 | 2.86 | 2.88 | 2.87 | 2.87 | 2.87 | 2.85 | 3 | 3.94 | 3.93 |
| 2.74 | 2.74 | 2.74 | 2.74 | 2.74 | 2.75 | 2.74 | 2.74 | ||||
| 5,5′ | 7.00 | 7.00 | 7.01 | 7.00 | 6.98 | 6.99 | 6.99 | 6.99 | 3-OH | 5.13 | 5.10 |
| 6,6′ | 6.62 | 6.62 | 6.62 | 6.62 | 6.61 | 6.62 | 6.62 | 6.62 | 4 | 1.14 | 1.14 |
| 7-OH | 9.25 | 9.26 | 9.26 | 9.24 | 9.24 | 9.25 | 9.25 | 9.25 | |||
| MeLue 2 | 5.23 | 5.23 | 5.23 | 5.23 | 5.24 | 5.24 | 5.23 | 5.23 | Pro 2 | 4.32 | 4.32 |
| 2-NCH3 | 2.89 | 2.90 | 2.90 | 2.88 | 2.86 | 2.87 | 2.88 | 2.89 | 3 | 1.90 | 1.90 |
| 1.69 | 1.70 | ||||||||||
| 3 | 1.48 | 1.45 | 1.46 | 1.45 | 1.53 | 1.53 | 1.47 | 1.47 | 4 | 1.74 | 1.74 |
| 1.42 | 1.42 | 1.42 | 1.42 | 1.36 | 1.38 | 1.42 | 1.41 | 1.62 | 1.65 | ||
| 4 | 1.37 | 1.35 | 1.37 | 1.37 | 1.39 | 1.39 | 1.38 | 1.38 | 5 | 3.63 | 3.64 |
| 5 | 0.81 | 0.81 | 0.81 | 0.80 | 0.82 | 0.82 | 0.81 | 0.81 | 1Tyr 2 | 4.38 | 4.38 |
| 6 | 0.85 | 0.85 | 0.85 | 0.85 | 0.85 | 0.86 | 0.85 | 0.85 | 2-NH | 7.64 | 7.64 |
| Pro 2 | 4.31 | 4.31 | 4.32 | 4.30 | 4.17 | 4.18 | 4.29 | 4.29 | 3 | 2.87 | 2.87 |
| 2.62 | 2.63 | ||||||||||
| 3 | 1.94 | 1.95 | 1.94 | 1.94 | 2.10 | 2.11 | 1.95 | 1.97 | 5,5′ | 7.00 | 7.00 |
| 1.79 | 1.79 | 1.79 | 1.81 | 1.82 | 1.82 | 1.73 | 1.74 | ||||
| 4 | 1.80 | 1.76 | 1.80 | 1.81 | 1.86 | 1.86 | 1.80 | 1.78 | 6,6′ | 6.61 | 6.60 |
| 1.73 | 1.73 | 1.73 | 1.76 | 1.81 | 1.81 | 1.75 | 1.73 | ||||
| 5 | 3.40 | 3.40 | 3.40 | 3.40 | 3.40 | 3.41 | 3.39 | 3.40 | 7-OH | 9.13 | 9.12 |
| 3.18 | 3.18 | 3.19 | 3.18 | 3.24 | 3.26 | 3.17 | 3.18 | ||||
| 2Tyr 2 | 4.27 | 4.27 | 4.26 | 4.27 | - | - | 4.31 | 4.30 | 2Tyr 2 | 4.31 | 4.31 |
| 2-NH | 7.92 | 7.92 | 7.92 | 7.93 | - | - | 8.15 | 8.15 | 2-NH | 8.03 | 8.04 |
| 3 | 2.86 | 2.86 | 2.87 | 2.88 | - | - | 2.86 | 2.86 | 3 | 2.89 | 2.90 |
| 2.79 | 2.78 | 2.78 | 2.78 | 2.82 | 2.82 | 2.79 | 2.79 | ||||
| 5,5′ | 7.01 | 7.01 | 7.00 | 6.99 | - | - | 7.00 | 7.00 | 5,5′ | 7.00 | 7.00 |
| 6,6′ | 6.64 | 6.64 | 6.64 | 6.62 | - | - | 6.64 | 6.64 | 6,6′ | 6.63 | 6.63 |
| 7-OH | 9.20 | 9.21 | 9.20 | 9.19 | - | - | 9.23 | 9.23 | 7-OH | 9.18 | 9.17 |
| OCH3 | - | - | - | - | - | - | 3.53 | 3.53 |
| Position | 1 | 2 | 3 | 4 | 5 | 6 | 7 | 8 | Position | 9 | 10 |
|---|---|---|---|---|---|---|---|---|---|---|---|
| Ahda 1 | 170.1 | 170.1 | 170.1 | 170.2 | 170.5 | 170.1 | 170.2 | 170.1 | Ahda 1 | 170.8 | 171.2 |
| 2 | 68.5 | 68.4 | 68.5 | 70.9 | 68.7 | 68.4 | 68.5 | 68.4 | 2 | 69.6 | 68.2 |
| 3 | 60.3 | 60.3 | 60.2 | 53.4 | 60.5 | 60.2 | 60.3 | 60.3 | 3 | 53.1 | 60.1 |
| 3-NCH3 | 30.8 | 30.8 | 30.8 | - | 31.4 | 30.8 | 30.8 | 30.8 | 3-NCH3 | - | 31.3 |
| 4 | 26.1 | 26.0 | 26.0 | 26.8 | 25.4 | 26.1 | 26.1 | 26.0 | 4 | 28.8 | 27.9 |
| 5 | 25.2 | 25.1 | 25.0 | 25.0 | 24.2 | 25.2 | 25.3 | 25.1 | 5 | 24.8 | 25.1 |
| 6 | 29.2 | 29.0 | 28.9 | 29.0 | 28.6 | 29.1 | 29.2 | 29.0 | 6 | 28.5 | 28.6 |
| 7 | 28.6 | 28.2 | 27.8 | 28.2 | 29.2 | 28.2 | 28.6 | 28.2 | 7 | 28.9 | 28.9 |
| 8 | 31.4 | 26.3 | 25.4 | 26.4 | 31.3 | 26.4 | 31.4 | 26.4 | 8 | 31.3 | 31.4 |
| 9 | 22.2 | 32.2 | 43.0 | 32.2 | 22.2 | 32.2 | 22.3 | 32.2 | 9 | 22.2 | 22.2 |
| 10 | 14.1 | 45.4 | 75.0 | 45.6 | 14.1 | 45.5 | 14.1 | 45.5 | 10 | 14.1 | 14.1 |
| 1Tyr 1 | 171.0 | 171.0 | 171.0 | 171.2 | 171.0 | 171.0 | 171.0 | 171.0 | Thr 1 | 168.6 | 168.5 |
| 2 | 50.6 | 50.6 | 50.6 | 50.7 | 50.4 | 50.5 | 50.6 | 50.6 | 2 | 56.0 | 56.2 |
| 3 | 36.4 | 36.4 | 36.4 | 36.3 | 36.6 | 36.5 | 36.4 | 36.4 | 3 | 67.0 | 67.0 |
| 4 | 126.1 | 126.9 | 126.9 | 127.0 | 126.9 | 126.9 | 126.9 | 126.9 | 4 | 19.3 | 19.5 |
| 5,5′ | 130.2 | 130.3 | 130.3 | 130.4 | 130.3 | 130.3 | 130.3 | 130.3 | Pro 1 | 171.0 | 171.0 |
| 6,6′ | 115.1 | 115.1 | 115.1 | 115.2 | 115.1 | 115.0 | 115.2 | 115.2 | 2 | 59.5 | 59.5 |
| 7 | 156.2 | 156.2 | 156.2 | 156.2 | 156.2 | 156.0 | 156.2 | 156.2 | 3 | 29.0 | 29.1 |
| NMeLeu 1 | 168.5 | 168.5 | 168.5 | 168.5 | 168.3 | 168.3 | 168.4 | 168.4 | 4 | 24.2 | 24.2 |
| 2 | 51.9 | 51.9 | 51.9 | 52.0 | 51.6 | 51.7 | 51.9 | 51.9 | 5 | 47.4 | 47.5 |
| 2-NCH3 | 30.2 | 30.2 | 30.2 | 30.2 | 30.1 | 30.2 | 30.2 | 30.2 | 1Tyr 1 | 171.0 | 171.0 |
| 3 | 37.2 | 37.1 | 37.2 | 37.2 | 37.2 | 37.2 | 37.2 | 37.1 | 2 | 54.1 | 54.2 |
| 4 | 24.2 | 24.3 | 24.2 | 24.3 | 24.2 | 24.2 | 24.3 | 24.2 | 3 | 36.6 | 36.7 |
| 5 | 22.4 | 22.3 | 22.4 | 22.3 | 22.4 | 22.5 | 22.4 | 22.4 | 4 | 127.8 | 127.9 |
| 6 | 23.0 | 23.1 | 23.1 | 23.2 | 22.8 | 22.9 | 23.0 | 23.1 | 5,5′ | 130.2 | 130.2 |
| Pro 1 | 171.4 | 171.5 | 171.5 | 171.5 | 173.4 | 173.2 | 171.7 | 171.7 | 6,6′ | 114.9 | 115.0 |
| 2 | 59.4 | 59.4 | 59.4 | 59.4 | 58.8 | 58.8 | 59.3 | 59.3 | 7 | 155.9 | 155.9 |
| 3 | 29.1 | 29.1 | 29.1 | 29.1 | 28.8 | 28.8 | 29.2 | 29.1 | 2Tyr 1 | 172.9 | 172.9 |
| 4 | 24.3 | 24.2 | 24.3 | 24.1 | 24.6 | 24.6 | 24.2 | 24.3 | 2 | 53.9 | 54.0 |
| 5 | 46.7 | 46.7 | 46.7 | 46.7 | 46.5 | 46.5 | 46.7 | 46.7 | 3 | 36.2 | 36.2 |
| 2Tyr 1 | 173.1 | 173.1 | 173.1 | 173.1 | - | - | 172.2 | 172.2 | 4 | 127.4 | 127.4 |
| 2 | 54.0 | 54.0 | 54.0 | 54.1 | - | - | 54.3 | 54.2 | 5,5′ | 130.2 | 130.3 |
| 3 | 36.1 | 36.1 | 36.1 | 36.2 | - | - | 36.1 | 36.1 | 6,6′ | 115.1 | 115.1 |
| 4 | 127.5 | 127.5 | 127.6 | 127.6 | - | - | 127.2 | 127.2 | 7 | 156.1 | 156.1 |
| 5,5′ | 130.3 | 130.3 | 130.3 | 130.3 | - | - | 130.2 | 130.2 | |||
| 6,6′ | 115.1 | 115.1 | 115.1 | 115.2 | - | - | 115.2 | 115.1 | |||
| 7 | 156.1 | 156.1 | 156.1 | 156.1 | - | - | 156.2 | 156.2 | |||
| OCH3 | - | - | - | - | - | - | 51.9 | 51.8 |
| Compound | Ahda Derivative | Absolute Configuration | C-2 | H-2 | C-3 | H-3 |
|---|---|---|---|---|---|---|
| Microginin [7] | Ahda | (2S,3R) | 69.5 | 4.04 | 52.9 | 3.21 |
| Microginin 51-A [10] | Ahda | (2S,3S) | 70.4 | 4.14 | 52.9 | 3.24 |
| Microginin 51-B [10] | NMe-Ahda | (2S,3S) | 68.1 | 4.28 | 59.8 | 3.22 |
| Microginin 478 [10] | NMe-Ahda | (2S,3S) | 68.3 | 4.18 | 60.0 | 3.20 |
| Microginin 91-A [10] | Cl-Ahda | (2R,3R) | 70.5 | 4.26 | 53.0 | 3.36 |
| Microginin 91-C [10] | Ahda | (2R,3R) | 71.0 | 4.18 | 52.8 | 3.27 |
| Microginin 91-D [10] | Cl-Ahda | (2R,3R) | 70.5 | 4.26 | 53.0 | 3.36 |
| Microginin 91-E [10] | Cl2-Ahda | (2R,3R) | 70.7 | 4.26 | 53.0 | 3.36 |
| Microginin 299-A [8] | Cl-Ahda | (2S,3S) | 70.6 | 4.23 | 53.0 | 3.37 |
| Microginin 299-B [8] | Cl2-Ahda | (2S,3S) | 70.6 | 4.25 | 52.9 | 3.37 |
| Microginin 299-C [8] | Ahda | (2S,3S) | 70.6 | 4.20 | 53.0 | 3.37 |
| Microginin 299-D [8] | Cl2-Ahda | (2S,3S) | 70.6 | 4.21 | 52.9 | 3.36 |
| Microginin AL584 [17] | Cl-Ahda | (2S,3S) | 71.3 | 4.19 | 53.3 | 3.30 |
| Microginin KR767 (1) | NMe-Ahda | (2R,3R) | 68.5 | 4.30 | 60.3 | 3.27 |
| Microginin KR801 (2) | Cl-NMe-Ahda | (2R,3R) | 68.4 | 4.30 | 60.3 | 3.27 |
| Microginin KR835 (3) | Cl2-NMe-Ahda | (2R,3R) | 68.5 | 4.30 | 60.2 | 3.27 |
| Microginin KR787 (4) | Cl-Ahda | (2R,3R) | 70.9 | 4.14 | 53.4 | 3.27 |
| Microginin KR604 (5) | NMe-Ahda | (2R,3R) | 68.7 | 4.26 | 60.5 | 3.14 |
| Microginin KR638 (6) | Cl-NMe-Ahda | (2R,3R) | 68.4 | 4.29 | 60.2 | 3.24 |
| Microginin KR781 (7) | NMe-Ahda | (2R,3R) | 68.5 | 4.30 | 60.3 | 3.22 |
| Microginin KR815 (8) | Cl-NMe-Ahda | (2R,3R) | 68.4 | 4.30 | 60.3 | 3.24 |
| Microginin FR3 (9) | Ahda | (2S,3R) | 69.4 | 4.10 | 53.1 | 3.22 |
| Microginin FR4 (10) | NMe-Ahda | (2S,3R) | 68.0 | 4.18 | 60.1 | 3.30 |
| Compound Name | IC50 in μM ± SD | Compound Name | IC50 in μM ± SD |
|---|---|---|---|
| Microginin KR767 (1) | 0.5 ± 0.2 | Microginin KR638 (6) | 3.8 ± 0.3 |
| Microginin KR801 (2) | 0.1 ± 0.2 | Microginin KR815 (8) | 72.0 ± 0.1 |
| Microginin KR835 (3) | 0.4 ± 0.2 | Microginin FR3 (9) | 6.2 ± 0.03 |
| Microginin KR787 (4) | 5.7 ± 0.1 | Microginin FR4 (10) | 1.8 ± 0.04 |
| Microginin KR604 (5) | 7.5 ± 0.1 | - | - |
© 2018 by the authors. Licensee MDPI, Basel, Switzerland. This article is an open access article distributed under the terms and conditions of the Creative Commons Attribution (CC BY) license (http://creativecommons.org/licenses/by/4.0/).
Share and Cite
Lodin-Friedman, A.; Carmeli, S. Microginins from a Microcystis sp. Bloom Material Collected from the Kishon Reservoir, Israel. Mar. Drugs 2018, 16, 78. https://doi.org/10.3390/md16030078
Lodin-Friedman A, Carmeli S. Microginins from a Microcystis sp. Bloom Material Collected from the Kishon Reservoir, Israel. Marine Drugs. 2018; 16(3):78. https://doi.org/10.3390/md16030078
Chicago/Turabian StyleLodin-Friedman, Anat, and Shmuel Carmeli. 2018. "Microginins from a Microcystis sp. Bloom Material Collected from the Kishon Reservoir, Israel" Marine Drugs 16, no. 3: 78. https://doi.org/10.3390/md16030078
APA StyleLodin-Friedman, A., & Carmeli, S. (2018). Microginins from a Microcystis sp. Bloom Material Collected from the Kishon Reservoir, Israel. Marine Drugs, 16(3), 78. https://doi.org/10.3390/md16030078