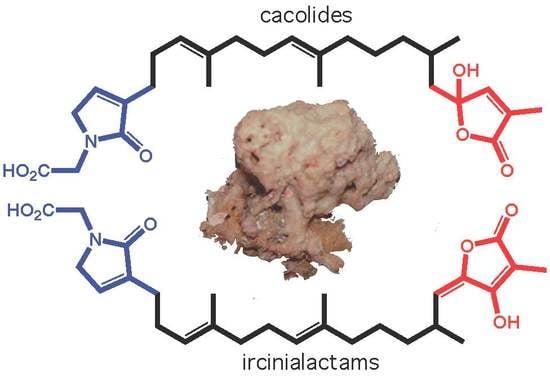
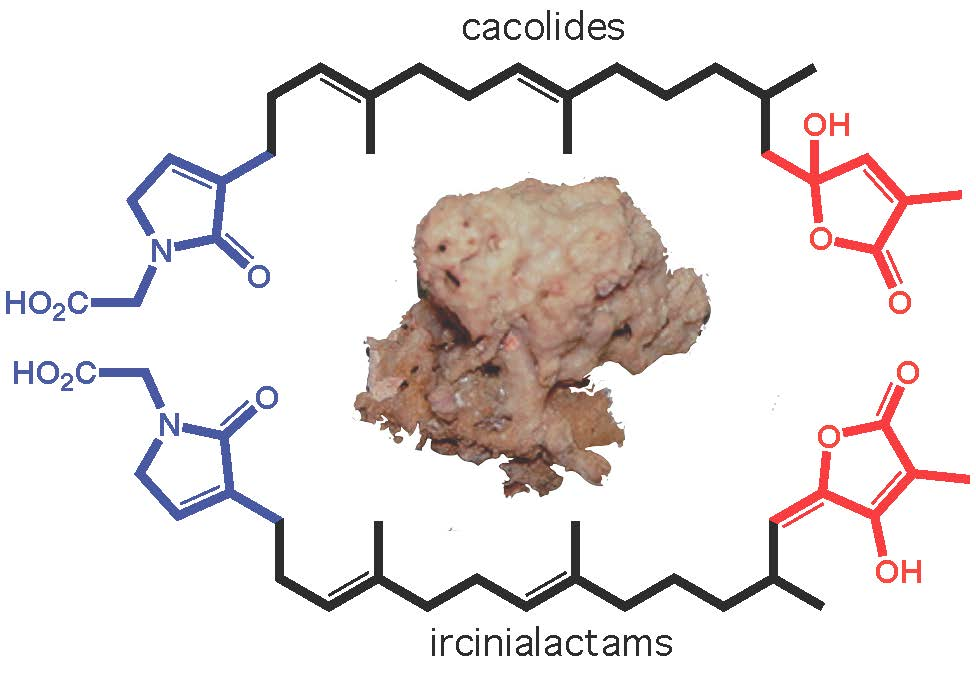
Cacolides: Sesterterpene Butenolides from a Southern Australian Marine Sponge, Cacospongia sp.


Abstract
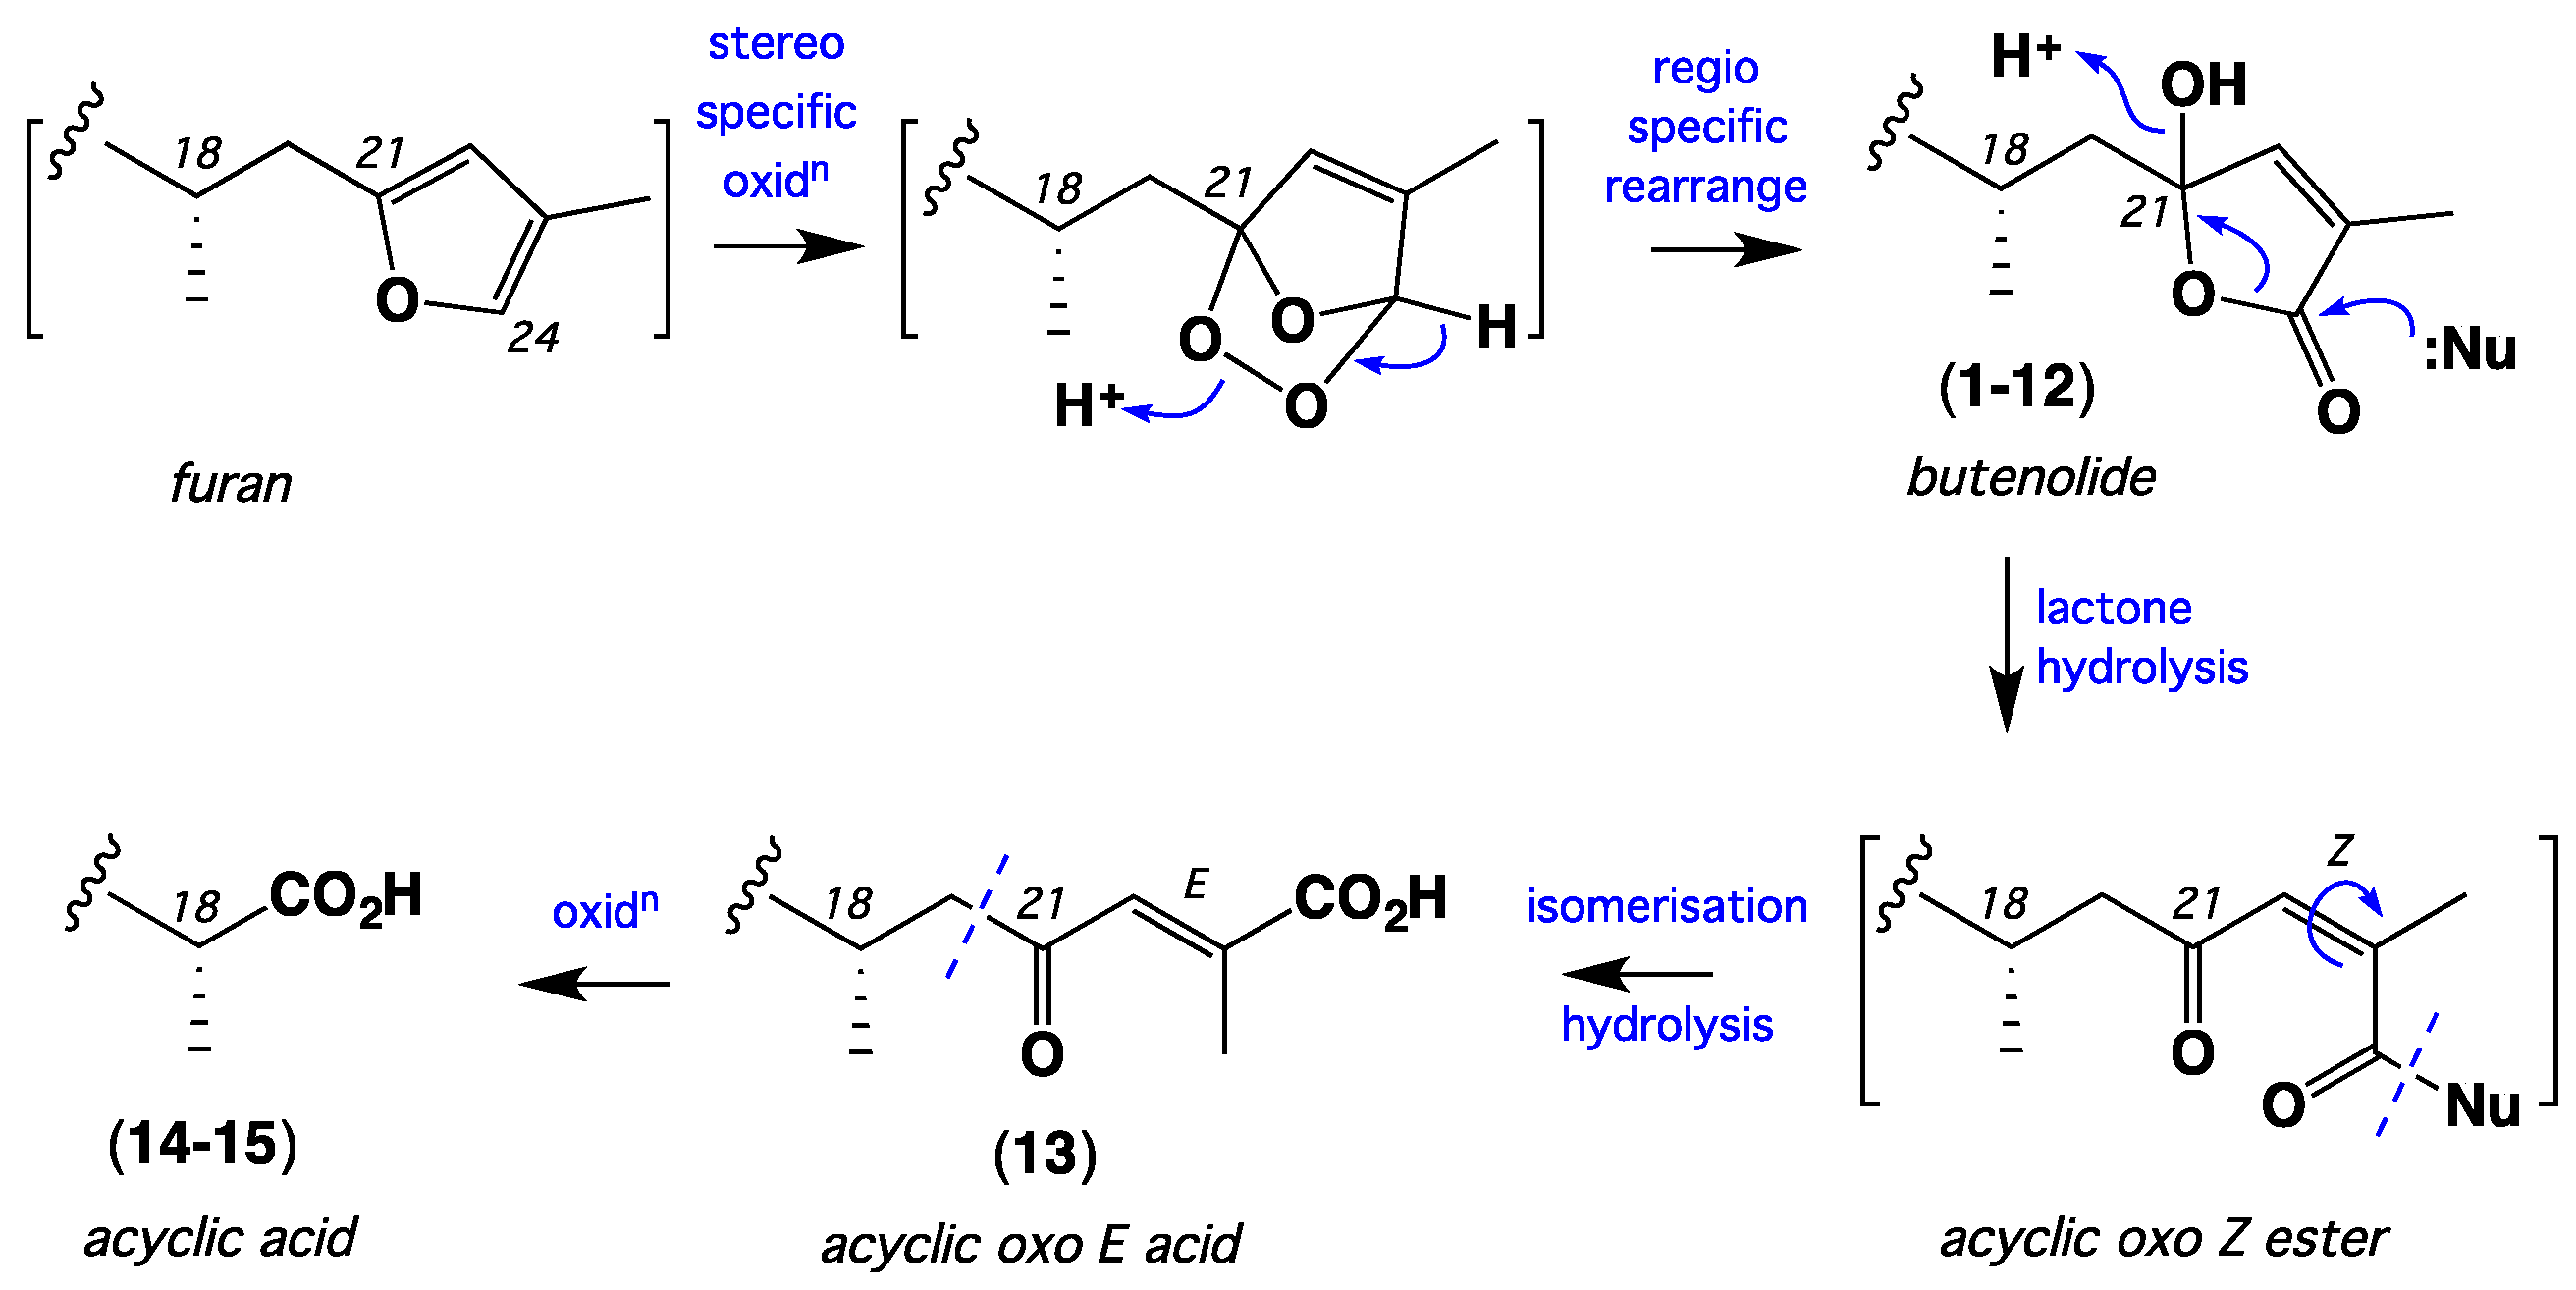
1. Introduction
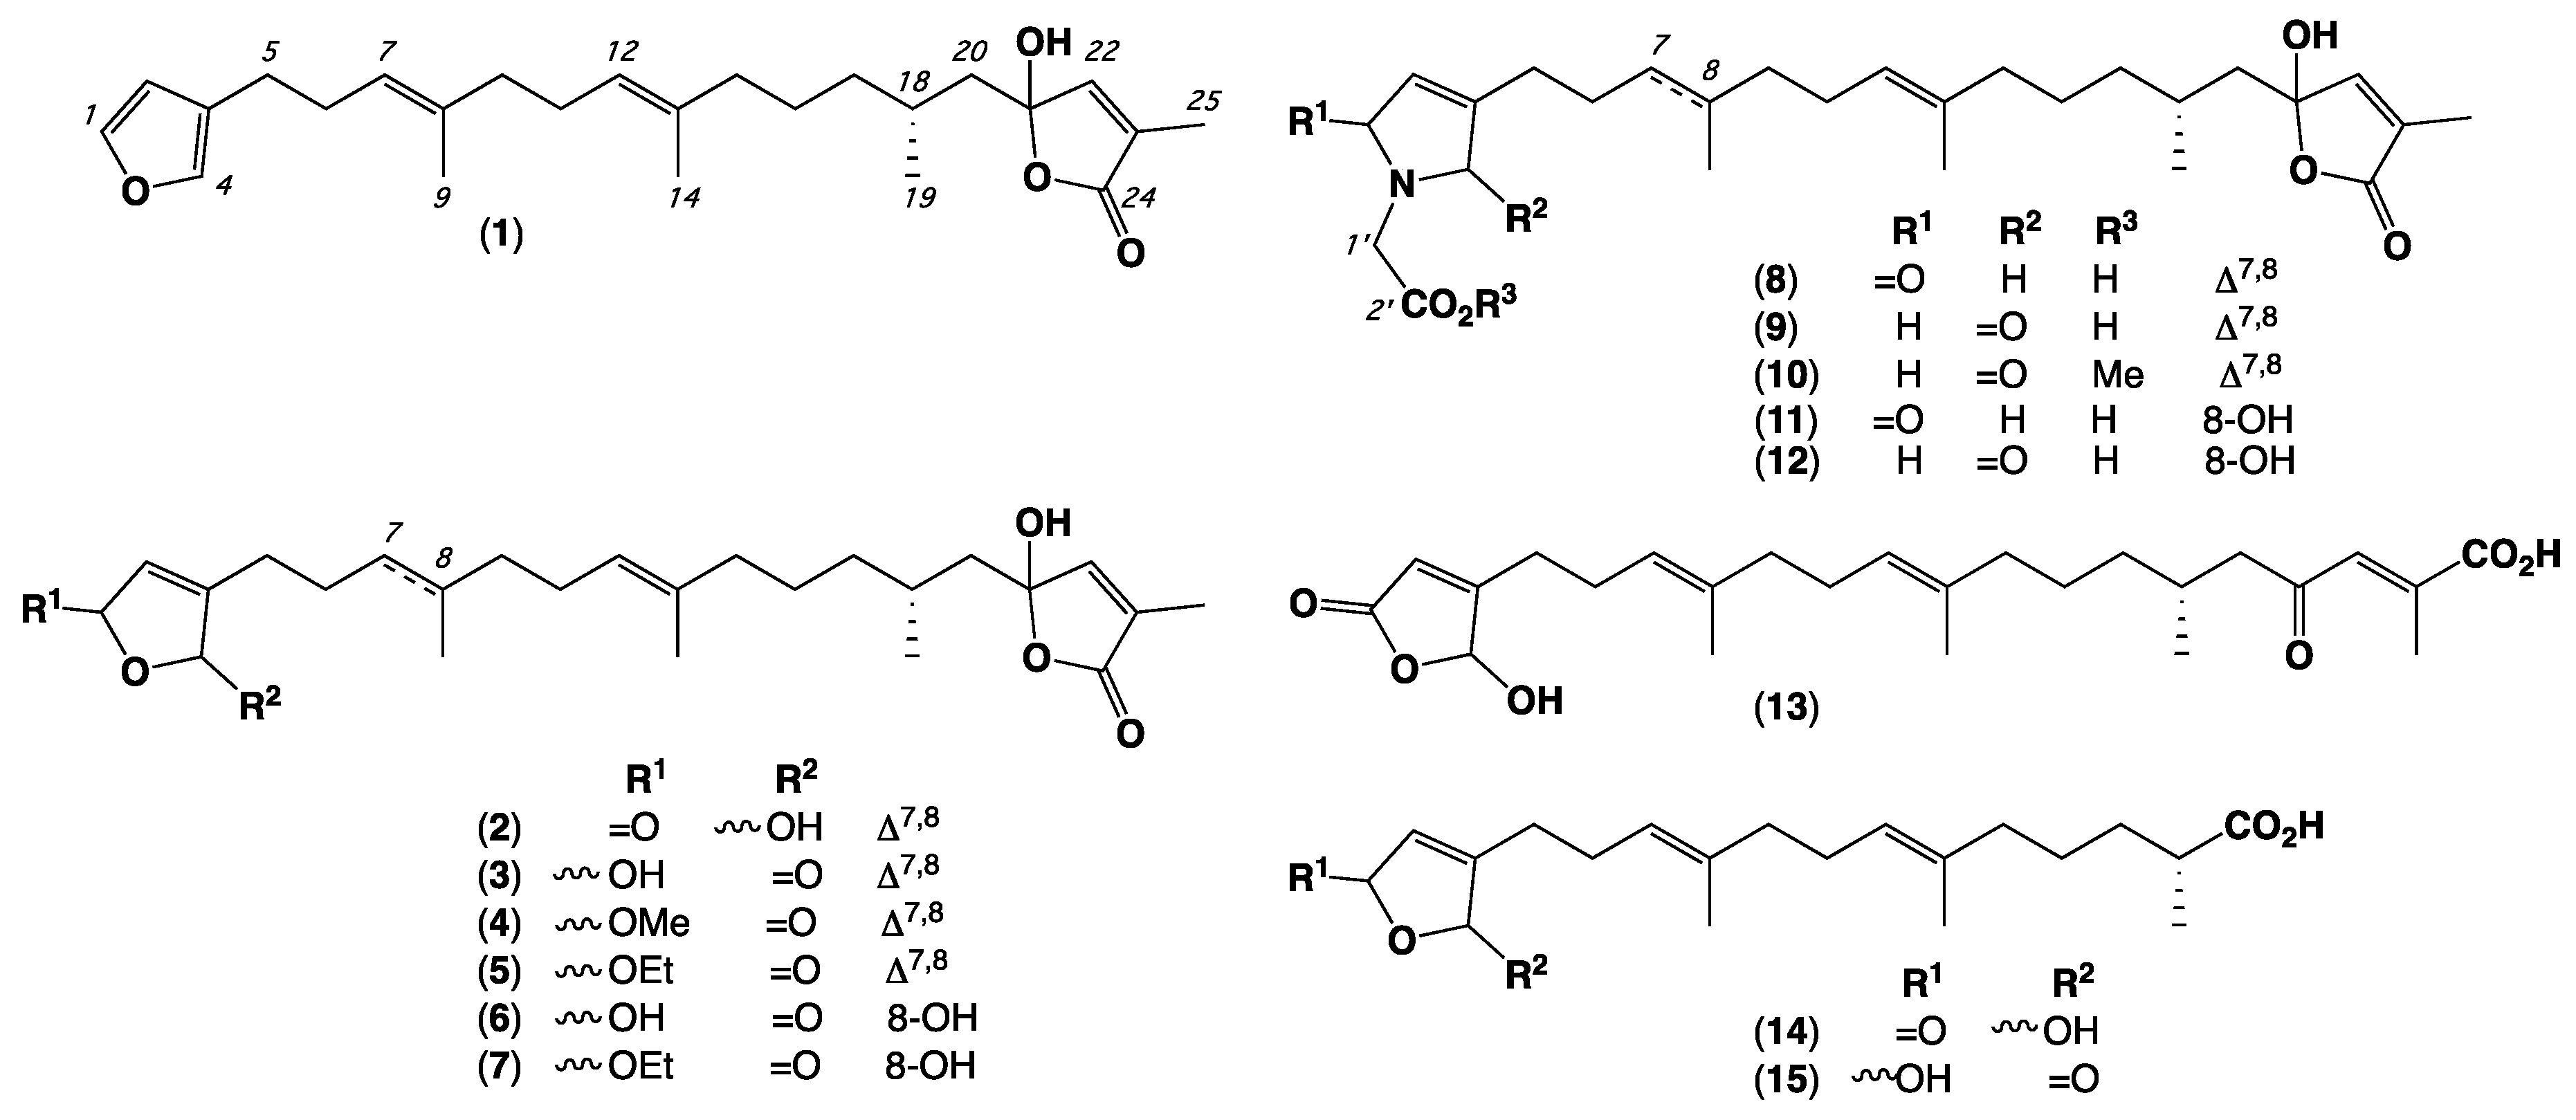
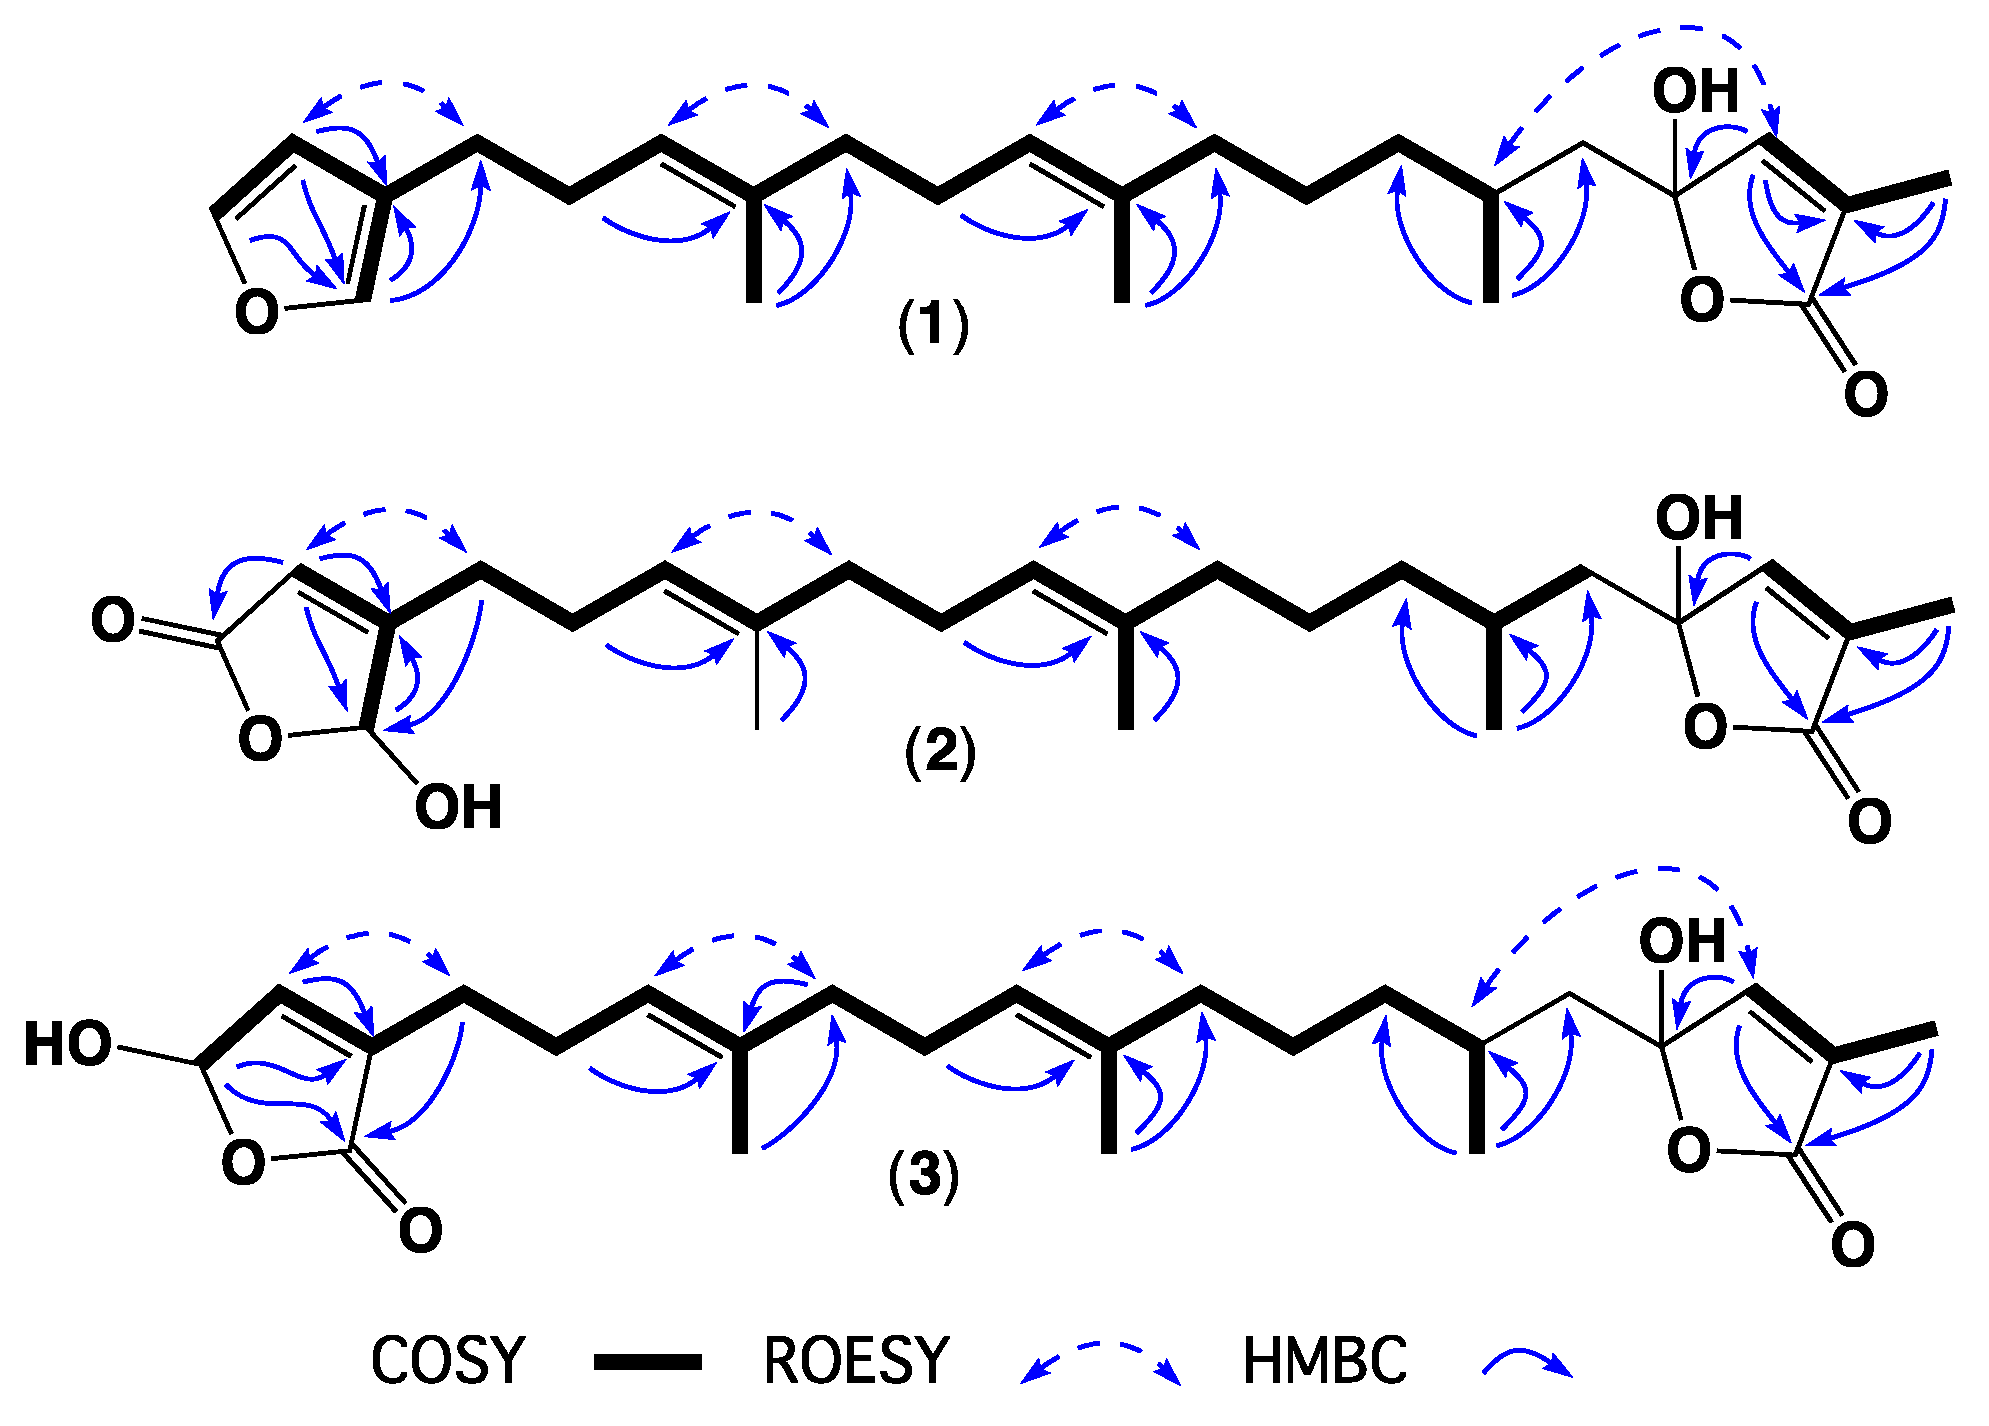
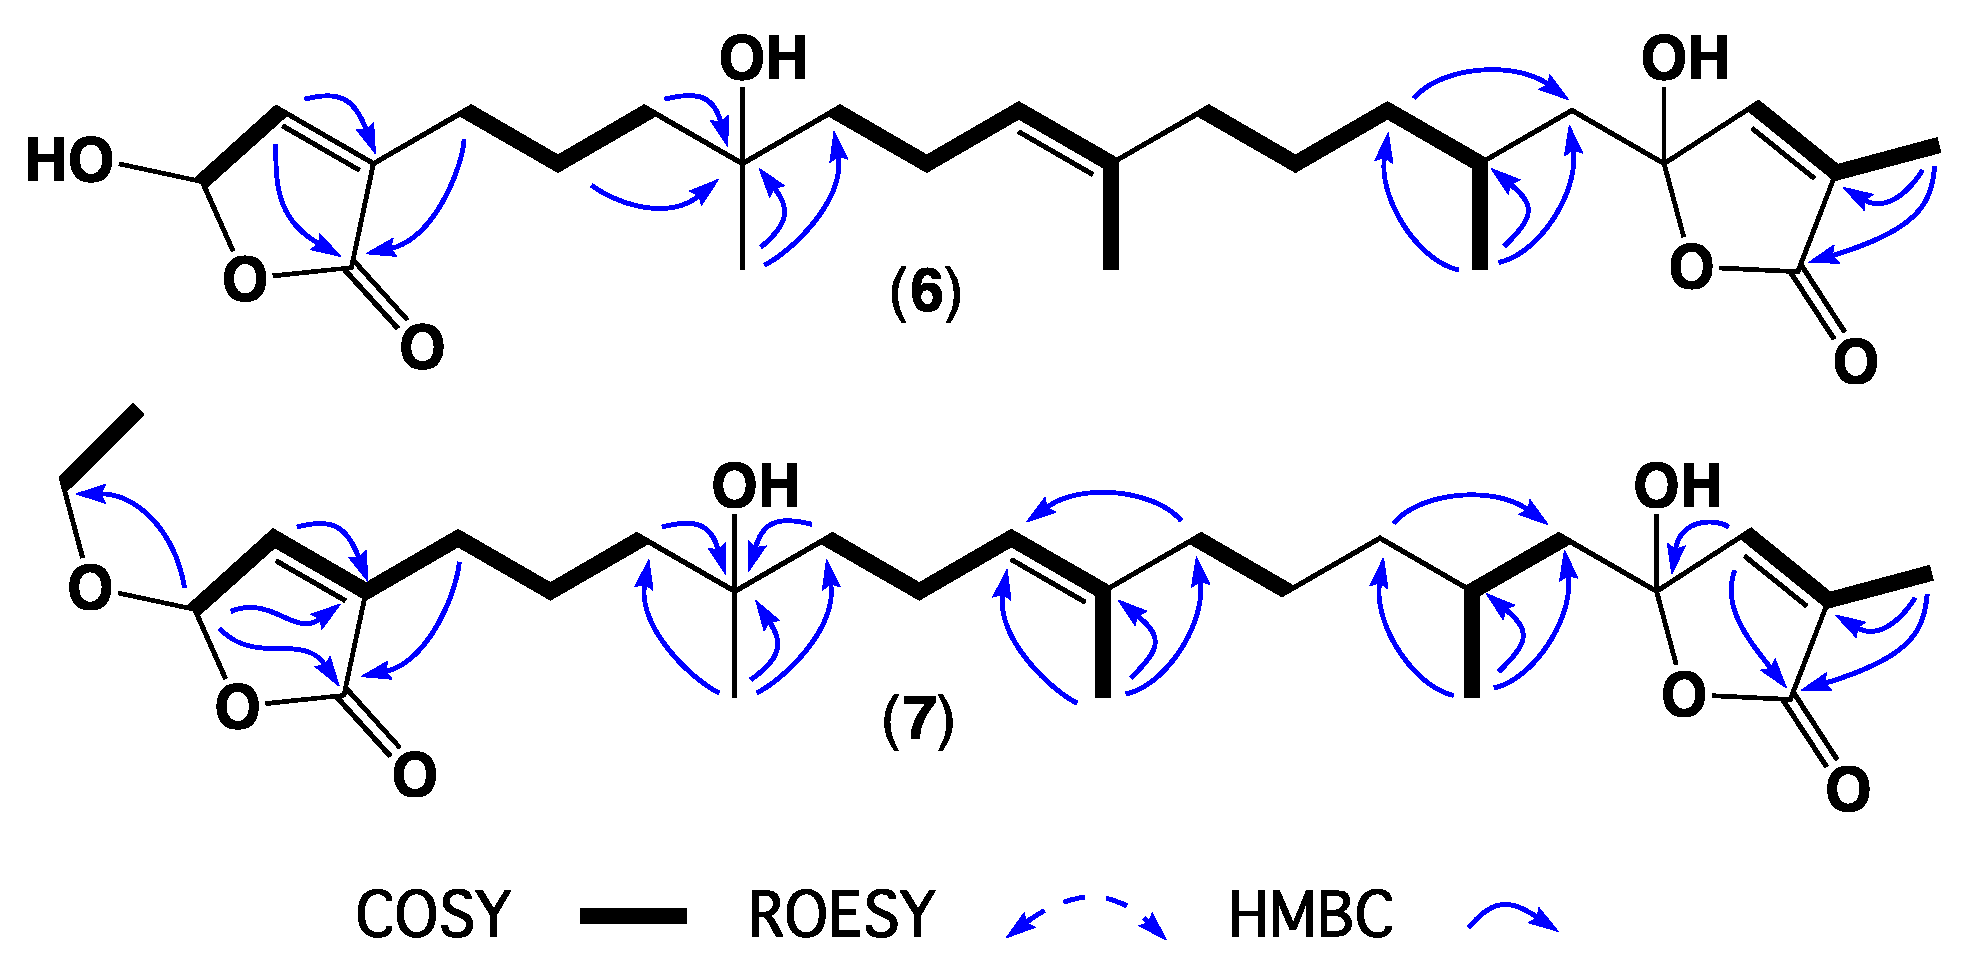
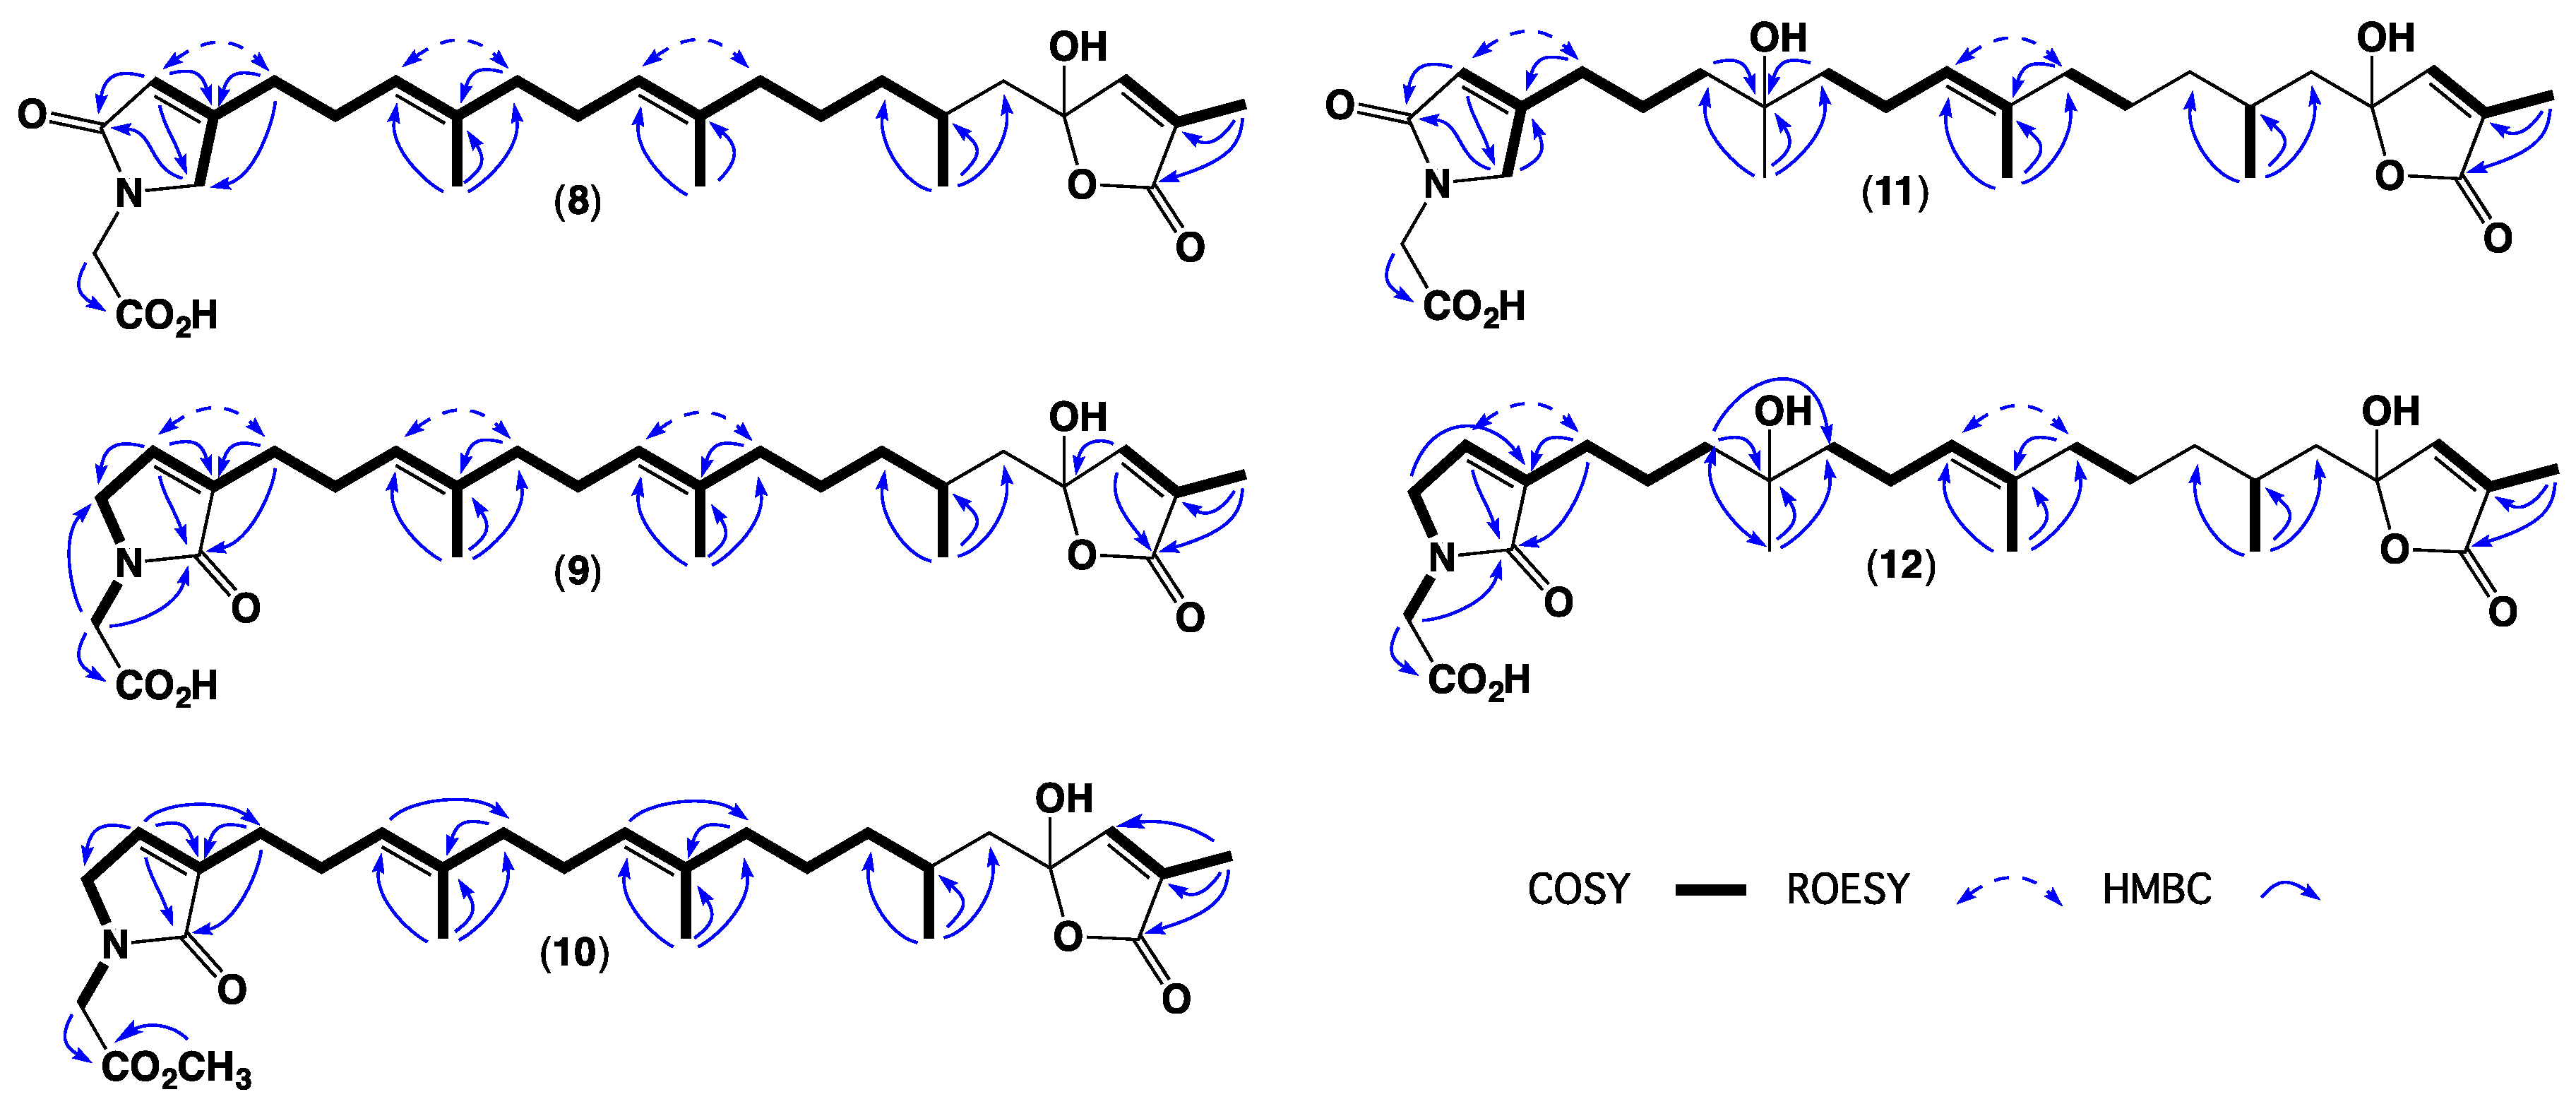
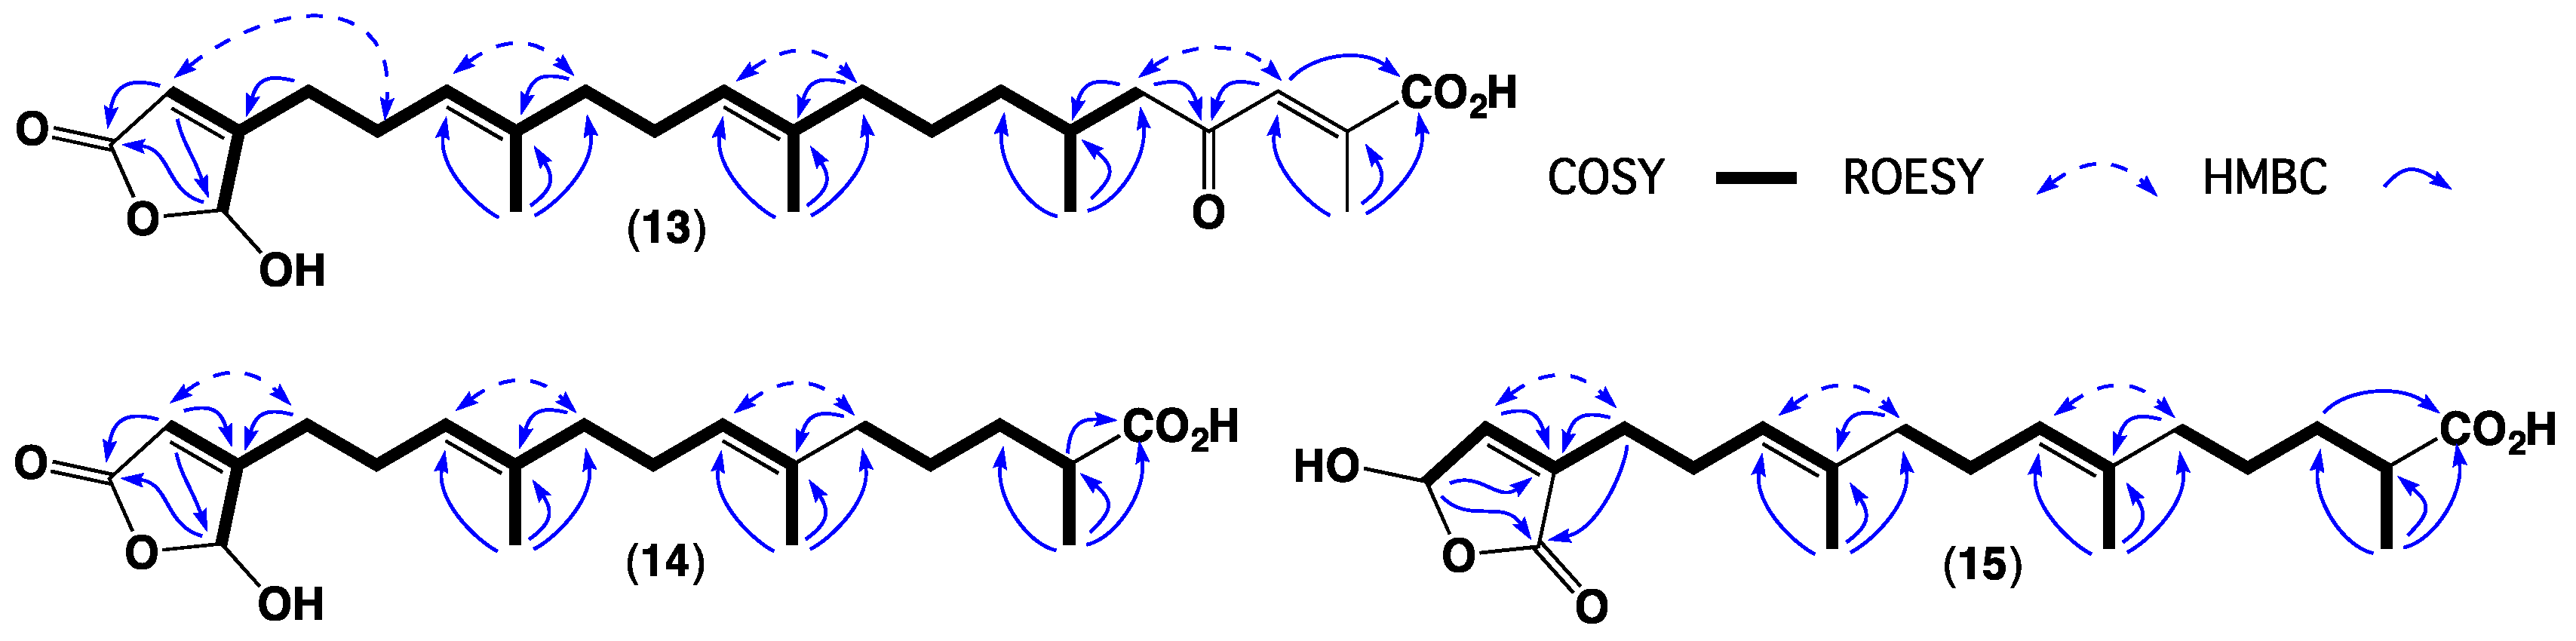
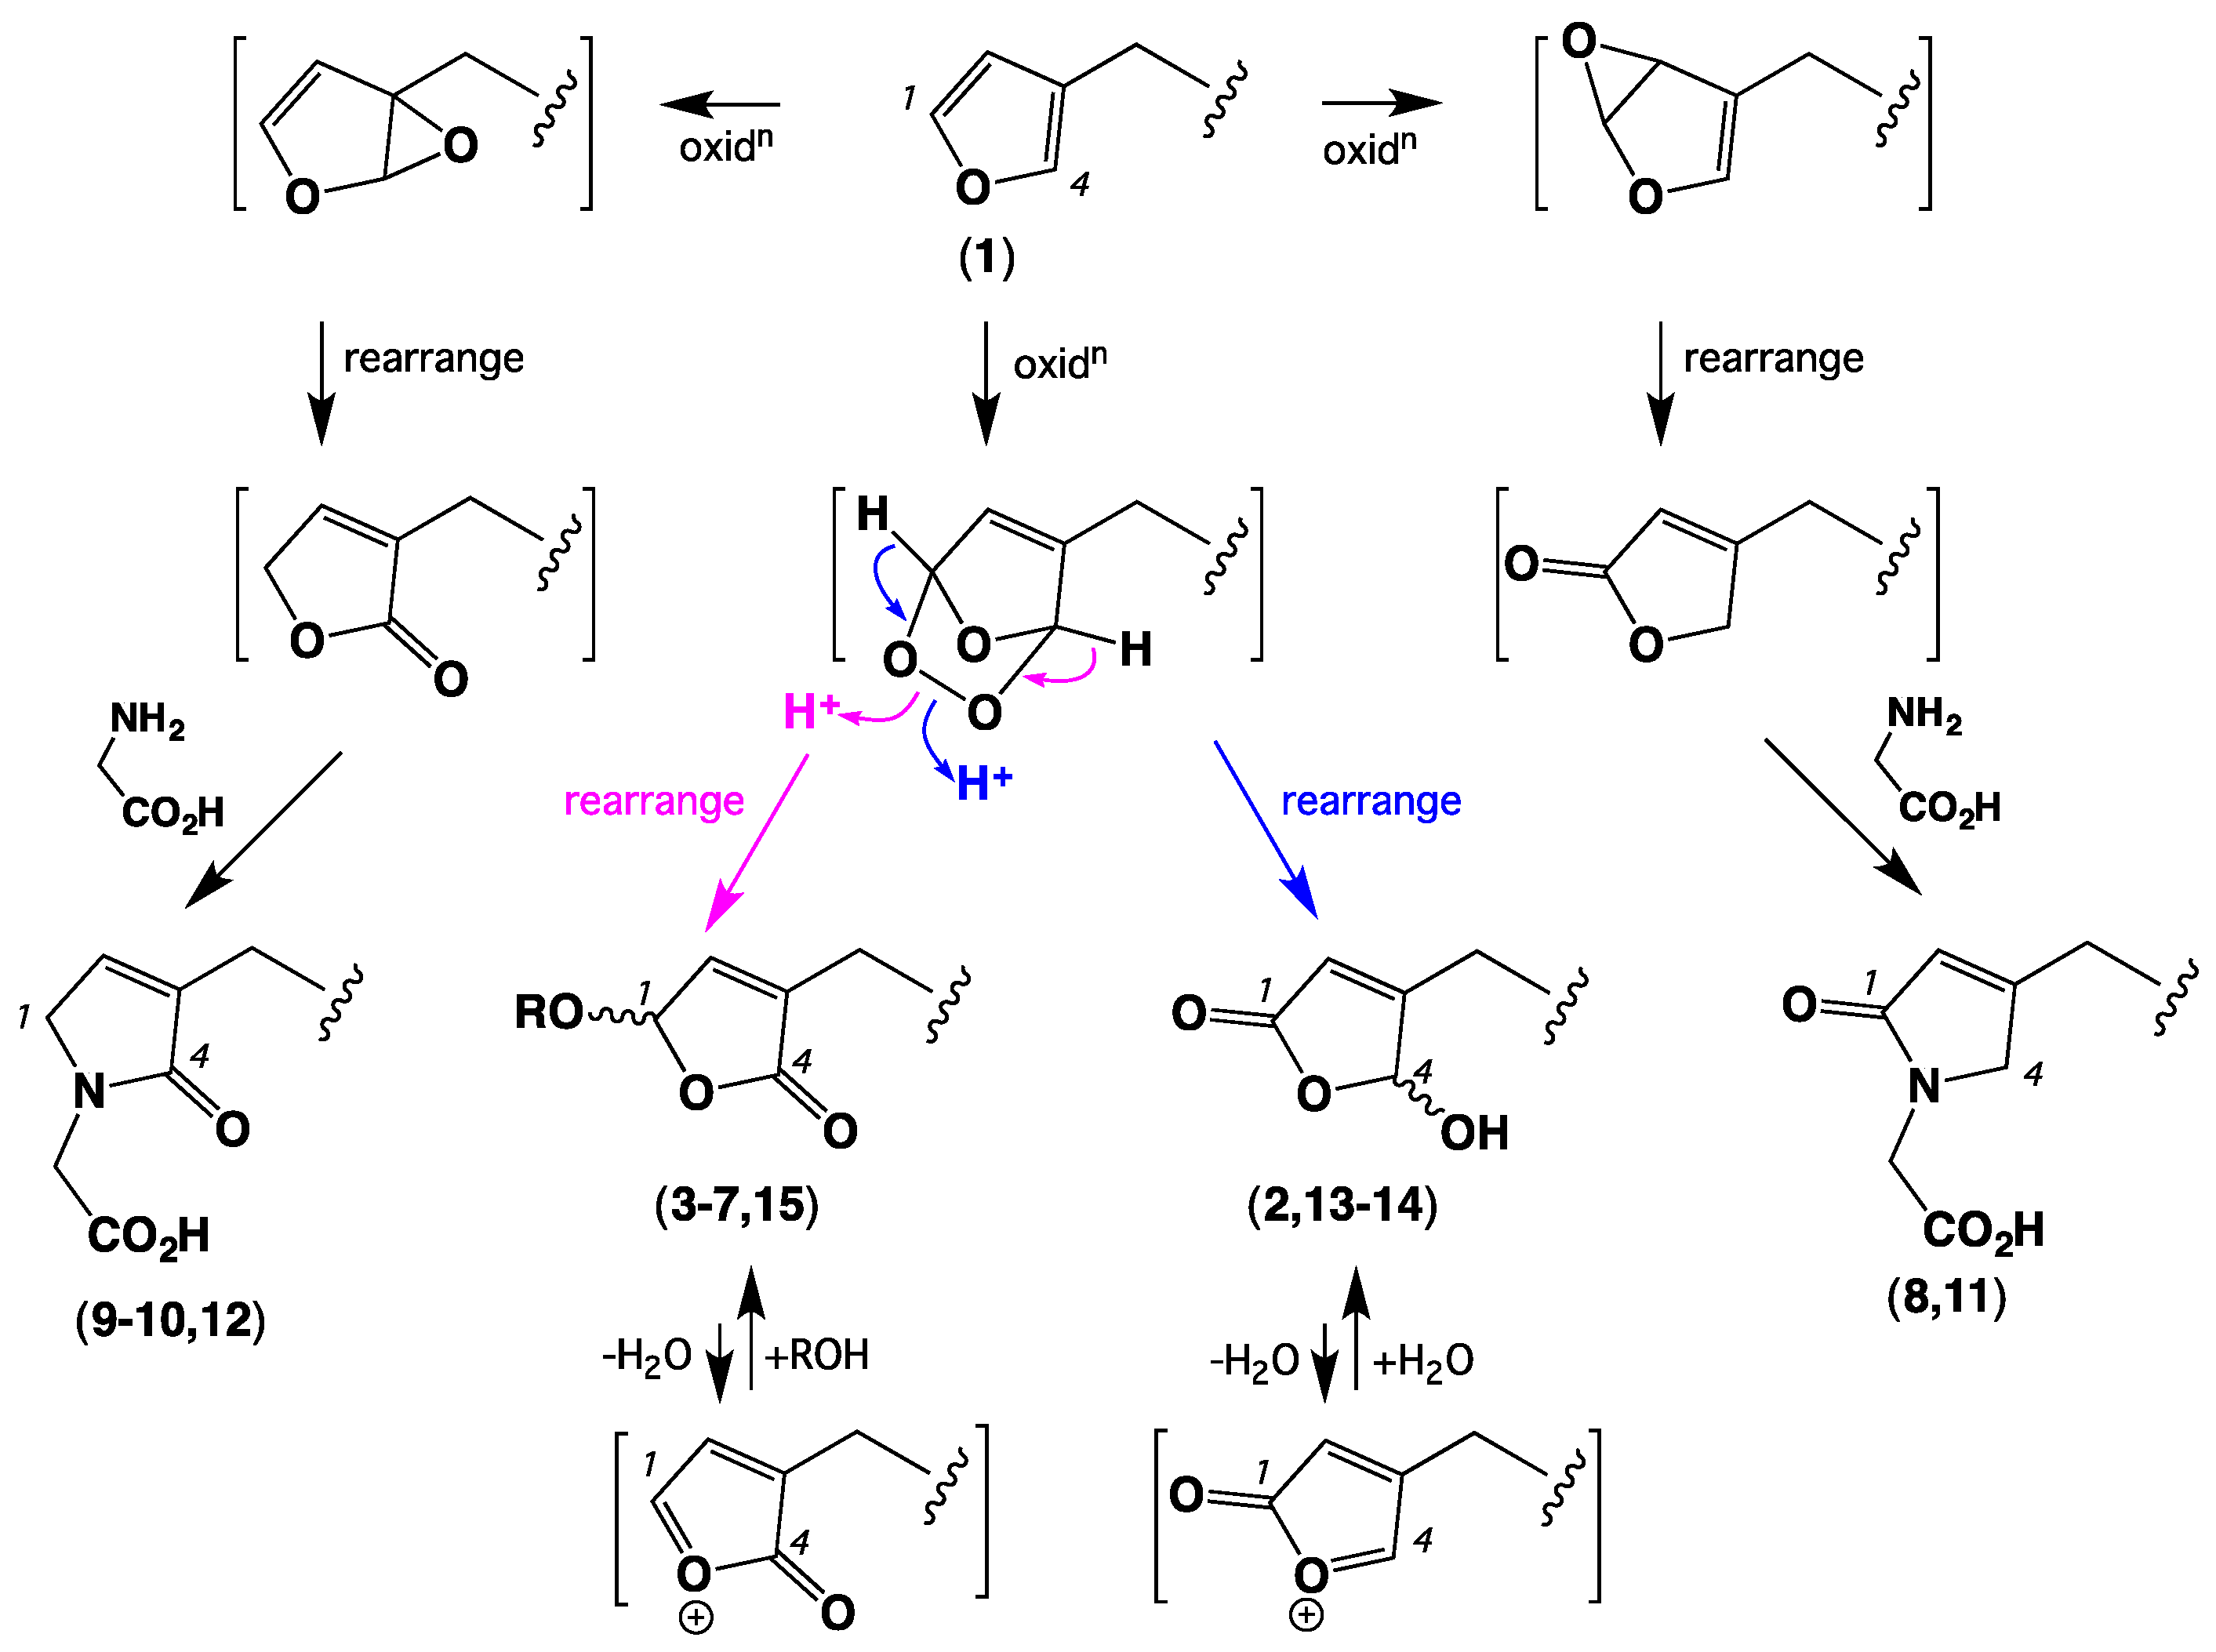
2. Results and Discussion
3. Materials and Methods
3.1. General Experimental Procedures
3.2. Collection and Taxonomy
3.3. Extraction and Fractionation
3.4. Metabolite Characterization
3.5. Cytotoxicity Assay
3.6. Antibacterial Assay
3.7. Antifungal Assay
3.8. Global Natural Product Social Molecular Networking (GNPS)
Supplementary Materials
Author Contributions
Funding
Acknowledgments
Conflicts of Interest
References
- Perry, N.B.; Battershill, C.N.; Blunt, J.W.; Fenwick, G.D.; Munro, M.H.G.; Berquist, P.R. Occurrence of variabilin in New Zealand sponges of the order Dictyoceratida. Biochem. Syst. Ecol. 1987, 15, 373–376. [Google Scholar] [CrossRef]
- Cimino, G.; De Stefano, S.; Minale, L.; Fattorusso, E. Ircinin-1 and -2, linear sesterterpenes from the marine sponge Ircinia oros. Tetrahedron 1972, 28, 333–341. [Google Scholar] [CrossRef]
- Faulkner, D.J. Variabilin, an antibiotic from the sponge Ircinia variabilis. Tetrahedron Lett. 1973, 14, 3821–3822. [Google Scholar] [CrossRef]
- Capon, R.J.; Dargaville, T.R.; Davis, R. The absolute stereochemistry of variabilin and related sesterterpene tetronic acids. Nat. Prod. Lett. 1994, 4, 51–56. [Google Scholar] [CrossRef]
- Capon, R.J.; MacLeod, J.K. A new sesterterpene tetronic acid from an Australian sponge, Ircinia sp. Aust. J. Chem. 1987, 40, 1327–1330. [Google Scholar] [CrossRef]
- Balansa, W.; Islam, R.; Fontaine, F.; Piggott, A.M.; Zhang, H.; Webb, T.I.; Gilbert, D.F.; Lynch, J.W.; Capon, R.J. Ircinialactams: Subunit-selective glycine receptor modulators from Australian sponges of the family Irciniidae. Bioorg. Med. Chem. 2010, 18, 2912–2919. [Google Scholar] [CrossRef] [PubMed]
- Balansa, W.; Islam, R.; Fontaine, F.; Piggott, A.M.; Zhang, H.; Xiao, X.; Webb, T.I.; Gilbert, D.F.; Lynch, J.W.; Capon, R.J. Sesterterpene glycinyl-lactams: a new class of glycine receptor modulator from Australian marine sponges of the genus Psammocinia. Org. Biomol. Chem. 2013, 11, 4695–4701. [Google Scholar] [CrossRef] [PubMed]
- Murray, L.; Hamit, H.; Hooper, J.N.A.; Hobbs, L.; Capon, R.J. A new sesterterpene tetronic acid from an Australian marine sponge, Psammocinia sp. Aust. J. Chem. 1995, 48, 1899–1902. [Google Scholar] [CrossRef]
- Davis, R.; Capon, R.J. Two for one: structure revision of the marine sesterterpene tetronic acid strobilinin to (8Z,13E,20Z)-strobilinin and (8E,13E,20Z)-strobilinin. Aust. J. Chem. 1994, 47, 933–936. [Google Scholar] [CrossRef]
- Prasad, P.; Zhang, A.; Salim, A.A.; Capon, R.J. Pursuing sesterterpene lactams in Australian Irciniidae sponges. Fitoterapia 2018, 126, 83–89. [Google Scholar] [CrossRef] [PubMed]
- Barrow, C.J.; Blunt, J.W.; Munro, M.H.G.; Perry, N.B. Variabilin and related compounds from a sponge of the genus Sarcotragus. J. Nat. Prod. 1988, 51, 275–281. [Google Scholar] [CrossRef]
- Potts, B.C.M.; Faulkner, D.J.; Capon, R.J. Luffalactone and (4E,6E)-dehydromanoalide from the sponge Luffariella variabilis. J. Org. Chem. 1992, 57, 2965–2967. [Google Scholar] [CrossRef]
- Zhou, G.-X.; Molinski, T.F. Manoalide derivatives from a sponge, Luffariella sp. J. Asian Nat. Prod. Res. 2006, 8, 15–20. [Google Scholar] [CrossRef] [PubMed]
- Pommier, A.; Stepanenko, V.; Jarowicki, K.; Kocienski, P.J. Synthesis of (+)-manoalide via a copper(I)-mediated 1,2-metalate rearrangement. J. Org. Chem. 2003, 68, 4008–4013. [Google Scholar] [CrossRef] [PubMed]
- Albizati, K.F.; Holman, T.; Faulkner, D.J.; Glaser, K.B.; Jacobs, R.S. Luffariellolide, an anti-inflammatory sesterterpene from the marine sponge Luffariella sp. Experientia 1987, 43, 949–950. [Google Scholar] [CrossRef]
- Boukouvalas, J.; Robichaud, J.; Maltais, F. A unified strategy for the regiospecific assembly of homoallyl-substituted butenolides and γ-hydroxybutenolides: First synthesis of luffariellolide. Synlett 2006, 15, 2480–2482. [Google Scholar] [CrossRef]
- Tsuda, M.; Endo, T.; Mikami, Y.; Fromont, J.; Kobayashi, J. Luffariolides H and J, new sesterterpenes from a marine sponge Luffariella species. J. Nat. Prod. 2002, 65, 1507–1508. [Google Scholar] [CrossRef] [PubMed]
- Elkhayat, E.; Edrada, R.; Ebel, R.; Wray, V.; van Soest, R.; Wiryowidagdo, S.; Mohamed, M.H.; Müller, W.E.G.; Proksch, P. New luffariellolide derivatives from the Indonesian sponge Acanthodendrilla sp. J. Nat. Prod. 2004, 67, 1809–1817. [Google Scholar] [CrossRef] [PubMed]
- Li, J.; Du, L.; Kelly, M.; Zhou, Y.-D.; Nagle, D.G. Structures and potential antitumor activity of sesterterpenes from the marine sponge Hyrtios communis. J. Nat. Prod. 2013, 76, 1492–1497. [Google Scholar] [CrossRef] [PubMed]
- Cheung, A.K.; Murelli, R.; Snapper, M.L. Total syntheses of (+)- and (−)-cacospongionolide B, cacospongionolide E, and related analogues. Preliminary study of structural features required for phospholipase A2 inhibition. J. Org. Chem. 2004, 69, 5712–5719. [Google Scholar] [CrossRef] [PubMed]
- Flachsbarth, B.; Fritzsche, M.; Weldon, P.J.; Schulz, S. Composition of the cloacal gland secretion of tuatara, Sphenodon punctatus. Chem. Biodiv. 2009, 6, 1–37. [Google Scholar] [CrossRef] [PubMed]
- Burger, B.V.; Petersen, W.G.B.; Weber, W.G.; Munro, Z.M. Semiochemicals of the Scarabaeinae. VII: Identification and synthesis of EAD-active constituents of abdominal sex attracting secretion of the male dung beetle. Kheper subaeneus. J. Chem. Ecol. 2002, 28, 2527–2539. [Google Scholar] [CrossRef] [PubMed]
- Wang, M.; Carver, J.J.; Phelan, V.V.; Sanchez, L.M.; Garg, N.; Peng, Y.; Nguyen, D.D.; Watrous, J.; Kapono, C.A.; Luzzatto-Knaan, T.; et al. Sharing and community curation of mass spectrometry data with Global Natural Products Social Molecular Networking. Nat. Biotechnol. 2016, 34, 828–837. [Google Scholar] [CrossRef] [PubMed]
- Shannon, P.; Markiel, A.; Ozier, O.; Baliga, N.S.; Wang, J.T.; Ramage, D.; Amin, N.; Schwikowski, B.; Ideker, T. Cytoscape: A software environment for integrated models of biomolecular interaction networks. Genome Res. 2003, 13, 2498–2504. [Google Scholar] [CrossRef] [PubMed]


| Position | 1 | 2 | 3 | 4 | 5 | 6 | 7 |
|---|---|---|---|---|---|---|---|
| 1 | 142.7 | 170.0 | 97.2 | 102.6 | 101.6 | 96.9 | 101.8 |
| 2 | 111.3 | 117.6 | 144.1 | 142.2 | 142.5 | 143.8 | 142.6 |
| 3 | 125.2 | 171.1 | 137.8 | 138.6 | 138.3 | 137.8 | 138.5 |
| 4 | 139.0 | 99.5 | 172.5 | 171.9 | 172.0 | 172.3 | 171.9 |
| 5 | 25.2 | 28.0 | 25.4 | 25.5 | 25.5 | 25.5 | 25.9 |
| 6 | 28.6 | 25.3 | 25.6 | 25.7 | 25.7 | 21.6 | 21.9 |
| 7 | 123.9 | 122.6 | 122.9 | 122.6 | 122.7 | 41.5 a | 41.6 a |
| 8 | 135.9 | 136.9 | 136.8 | 136.8 | 136.9 | 73.5 | 73.1 |
| 9 | 16.2 a | 16.1 a | 16.1 a | 16.3 | 16.0 | 26.4 | 26.9 |
| 10 | 39.9 | 39.5 | 39.5 | 39.7 | 39.7 | 41.5 a | 41.6 a |
| 11 | 26.7 | 25.9 | 26.1 | 26.5 | 26.5 | 22.9 | 22.8 |
| 12 | 124.4 | 123.9 | 124.2 | 124.2 | 124.2 | 125.1 | 125.0 |
| 13 | 135.1 | 135.4 | 135.3 | 135.2 | 135.3 | 135.2 | 135.9 |
| 14 | 16.0a | 16.1 a | 16.1 a | 16.1 | 16.2 | 16.1 | 16.0 |
| 15 | 39.9 | 39.8 | 39.8 | 39.9 | 39.8 | 39.3 | 39.5 |
| 16 | 25.2 | 25.1 | 25.1 | 25.2 | 25.2 | 24.6 | 25.1 |
| 17 | 37.6 | 37.5 | 37.5 | 37.5 | 37.3 | 36.6 | 37.5 |
| 18 | 28.7 | 28.6 | 28.6 | 29.0 | 28.7 | 28.6 | 28.6 |
| 19 | 21.1 | 21.1 | 21.2 | 21.3 | 21.2 | 21.1 | 21.0 |
| 20 | 44.9 | 44.7 | 44.7 | 44.9 | 44.8 | 45.4 b | 45.1 |
| 21 | 106.2 | 107.0 | 107.0 | 105.8 | 106.1 | 107.5 | 106.0 |
| 22 | 147.6 | 148.0 | 148.0 | 147.6 | 147.6 | 147.6 | 147.5 |
| 23 | 132.1 | 131.9 | 131.8 | 135.2 | 132.0 | 131.7 | 132.3 |
| 24 | 171.9 | 172.6 | 172.6 | 171.2 | 172.0 | 172.0 | 173.0 |
| 25 | 10.7 | 10.6 | 10.6 | 10.8 | 10.6 | 10.7 | 10.6 |
| 1-OMe | 57.3 | ||||||
| 1-OCH2CH3 | 66.0 | 66.2 | |||||
| 1-OCH2CH3 | 15.2 | 15.2 |
| Position | 1 δH, m (J in Hz) | 2 δH, m (J in Hz) | 3 δH, m (J in Hz) | 4 δH, m (J in Hz) |
|---|---|---|---|---|
| 1 | 7.33, br s | 6.09, br s | 5.74, br s | |
| 2 | 6.28, br s | 5.83, br s | 6.84 a, br s | 6.78, br s |
| 4 | 7.21, br s | 6.01, br s | ||
| 5 | 2.45, t (7.7) | a 2.52, mb 2.39, m | 2.32, t (7.3) | 2.34, t (7.3) |
| 6 | 2.24, dt 7.3, 7.7) | 2.30, dt (7.2, 7.2) | 2.26, dt (7.2, 7.3) | 2.26, dt (7.3, 7.2) |
| 7 | 5.16 (br t, 7.3) | 5.09, br t (7.2) | 5.09, br t, (7.2) | 5.10, br t (7.2) |
| 9 | 1.59, s | 1.61 (s) | 1.59, s | 1.61, s |
| 10 | 2.01, t (7.4) | 2.02, t (7.0) | 2.01, t (7.0) | 2.01, t (7.0) |
| 11 | 2.07, dt (7.4, 7.4) | 2.09, dt (7.0, 7.0) | 2.08, dt (7.0, 7.3) | 2.08, dt (7.0, 7.3) |
| 12 | 5.04, br t (7.4) | 5.02, br t (7.0) | 5.04, br t (7.3) | 5.07, br t (7.3) |
| 14 | 1.57, s | 1.56 (s) | 1.56, s | 1.57, s |
| 15 | 1.93 a | 1.91, m | 1.92, m | 1.94 a, m |
| 16 | 1.36, m | 1.34, m | 1.35, m | 1.35, m |
| 17 | a 1.30, m b 1.16, m | a 1.29, m b 1.14, m | a 1.30, m b 1.14, m | a 1.30, m b 1.17, m |
| 18 | 1.64, m | 1.64, m | 1.63, m | 1.65, m |
| 19 | 0.96, br d (6.7) | 0.94, br d (6.5) | 0.94, br d (6.3) | 0.96, s |
| 20 | a 1.94 a b 1.74, m | a 1.95, m b 1.71, m | a 1.93, m b 1.71, m | a 1.94 a, m b 1.73, m |
| 22 | 6.82, br s | 6.85 (br s) | 6.84 a, br s | 6.84, br s |
| 25 | 1.93 a, s | 1.90 (s) | 1.90, s | 1.94 a, s |
| 1-OMe | 3.56, s |
| Position | 5 δH, m (J in Hz) | 6 δH, m (J in Hz) | 7 δH, m (J in Hz) |
|---|---|---|---|
| 1 | 5.80, br s | 6.05, br s | 5.82, br s |
| 2 | 6.78, d (1.4) | 6.89, br s | 6.81, br s |
| 5 | 2.33, t (7.3) | 2.32, m | 2.30, (7.3) |
| 6 | 2.26, dt (7.2, 7.3) | 1.64 a | 1.64 a |
| 7 | 5.10, br t (7.2) | a 1.55 b b 1.50 c | a 1.64 a b 1.51 b |
| 9 | 1.59, s | 1.19, s | 1.18, s |
| 10 | 1.99, t (7.0) | a 1.55 b b 1.50 c | a 1.64 a b 1.51 b |
| 11 | 2.06, dt (7.3, 7.0) | 2.07, m | 2.05, m |
| 12 | 5.06, br t (7.3) | 5.27 (m) | 5.15, m |
| 14 | 1.57, s | 1.64 a, br s | 1.60, br s |
| 15 | 1.93 a, m | 1.97, m | 1.96, m |
| 16 | 1.36, m | 1.41, m | 1.36, m |
| 17 | a 1.27 b, m b 1.15, m | a 1.31, m b 1.11, m | a 1.33, m b 1.13, m |
| 18 | 1.67, m | 1.70, m | 1.66, m |
| 19 | 0.96, s | 0.94, br d (7.0) | 0.96, br d (6.8) |
| 20 | a 1.93 a b 1.73, m | # | a 1.93 c, m b 1.72, m |
| 22 | 6.83, br s | 6.85, br s | 6.83, br s |
| 25 | 1.93 a, s | 1.91, s | 1.93 c, s |
| 1-OCH2CH3 | a 3.91, m b 3.73, m | a 3.93, m b 3.74, m | |
| 1-OCH2CH3 | 1.27 b, t (7.0) | 1.27, t (7) |
| Position | 8 | 9 | 10 | 11 | 12 | 13 | 14 | 15 |
|---|---|---|---|---|---|---|---|---|
| 1 | 173.5 | 52.1 | 51.7 | 173.2 | 52.1 | 171.4 | 171.4 | 97.2 |
| 2 | 121.0 | 136.9 | 136.0 | 121.5 | 136.9 | 118.0 | 118.0 | 143.9 |
| 3 | 162.3 | 139.2 | 139.9 | 161.8 | 139.4 | 169.5 | 169.5 | 138.6 |
| 4 | 55.7 | 173.3 | 173.1 | 55.6 | 173.0 | 99.3 | 99.3 | 172.3 |
| 5 | 30.0 | 25.9 | 26.3 | 30.3 | 26.5 | 27.9 | 27.9 | 25.3 |
| 6 | 26.0 | 26.0 | 26.1 | 22.3 | 22.3 | 25.3 | 25.3 | 25.6 |
| 7 | 122.8 | 123.7 | 124.1 | 41.5 a | 41.5 a | 122.6 | 122.8 | 123.0 |
| 8 | 136.8 | 135.9 | 135.6 | 72.7 | 73.4 | 137.3 | 137.0 | 137.3 |
| 9 | 16.2 | 16.1 | 16.1 | 27.0 | 26.8 | 16.2 | 16.1 | 16.2 |
| 10 | 39.6 | 39.5 | 39.6 | 41.5 a | 41.5 a | 39.4 | 39.4 | 39.6 |
| 11 | 26.2 | 26.1 | 25.9 | 23.0 | 22.8 | 26.1 | 25.8 | 26.1 |
| 12 | 124.1 | 124.3 | 124.2 | 125.0 | 125.1 | 124.1 | 124.1 | 124.4 |
| 13 | 135.3 | 135.4 | 135.2 | 134.8 | 135.4 | 135.5 | 135.2 | 135.6 |
| 14 | 16.1 | 16.0 | 16.0 | 16.1 | 15.9 | 16.1 | 16.1 | 16.2 |
| 15 | 39.8 | 39.8 | 39.9 | 39.5 | 39.4 | 39.7 | 39.5 | 39.6 |
| 16 | 25.1 | 25.1 | 25.1 | 24.7 | 24.5 | 25.2 | 25.6 | 25.6 |
| 17 | 37.4 | 37.0 | 37.8 | 37.1 | 37.0 | 36.4 | 33.4 | 33.6 |
| 18 | 28.6 | 29.1 | 28.8 | 28.6 | 28.5 | 29.7 | 39.2 | 39.1 |
| 19 | 21.1 | 21.1 | 21.4 | 21.3 | 21.1 | 20.1 | 17.2 | 17.3 |
| 20 | 44.8 | 44.8 | 44.9 | 44.9 b | 45.2 | 52.6 | 180.2 | 180.4 |
| 21 | 107.5 | 107.5 | # | # | 107.8 | 202.9 | ||
| 22 | 148.0 | 148.0 | 148.1 | 147.5 | 148.1 | 133.8 | ||
| 23 | 131.7 | 131.7 | 132.0 | 132.0 | 131.7 | 140.5 | ||
| 24 | 172.4 | 171.9 | 175.5 | 172.0 | 172.4 | 170.7 | ||
| 25 | 10.8 | 10.6 | 10.7 | 10.6 | 10.8 | 14.4 | ||
| 1′ | 43.7 | 44.1 | 43.8 | 44.1 | 44.4 | |||
| 2′ | 171.7 | 172.6 | 170.3 | 171.6 | 171.3 | |||
| 1-OMe | 52.4 |
| Position | 8 δH, m (J in Hz) | 9 δH, m (J in Hz) | 10 δH, m (J in Hz) | 11 δH, m (J in Hz) | 12 δH, m (J in Hz) |
|---|---|---|---|---|---|
| 1 | 4.03, br s | 4.00, br s | 4.02, br s | ||
| 2 | 5.91, br s | 6.77, br s | 6.74, br s | 5.93, br s | 6.78, br s |
| 4 | 4.04, br s | 4.04, br s | |||
| 5 | 2.43, t (7.5) | 2.30, t (7.2) | 2.32, t (7.2) | 2.40, t (7.5) | 2.32, t (7.5) |
| 6 | 2.28, m | 2.24, dt (7.3, 7.3) | 2.25, dt (7.3, 7.3) | 1.66 a, m | 1.61, m |
| 7 | 5.09, br t (7.0) | 5.11, br t (7.3) | 5.15, br t (7.3) | a 1.54 b b 1.52 c | a 1.52 a b 1.50 b |
| 9 | 1.60, s | 1.59, s | 1.60, s | 1.19, s | 1.18, s |
| 10 | 2.02, m | 2.01, t (7.0) | 2.03, t (7.0) | a 1.54 b b 1.52 c | a 1.52 a b 1.50 b |
| 11 | 2.09, m | 2.08, dt (7.0, 7.0) | 2.10, dt (7.0, 7.0) | 2.07, m | 2.05, m |
| 12 | 5.04, br t (7.0) | 5.04, br t (7.0) | 5.06, br t (7.0) | 5.15, br t (7.0) | 5.14, br t (7.0) |
| 14 | 1.56, br s | 1.56, s | 1.56, s | 1.59, br s | 1.59, br s |
| 15 | 1.92, m | 1.92, m | 1.93, m | 1.96, m | 1.95 c |
| 16 | 1.36, m | 1.36, m | 1.37, m | 1.39, m | 1.39, m |
| 17 | a 1.30, m b 1.14, m | a 1.27, m b 1.13, m | a 1.28, m b 1.16, m | a 1.32, m b 1.11, m | a 1.33, m b 1.10, m |
| 18 | 1.64, m | 1.62, m | 1.64, m | 1.66 a, m | 1.65, m |
| 19 | 0.94, br d (7.0) | 0.94, br s | 0.95, br s | 0.94, br d (7.0) | 0.94, br d (7.0) |
| 20 | a 1.95, m b 1.70, m | a 1.95, m b 1.69, m | a 2.00, m b 1.71, m | # | a 1.95 c b 1.73, m |
| 22 | 6.82, br s | 6.83, br s | 6.83, br s | 6.81, br s | 6.83, s |
| 25 | 1.90, s | 1.90, s | 1.91, s | 1.91, s | 1.90, s |
| 1′ | a 4.22, m b 4.18, m | a 4.28, m b 4.25, m | a 4.25, m b 4.21, m | 4.21, br s | 4.23, s |
| 1-OMe | 3.74, s |
| Position | 13 δH, m (J in Hz) | 14 δH, m (J in Hz) | 15 δH, m (J in Hz) |
|---|---|---|---|
| 1 | 6.09, br s | ||
| 2 | 5.85, br s | 5.88, br s | 6.84, br s |
| 4 | 5.99, br s | 6.01, br | |
| 5 | 2.46, m | 2.47 a | 2.32, t (7.3) |
| 6 | 2.32, m | 2.33, m | 2.25, dt (7.3, 7.2) |
| 7 | 5.09, br t (7.3) | 5.10, br t (7.3) | 5.09 br t (7.2) |
| 9 | 1.59, br s | 1.64 b, br s | 1.64 a, s |
| 10 | 2.03 a | 2.06, m | 2.02, br t (7.0) |
| 11 | 2.09 (m) | 2.12, m | 2.09, dt (7.2, 7.0) |
| 12 | 5.03, br t (7.0) | 5.06, br t (7.0) | 5.04, br t (7.2) |
| 14 | 1.57, br s | 1.59, br s | 1.57, s |
| 15 | 1.94, m | 1.98, m | 1.96, m |
| 16 | 1.37, m | 1.42 c | 1.42 b |
| 17 | a 1.25, m b 1.15, m | a 1.64 b b 1.42 c | a 1.64 a b 1.42 b |
| 18 | 2.03 a | 2.47 a | 2.47, m |
| 19 | 0.91, br d (6.7) | 1.19, br d (7.2) | 1.17, br d (7.0) |
| 20 | a. 2.53, m b. 2.35, m | ||
| 22 | 7.11, br s | ||
| 25 | 2.20, s |
© 2018 by the authors. Licensee MDPI, Basel, Switzerland. This article is an open access article distributed under the terms and conditions of the Creative Commons Attribution (CC BY) license (http://creativecommons.org/licenses/by/4.0/).
Share and Cite
Khushi, S.; Nahar, L.; Salim, A.A.; Capon, R.J. Cacolides: Sesterterpene Butenolides from a Southern Australian Marine Sponge, Cacospongia sp. Mar. Drugs 2018, 16, 456. https://doi.org/10.3390/md16110456
Khushi S, Nahar L, Salim AA, Capon RJ. Cacolides: Sesterterpene Butenolides from a Southern Australian Marine Sponge, Cacospongia sp. Marine Drugs. 2018; 16(11):456. https://doi.org/10.3390/md16110456
Chicago/Turabian StyleKhushi, Shamsunnahar, Laizuman Nahar, Angela A. Salim, and Robert J. Capon. 2018. "Cacolides: Sesterterpene Butenolides from a Southern Australian Marine Sponge, Cacospongia sp." Marine Drugs 16, no. 11: 456. https://doi.org/10.3390/md16110456
APA StyleKhushi, S., Nahar, L., Salim, A. A., & Capon, R. J. (2018). Cacolides: Sesterterpene Butenolides from a Southern Australian Marine Sponge, Cacospongia sp. Marine Drugs, 16(11), 456. https://doi.org/10.3390/md16110456