Rapid Estimation of Astaxanthin and the Carotenoid-to-Chlorophyll Ratio in the Green Microalga Chromochloris zofingiensis Using Flow Cytometry


Abstract
:1. Introduction
2. Results and Discussion
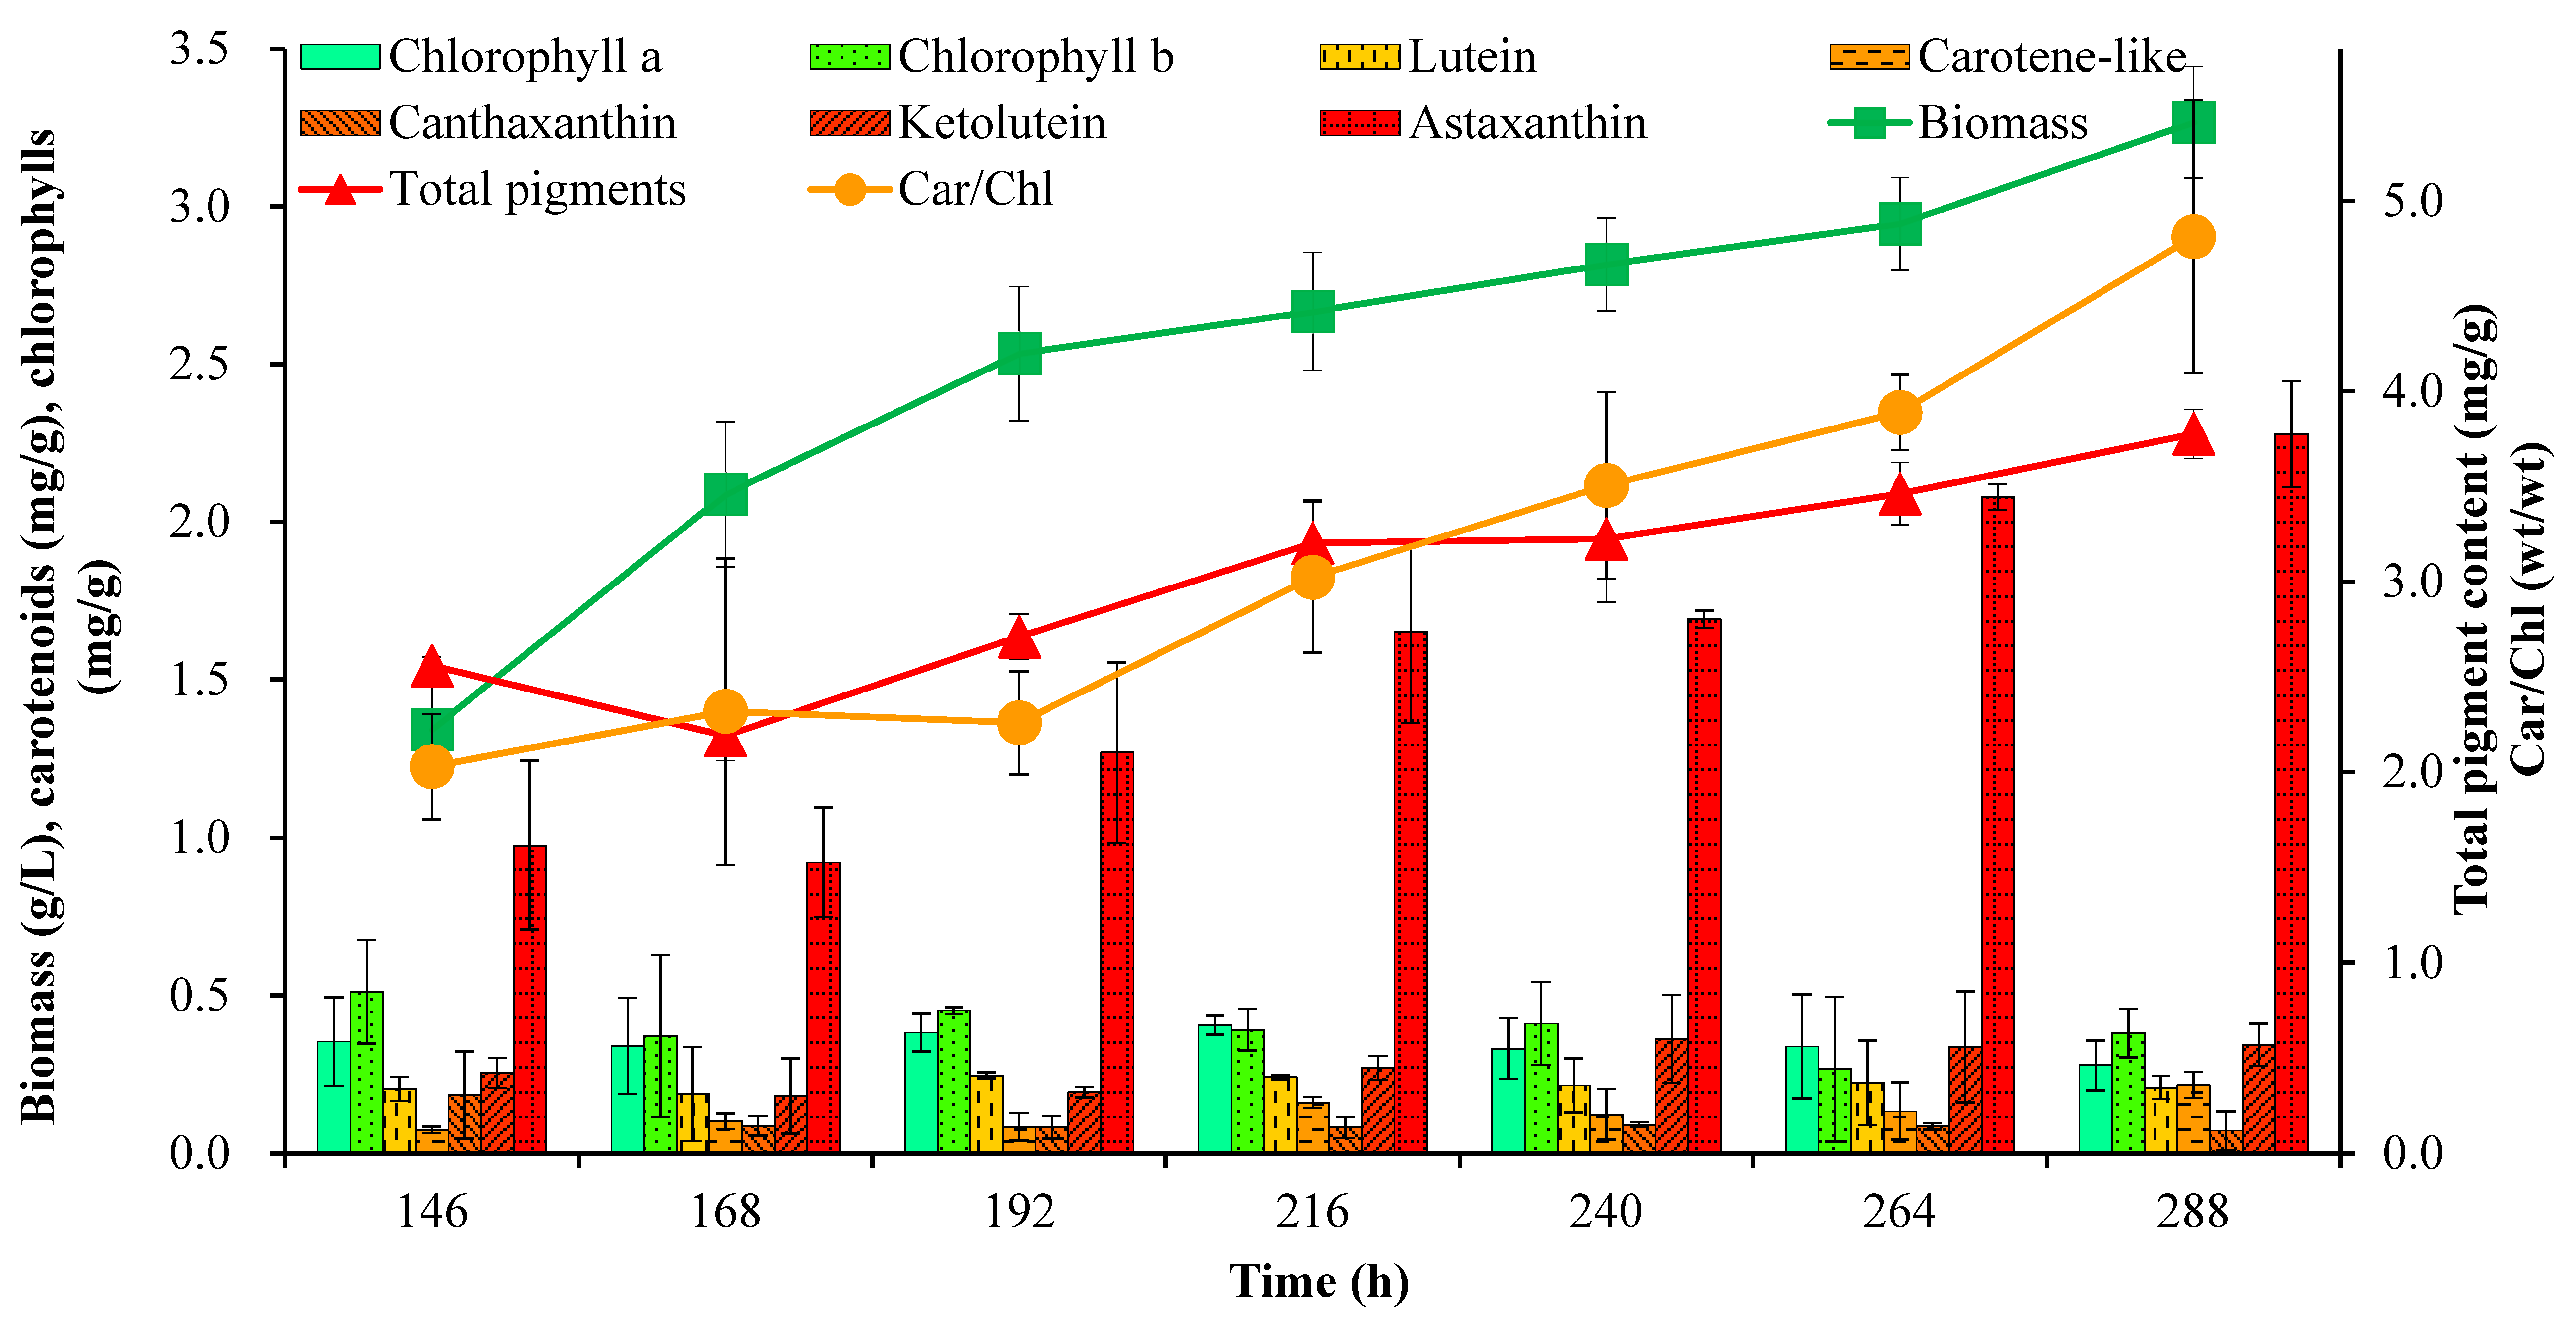
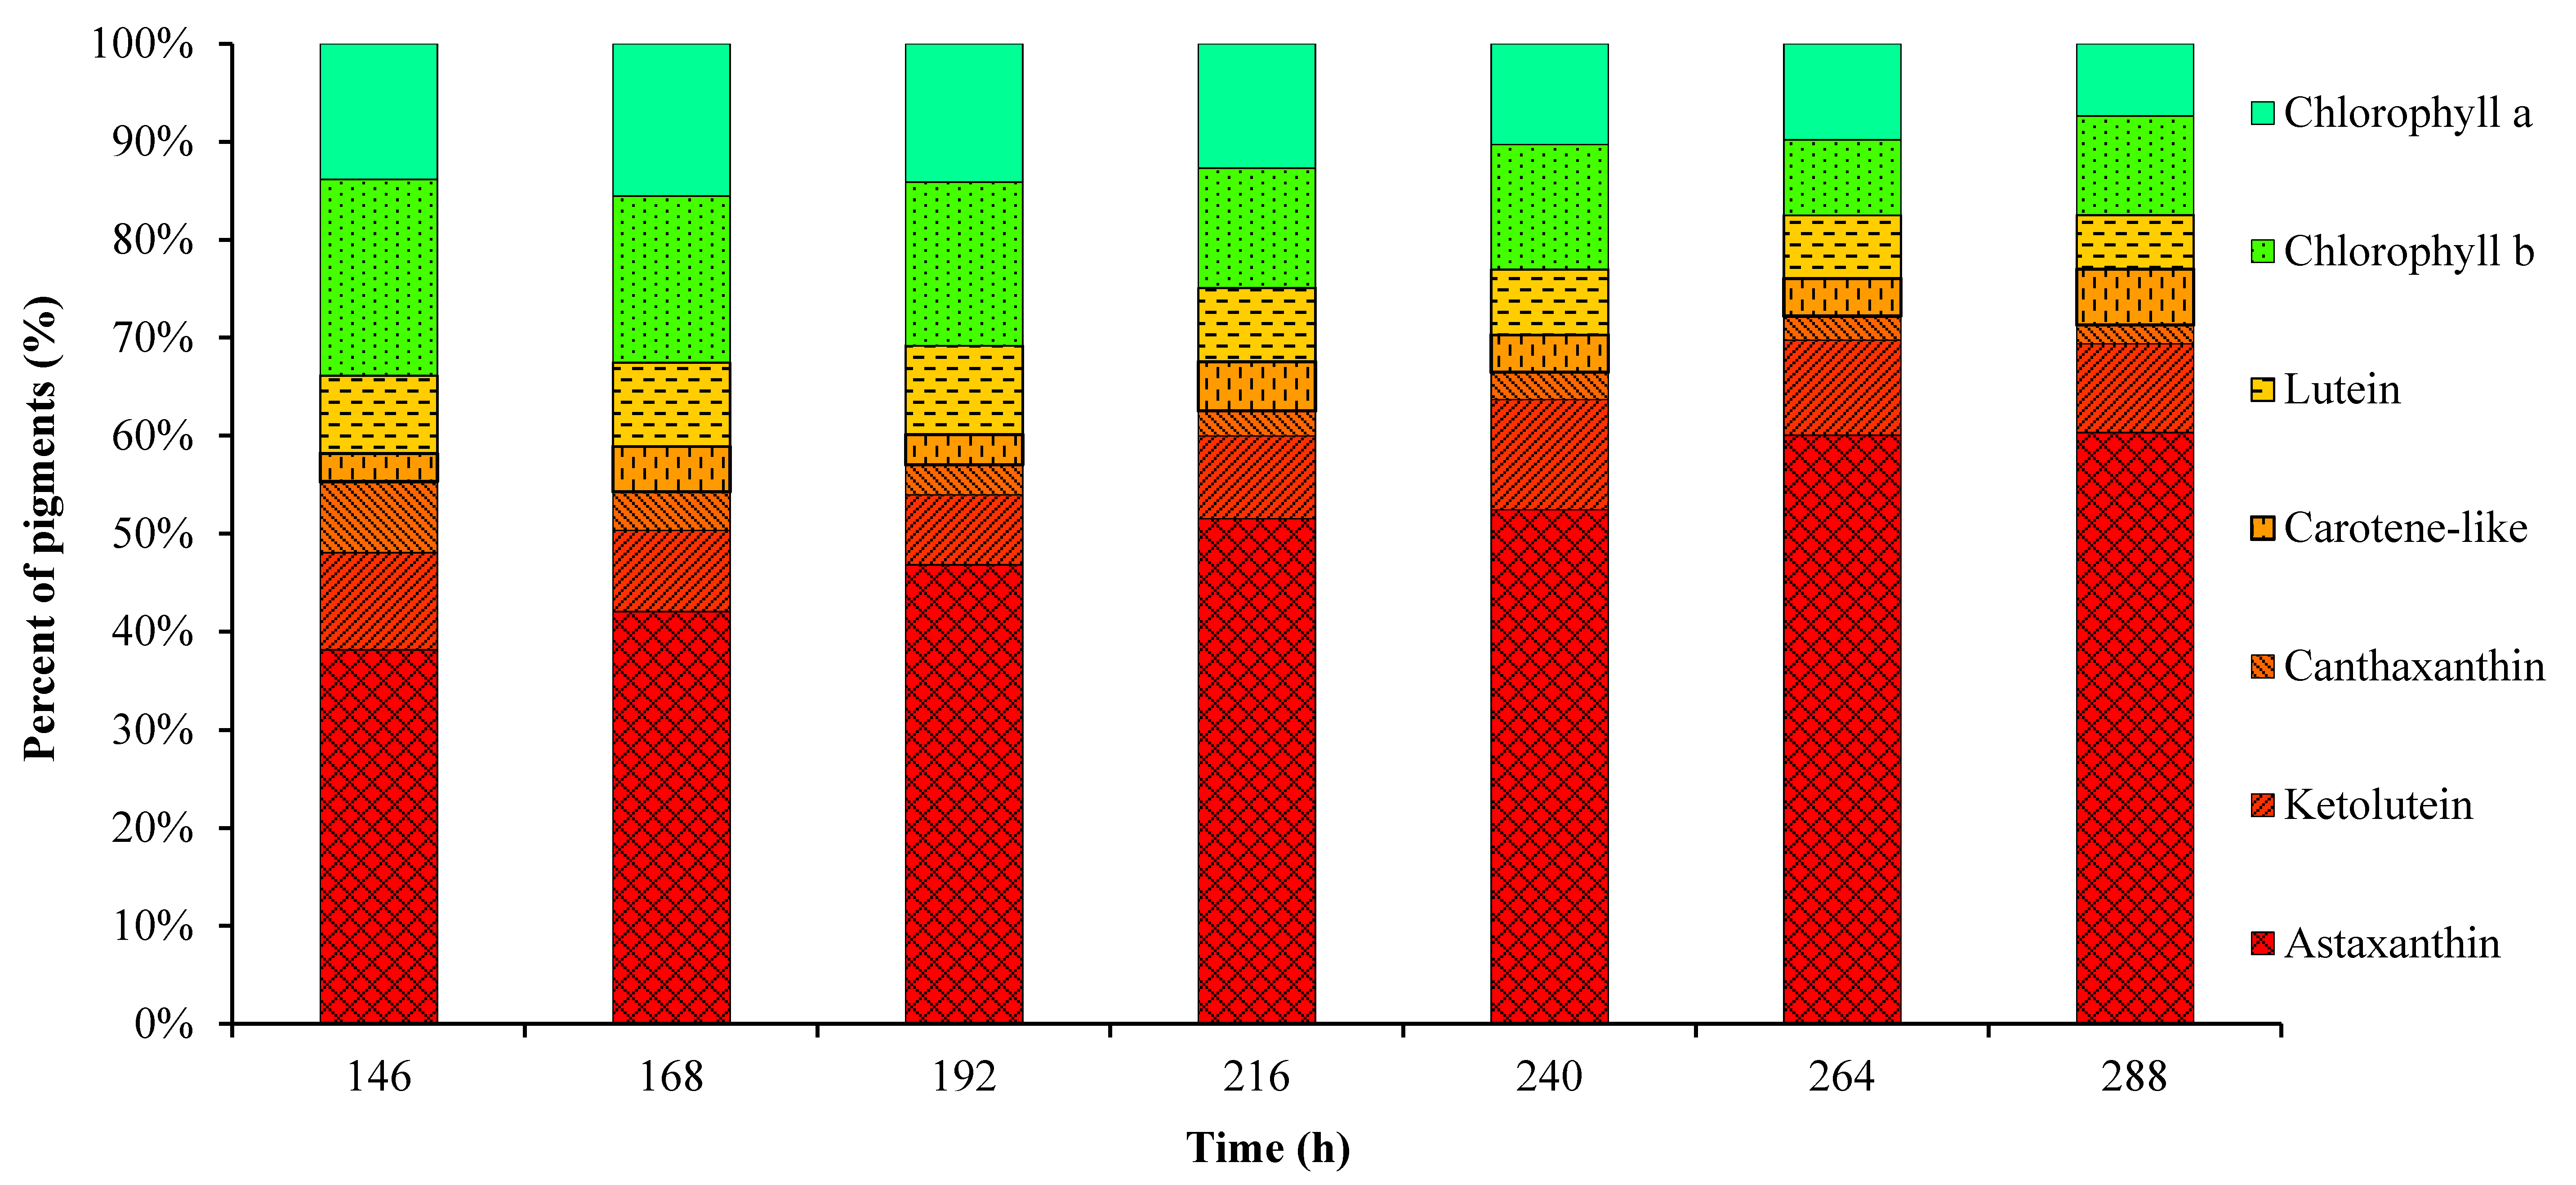
2.1. Cell Growth and Pigment Accumulation
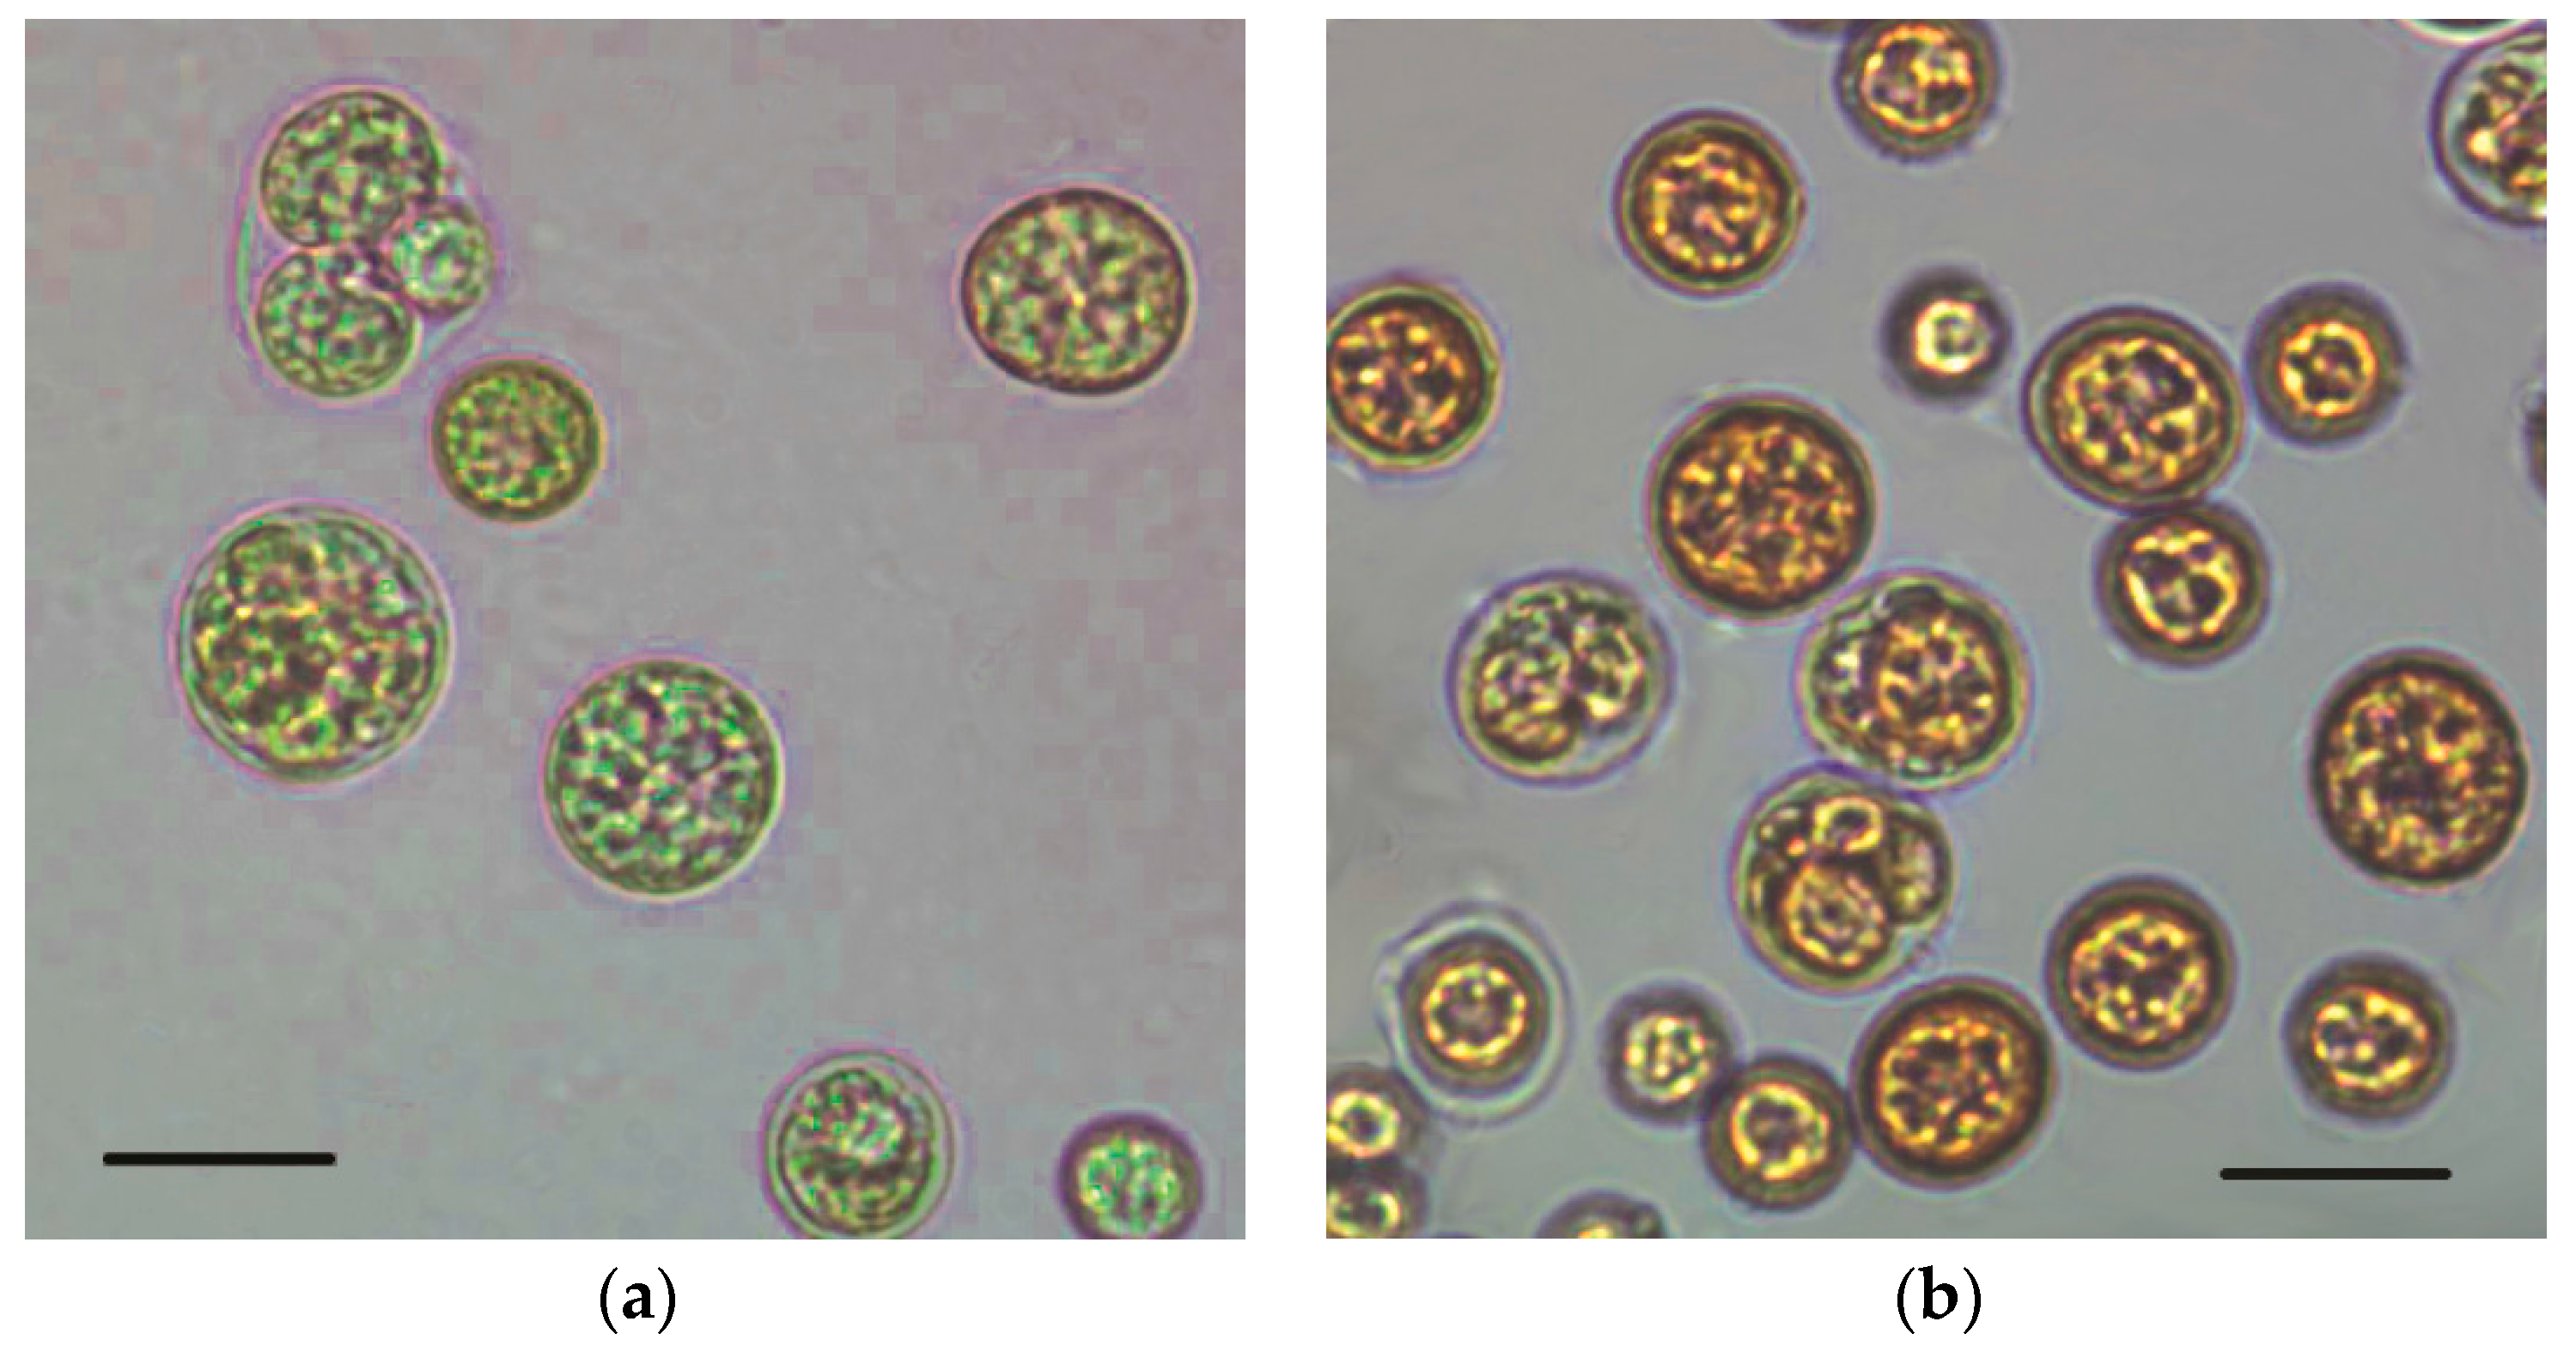
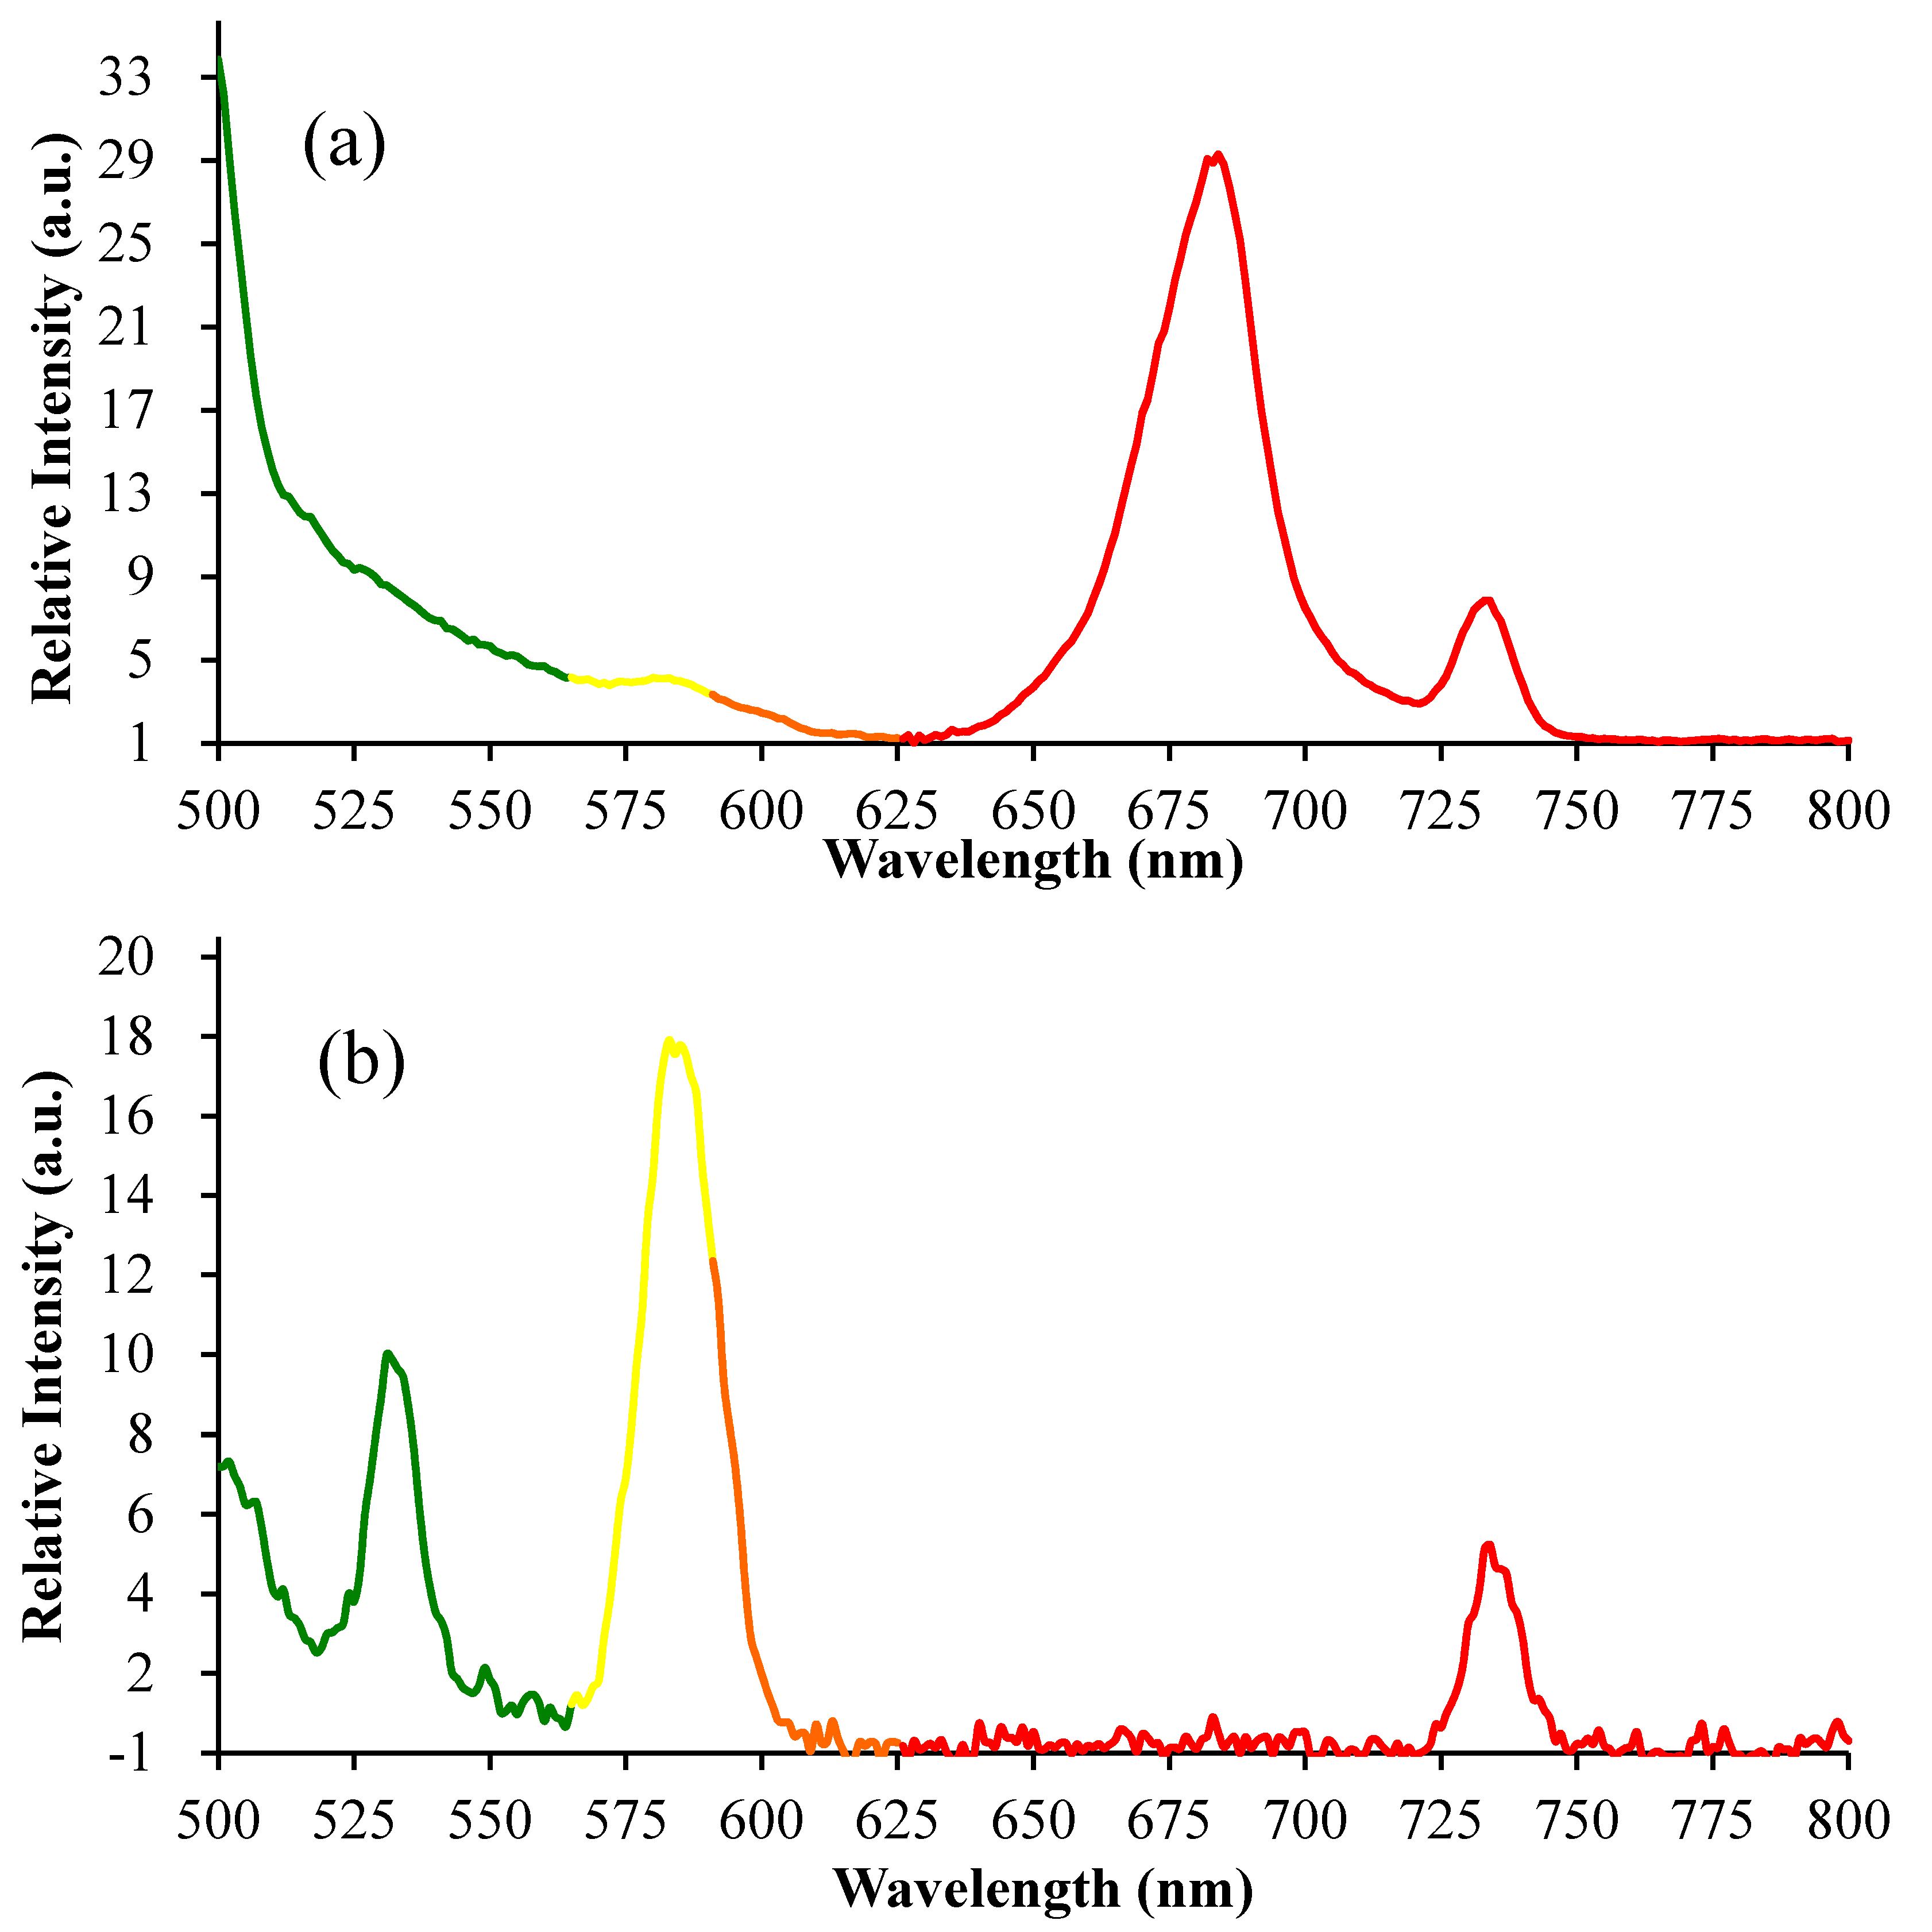
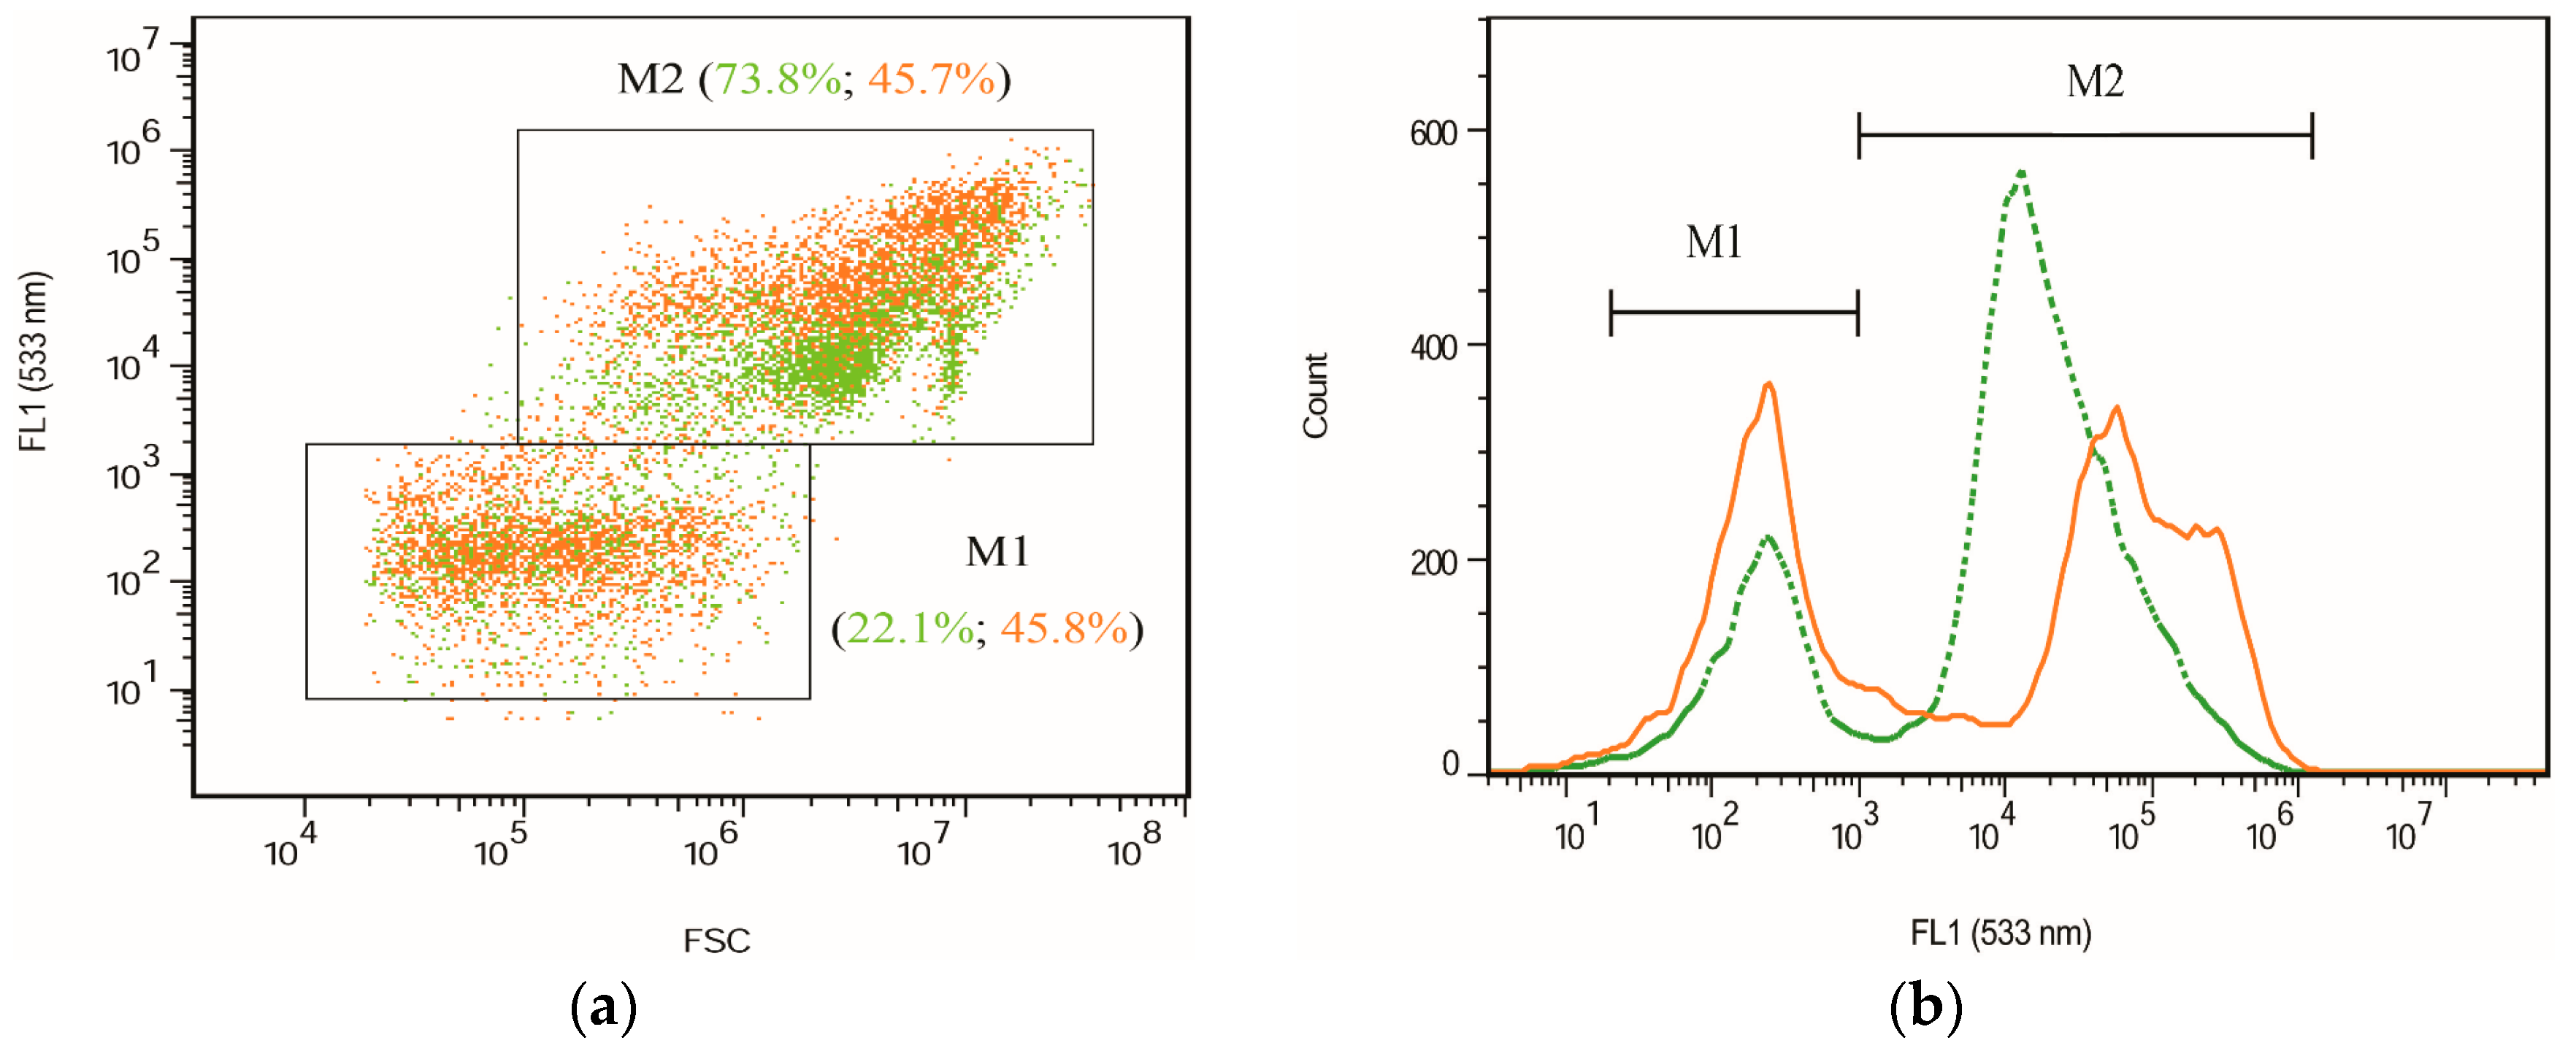
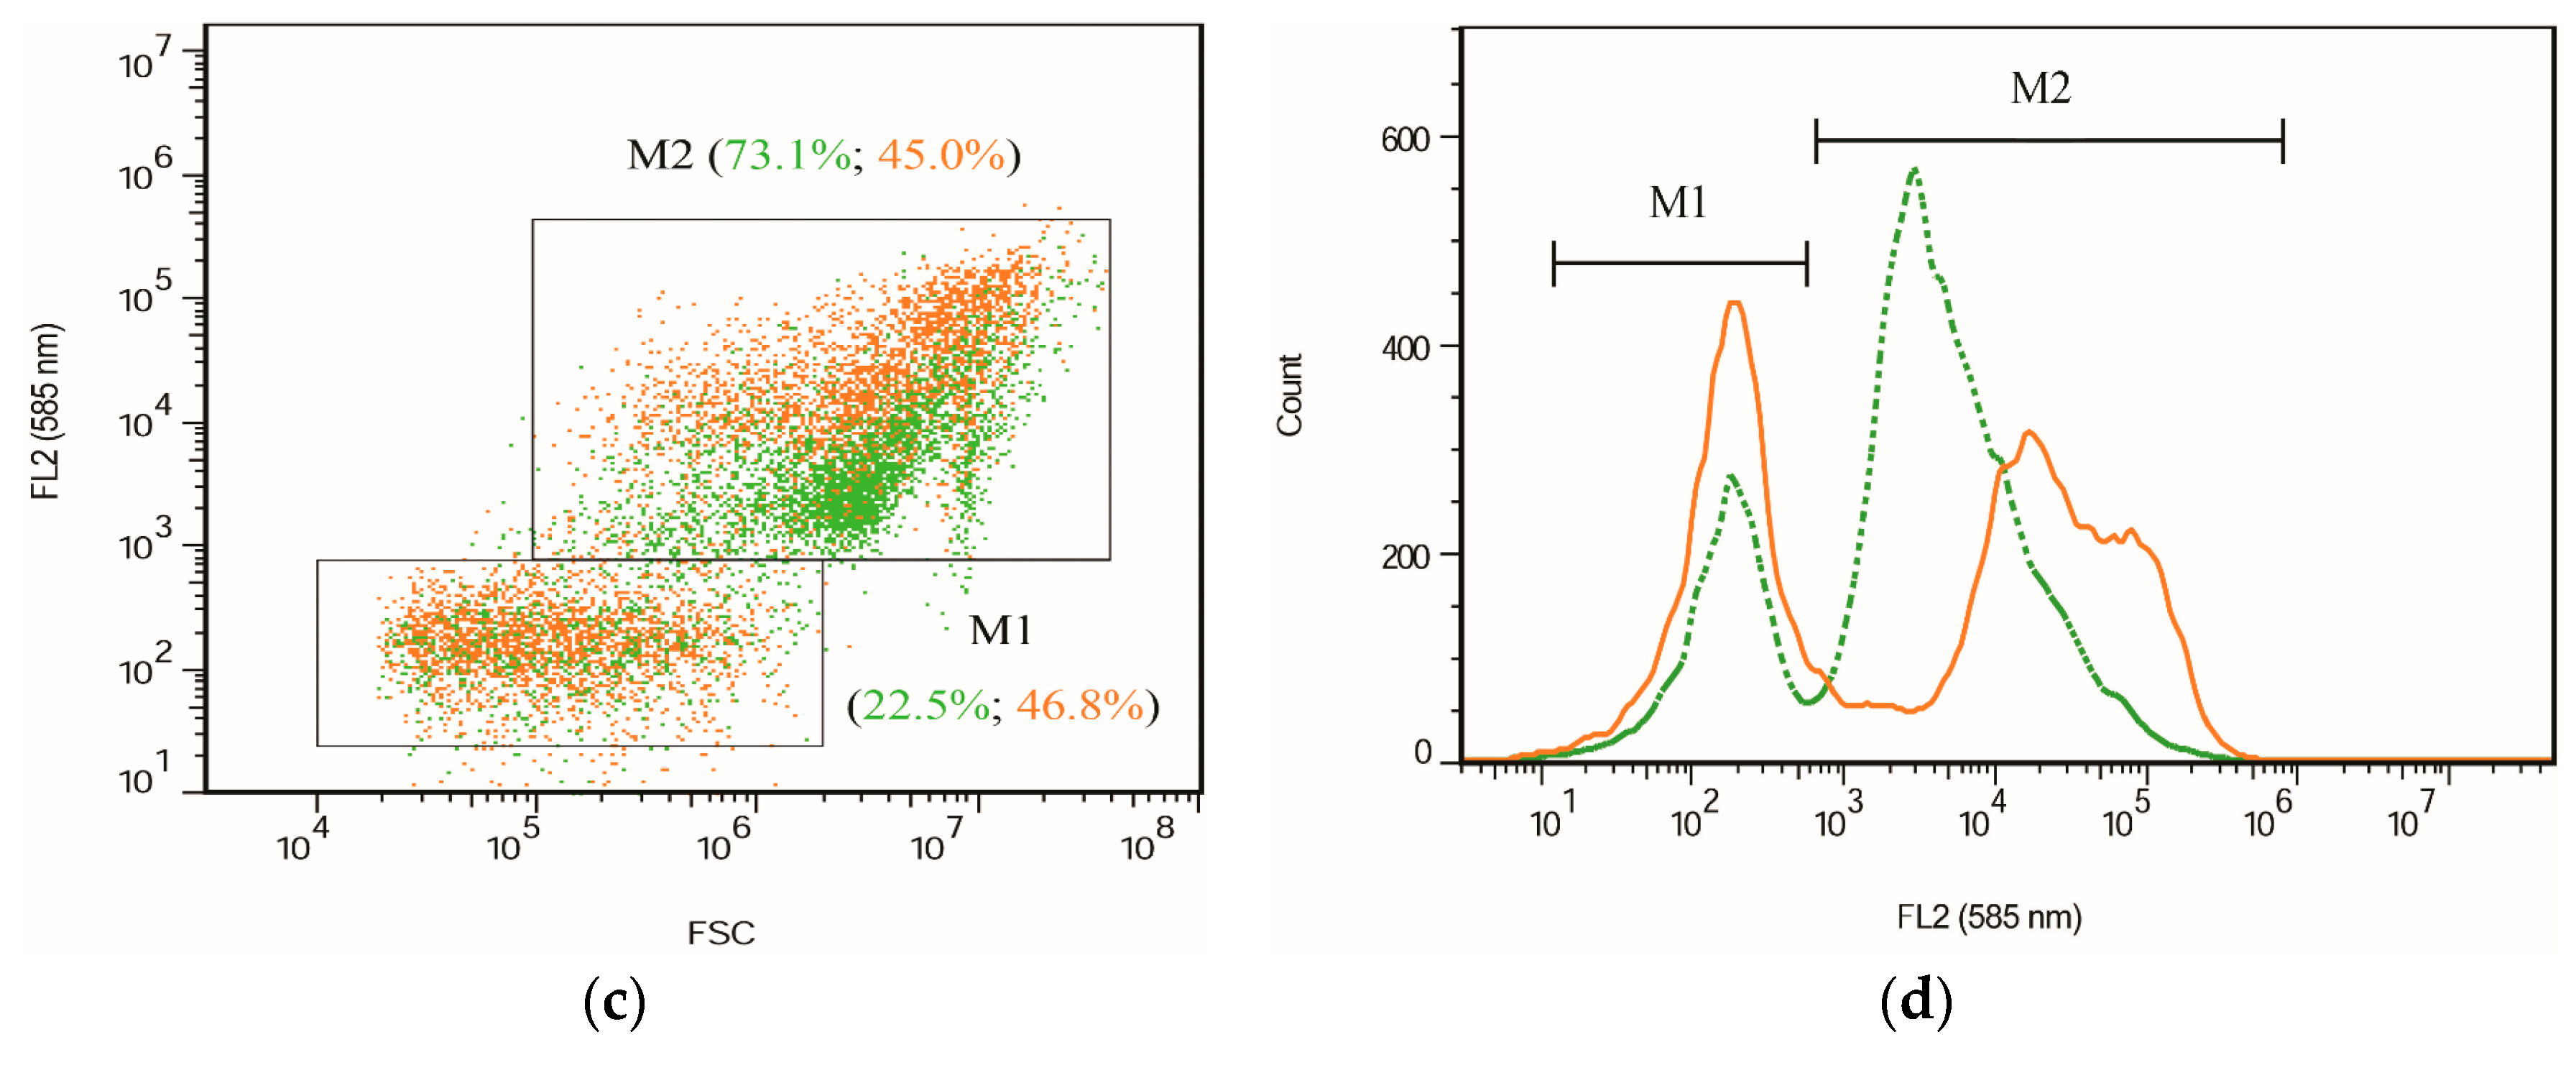
2.2. Fluorescence Images and Flow Cytometric Analysis
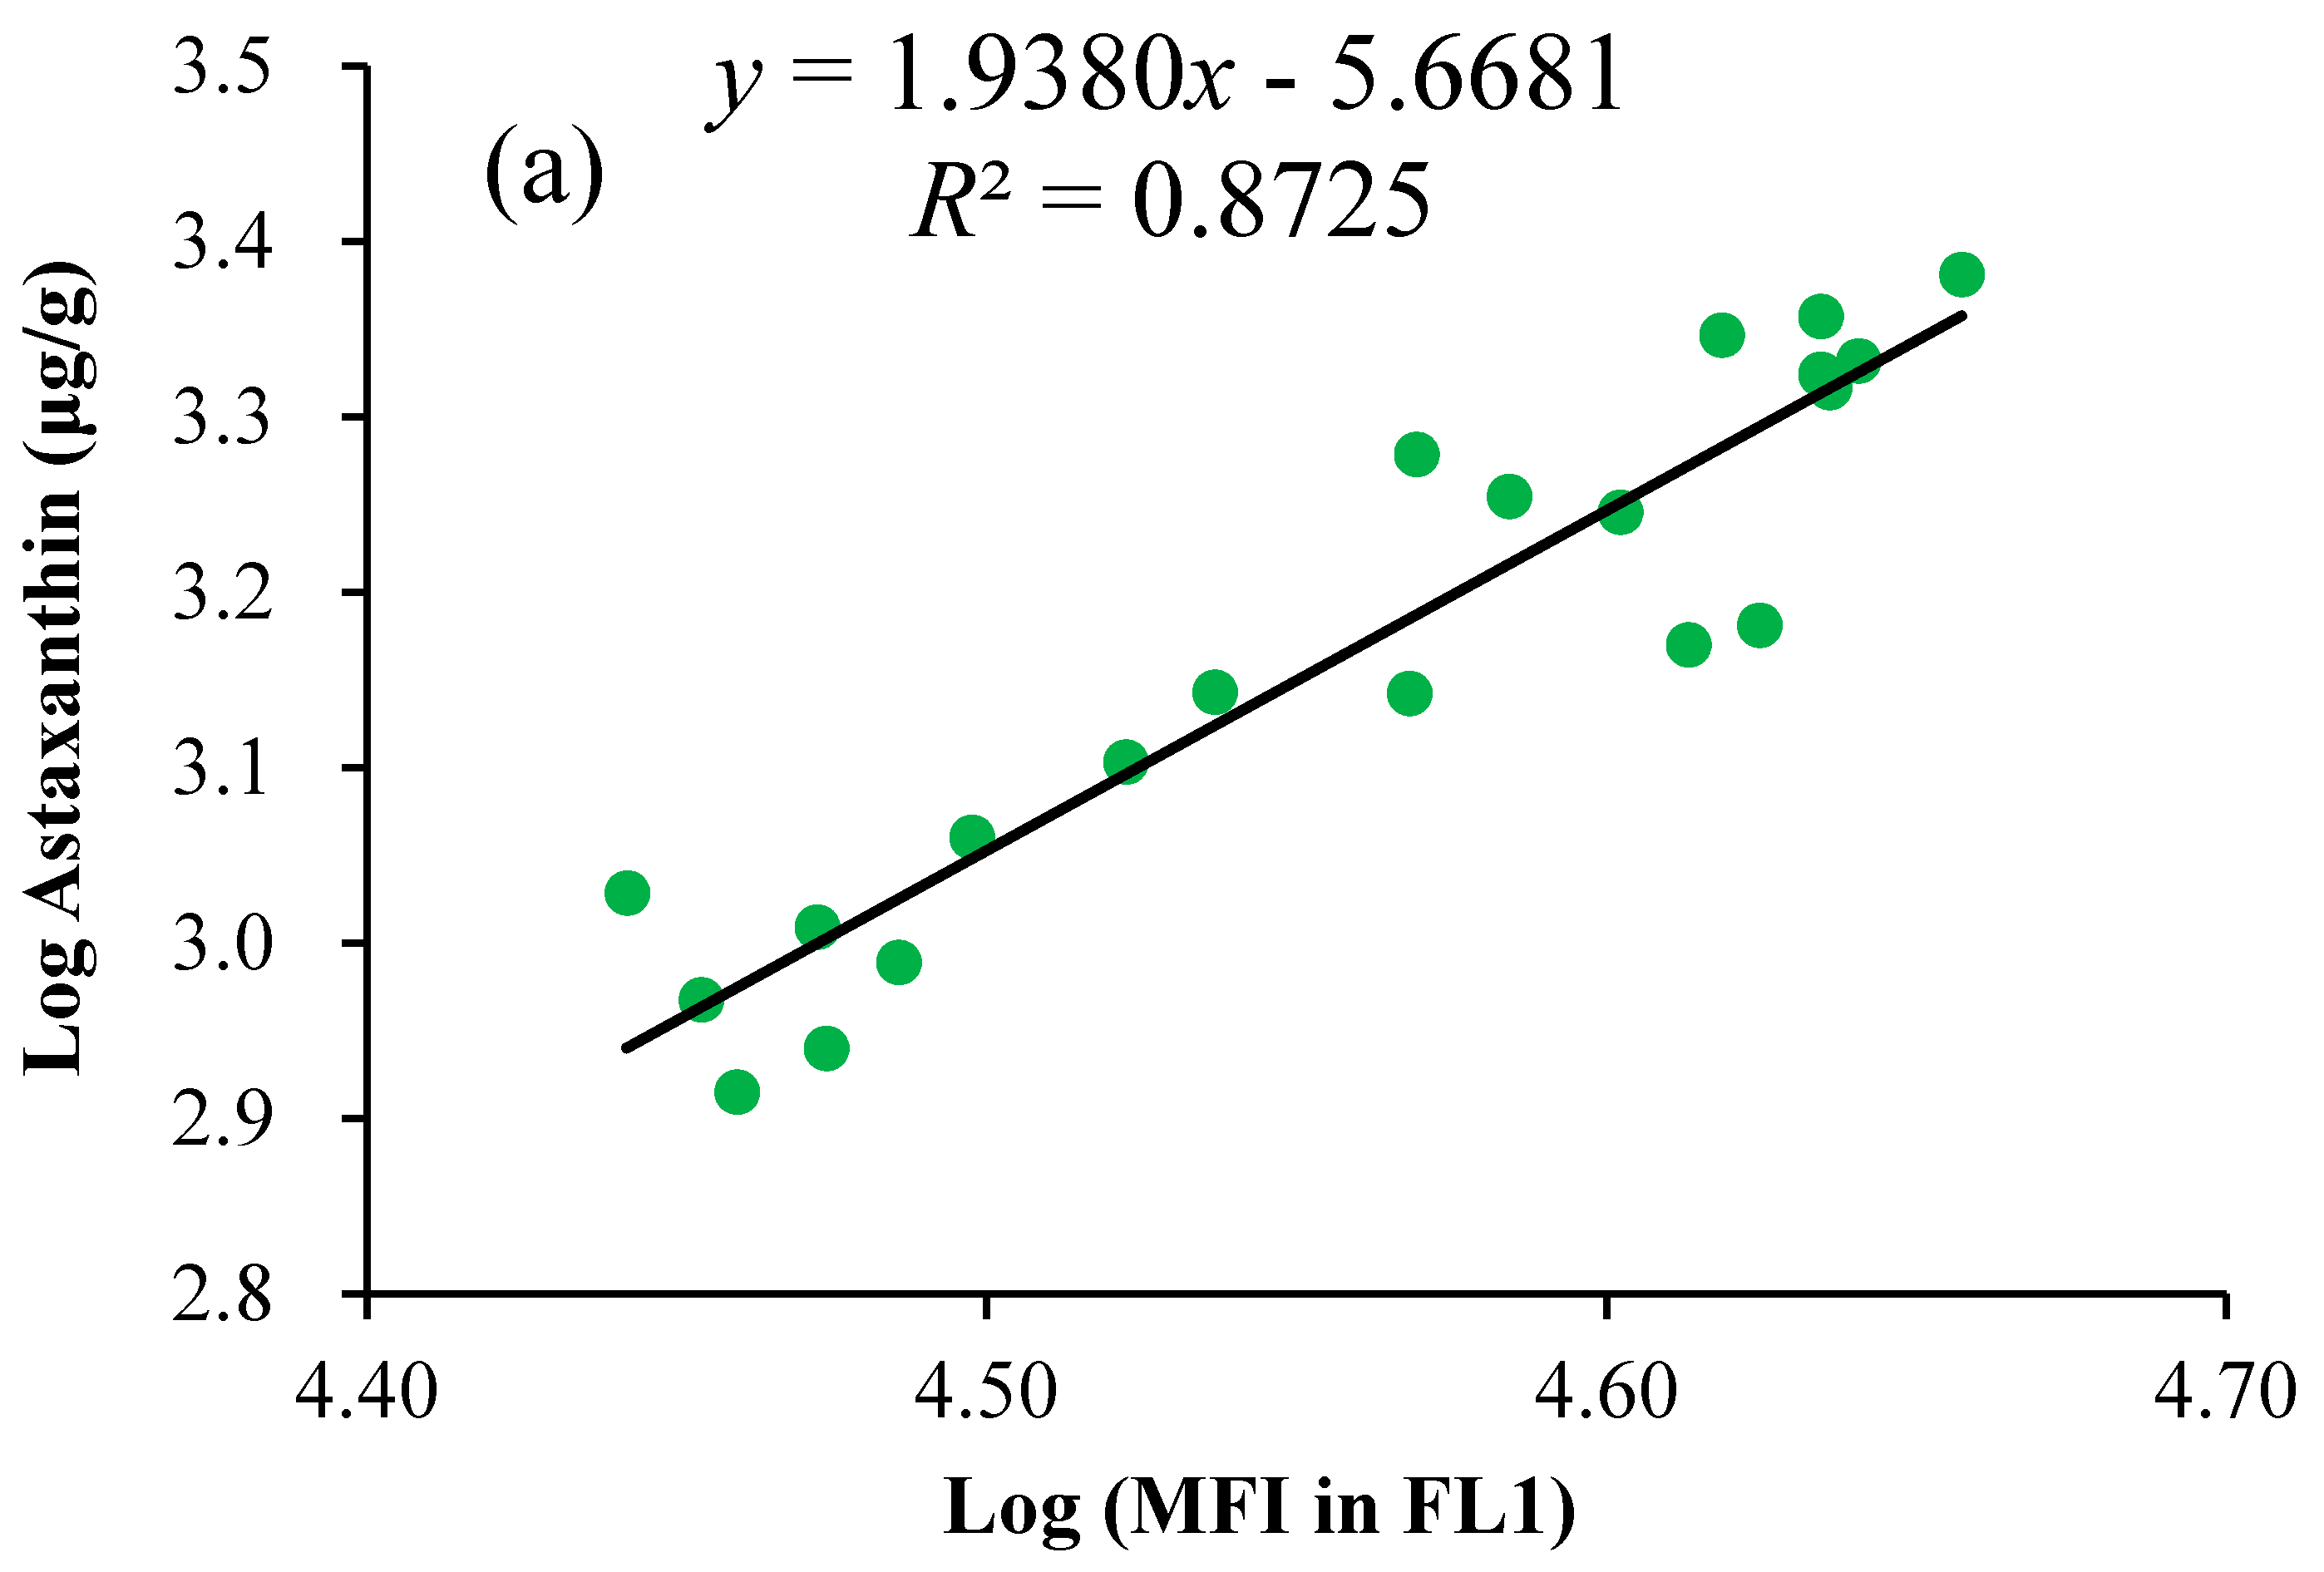
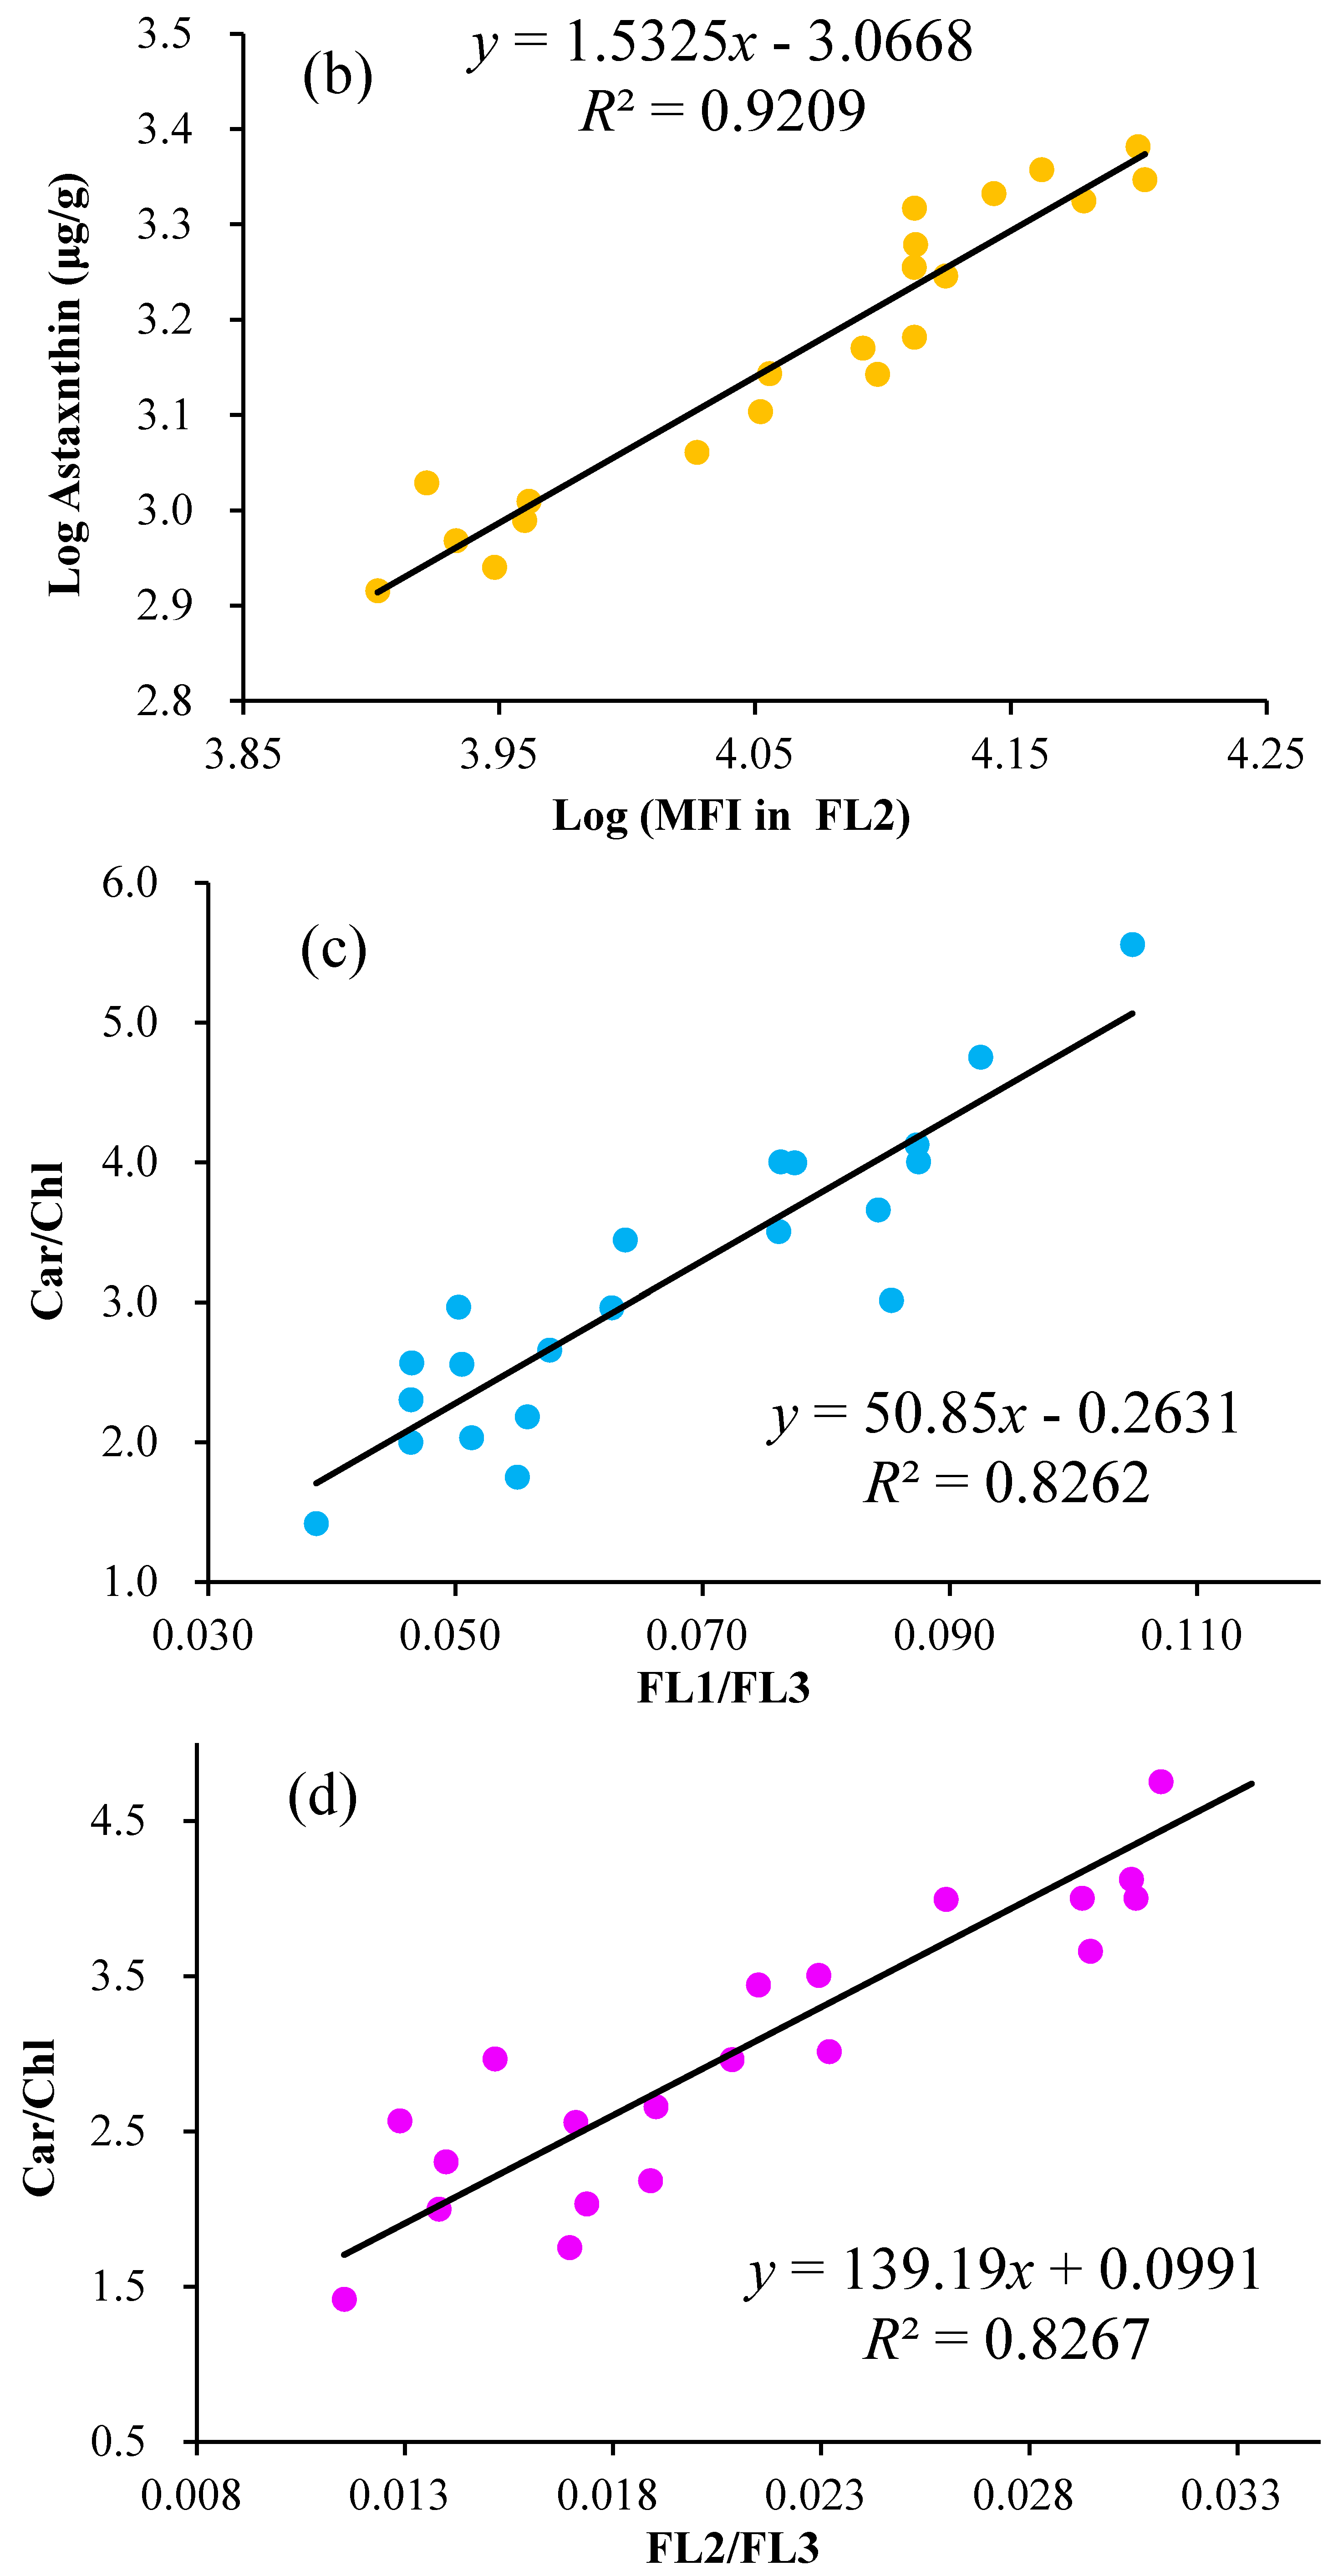
2.3. Linear Regression of the Astaxanthin Content versus Fluorescence Intensities
2.4. Linearity, Range, and Limits of Quantitation for the FCM Method
2.5. Precision, Accuracy, and Recovery of FCM Method
3. Materials and Methods
3.1. Microalgae and Culture Conditions
3.2. Chemicals and Reagents
3.3. Emission Spectra of Fluorescence and Imaging by CLSM
3.4. Flow Cytometry
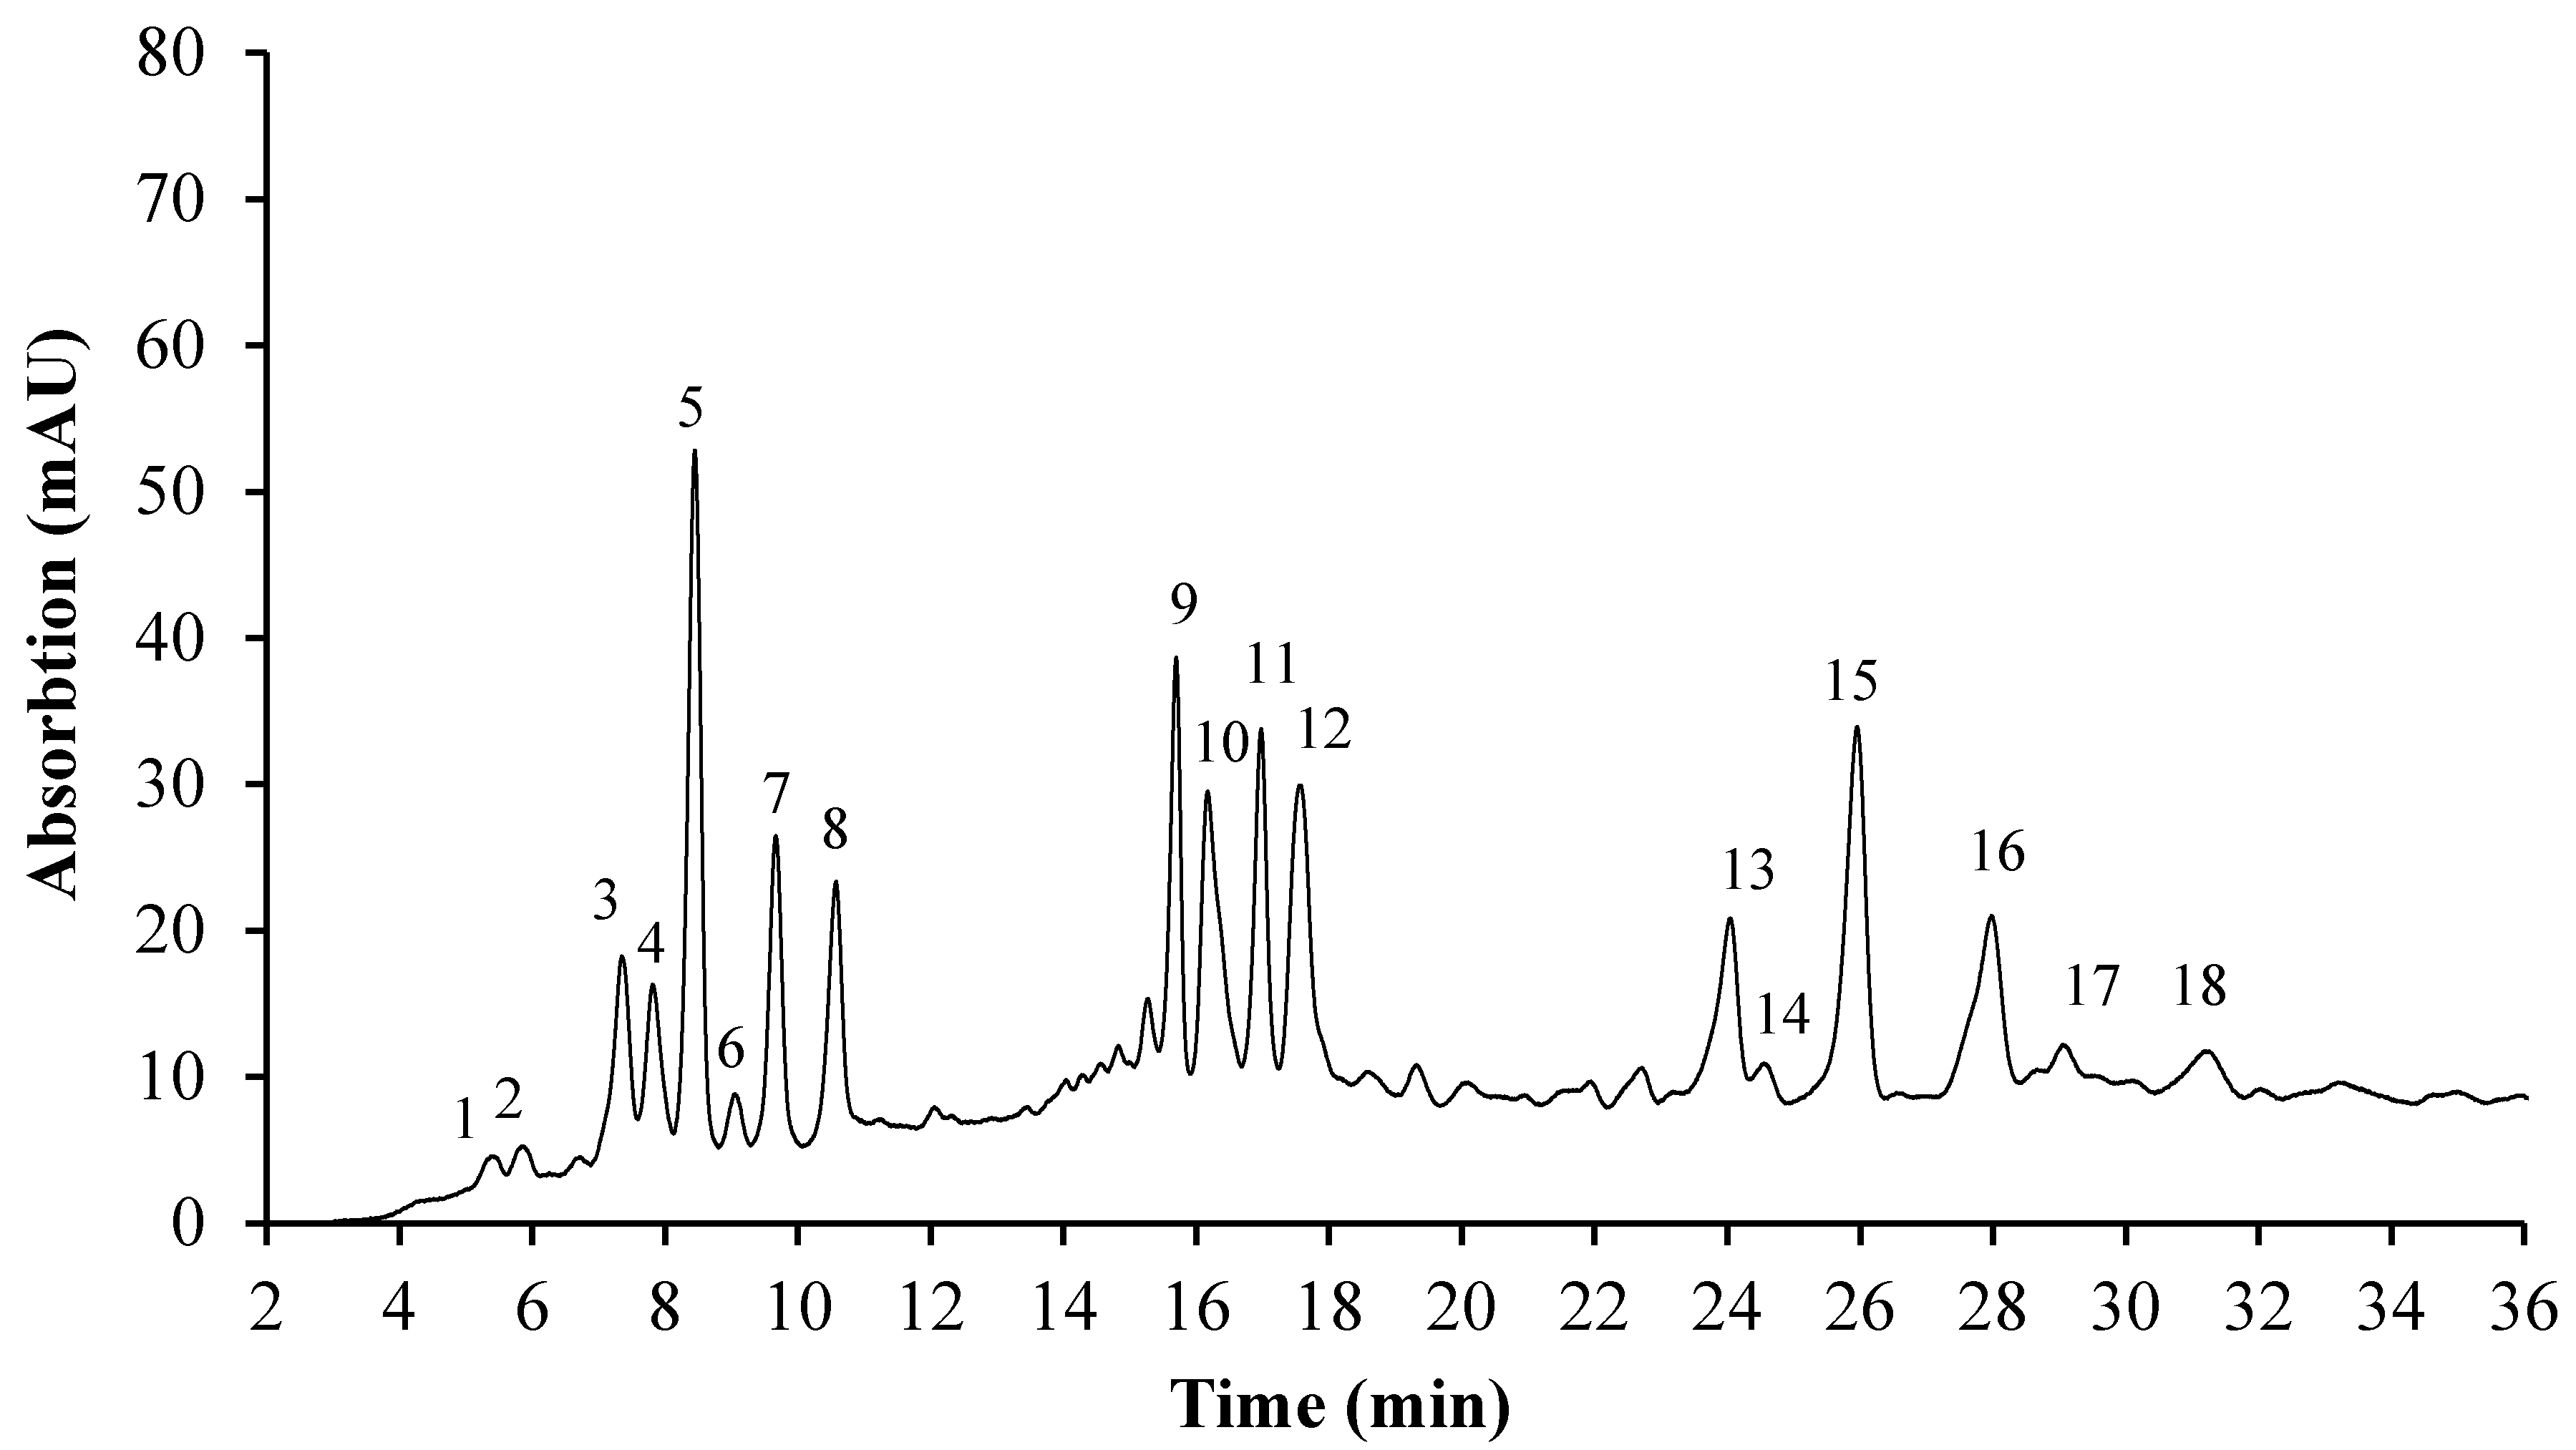
3.5. HPLC Analysis
3.6. Correlation and Regression Analysis of the Astaxanthin Content versus Fluorescence Intensities
3.7. Method Validation
3.7.1. Linear Range and Limits for FCM Method
3.7.2. Precision
3.7.3. Accuracy and Recovery
4. Conclusions
Acknowledgments
Author Contributions
Conflicts of Interest
References
- Ambati, R.R.; Phang, S.M.; Ravi, S.; Aswathanarayana, R.G. Astaxanthin: Sources, extraction, stability, biological activities and its commercial applications-a review. Mar. Drugs 2014, 12, 128–152. [Google Scholar] [CrossRef] [PubMed]
- Fassett, R.G.; Coombes, J.S. Astaxanthin: A Potential Therapeutic Agent in Cardiovascular Disease. Mar. Drugs 2011, 9, 447–465. [Google Scholar] [CrossRef] [PubMed]
- Wu, H.; Niu, H.; Shao, A.; Wu, C.; Dixon, B.J.; Zhang, J.; Yang, S.; Wang, Y. Astaxanthin as a potential neuroprotective agent for neurological diseases. Mar. Drugs 2015, 13, 5750–5766. [Google Scholar] [CrossRef] [PubMed]
- Higuera-Ciapara, I.; Felix-Valenzuela, L.; Goycoolea, F.M. Astaxanthin: A review of its chemistry and applications. Crit. Rev. Food Sci. Nutr. 2006, 46, 185–196. [Google Scholar] [CrossRef] [PubMed]
- Schmidt, I.; Schewe, H.; Gassel, S.; Jin, C.; Buckingham, J.; Huembelin, M.; Sandmann, G.; Schrader, J. Biotechnological production of astaxanthin with Phaffia rhodozyma/Xanthophyllomyces dendrorhous. Appl. Microbiol. Biotechnol. 2011, 89, 555–571. [Google Scholar] [CrossRef] [PubMed]
- Huangfu, J.; Liu, J.; Sun, Z.; Wang, M.; Jiang, Y.; Chen, Z.-Y.; Chen, F. Antiaging effects of astaxanthin-rich alga Haematococcus pluvialis on fruit flies under oxidative stress. J. Agric. Food Chem. 2013, 61, 7800–7804. [Google Scholar] [CrossRef] [PubMed]
- Guerin, M.; Huntley, M.E.; Olaizola, M. Haematococcus astaxanthin: Applications for human health and nutrition. Trends Biotechnol. 2003, 21, 210–216. [Google Scholar] [CrossRef]
- Champenois, J.; Marfaing, H.; Pierre, R. Review of the taxonomic revision of Chlorella and consequences for its food uses in Europe. J. Appl. Phycol. 2015, 27, 1845–1851. [Google Scholar] [CrossRef]
- Solovchenko, A.E. Recent breakthroughs in the biology of astaxanthin accumulation by microalgal cell. Photosynthesis Res. 2015, 125, 437–449. [Google Scholar] [CrossRef] [PubMed]
- Liu, J.; Sun, Z.; Gerken, H.; Liu, Z.; Jiang, Y.; Chen, F. Chlorella zofingiensis as an Alternative Microalgal Producer of Astaxanthin: Biology and Industrial Potential. Mar. Drugs 2014, 12, 3487–3515. [Google Scholar] [CrossRef] [PubMed]
- Mulders, K.J.M.; Weesepoel, Y.; Bodenes, P.; Lamers, P.P.; Vincken, J.-P.; Martens, D.E.; Gruppen, H.; Wijffels, R.H. Nitrogen-depleted Chlorella zofingiensis produces astaxanthin, ketolutein and their fatty acid esters: A carotenoid metabolism study. J. Appl. Phycol. 2015, 27, 125–140. [Google Scholar] [CrossRef]
- Solovchenko, A.; Aflalo, C.; Lukyanov, A.; Boussiba, S. Nondestructive monitoring of carotenogenesis in Haematococcus pluvialis via whole-cell optical density spectra. Appl. Microbiol. Biotechnol. 2013, 97, 4533–4541. [Google Scholar] [CrossRef] [PubMed]
- Kim, D.-Y.; Vijayan, D.; Praveenkumar, R.; Han, J.-I.; Lee, K.; Park, J.-Y.; Chang, W.-S.; Lee, J.-S.; Oh, Y.-K. Cell-wall disruption and lipid/astaxanthin extraction from microalgae: Chlorella and Haematococcus. Bioresour. Technol. 2016, 199, 300–310. [Google Scholar] [CrossRef] [PubMed]
- Liu, J.; Sun, Z.; Gerken, H.; Huang, J.; Jiang, Y.; Chen, F. Genetic engineering of the green alga Chlorella zofingiensis: A modified norflurazon-resistant phytoene desaturase gene as a dominant selectable marker. Appl. Microbiol. Biotechnol. 2014, 98, 5069–5079. [Google Scholar] [CrossRef] [PubMed]
- Amorim-Carrilho, K.T.; Cepeda, A.; Fente, C.; Regal, P. Review of methods for analysis of carotenoids. Trac-Trends Anal. Chem. 2014, 56, 49–73. [Google Scholar] [CrossRef]
- Rivera, S.M.; Canela-Garayoa, R. Analytical tools for the analysis of carotenoids in diverse materials. J. Chromatogr. 2012, 1224, 1–10. [Google Scholar] [CrossRef] [PubMed]
- Nicolaie, B.M.; Beullens, K.; Bobelyn, E.; Peirs, A.; Saeys, W.; Theron, K.I.; Lammertyn, J. Nondestructive measurement of fruit and vegetable quality by means of NIR spectroscopy: A review. Postharvest Biol. Technol. 2007, 46, 99–118. [Google Scholar] [CrossRef]
- De Oliveira, V.E.; Neves Miranda, M.A.C.; Silva Soares, M.C.; Edwards, H.G.M.; Cappa de Oliveira, L.F. Study of carotenoids in cyanobacteria by Raman spectroscopy. Spectrochim. Acta Part A-Mol. Biomol. Spectrosc. 2015, 150, 373–380. [Google Scholar] [CrossRef] [PubMed]
- Rungpichayapichet, P.; Mahayothee, B.; Khuwijitjaru, P.; Nagle, M.; Mueller, J. Non-destructive determination of beta-carotene content in mango by near-infrared spectroscopy compared with colorimetric measurements. J. Food Compost. Anal. 2015, 38, 32–41. [Google Scholar] [CrossRef]
- Hyka, P.; Lickova, S.; Pribyl, P.; Melzoch, K.; Kovar, K. Flow cytometry for the development of biotechnological processes with microalgae. Biotechnol. Adv. 2013, 31, 2–16. [Google Scholar] [CrossRef] [PubMed]
- An, G.H.; Suh, O.S.; Kwon, H.C.; Kim, K.; Johnson, E.A. Quantification of carotenoids in cells of Phaffia rhodozyma by autofluorescence. Biotechnol. Lett. 2000, 22, 1031–1034. [Google Scholar] [CrossRef]
- Ukibe, K.; Katsuragi, T.; Tani, Y.; Takagi, H. Efficient screening for astaxanthin-overproducing mutants of the yeast Xanthophyllomyces dendrorhous by flow cytometry. FEMS Microbiol. Lett. 2008, 286, 241–248. [Google Scholar] [CrossRef] [PubMed]
- An, G.H.; Bielich, J.; Auerbach, R.; Johnson, E.A. Isolation and characterization of carotenoid hyperproducing mutants of yeast by flow cytometry and cell sorting. Biotechnology 1991, 9, 70–73. [Google Scholar] [CrossRef] [PubMed]
- Cordero, B.F.; Couso, I.; Leon, R.; Rodriguez, H.; Angeles Vargas, M. Isolation and Characterization of a Lycopene epsilon-Cyclase Gene of Chlorella (Chromochloris) zofingiensis. Regulation of the Carotenogenic Pathway by Nitrogen and Light. Mar. Drugs 2012, 10, 2069–2088. [Google Scholar] [CrossRef] [PubMed]
- Demmig-Adams, B.; Gilmore, A.M.; Adams, W.W., 3rd. Carotenoids 3: In vivo function of carotenoids in higher plants. FASEB J. 1996, 10, 403–412. [Google Scholar] [PubMed]
- Gabriela Lagorio, M.; Cordon, G.B.; Iriel, A. Reviewing the relevance of fluorescence in biological systems. Photochem. Photobiol. Sci. 2015, 14, 1538–1559. [Google Scholar] [CrossRef] [PubMed]
- Kleinegris, D.M.M.; van Es, M.A.; Janssen, M.; Brandenburg, W.A.; Wijffels, R.H. Carotenoid fluorescence in Dunaliella salina. J. Appl. Phycol. 2010, 22, 645–649. [Google Scholar] [CrossRef] [PubMed]
- Ermakov, I.V.; Sharifzadeh, M.; Ermakova, M.; Gellermann, W. Resonance Raman detection of carotenoid antioxidants in living human tissue. J. Biomed. Opt. 2005, 10, 1179–1181. [Google Scholar] [CrossRef] [PubMed]
- Rioboo, C.; Gonzalez-Barreiro, O.; Abalde, J.; Cid, A. Flow cytometric analysis of the encystment process induced by paraquat exposure in Haematococcus pluvialis (Chlorophyceae). Eur. J. Phycol. 2011, 46, 89–97. [Google Scholar] [CrossRef]
- Wayama, M.; Ota, S.; Matsuura, H.; Nango, N.; Hirata, A.; Kawano, S. Three-dimensional ultrastructural study of oil and astaxanthin accumulation during encystment in the green alga Haematococcus pluvialis. PLoS ONE 2013, 8, e53618. [Google Scholar] [CrossRef] [PubMed]
- Schoefs, B. Chlorophyll and carotenoid analysis in food products. Properties of the pigments and methods of analysis. Trends Food Sci. Technol. 2002, 13, 361–371. [Google Scholar] [CrossRef]
- Englert, G. UV/Visible spectroscopy. In Carotenoids; Volume 1B: Spectroscopy; Britton, G., Liaaenjensen, S., Pfander, H., Eds.; Birkhäuser: Basel, Switzerland, 1995; Volume 1B, pp. 13–63. [Google Scholar]
- Porcar-Castell, A.; Berry, J.A. Linking chlorophyll a fluorescence to photosynthesis for remote sensing applications: Mechanisms and challenges. JEXB 2014, 65, 4065. [Google Scholar] [CrossRef] [PubMed]
- Narayan, A.; Misra, M.; Singh, R. Chlorophyll Fluorescence in Plant Biology. In Biophysics; Intech: Rijeka, Croatia, 2012; pp. 171–192. [Google Scholar]
- Hu, Z.; Li, Y.; Sommerfeld, M.; Chen, F.; Hu, Q. Enhanced protection against oxidative stress in an astaxanthin-overproduction Haematococcus mutant (Chlorophyceae). Eur. J. Phycol. 2008, 43, 365–376. [Google Scholar] [CrossRef]
- Davis, R.W.; Carvalho, B.J.; Jones, H.D.T.; Singh, S. The role of photo-osmotic adaptation in semi-continuous culture and lipid particle release from Dunaliella viridis. J. Appl. Phycol. 2015, 27, 109–123. [Google Scholar] [CrossRef] [PubMed]
- Eullaffroy, P.; Vernet, G. The F684/F735 chlorophyll fluorescence ratio: A potential tool for rapid detection and determination of herbicide phytotoxicity in algae. Water Res. 2003, 37, 1983–1990. [Google Scholar] [CrossRef]
- Chen, T.; Liu, J.; Guo, B.; Ma, X.; Sun, P.; Liu, B.; Chen, F. Light attenuates lipid accumulation while enhancing cell proliferation and starch synthesis in the glucose-fed oleaginous microalga Chlorella Zofingiensis. Sci. Rep. 2015, 5, 14936. [Google Scholar] [CrossRef] [PubMed]
- Cutzu, R.; Clemente, A.; Reis, A.; Nobre, B.; Mannazzu, I.; Roseiro, J.; da Silva, T.L. Assessment of beta-carotene content, cell physiology and morphology of the yellow yeast Rhodotorula glutinis mutant 400A15 using flow cytometry. J. Ind. Microbiol. Biotechnol. 2013, 40, 865–875. [Google Scholar] [CrossRef] [PubMed]
- Freitas, C.; Nobre, B.; Gouveia, L.; Roseiro, J.; Reis, A.; da Silva, T.L. New at-line flow cytometric protocols for determining carotenoid content and cell viability during Rhodosporidium toruloides NCYC 921 batch growth. Process Biochem. 2014, 49, 554–562. [Google Scholar] [CrossRef]
- Kula, M.; Rys, M.; Mozdzen, K.; Skoczowski, A. Metabolic activity, the chemical composition of biomass and photosynthetic activity of Chlorella vulgaris under different light spectra in photobioreactors. Eng. Life Sci. 2014, 14, 57–67. [Google Scholar] [CrossRef]
- Mueller, S.; Galliardt, H.; Schneider, J.; Barisas, B.G.; Seidel, T. Quantification of Forster resonance energy transfer by monitoring sensitized emission in living plant cells. Front. Plant Sci. 2013, 4, 413. [Google Scholar] [CrossRef] [PubMed]
- Lee, C.S.; Yeo, Y.S.W.; Sin, T.M. Bleaching response of Symbiodinium (zooxanthellae): Determination by flow cytometry. Cytom. Part A 2012, 81, 888–895. [Google Scholar] [CrossRef] [PubMed]
- Solovchenko, A.E.; Chivkunova, O.B.; Maslova, I.P. Pigment composition, optical properties, and resistance to photodamage of the microalga Haematococcus pluvialis cultivated under high light. Russ. J. Plant Physiol. 2011, 58, 9–17. [Google Scholar] [CrossRef]
- Solovchenko, A.E.; Khozin-Goldberg, I.; Cohen, Z.; Merzlyak, M.N. Carotenoid-to-chlorophyll ratio as a proxy for assay of total fatty acids and arachidonic acid content in the green microalga Parietochloris incisa. J. Appl. Phycol. 2009, 21, 361–366. [Google Scholar] [CrossRef]
- Lee, J.; Rennaker, C.; Wrolstad, R.E. Correlation of two anthocyanin quantification methods: HPLC and spectrophotometric methods. Food Chem. 2008, 110, 782–786. [Google Scholar] [CrossRef]
- Lao, F.; Giusti, M.M. Quantification of Purple Corn (Zea mays L.) Anthocyanins Using Spectrophotometric and HPLC Approaches: Method Comparison and Correlation. Food Anal. Methods 2016, 9, 1367–1380. [Google Scholar] [CrossRef]
- Taverniers, I.; De Loose, M.; Van Bockstaele, E. Trends in quality in the analytical laboratory. II. Analytical method validation and quality assurance. Trac-Trends Anal. Chem. 2004, 23, 535–552. [Google Scholar] [CrossRef]
- Peters, F.T.; Drummer, O.H.; Musshoff, F. Validation of new methods. Forensic Sci. Int. 2007, 165, 216–224. [Google Scholar] [CrossRef] [PubMed]
- Gonzalez, A.G.; Herrador, M.A.; Asuero, A.G. Intra-laboratory testing of method accuracy from recovery assays. Talanta 1999, 48, 729–736. [Google Scholar] [CrossRef]
- Chen, J.; Liu, X.; Wei, D.; Chen, G. High yields of fatty acid and neutral lipid production from cassava bagasse hydrolysate (CBH) by heterotrophic Chlorella protothecoides. Bioresour. Technol. 2015, 191, 281–290. [Google Scholar] [CrossRef] [PubMed]
- Asuero, A.G.; Bueno, J.M. Fitting Straight Lines with Replicated Observations by Linear Regression. IV. Transforming Data. Crit. Rev. Anal. Chem. 2011, 41, 36–69. [Google Scholar] [CrossRef]


| No. | MFI in FL2 (a.u.) | MFI in FL3 (a.u.) | Asta. Content by FCM (mg/g) | Car/Chl Ratio by FCM | Astaxanthin | Car/Chl Ratio | ||||
|---|---|---|---|---|---|---|---|---|---|---|
| Mean Value (mg/g) | Relative Error (RE, %) | Relative Standard Deviation (RSD, %) | Mean Value | Relative Error (RE, %) | Relative Standard Deviation (RSD, %) | |||||
| 1 | 14,230 | 468,000 | 1.99 | 4.37 | 2.03 ± 0.05 | 1.93 | 2.20 | 4.32 ± 0.04 | 11.05 | 1.10 |
| 2 | 14,350 | 468,430 | 2.01 | 4.36 | ||||||
| 3 | 14,747 | 489,000 | 2.10 | 4.30 | ||||||
| 4 | 14,630 | 484,860 | 2.07 | 4.30 | ||||||
| 5 | 14,405 | 480,100 | 2.02 | 4.28 | ||||||
| No. | 1 | 2 | 3 | 4 | 5 | Mean Value | |
|---|---|---|---|---|---|---|---|
| Sample 1 | MFI in FL2 (a.u.) | 7914 | 8056 | 8301 | 8233 | 8117 | 8124 ± 151 |
| MFI in FL3 (a.u.) | 634,600 | 651,000 | 726,080 | 718,860 | 704,560 | 687,000 ± 41,500 | |
| FL2/FL3 | 0.0125 | 0.0124 | 0.0114 | 0.0115 | 0.0115 | 0.0119 ± 0.0005 | |
| Measured value by FCM | Asta. (mg/g) | 0.81 | 0.83 | 0.87 | 0.86 | 0.84 | 0.84 ± 0.02 |
| Car/Chl | 1.83 | 1.82 | 1.69 | 1.69 | 1.70 | 1.75 ± 0.07 | |
| Accuracy analysis (%) | Asta. | 87.75 | 90.17 | 94.41 | 93.23 | 91.22 | 91.36 ± 2.61 |
| Car/Chl | 79.15 | 78.57 | 72.92 | 73.03 | 73.44 | 75.42 ± 3.15 | |
| Sample 2 | MFI in FL2 (a.u.) | 12,177 | 12,281 | 12,545 | 12,408 | 12,186 | 12,319 ± 156 |
| MFI in FL3 (a.u.) | 558,740 | 565,610 | 598,240 | 591,460 | 580,000 | 578,800 ± 16,700 | |
| FL2/FL3 | 0.0218 | 0.0217 | 0.0209 | 0.0209 | 0.0210 | 0.0213 ± 0.0005 | |
| Measured value by FCM | Asta.(mg/g) | 1.56 | 1.58 | 1.64 | 1.61 | 1.57 | 1.59 ± 0.03 |
| Car/Chl | 3.13 | 3.12 | 3.02 | 3.02 | 3.02 | 3.06 ± 0.06 | |
| Accuracy analysis (%) | Asta. | 94.75 | 95.99 | 99.17 | 97.52 | 94.86 | 96.46 ± 1.88 |
| Car/Chl | 103.65 | 103.28 | 99.86 | 99.90 | 100.00 | 101.34 ± .95 | |
| Recovery (%) | Asta. | 103.58 | 103.33 | 105.16 | 102.93 | 99.45 | |
| Car/Chl | 78.60 | 78.73 | 80.41 | 80.31 | 80.02 | ||
| Average recovery (%) | Asta. | 102.89 ± 2.10 | |||||
| Car/Chl | 79.61 ± 0.88 | ||||||
| Relative standard deviation of recovery (RSD, %) | Asta. | 2.04 | |||||
| Car/Chl | 1.10 | ||||||
© 2017 by the authors. Licensee MDPI, Basel, Switzerland. This article is an open access article distributed under the terms and conditions of the Creative Commons Attribution (CC BY) license (http://creativecommons.org/licenses/by/4.0/).
Share and Cite
Chen, J.; Wei, D.; Pohnert, G. Rapid Estimation of Astaxanthin and the Carotenoid-to-Chlorophyll Ratio in the Green Microalga Chromochloris zofingiensis Using Flow Cytometry. Mar. Drugs 2017, 15, 231. https://doi.org/10.3390/md15070231
Chen J, Wei D, Pohnert G. Rapid Estimation of Astaxanthin and the Carotenoid-to-Chlorophyll Ratio in the Green Microalga Chromochloris zofingiensis Using Flow Cytometry. Marine Drugs. 2017; 15(7):231. https://doi.org/10.3390/md15070231
Chicago/Turabian StyleChen, Junhui, Dong Wei, and Georg Pohnert. 2017. "Rapid Estimation of Astaxanthin and the Carotenoid-to-Chlorophyll Ratio in the Green Microalga Chromochloris zofingiensis Using Flow Cytometry" Marine Drugs 15, no. 7: 231. https://doi.org/10.3390/md15070231
APA StyleChen, J., Wei, D., & Pohnert, G. (2017). Rapid Estimation of Astaxanthin and the Carotenoid-to-Chlorophyll Ratio in the Green Microalga Chromochloris zofingiensis Using Flow Cytometry. Marine Drugs, 15(7), 231. https://doi.org/10.3390/md15070231