
Thielavins W–Z7, New Antifouling Thielavins from the Marine-Derived Fungus Thielavia sp. UST030930-004


 and
and
Abstract
:1. Introduction
2. Results and Discussion
2.1. Identification of the Fungus
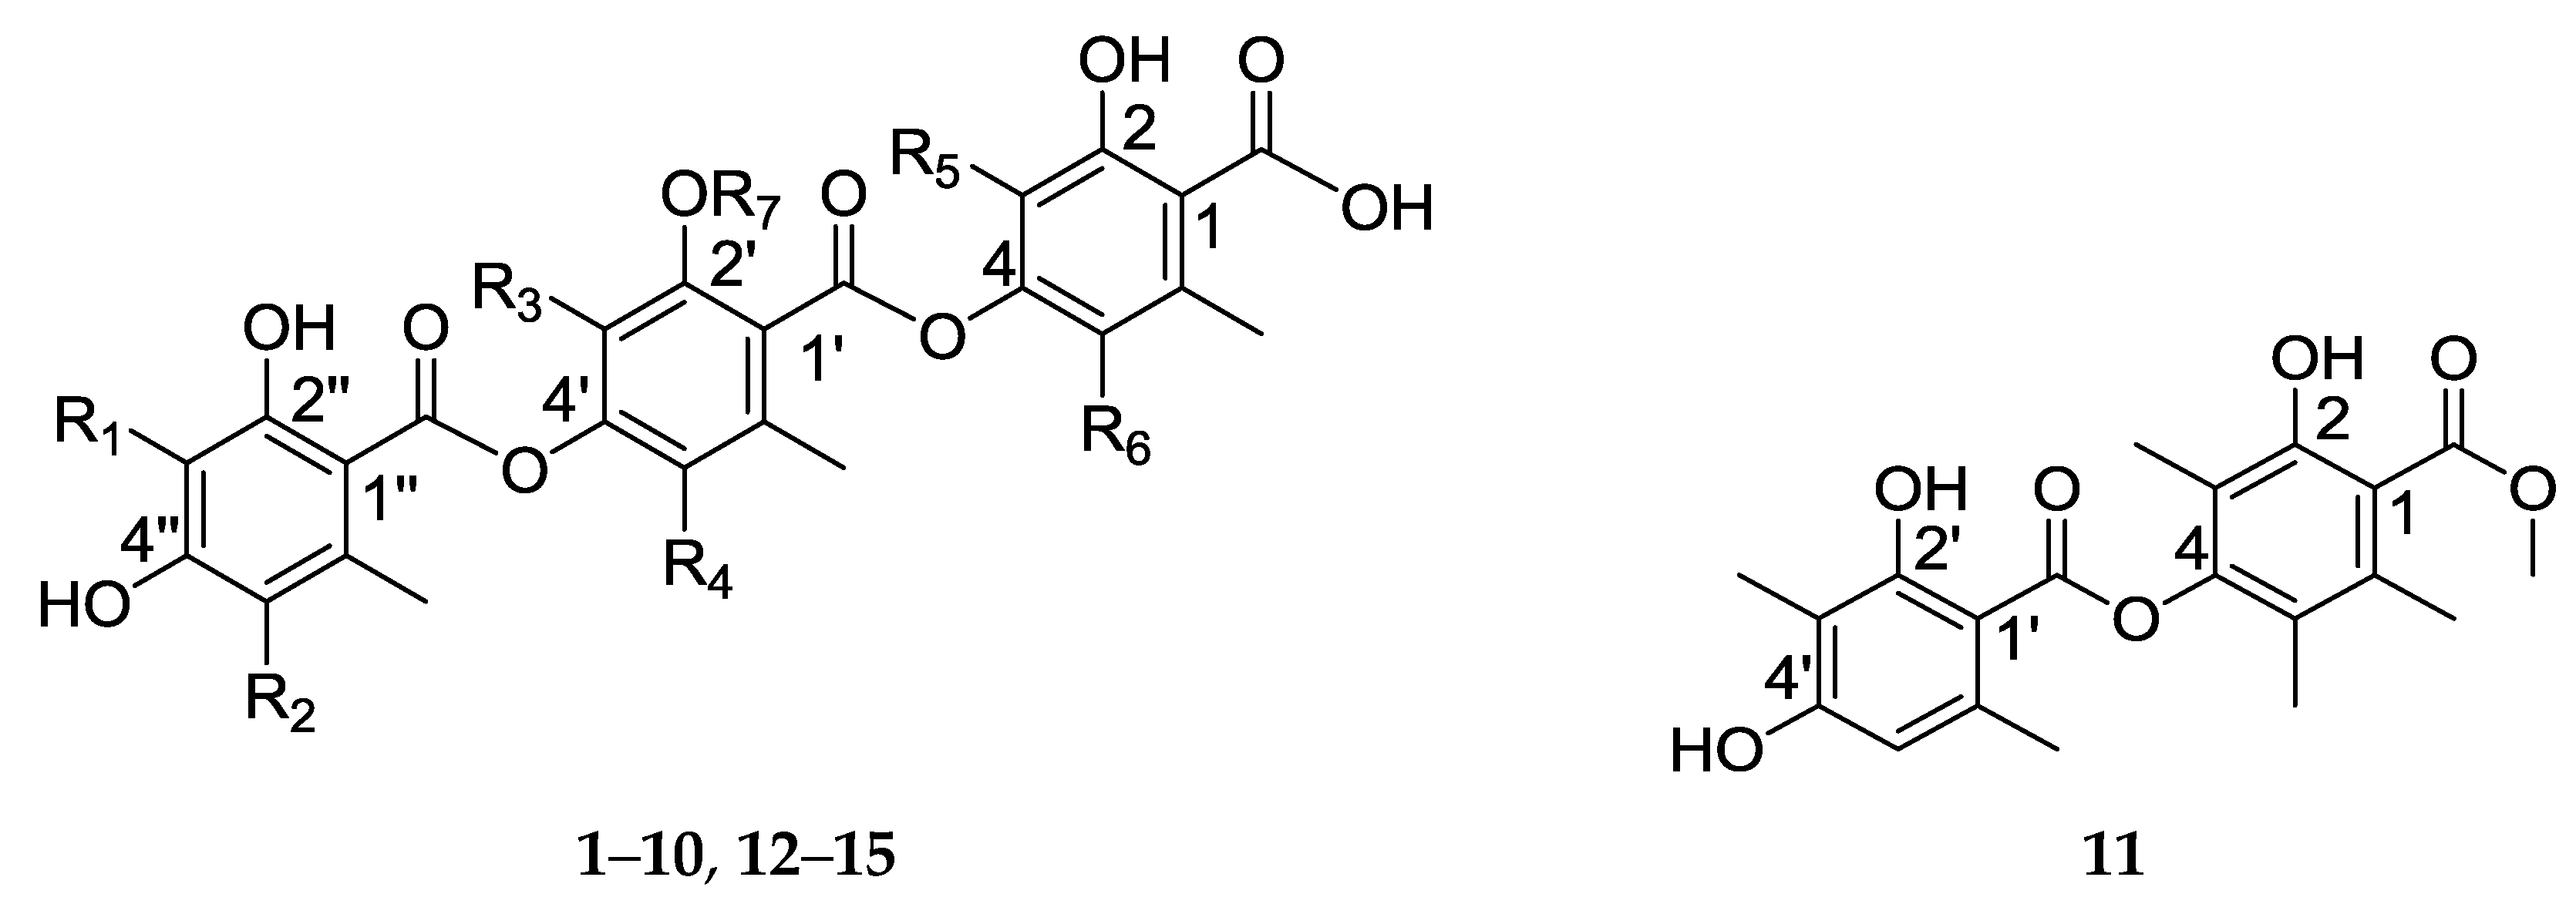
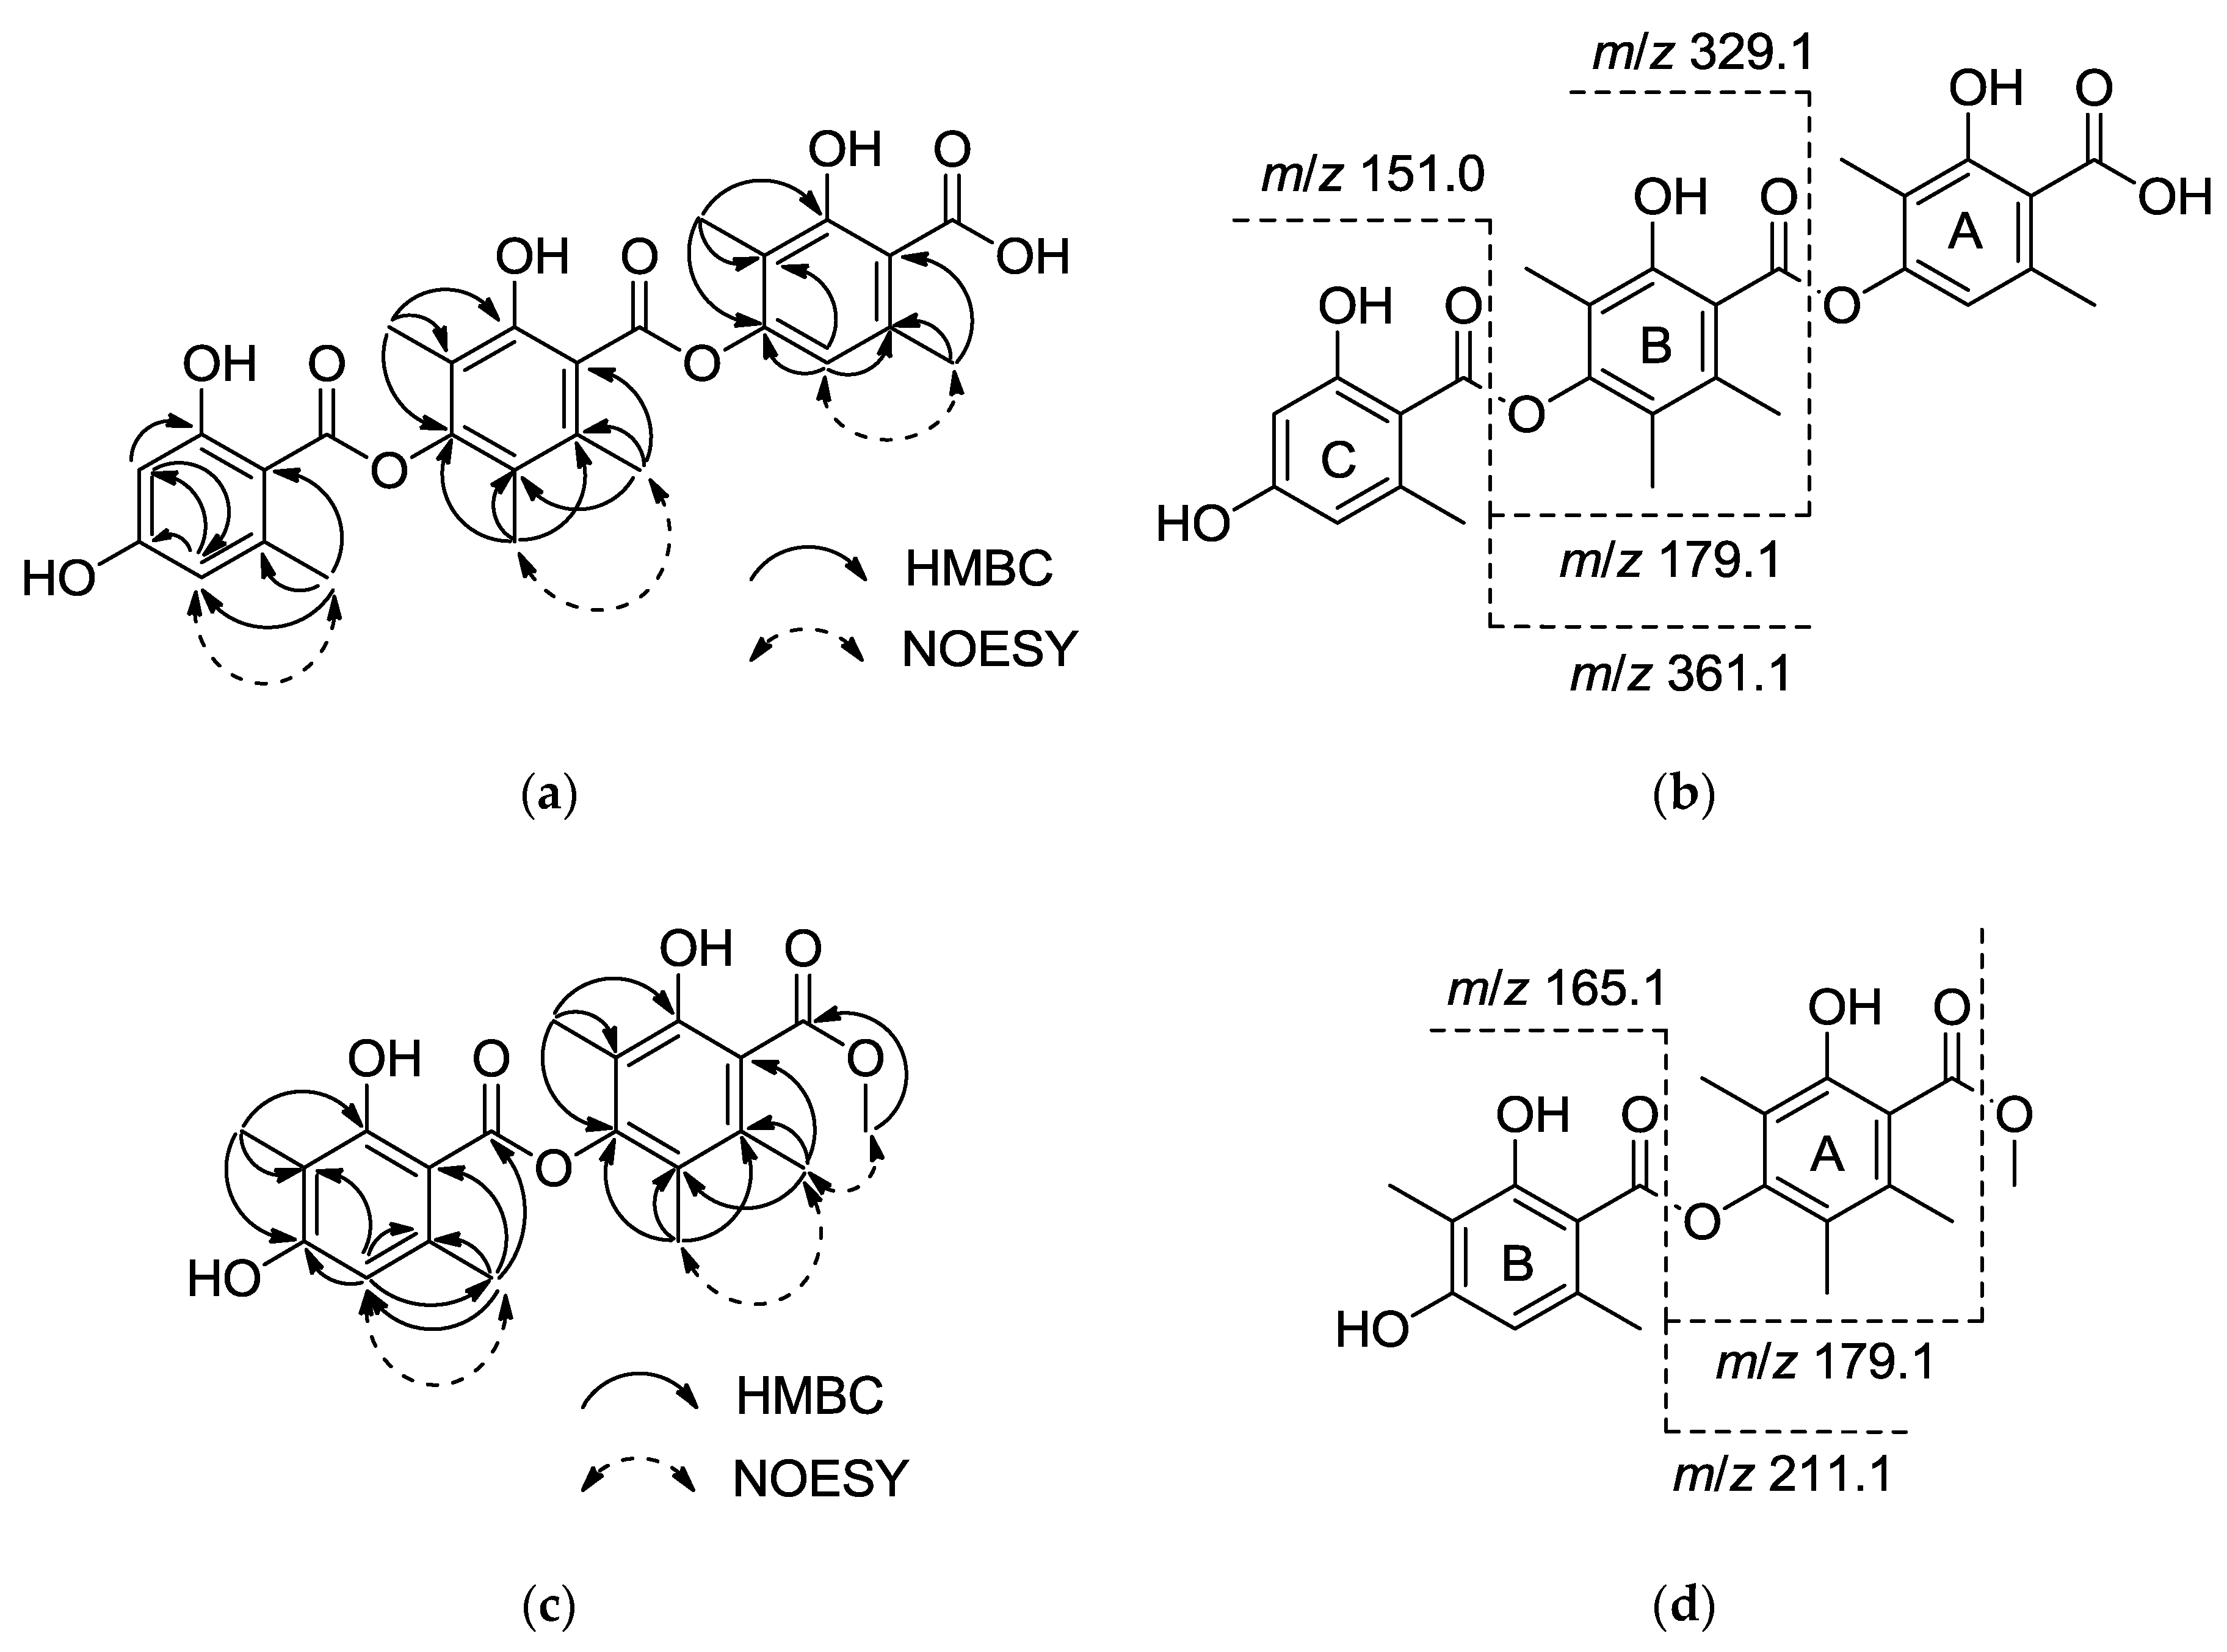
2.2. Structure Elucidation
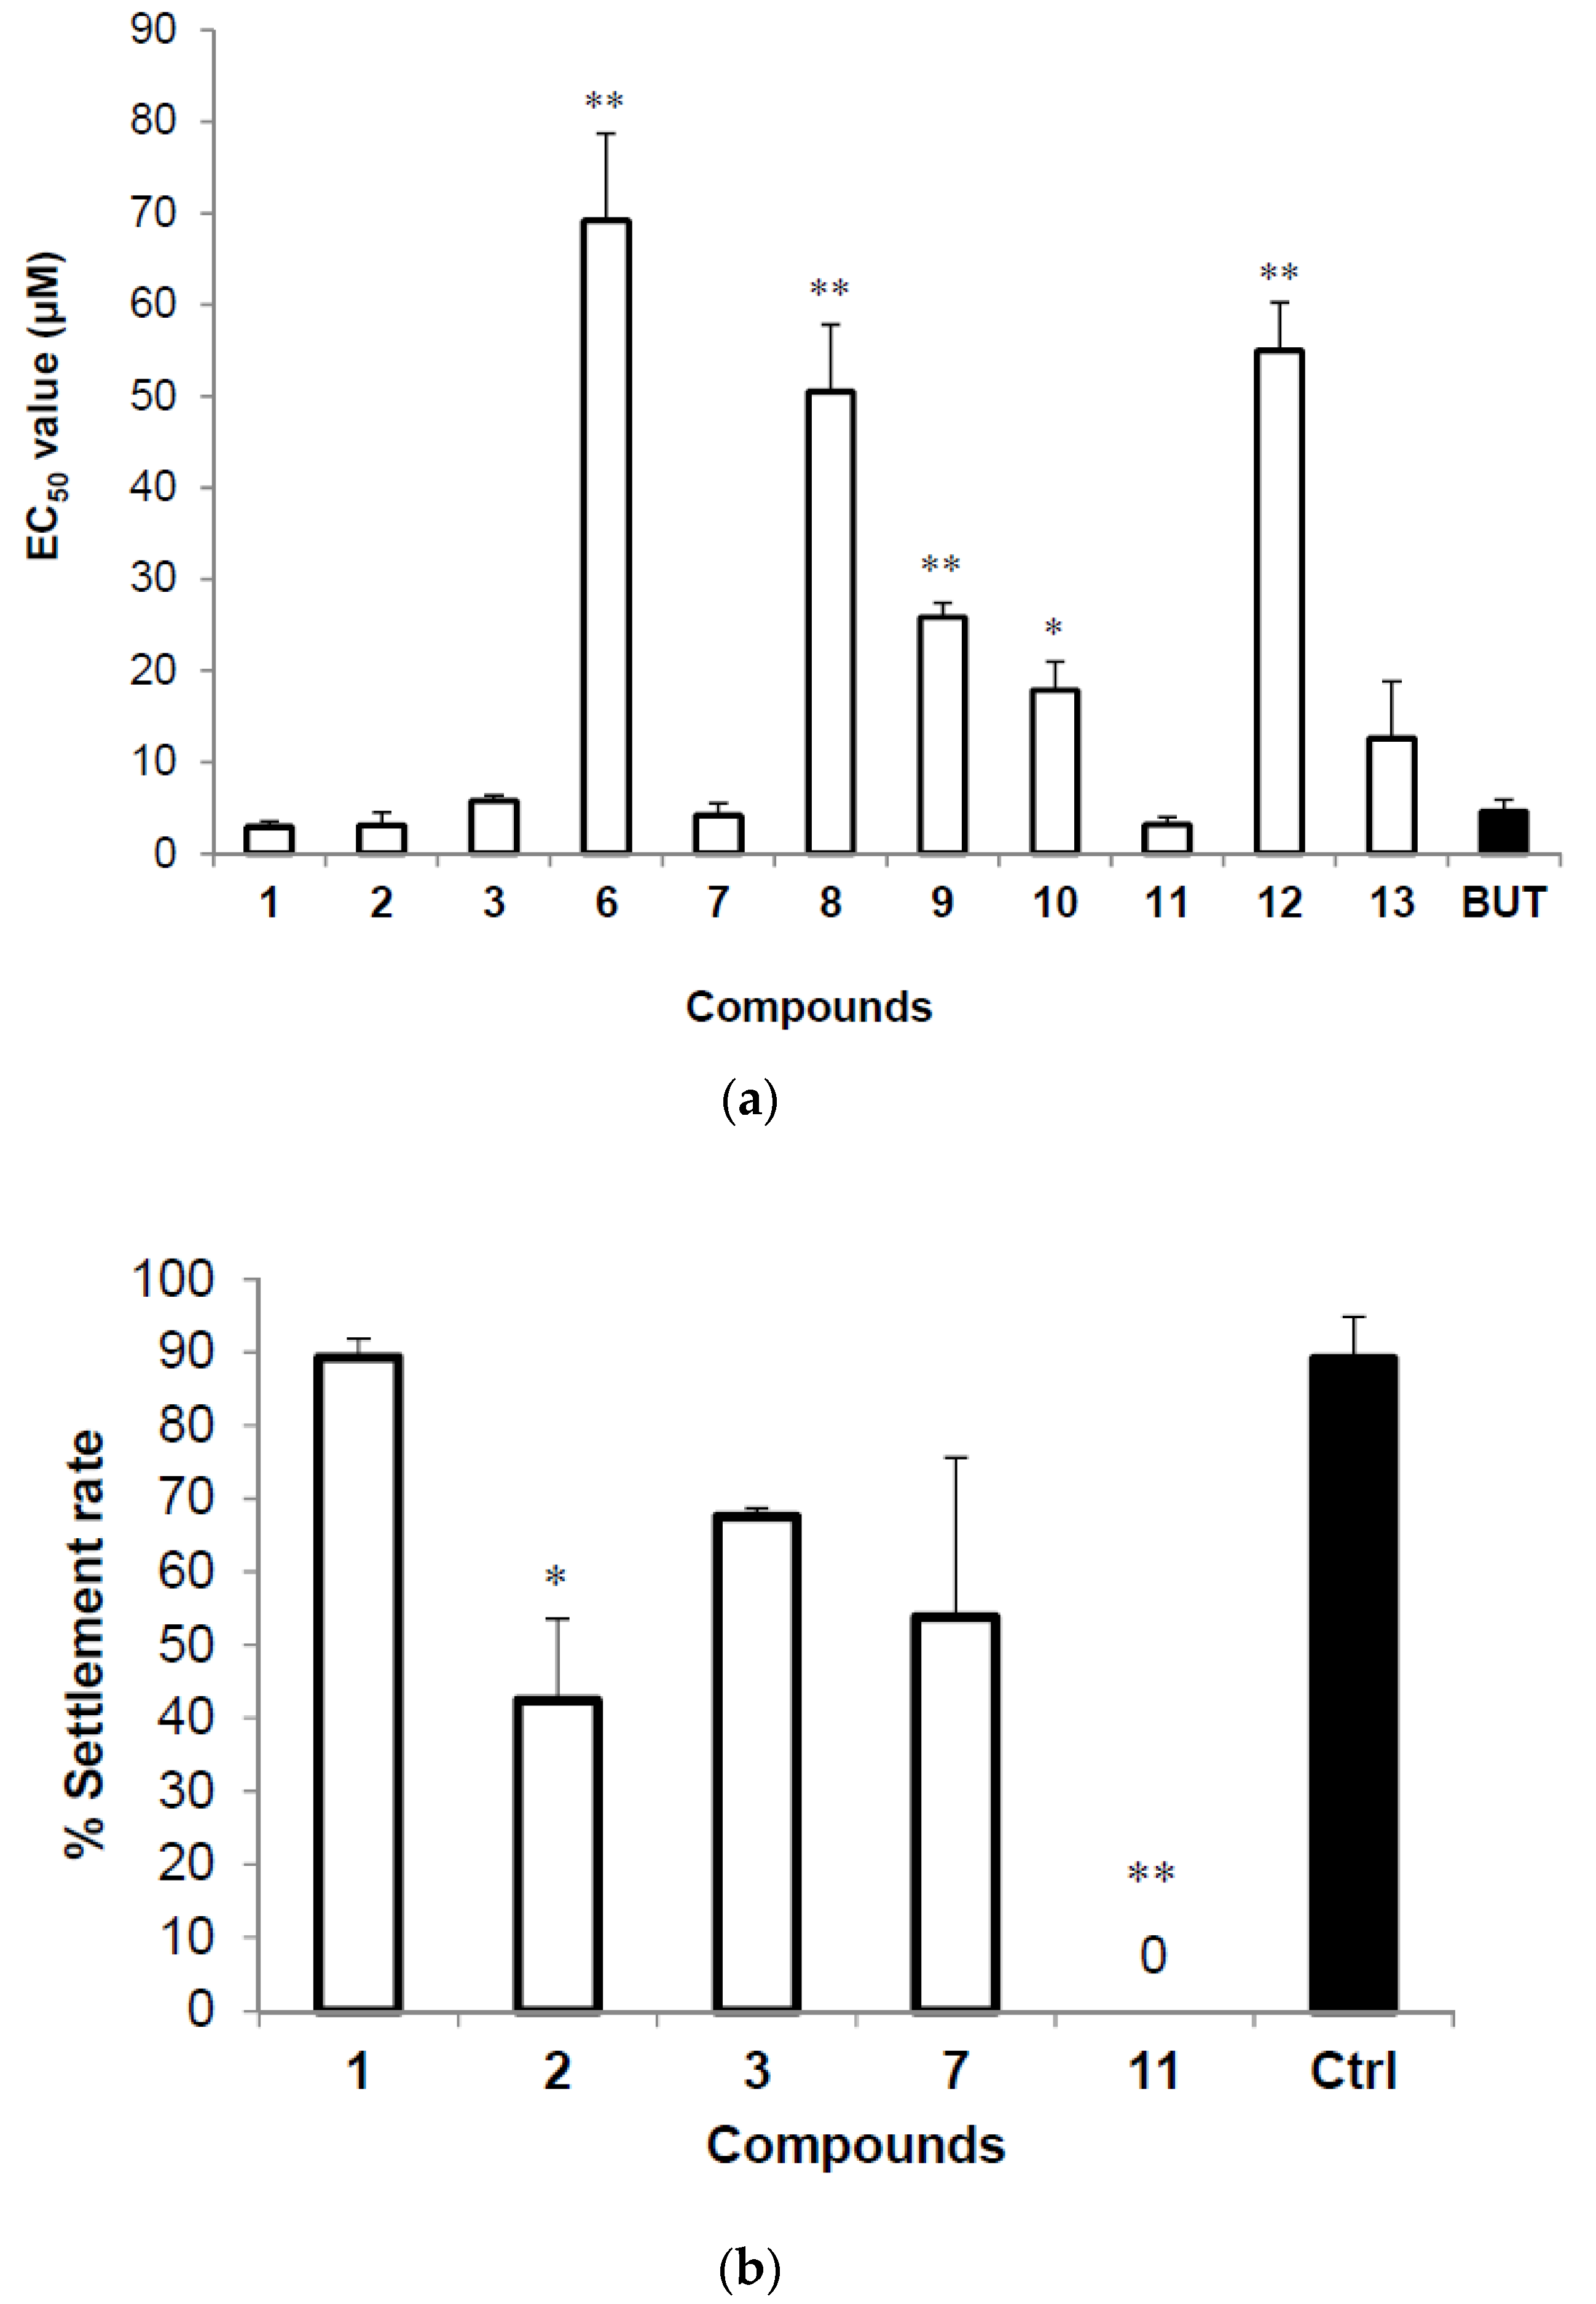
2.3. Anti-Larval Settlement and Recovery Activities
3. Materials and Methods
3.1. General Experimental Procedure
3.2. Isolation and Identification of the Fungus
3.3. Fermentation, Bioassay-Guided Isolation, and Purification
3.4. Spectral Data
3.5. Anti-Larval Settlement and Larval Recovery Assay
4. Conclusions
Supplementary Materials
Acknowledgments
Author Contributions
Conflicts of Interest
References
- Dobretsov, S.; Xiong, H.; Xu, Y.; Levin, L.A.; Qian, P.Y. Novel antifoulants: Inhibition of larval attachment by proteases. Mar. Biotechnol. 2007, 9, 388–397. [Google Scholar] [CrossRef] [PubMed]
- Dash, S.; Nogata, Y.; Zhou, X.; Zhang, Y.; Xu, Y.; Guo, X.; Qian, P.Y. Poly-ethers from Winogradskyella poriferorum: Antifouling potential, time-course study of production and natural abundance. Bioresour. Technol. 2011, 102, 7532–7537. [Google Scholar] [CrossRef] [PubMed]
- Xu, Y.; Li, H.; Li, X.; Xiao, X.; Qian, P.Y. Inhibitory effects of a branched-chain fatty acid on larval settlement of the polychaete Hydroides elegans. Mar. Biotechnol. 2009, 11, 495–504. [Google Scholar] [CrossRef] [PubMed]
- Xu, Y.; He, H.; Schulz, S.; Liu, X.; Fusetani, N.; Xiong, H.; Qian, P.Y. Potent antifouling compounds produced by marine Streptomyces. Bioresour. Technol. 2010, 101, 1331–1336. [Google Scholar] [CrossRef] [PubMed]
- Kwong, T.F.N.; Miao, L.; Li, X.; Qian, P.Y. Novel antifouling and antimicrobial compound from a marine-derived fungus Ampelomyces sp. Mar. Biotechnol. 2006, 8, 634–640. [Google Scholar] [CrossRef] [PubMed]
- Wang, K.L.; Xu, Y.; Lu, L.; Li, Y.; Han, Z.; Zhang, J.; Shao, C.L.; Wang, C.Y.; Qian, P.Y. Low-Toxicity diindol-3-ylmethanes as potent antifouling compounds. Mar. Biotechnol. 2015, 17, 624–632. [Google Scholar] [CrossRef] [PubMed]
- Li, Y.; Zhang, F.; Xu, Y.; Matsumura, K.; Han, Z.; Liu, L.; Lin, W.; Jia, Y.; Qian, P.Y. Structural optimization and evaluation of butenolides as potent antifouling agents: Modification of the side chain affects the biological activities of compounds. Biofouling 2012, 28, 857–864. [Google Scholar] [CrossRef] [PubMed]
- Zhang, Y.F.; Zhang, H.; He, L.; Liu, C.; Xu, Y.; Qian, P.Y. Butenolide inhibits marine fouling by altering the primary metabolism of three target organisms. ACS Chem. Biol. 2012, 7, 1049–1058. [Google Scholar] [CrossRef] [PubMed]
- Sakemi, S.; Hirai, H.; Ichiba, T.; Inagaki, T.; Kato, Y.; Kojima, N.; Nishida, H.; Parker, J.C.; Saito, T.; Tonai-Kachi, H.; et al. Thielavins as glucose-6-phosphatase (G6Pase) inhibitors: Producing strain, fermentation, isolation, structural elucidation and biological activities. J. Antibiot. 2002, 55, 941–951. [Google Scholar] [CrossRef] [PubMed]
- Kitahara, N.; Endo, A.; Furuya, K.; Takahashi, S. Thielavin A and B, New inhibitors of prostaglandin biosynthesis produced by Thielavia terricola. J. Antibiot. 1981, 34, 1562–1568. [Google Scholar] [CrossRef] [PubMed]
- Crisp, D.J.; Christie, A.O.; Ghobashy, A.F.A. Narcotic and toxic action of organic compounds on barnacle larvae. Comp. Biochem. Physiol. 1967, 22, 629–649. [Google Scholar] [CrossRef]
- Stupak, M.E.; Garcı́a, M.T.; Pérez, M.C. Non-toxic alternative compounds for marine antifouling paints. Int. Biodeterior. Biodegrad. 2003, 52, 49–52. [Google Scholar] [CrossRef]
- Lai, X.; Cao, L.; Tan, H.; Fang, S.; Huang, Y.; Zhou, S. Fungal communities from methane hydrate-bearing deep-sea marine sediments in South China Sea. ISME J. 2007, 1, 756–762. [Google Scholar] [CrossRef] [PubMed]
- Harder, T.N.; Thiyagarajan, V.; Qian, P.Y. Effect of cyprid age on the settlement of Balanus amphitrite Darwin in response to natural biofilms. Biofouling 2001, 17, 211–219. [Google Scholar] [CrossRef]
- Han, Z.; Sun, J.; Zhang, Y.; He, F.; Xu, Y.; Matsumura, K.; He, L.S.; Qiu, J.W.; Qi, S.H.; Qian, P.Y. iTRAQ-based proteomic profiling of the barnacle Balanus amphitrite in response to the antifouling compound meleagrin. J. Proteome Res. 2013, 12, 2090–2100. [Google Scholar] [CrossRef] [PubMed]
- Jang, J.P.; Jang, J.H.; Oh, M.; Son, S.; Kim, S.M.; Kim, H.M.; Shin, K.S.; Oh, H.; Soung, N.K.; Hong, Y.S.; et al. Inhibition of indoleamine 2, 3-dioxygenase by thielavin derivatives from a soil fungus, Coniochaeta sp. 10F058. J. Antibiot. 2013, 67, 331–333. [Google Scholar] [CrossRef] [PubMed]
- de Medeiros, L.S.; Murgu, M.; de Souza, A.Q. Antimicrobial depsides produced by Cladosporium uredinicola, an endophytic fungus isolated from Psidium guajava fruits. Helv. Chim. Acta 2011, 94, 1077–1084. [Google Scholar] [CrossRef]
- de Medeiros, L.S.; Abreu, L.M.; Nielsen, A.; Ingmer, H.; Larsen, T.O.; Nielsen, K.F.; Rodrigues-Filho, E. Dereplication-guided isolation of depsides thielavins S–T and lecanorins D–F from the endophytic fungus Setophoma sp. Phytochemistry 2015, 111, 154–162. [Google Scholar] [CrossRef] [PubMed]
- Mani, N.; Sanchet, P.; Jiang, Z.D.; McNaney, C.; DeCenzo, M.; Knighti, B.; Stankis, M.; Kuranda, M.; Rothstein, D.M. Screening systems for detecting inhibitors of cell wall transglycosylation in Enterococcus. Cell wall transglycosylation inhibitors in Enterococcus. J. Antibiot. 1998, 51, 471–479. [Google Scholar] [CrossRef] [PubMed]
- Togashi, K.I.; Ko, H.R.; Ahn, J.S.; Osada, H. Inhibition of telomerase activity by fungus metabolites, CRM646-A and thielavin B. Biosci. Biotechnol. Biochem. 2001, 65, 651–653. [Google Scholar] [CrossRef] [PubMed]

| R1 | R2 | R3 | R4 | R5 | R6 | R7 | |
|---|---|---|---|---|---|---|---|
| 1 | H | H | Me | Me | Me | H | H |
| 2 | H | H | Me | Me | Me | H | Me |
| 3 | Me | H | Me | Me | H | H | Me |
| 4 | Me | H | H | Me | Me | H | Me |
| 5 | Me | H | Me | H | Me | H | Me |
| 6 | Me | H | Me | H | Me | Me | Me |
| 7 | Me | H | Me | Me | Me | H | H |
| 8 | H | H | Me | H | Me | H | Me |
| 9 | H | H | Me | H | Me | Me | Me |
| 10 | Me | Cl | Me | Me | Me | Me | Me |
| 12 | Me | H | Me | Me | Me | Me | H |
| 13 | H | H | Me | Me | Me | Me | H |
| 14 | Me | H | Me | Me | Me | H | Me |
| 15 | Me | H | Me | Me | Me | Me | Me |


| Position | 1 | 2 | 3 | 4 | ||||
|---|---|---|---|---|---|---|---|---|
| δH | δC | δH | δC | δH | δC | δH | δC | |
| 1 | 138.7 | 139.0 | 142.1 | 138.7 | ||||
| 2 | 165.4 | 164.8 | 161.2 | 165.1 | ||||
| 3 | 114.2 | 114.3 | 6.36 d 2.0 | 107.0 | 114.4 | |||
| 4 | 149.5 | 150.8 | 151.5 | 149.8 | ||||
| 5 | 6.18 s | 110.3 | 6.21 s | 111.2 | 6.29 d 2.0 | 111.3 | 6.41 s | 111.3 |
| 6 | 114.7 | 115.5 | 117.5 | 115.3 | ||||
| 1′ | 131.8 | 132.2 | 132.4 | 135.5 | ||||
| 2′ | 150.7 | 153.2 | 153.2 | 154.5 | ||||
| 3′ | 116.5 | 121.8 | 121.6 | 7.01 s | 104.2 | |||
| 4′ | 149.1 | 149.5 | 148.9 | 149.9 | ||||
| 5′ | 120.8 | 125.8 | 125.6 | 121.2 | ||||
| 6′ | 121.6 | 126.2 | 126.4 | 121.7 | ||||
| 1″ | 141.0 | 141.0 | 139.5 | 139.3 | ||||
| 2″ | 161.4 | 161.4 | 162.7 | 162.2 | ||||
| 3″ | 6.26 s | 100.6 | 6.27 s | 100.6 | 108.7 | 114.4 | ||
| 4″ | 160.8 | 160.6 | 160.6 | 160.9 | ||||
| 5″ | 6.26 s | 110.3 | 6.27 s | 110.2 | 6.44 s | 111.3 | 6.14 s | 111.3 |
| 6″ | 107.6 | 107.2 | 102.8 | 103.5 | ||||
| 1-C=O | 172.0 * | 172.5 * | 170.7 * | 171.9 * | ||||
| 2-OMe | ||||||||
| 3-Me | 1.99 s | 9.4 | 1.99 s | 9.0 | 1.98 s | 8.1 | ||
| 5-Me | ||||||||
| 6-Me | 2.52 s | 23.1 | 2.40 s | 23.0 | 2.56 s | 24.1 | 2.55 s | 23.8 |
| 1′-C=O | 167.1 * | 166.9 * | 169.3 * | 169.7 * | ||||
| 2′-OMe | 3.78 s | 62.0 | 3.79 s | 62.0 | 3.82 s | 56.3 | ||
| 3′-Me | 2.06 s | 10.2 | 2.13 s | 10.0 | 2.08 s | 9.9 | ||
| 5′-Me | 2.06 s | 12.5 | 2.12 s | 12.7 | 2.06 s | 12.6 | 2.03 s | 12.0 |
| 6′-Me | 2.29 s | 16.7 | 2.31 s | 16.6 | 2.29 s | 16.5 | 2.32 s | 16.8 |
| 1″-C=O | 166.7 * | 165.9 * | 165.9 * | 165.7 * | ||||
| 3″-Me | 1.99 s | 8.1 | 1.96 s | 9.1 | ||||
| 5″-Me | ||||||||
| 6″-Me | 2.40 s | 21.8 | 2.54 s | 21.8 | 2.55 s | 21.8 | 2.52 s | 23.1 |
| Position | 5 | 6 | 7 | 8 | ||||
|---|---|---|---|---|---|---|---|---|
| δH | δC | δH | δC | δH | δC | δH | δC | |
| 1 | 139.1 | 139.1 | 138.9 | 138.9 | ||||
| 2 | 156.2 | 156.7 | 162.0 | 165.2 | ||||
| 3 | 115.4 | 115.4 | 116.5 | 114.2 | ||||
| 4 | 151.0 | 150.7 | 151.7 | 149.5 | ||||
| 5 | 6.40 s | 113.2 | 118.6 | 6.64 s | 115.8 | 6.16 s | 109.8 | |
| 6 | 114.1 | 120.4 | 112.1 | 115.8 | ||||
| 1′ | 134.3 | 134.8 | 132.0 | 134.0 | ||||
| 2′ | 156.2 | 156.2 | 150.7 | 156.1 | ||||
| 3′ | 122.0 | 122.2 | 116.5 | 122.0 | ||||
| 4′ | 150.6 | 149.3 | 148.8 | 150.8 | ||||
| 5′ | 7.10 s | 120.1 | 7.12 s | 120.4 | 120.7 | 7.00 s | 119.9 | |
| 6′ | 125.7 | 125.4 | 121.7 | 126.0 | ||||
| 1″ | 139.1 | 139.1 | 139.5 | 140.4 | ||||
| 2″ | 162.0 | 162.0 | 162.7 | 160.0 | ||||
| 3″ | 108.6 | 108.6 | 108.6 | 6.25 d 2.0 | 100.7 | |||
| 4″ | 160.9 | 160.9 | 161.0 | 161.1 | ||||
| 5″ | 6.40 s | 111.1 | 6.41 s | 111.0 | 6.42 s | 111.2 | 6.24 d 2.0 | 109.9 |
| 6″ | 103.6 | 103.7 | 102.8 | 108.3 | ||||
| 1-C=O | 172.7 * | 171.5 * | 173.0 * | 171.7 * | ||||
| 2-OMe | ||||||||
| 3-Me | 2.03 s | 9.1 | 2.08 s | 9.9 | ||||
| 5-Me | 2.10 s | 12.6 | 2.10 s | 9.2 | 1.97 s | 9.3 | ||
| 6-Me | 2.52 s | 23.6 | 2.40 s | 17.4 | ||||
| 1′-C=O | 169.4 * | 169.4 * | 2.50 s | 22.9 | 2.53 s | 23.1 | ||
| 2′-OMe | 3.82 s | 61.9 | 3.79 s | 61.9 | 169.5 * | 167 * | ||
| 3′-Me | 2.11 s | 9.6 | 2.13 s | 9.6 | 3.81 s | 62.0 | ||
| 5′-Me | 2.02 s | 10.1 | 2.14 s | 9.6 | ||||
| 6′-Me | 2.4 s | 18.7 | 2.40 s | 19.2 | 2.01 s | 12.4 | ||
| 1″-C=O | 165.1 * | 165.0 * | 2.30 s | 16.7 | 2.39 s | 18.6 | ||
| 3″-Me | 1.98 s | 8.1 | 1.98 s | 8.1 | 166.4 * | 165.4 * | ||
| 5″-Me | 1.98 s | 8.0 | ||||||
| 6″-Me | 2.52 s | 23.0 | 2.53 s | 23.6 | ||||
| Position | 9 | 10 | 11 | |||
|---|---|---|---|---|---|---|
| δH | δC | δH | δC | δH | δC | |
| 1 | 136.8 | 138.3 | 132.1 | |||
| 2 | 161.3 | 160.0 | 150.7 | |||
| 3 | 113.3 | 116.5 | 116.0 | |||
| 4 | 148.6 | 151.8 | 148.5 | |||
| 5 | 115.5 | 120.6 | 120.1 | |||
| 6 | 117.5 | 115.7 | 121.4 | |||
| 1′ | 134.5 | 134.1 | 139.4 | |||
| 2′ | 156.6 | 155.0 | 162.6 | |||
| 3′ | 122.2 | 122.7 | 108.6 | |||
| 4′ | 150.9 | 150.3 | 161.0 | |||
| 5′ | 7.01 s | 120.2 | 126.4 | 6.40 s | 111.0 | |
| 6′ | 125.7 | 127.5 | 102.7 | |||
| 1″ | 140.3 | 136.2 | ||||
| 2″ | 161.1 | * 160.8 | ||||
| 3″ | 6.23 s | 100.5 | 112.8 | |||
| 4″ | 161.2 | * 157.9 | ||||
| 5″ | 6.23 s | 109.9 | 107.2 | |||
| 6″ | 108.3 | 116.2 | ||||
| 1-C=O | 171.8 * | UD | 168.7 * | |||
| 1-COOMe | 3.83 s | 51.9 | ||||
| 2-OMe | ||||||
| 3-Me | 2.01 s | 9.8 | 2.62 s | 9.6 | 1.96 s | 9.7 |
| 5-Me | 2.04 s | 12.5 | 2.42 s | 12.6 | 1.96 s | 12.3 |
| 6-Me | 2.58 s | 17.4 | 2.84 s | 17.8 | 2.13 s | 16.6 |
| 1′-C=O | 167.1 * | UD | 168.9 | |||
| 2′-OMe | 3.78 s | 62.0 | 3.90 s | 61.9 | ||
| 3′-Me | 2.16 s | 9.7 | 2.36 s | 9.7 | 1.97 s | 7.8 |
| 5′-Me | 2.21 s | 12.6 | ||||
| 6′-Me | 2.40 s | 19.1 | 2.44 s | 16.7 | 2.54 s | 24.0 |
| 1″-C=O | 165.8 * | UD | ||||
| 3″-Me | 2.57 s | 9.2 | ||||
| 5″-Me | ||||||
| 6″-Me | 2.39 s | 21.4 | 2.94 s | 19.4 | ||
| 1 | 2 | 3 | 4 | |
|---|---|---|---|---|
| Molecular Formula | C27H27O10 | C28H29O10 | C28H29O10 | C28H29O10 |
| HRESIMS (pos) Obsd. (m/z) | 511.1604 | 525.1727 | 525.1765 | 525.1757 |
| Cald. (m/z) | 511.1599 | 525.1755 | 525.1755 | 525.1755 |
| ISCID (m/z) | 493.2 | 507.2 | 507.1 | |
| 361.1 | 375.2 | 361.1 | 361.1 | |
| 329.1 | 343.1 | 357.1 | 343.1 | |
| 179.1 | 193.1 | 193.1 | 179.1 | |
| 151.0 | 151.0 | 165.1 | 165.1 | |
| UV | 218.1 | 218.1 | 218.1 | 218.1 |
| 267.8 | 267.8 | 276.1 | 276.1 | |
| 304.2 | 306.5 | 304.7 | 306.5 | |
| 5 | 6 | 7 | 8 | |
| Molecular Formula | C28H29O10 | C29H31O10 | C28H29O10 | C27H27O10 |
| HRESIMS (pos) Obsd. (m/z) | 525.1747 | 539.1916 | 525.1758 | 511.1564 |
| Cald. (m/z) | 525.1755 | 539.1912 | 525.1755 | 511.1599 |
| ISCID (m/z) | 507.2 | 479.1 | ||
| 361.1 | 375.2 | 361.1 | 361.1 | |
| 343.1 | 343.1 | 343.1 | 329.1 | |
| 179.1 | 179.1 | 179.1 | 179.1 | |
| 165.1 | 165.1 | 165.1 | 151.0 | |
| UV | 218.1 | 218.1 | 214.6 | 218.1 |
| 276.1 | 276.8 | 276.1 | 267.8 | |
| 306.9 | 305.2 | 309.1 | 305.2 | |
| 9 | 10 | 11 | ||
| Molecular Formula | C28H29O10 | C30H32ClO10 | C20H23O7 | |
| HRESIMS (pos) Obsd. (m/z) | 525.1778 | 587.1719/589.1646 | 375.1464 | |
| Cald. (m/z) | 525.1755 | 587.1679 | 375.1438 | |
| ISCID (m/z) | 389.1 | |||
| 375.2 | 391.1/393.1 | |||
| 329.1 | 199.0/201.0 | 211.1 | ||
| 179.1 | 193.1 | 179.1 | ||
| 151.0 | 165.1 | |||
| UV | 213.4 | 215.8 | 215.8 | |
| 267.8 | 276.1 | 276.1 | ||
| 307.0 | 307.0 | 308.9 |
| Compounds | EC50 (μM) | Compounds | EC50 (μM) |
|---|---|---|---|
| 1 | 2.95 ± 0.59 | 9 | 25.86 ± 1.56 |
| 2 | 3.13 ± 1.37 | 10 | 17.86 ± 3.14 |
| 3 | 5.78 ± 0.60 | 11 | 3.20 ± 0.83 |
| 6 | 69.19 ± 9.51 | 12 | 54.99 ± 5.23 |
| 7 | 4.23 ± 1.30 | 13 | 12.64 ± 6.20 |
| 8 | 50.50 ± 7.35 | Butenolide | 4.62 ± 1.30 |
© 2017 by the authors. Licensee MDPI, Basel, Switzerland. This article is an open access article distributed under the terms and conditions of the Creative Commons Attribution (CC BY) license (http://creativecommons.org/licenses/by/4.0/).
Share and Cite
Han, Z.; Li, Y.-X.; Liu, L.-L.; Lu, L.; Guo, X.-R.; Zhang, X.-X.; Zhang, X.-Y.; Qi, S.-H.; Xu, Y.; Qian, P.-Y. Thielavins W–Z7, New Antifouling Thielavins from the Marine-Derived Fungus Thielavia sp. UST030930-004. Mar. Drugs 2017, 15, 128. https://doi.org/10.3390/md15050128
Han Z, Li Y-X, Liu L-L, Lu L, Guo X-R, Zhang X-X, Zhang X-Y, Qi S-H, Xu Y, Qian P-Y. Thielavins W–Z7, New Antifouling Thielavins from the Marine-Derived Fungus Thielavia sp. UST030930-004. Marine Drugs. 2017; 15(5):128. https://doi.org/10.3390/md15050128
Chicago/Turabian StyleHan, Zhuang, Yong-Xin Li, Ling-Li Liu, Liang Lu, Xian-Rong Guo, Xi-Xiang Zhang, Xiao-Yong Zhang, Shu-Hua Qi, Ying Xu, and Pei-Yuan Qian. 2017. "Thielavins W–Z7, New Antifouling Thielavins from the Marine-Derived Fungus Thielavia sp. UST030930-004" Marine Drugs 15, no. 5: 128. https://doi.org/10.3390/md15050128
APA StyleHan, Z., Li, Y.-X., Liu, L.-L., Lu, L., Guo, X.-R., Zhang, X.-X., Zhang, X.-Y., Qi, S.-H., Xu, Y., & Qian, P.-Y. (2017). Thielavins W–Z7, New Antifouling Thielavins from the Marine-Derived Fungus Thielavia sp. UST030930-004. Marine Drugs, 15(5), 128. https://doi.org/10.3390/md15050128