Article

Assignment of the CD Cotton Effect to the Chiral Center in Pseurotins, and the Stereochemical Revision of Pseurotin A2

Medicinal Chemistry Laboratory, Osaka University of Pharmaceutical Sciences, 4-20-1, Nasahara, Takatsuki, Osaka 569-1094, Japan
*
Author to whom correspondence should be addressed.
Mar. Drugs 2016, 14(4), 74; https://doi.org/10.3390/md14040074
Submission received: 3 February 2016 / Revised: 8 March 2016 / Accepted: 31 March 2016 / Published: 9 April 2016

Abstract

:
Pseurotins A1 (1) and A2 (2) were isolated from a culture broth of the fungal strain Aspergillus fumigatus WFZ-25 as stereoisomers of pseurotin A (3) in 2011. We also isolated 1 and 2 together with 3 from A. fumigatus OUPS-T106B-5 separated from the marine fish Mugil cephalus. In this study, we re-examined the stereochemistry of 1 and 2 using chemical transformation and the CD spectra, and found the relationship between the CD Cotton effect and the absolute configurations of 1 and 2, which led us to revise the stereostructure of pseurotin A2.

Graphical Abstract

1. Introduction

Pseurotin A (3) is a major secondary metabolite isolated from the fungal strains Pseudeurotium ovalis and Aspergillus fumigatus, and it has an unusual structure containing a spiro-heterocyclic γ-lactam core [1,2,3,4]. Its absolute configuration was determined by X-ray diffraction analysis of a dibromo derivative [1]. Most of the other γ-lactams were determined by asymmetric total synthesis [5,6,7,8,9,10] and the modified Mosher’s method [11,12]. Previously, we reported that all stereoisomers of FD-838 showed an association between the CD Cotton effect and the absolute configuration of the chiral centers in γ-lactam [13]. Meanwhile, stereoisomers of pseurotin A designated as pseurotins A1 (1) and A2 (2) were isolated from a culture broth of the fungal strain Aspergillus fumigatus WFZ-25 by Q.Q. Gu and co-researchers [14]. The absolute stereostructures of 1 and 2 were elucidated by NOESY experiments and comparison with the CD data pattern in the above report [14]. We herein report our re-examination of the absolute configurations of 1 and 2 using chemical transformation, measurement of the 1H-NMR coupling constant, and CD spectra. In addition, we describe our revision of the stereochemistry of 2.

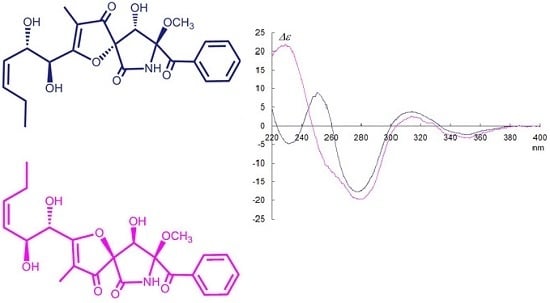
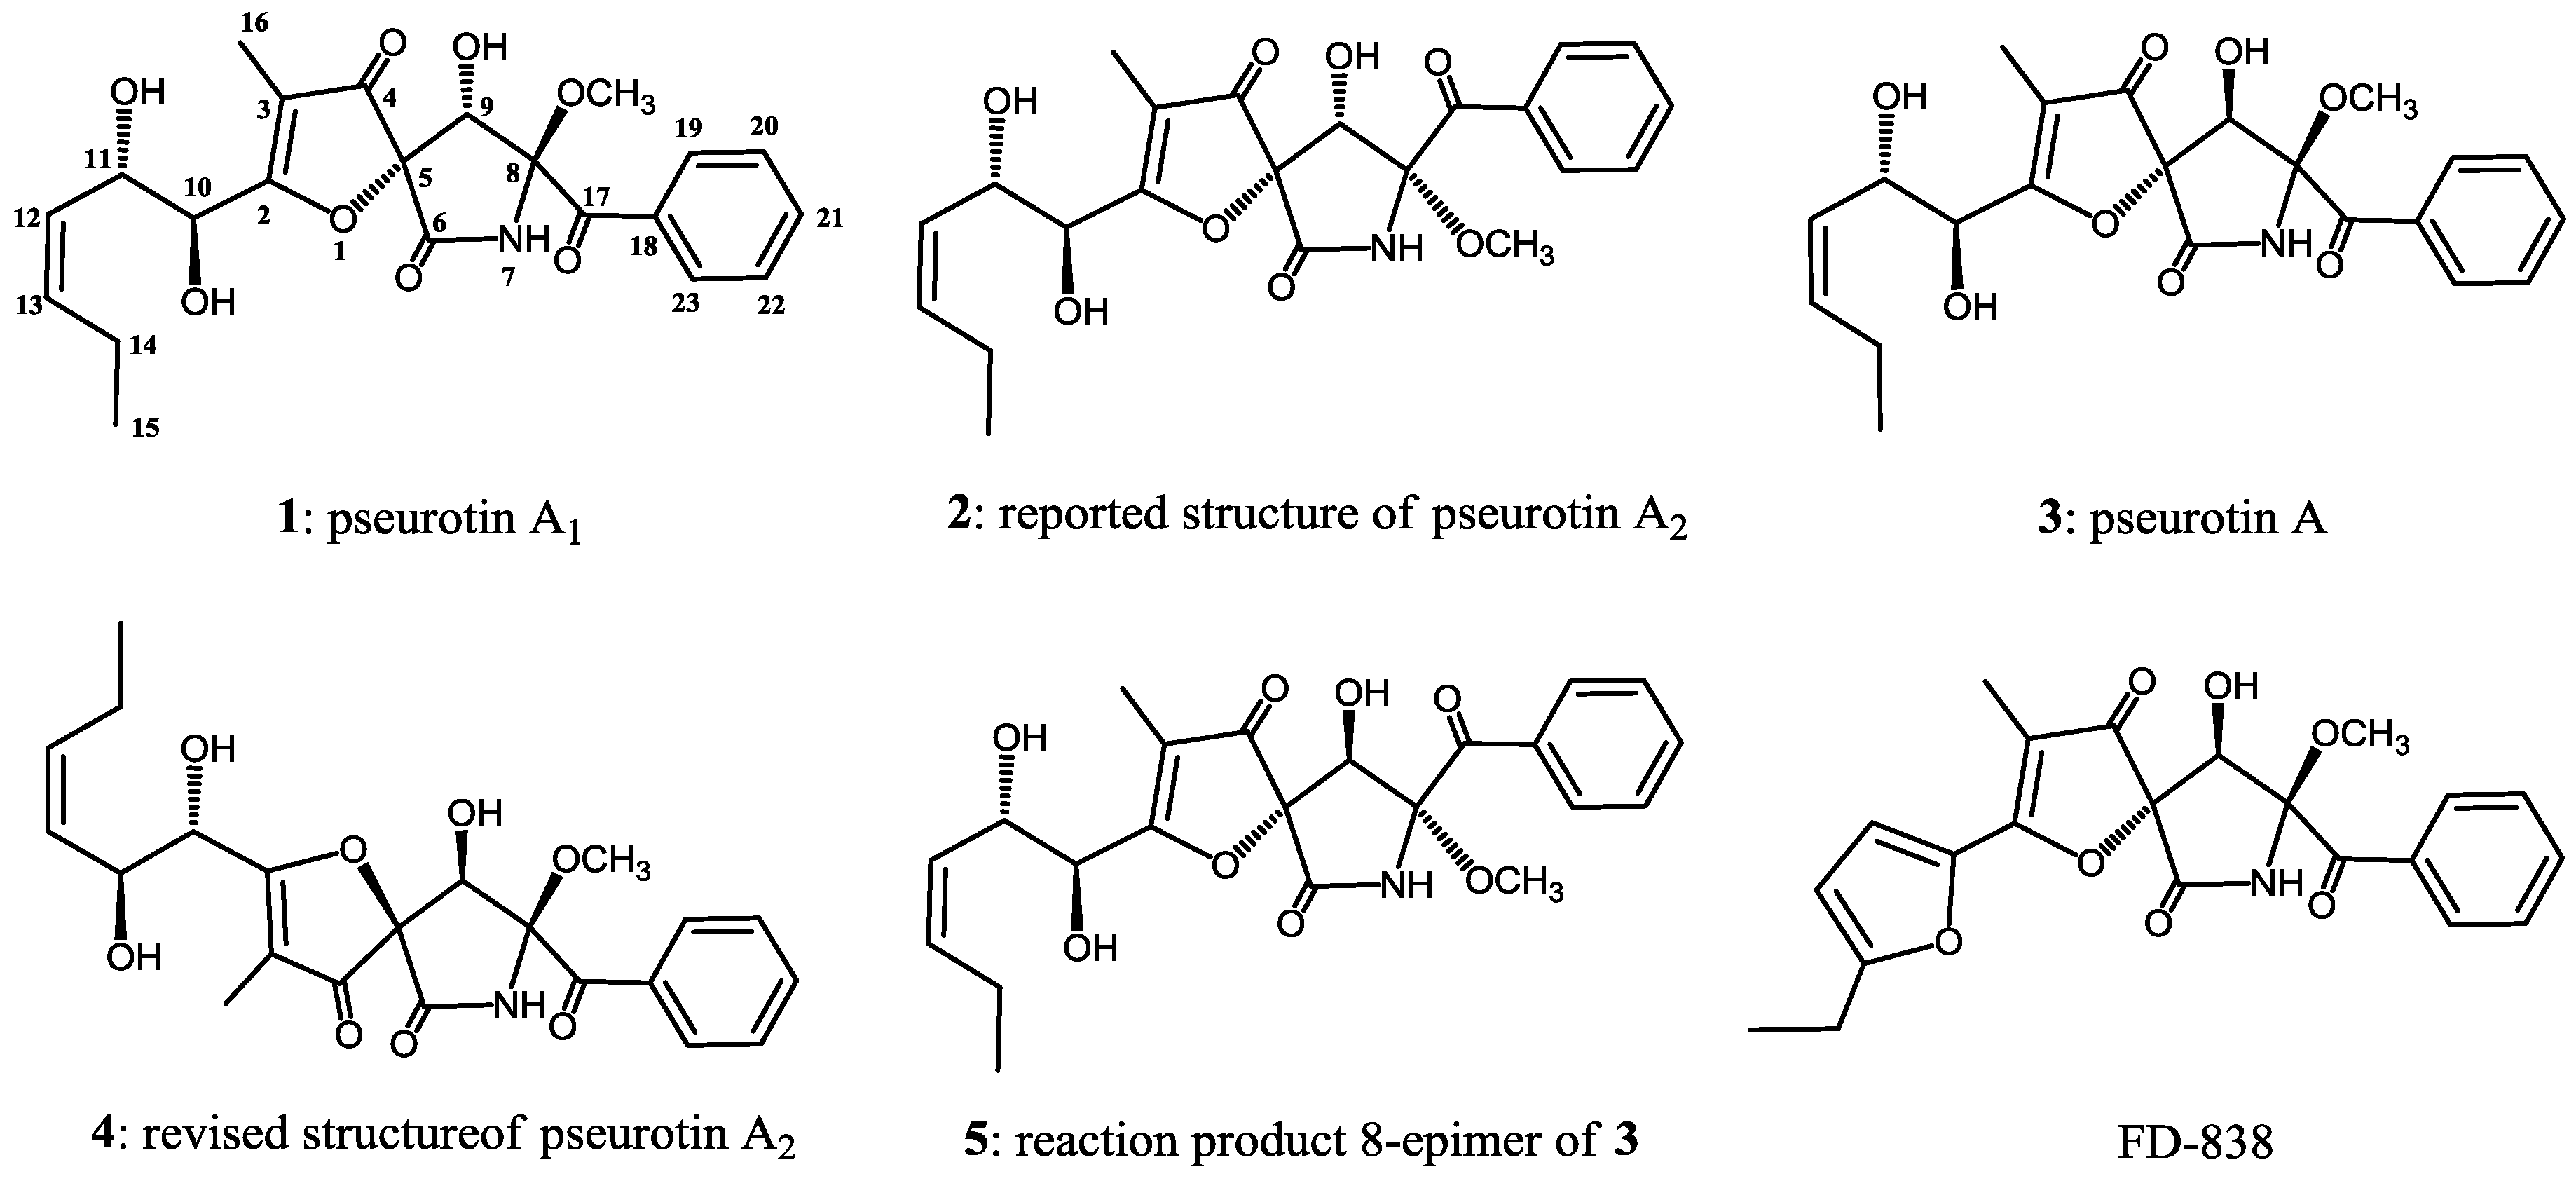
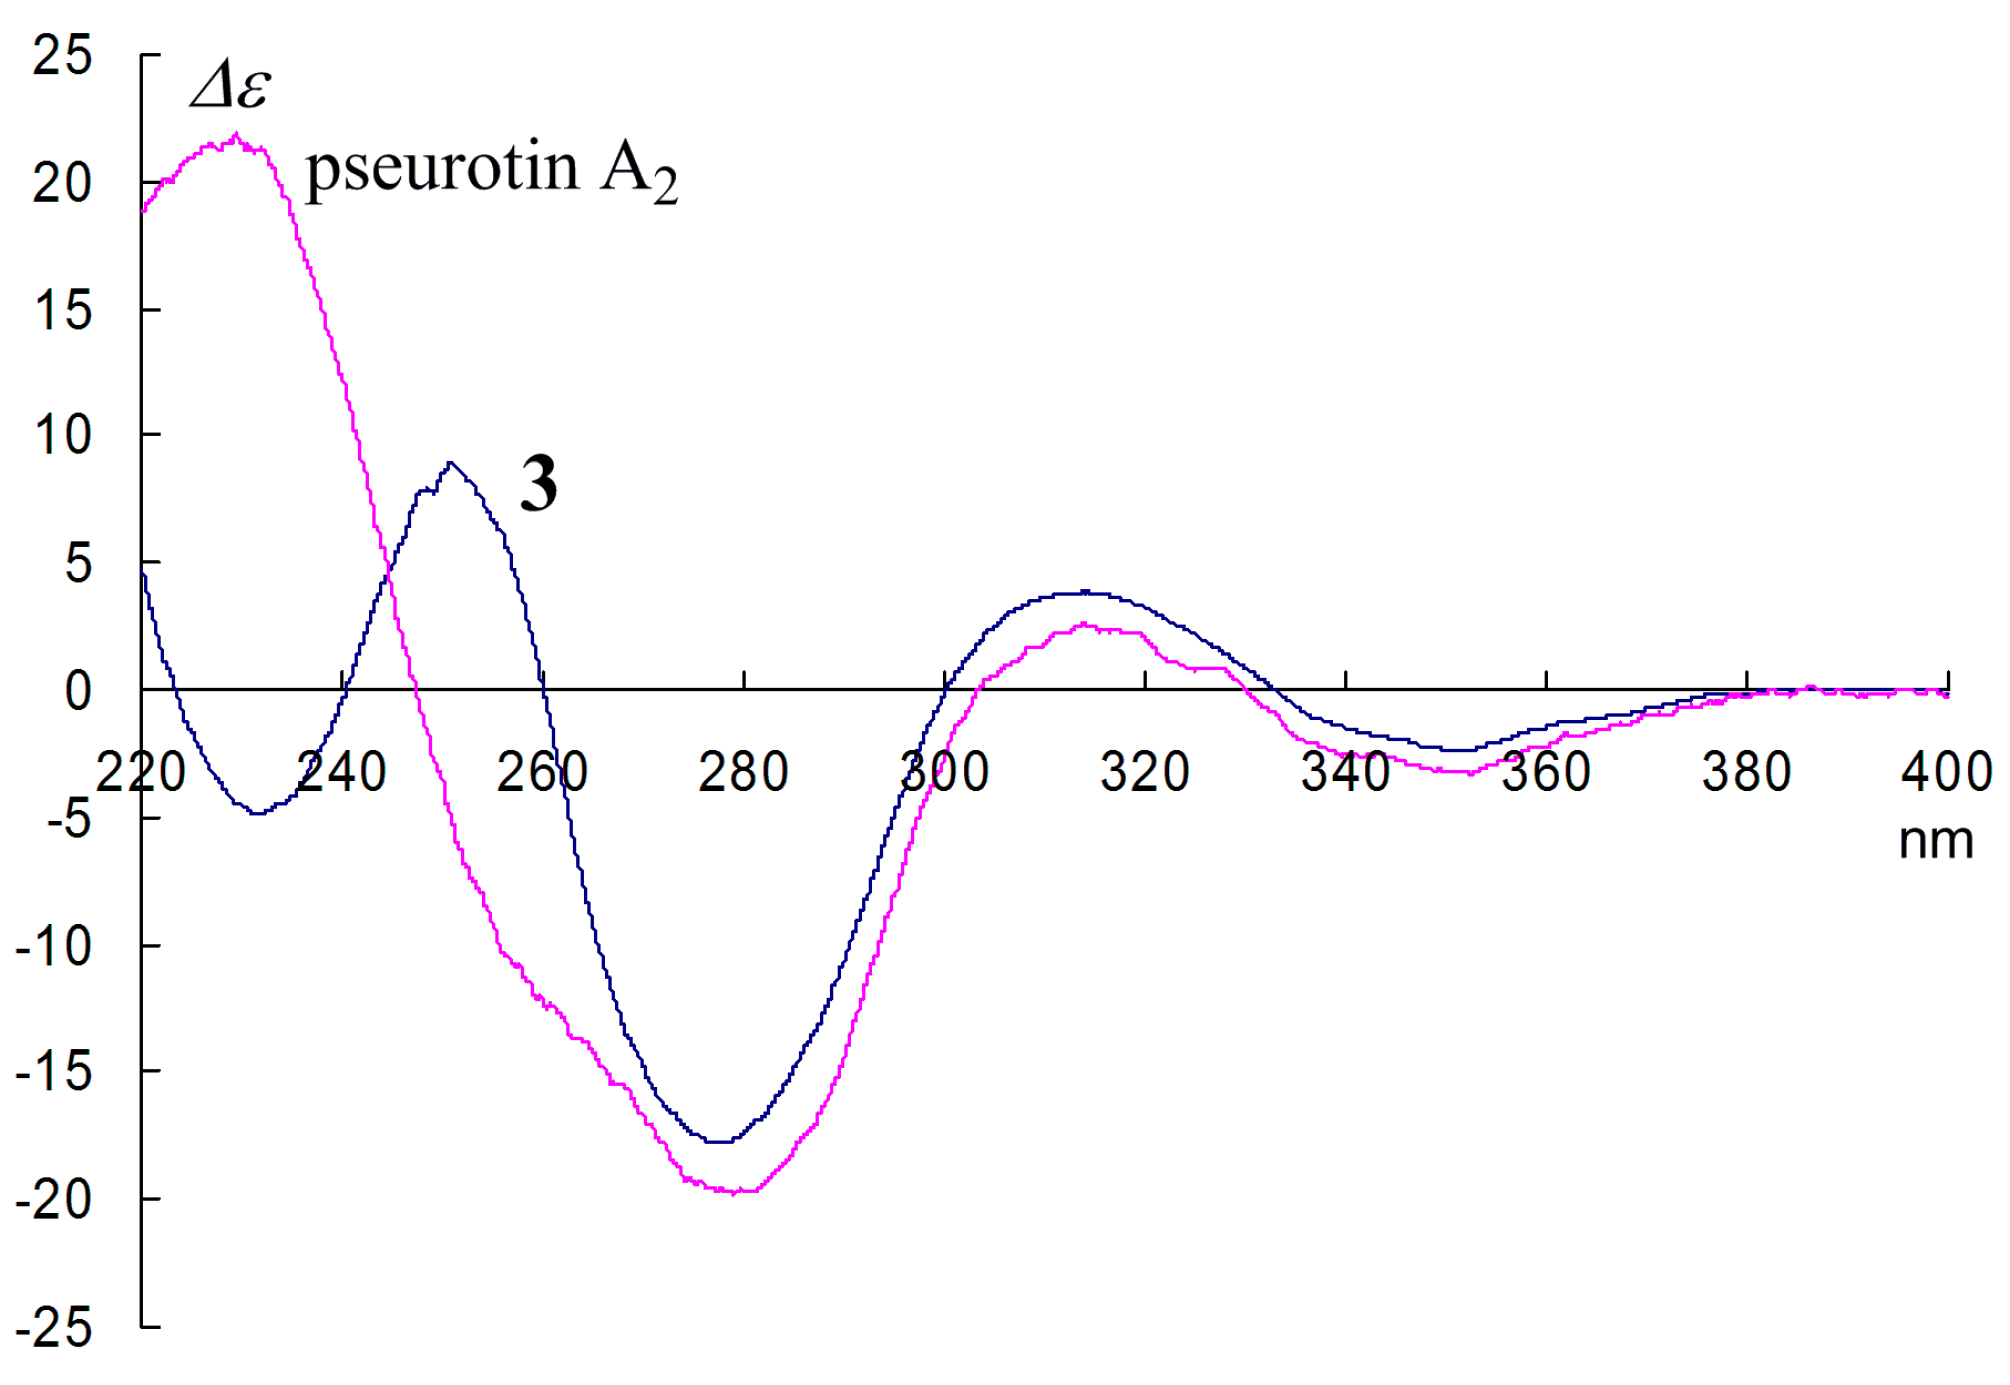
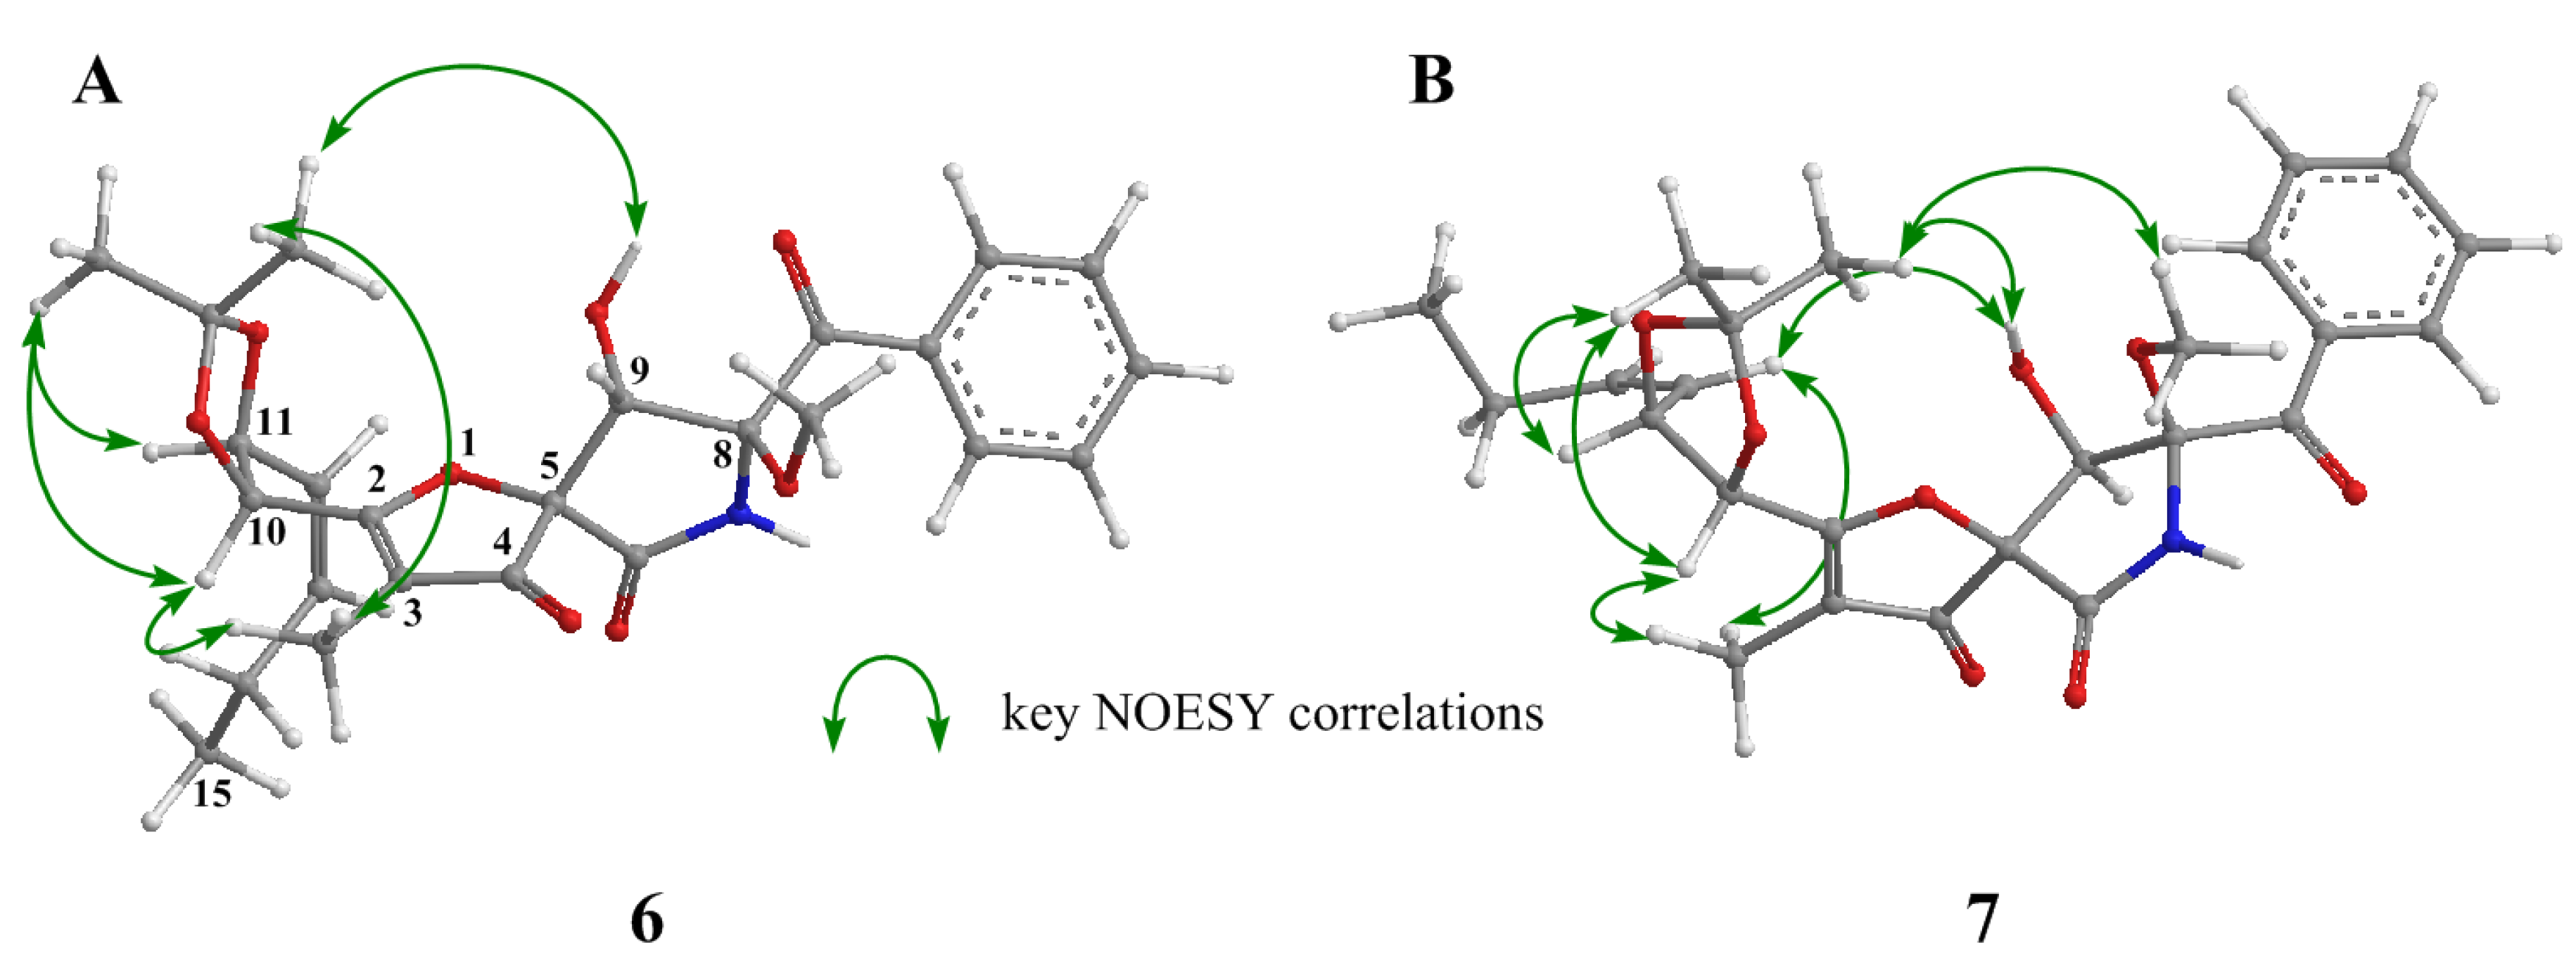
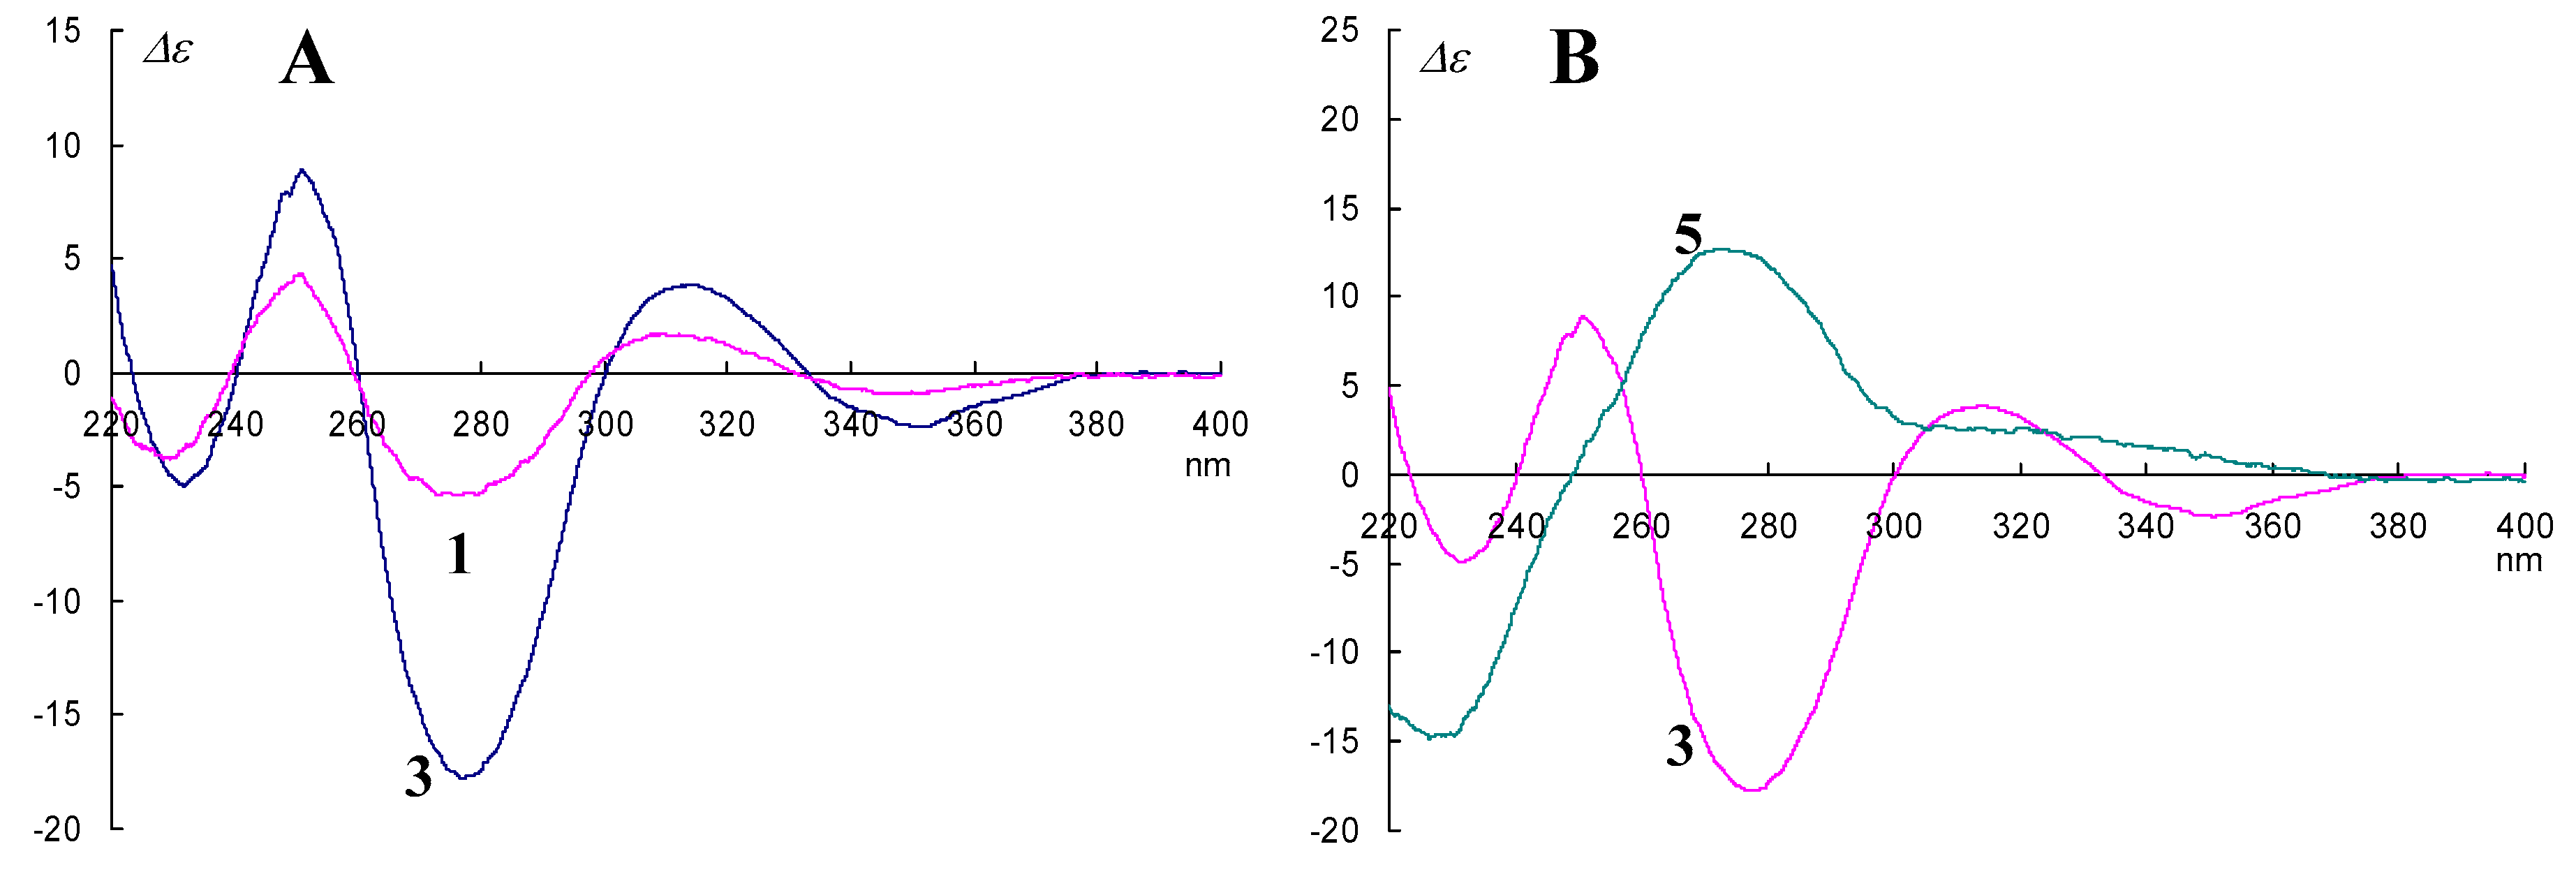
2. Results and Discussion

Fractionation of an ethyl acetate extract of the culture broth of A. fumigatus OUPS-T106B-5 was conducted as reported previously [12,13], employing a stepwise combination of Sephadex LH-20 and silica gel column chromatographies, followed by reverse-phase HPLC, to yield pseurotins A1 (1), A2 (2) and A (3) (Figure 1).
Pseurotin A1 (1) had the molecular formula C22H25NO8, as established from the [M + Na]+ peak in high resolution fast atom bombardment mass spectrometry (HRFABMS). A close inspection of the 1H- and 13C-NMR spectra of 1 (Table 1, Supplementary Material Figures S1 and S2) using DEPT and 1H-13C correlation spectroscopy (HMQC) revealed the presence of one primary methyl (C-15), one olefinic methyl (C-16), one methoxy group (8-OCH3), one sp3-hybridized methylene (C-14), three oxygen-bearing sp3-methines (C-9, C-10 and C-11), two olefin sp2-methines (C-12 and C-13), two oxygen-bearing quaternary sp3-carbons (C-5 and C-8), five aromatic protons (C-19, C-20, C-21, C-22 and C-23), three quaternary sp2-carbons (C-2, C-3, C-18) including one oxygen-bearing quaternary carbons (C-2), two conjugated carbonyl groups (C-4 and C-17), one amido (C-6 and N-7) and one hydroxy group (9-OH). The connection of these units was determined on the basis of 1H–1H COSY and HMBC correlations to reveal the planar structure of 1, which was identified as being the same as that of pseurotin A1 by comparison with data in the literature [14]. In addition, spectroscopic analyses of 2 and 3 identified them as pseurotin A2 and pseurotin A, respectively [14] (Supplementary Material Figures S3–S10).
We succeeded in the isolation of all stereoisomers of FD-838 (Figure 1) including four reaction products, and, therefore, we could establish the relationship between absolute configurations at C-5 and C-8 in the spirofuranone-lactam skeleton and the CD Cotton effects. In addition, we found that the chemical shifts of H-9 and the coupling constant between H-9 and 9-OH in the 1H-NMR spectrum with CDCl3 as a solvent demonstrated the orientations of 9-OH and 8-OCH3 [13]. On investigating the absolute configuration for pseurotin A1 (1) [14], we applied the above phenomena. Comparing the CD spectral data of 1 and 3, the similarity of their CD curves showed that the absolute configurations of C-5 and C-8 in 1 were the same as those in 3, i.e., 1 possessed the 5S, 8S absolute configuration (Figure 2A). For the absolute configuration at C-9, 9-OH oriented cis to 8-OCH3 for a large coupling constant (J = 12 Hz), and trans to 8-OCH3 for a small coupling constant (J = 4 Hz) in its 1H-NMR spectra, and the relative configuration between 9-OH and 8-OCH3 regularly influenced the chemical shift of C-9 in its 13C-NMR spectra [13]. In this study, we could not observe the coupling constant between H-9 and 9-OH (vide info); however, the NMR chemical shifts of C-9 (δC 76.6) clearly showed that 9-OH oriented trans to 8-OCH3 [13]. If 9-OH orients cis to 8-OCH3, the NMR chemical shifts of C-9 would be observed in a high field (δC~74.0) [13]. The above evidence confirmed the absolute stereostructure of 1 [14]. Q.Q. Gu and co-researchers determined the stereochemistry of 1 from NOESY correlations (H-9/8-OCH3 and 9-OH/10-OH) and a comparison of the CD data with 3. In addition, they had referred to our CD spectral examination; however, they had not confirmed the wavelength of the maximum absorbance proceeding from a chiral center of C-8 [13,14].
The extended conjugate system in pseurotins was less marked than those in FD-838 and cephalimysins B–D; therefore, the Cotton effects in the CD spectra should exhibit a hypsochromic shift [13]. In order to assign the Cotton effect ascribed to the configuration at C-8, we examined the epimerization at C-8 in 3. Treatment of 3 with conc. H2SO4 in MeOH gave 5, an 8-epimer of 3, as reported in the literature [13] (Supplementary Material Figures S11 and S12). The CD spectrum of 5 showed the opposite curve to that of 3 at around 280 nm (Figure 2B), i.e., the negative Cotton effect at around 280 nm demonstrated that the absolute configuration at C-8 was an S configuration.
To confirm the stereostructure of pseurotin A2 as 2 [14], a comparison with CD spectral data of pseurotin A2 and 3 was carried out. The Cotton effect at around 250 nm in the CD spectral data of pseurotin A2 was negative, while that of 3 was positive (Figure 3). Q.Q. Gu et al. reported that this difference was due to the change from 8S in 3 to 8R in 2 [14]; however, the above evidence showed that their deduction should be corrected, i.e., the negative Cotton effect (λmax~280 nm) in the CD spectrum of pseurotin A2 revealed that the absolute configuration at C-8 was an S and not R configuration (Figure 3). Meanwhile, the large coupling constant between H-9 and 9-OH in the 1H-NMR spectrum (J = 12.0 Hz) showed that 9-OH oriented cis to 8-OCH3, i.e., the absolute configuration at C-9 was an R configuration [13]. Q.Q. Gu et al. [14] observed a NOESY correlation between 9-OH and 10-OH in 2, while we could not observe it. This NOESY correlation and the above evidence suggested a reversal of the configuration at C-5 in 2; therefore, we found that the CD Cotton effect ascribed to the enone moiety (λmax~250 nm) could be assigned to the absolute configuration at C-5. Based on the detailed analysis of the CD spectra of pseurotin A2 and 3, the 5S isomer 3 showed positive (λmax~250 nm) and negative (λmax~230 nm) Cotton effects, while the 5R isomer 2, pseurotin A2, showed negative (λmax~250 nm) and positive (λmax~230 nm) Cotton effects, respectively (Figure 3). We had demonstrated the same relationship as this phenomenon in our previous report [13], i.e., the 5S isomer (FD-838 and cephalimysin B) exhibited a positive Cotton effect, and the 5R isomer (cephalimysin C and D) exhibited a negative Cotton effect at around 350 nm, respectively.
The stereochemistries of C-10 and C-11 in the side chain of pseurotins were not established positively. To build a relative stereochemistry between the spiro γ-lactam moiety and the side chain, we attempted derivatization to acetonide between 10-OH and 11-OH in 1. The treatment with 2, 2-dimethoxypropane in CH2Cl2 yielded acetonide 6 (Supplementary Material Figure S13). Its NOESY correlations (acetonide α-CH3/9-OH and 3-CH3, acetonide β-CH3/H-10 and H-11, and H-10/3-CH3) clearly showed the absolute conformation of H-10 and H-11 to both be S (Figure 4A, Supplementary Material Figure S15). When assuming the stereochemistry in the side chain to be reversed, it was inconsistent with the observed NOESY correlations. Therefore, we deduced that the steric vicinity between the acetonide and 3-CH3 restrained the free rotation between C-2 and C-10. The NOESY experiment of acetonide 7 (Supplementary Material Figure S14) derived from 4 by the same procedure gave plenty of information for the elucidation of the absolute stereostructure of 4, i.e., NOESY correlations (acetonide α-CH3/9-OH and 8-OCH3, acetonide β-CH3/H-10 and H-11, H-10/3-CH3, and H-12/3-CH3 and 9-OH) were demonstrated in the 10S, 11S absolute configuration (Figure 4B, Supplementary Material Figure S16). Especially, the correlation between H-12 and 9-OH would not be detected in the 10R, 11R configuration.

3. Experimental Section

3.1. General Experimental Procedures

UV spectra were recorded on a Shimadzu (Kyoto, Japan) spectro-photometer U-2000 and IR spectra on a JASCO (Tokyo, Japan) FT/IR-680 Plus. NMR spectra were recorded at 27 °C on Agilent (Santa Clara, CA, USA) NMR-vnmrs600 with tetramethylsilane (TMS) (Nacalai Tesque Inc., Kyoto, Japan) as an internal reference. Mass spectra were determined using a Hitachi M-4000H mass spectrometer. Optical rotatory dispersion (ORD) were recorded on a JASCO J-820 polarimeters. Liquid chromatography over silica gel (mesh 230–400) was performed at a medium pressure. HPLC was run on a JASCO PU-1586 equipped with a differential refractometer (RI-1531) and Cosmosil Packed Column 5C18-MSII (25 cm × 20 mm i.d.) (Kyoto, Japan). Analytical TLC was performed on precoated Merck (Darmstadt, Germany) aluminum sheets (DC-Alufolien Kieselgel 60 F254, 0.2 mm) with the solvent system CH2Cl2–MeOH (19:1), and compounds were viewed under UV lamp and sprayed with 10% H2SO4 followed by heating.

3.2. Fungal Material

A strain of A. fumigatus was initially isolated from the marine fish Mugil cephalus captured in Katsuura Bay, Japan, in October 2000. The fish was disinfected with EtOH and its gastrointestinal tract applied to the surface of nutrient agar layered in a Petri dish. Serial transfers of one of the resulting colonies provided a pure strain of A. fumigatus. The fungal strains were identified by Techno Suruga Laboratory Co., Ltd. (Shizuoka, Japan).

3.3. Culturing and Isolation of Metabolites

The fungal strain was cultured at 27 °C for six weeks in a liquid medium (75 L) containing 1% soluble starch and 0.1% casein in 50% artificial seawater adjusted to pH 7.4. The culture was filtered under suction, and the culture filtrate was extracted three times with EtOAc. The combined extracts were evaporated in vacuo to afford a mixture of crude metabolites (20.5 g) that exhibited cytotoxicity against the P388 cell line (IC50 < 1 μg/mL). The EtOAc extract was passed through a Sephadex LH-20 column using CHCl3–MeOH (1:1) as the eluent. The second fraction (13.8 g) was chromatographed on a silica gel column with a hexane–CHCl3–MeOH gradient as the eluent to afford Fr. 1 (the 2% MeOH in CHCl3 eluate, 3.6 g). Fr. 1 was chromatographed on a silica gel column with a CHCl3–MeOH gradient as the eluent to afford Fr. 2 (the 5% MeOH in CHCl3 eluate, 1.4 g). Fr. 2 was purified by HPLC using MeOH–H2O (70:30) as the eluent to afford Fr. 3 (247.9 mg) and Fr. 4 (45.6 mg). Fr. 3 was purified by HPLC using MeOH–H2O (50:50) as the eluent to afford Fr. 5 (168.4 mg). Fr. 5 was purified by ODS HPLC using MeCN–H2O (30:70) as the eluent to afford pseurotin A1 (1, 1.5 mg) and pseurotin A (3, 70.5 mg). Fr. 4 was purified by HPLC using MeOH–H2O (50: 50) as the eluent to afford Fr. 6 (168.4 mg). Fr. 6 was purified by ODS HPLC using MeCN–H2O (30:70) as the eluent to afford pseurotin A2 (4, 4.1 mg).
Pseurotins A, A1 and A2: 1H- and 13C-NMR data (CDCl3) are listed in Table 1.

3.4. Chemical Transformation

3.4.1. Epimerization of 3

To a solution of 3 (3.2 mg) in MeOH (0.5 mL), one drop of conc. H2SO4. was added, and the reaction mixture was stirred at room temperature for 30 min. The reaction mixture was extracted with diethyl ether thrice, and the organic layer was evaporated under reduced pressure. The residue was purified by HPLC using MeCN–H2O (30:70) as the eluent to afford 5 (0.6 mg).

3.4.2. Derivatization to Acetonides from Pseurotin A1 (1) and A2 (4)

To a solution of 1 (3.3 mg) in CH2Cl2 (0.3 mL), 2,2-dimethoxypropane (0.3 mL) and pyridium p-toluensulfonate (0.2 mg) were added, and the reaction mixture was stirred at room temperature for 1 h. The reaction mixture was evaporated under reduced pressure. The residue was purified by HPLC using MeOH–H2O (60:40) as the eluent to afford acetonide 6 (2.2 mg). Using the same procedure, 4 (2.0 mg) was treated with 2,2-dimethoxypropane (0.3 mL) and pyridium p-toluensulfonate (0.2 mg), and purified by HPLC to afford 7 (0.4 mg).
Acetonide 6: Pale yellow oil; FABMS m/z (rel. int.): HRFABMS m/z 472.1964 [M + H]+ (calcd for C25H30NO8: 472.1970). 1H-NMR δ ppm (CDCl3): 0.95 (3H, t, J = 7.2 Hz, H-15), 1.43 (3H, s, acetonide-β-CH3), 1.58 (3H, s, acetonide-α-CH3), 1.73 (3H, s, H-16), 2.04 (1H, m, H-14A), 2.17 (1H, m, H-14B), 2.76 (1H, d, J = 3.6 Hz, 9-OH), 3.31 (3H, s, 9-OCH3), 4.77 (1H, d, J = 3.6 Hz, H-9), 5.15 (1H, d, J = 7.8 Hz, H-10), 5.25 (1H, ddd, J = 9.6, 7.8, 1.2 Hz, H-11), 5.57 (1H, ddt, J = 10.8, 9.6, 1.2 Hz, H-12), 5.57 (1H, dtd, J = 10.8, 7.2, 1.2 Hz, H-13), 7.33 (1H, br s, H-6), 7.43 (2H, t, J = 7.8 Hz, H-20 and H-22), 7.66 (1H, t, J = 7.8 Hz, H-21), 8.22 (2H, d, J = 7.8 Hz, H-19 and H-23).
Acetonide 7: Pale yellow oil; FABMS m/z (rel. int.): HRFABMS m/z 472.1964 [M + H]+ (calcd for C25H30NO8: 472.1970). 1H-NMR δ ppm (CDCl3): 1.02 (3H, t, J = 7.2 Hz, H-15), 1.49 (3H, s, acetonide-β-CH3), 1.64 (3H, s, acetonide-α-CH3), 1.67 (3H, s, H-16), 2.13 (1H, m, H-14A), 2.20 (1H, m, H-14B), 3.29 (3H, s, 9-OCH3), 3.36 (1H, d, J = 12.6 Hz, 9-OH), 4.52 (1H, d, J = 12.6 Hz, H-9), 5.17 (1H, d, J = 6.6 Hz, H-10), 5.26 (1H, ddd, J = 9.0, 6.6, 1.2 Hz, H-11), 5.57 (1H, ddt, J = 10.8, 9.0, 1.2 Hz, H-12), 5.72 (1H, dtd, J = 10.8, 7.2, 0.6 Hz, H-13), 7.49 (2H, t, J = 7.8 Hz, H-20 and H-22), 7.64 (1H, t, J = 7.8 Hz, H-21), 8.29 (2H, d, J = 7.8 Hz, H-19 and H-23).

5. Conclusions

Q.Q. Gu et al. [14] deduced the stereostructure of pseurotin A2 as 2 from NOESY experiments and a comparison of CD spectra with cephalimysins. We assigned the CD Cotton effect ascribed to the absolute configuration at C-8 by the epimerization of pseurotin A (3), and revised the stereostructure of pseurotin A2 from 2 to 4. In this process, we newly found the Cotton effect ascribed to the absolute configuration at C-5. In addition, we found that the absolute configuration in the side chain of pseurotins could be established positively by detailed analyses of the NOESY experiments of their acetonide derivatives.

Supplementary Materials

The following are available online at www.mdpi.com/1660-3397/14/4/74/s1, Figure S1: 1H NMR spectrum in CDCl3 of pseurotin A1 (1), Figure S2: 13C NMR spectrum in CDCl3 of pseurotin A1 (1), Figure S3: 1H NMR spectrum in CDCl3 of pseurotin A2 (4), Figure S4: 13C NMR spectrum in CDCl3 of pseurotin A2 (4), Figure S5: 2D NMR spectra of pseurotin A2 (4) (1H-1H COSY), Figure S6: 2D NMR spectra of pseurotin A2 (4) (HMQC), Figure S7: 2D NMR spectra of pseurotin A2 (4) (HMBC), Figure S8: 1H NMR spectrum in CDCl3 of pseurotin A (3), Figure S9: 13C NMR spectrum in CDCl3 of pseurotin A (3), Figure S10: 1H NMR spectrum in CDCl3 of pseurotin A (3) (400 MHz), Figure S11: 1H NMR spectrum in CDCl3 of 5 (8-epimer of 3), Figure S12: 13C NMR spectrum in CDCl3 of 5 (8-epimer of 3), Figure S13: 1H NMR spectrum in CDCl3 of 6 (acetonide of 1), Figure S14: 1H NMR spectrum in CDCl3 of 7 (acetonide of 4), Figure S15: NOESY of 6 (acetonide of 1), Figure S16: NOESY of 7 (acetonide of 4).

Acknowledgments

We are grateful to M. Fujitake and K. Minoura of this university for MS and NMR measurements, respectively. This study was supported by JSPS KAKENHI Grant Number 26460136.

Author Contributions

Conceived and designed the experiments: Mina Ohshima, Kaori Yuasa, Reiko Tanaka, Takashi Kikuchi, Takeshi Yamada; Performed the experiments: Mina Ohshima, Kaori Yuasa, Takeshi Yamada; Analyzed the data: Takeshi Yamada; Wrote the paper: Takeshi Yamada.

Conflicts of Interest

The authors declare no conflict of interest.

References

  1. Bloch, P.; Tamm, C.; Bollinger, P.; Petcher, T.J.; Weber, H.P. Pseurotin, a New Metabolite of Pseudeurotium ovalis STOLK Having an Unusual Hetero-Spirocyclic System. Helv. Chim. Acta 1976, 59, 133–137. [Google Scholar] [CrossRef] [PubMed]
  2. Weber, H.P.; Petcher, T.J.; Bloch, P.; Tamm, C. The Crystal and Molecular Structure of 12, 13-Dibromopseurotin. Helv. Chim. Acta 1976, 59, 137–140. [Google Scholar] [CrossRef] [PubMed]
  3. Bloch, P.; Tamm, C. Isolation and Structure of Pseurotin A, a Microbial Metabolite of Pseudeurotium ovalis STOLK with an Unusual Heterospirocyclic System. Helv. Chim. Acta 1981, 64, 304–315. [Google Scholar] [CrossRef]
  4. Ishikawa, M.; Ninomiya, T.; Akabane, H.; Kushida, N.; Tsujiuchi, G.; Ohyama, M.; Gomi, S.; Shito, K.; Murata, T. Pseurotin A and its analogues as inhibitors of immunoglobuline E production. Bioorg. Med. Chem. Lett. 2009, 19, 1457–1460. [Google Scholar] [CrossRef] [PubMed]
  5. Hayashi, Y.; Shoji, M.; Yamaguchi, J.; Sato, K.; Yamaguchi, S.; Mukaiyama, T.; Sakai, K.; Asami, Y.; Kakeya, H.; Osada, H. Asymmetric Total Synthesis of (−)-Azaspirene, a Novel Angiogenesis Inhibitor. J. Am. Chem. Soc. 2002, 124, 12078–12079. [Google Scholar] [CrossRef] [PubMed]
  6. Aoki, S.; Oi, T.; Shimizu, K.; Shiraki, R.; Takao, K.; Tadano, K. Total Syntheses of Natural Pseurotins A, F2, and Azaspirene. Bull. Chem. Soc. Jpn. 2004, 77, 1703–1716. [Google Scholar] [CrossRef]
  7. Hayashi, Y.; Shoji, M.; Yamaguchi, S.; Mukaiyama, T.; Yamaguchi, J.; Kakeya, H.; Osada, H. Asymmetric Total Synthesis of Pseurotin A. Org. Lett. 2003, 5, 2287–2290. [Google Scholar] [CrossRef] [PubMed]
  8. Hayashi, Y.; Shoji, M.; Mukaiyama, T.; Gotoh, H.; Yamaguchi, S.; Nakata, M.; Kakeya, H.; Osada, H. First Asymmetric Total Synthesis of Synerazol, an Antifungal Antibiotic, and Determination of Its Absolute Stereochemistry. J. Org. Chem. 2005, 70, 5643–5654. [Google Scholar] [CrossRef] [PubMed]
  9. Orellana, A.; Rovis, T. Towards the total synthesis of FD-838: Modular enantioselective assembly of the core. Chem. Commun. 2008, 730–732. [Google Scholar] [CrossRef]
  10. Hayashi, Y.; Sankar, K.; Ishikawa, H.; Nozawa, Y.; Mizoue, K.; Kakeya, H. Total synthesis and determination of the absolute configuration of FD-838, a naturally occurring azaspirobicyclic product. Bioorg. Med. Chem. Lett. 2009, 19, 3863–3865. [Google Scholar] [CrossRef] [PubMed]
  11. Igarashi, Y.; Yabuta, Y.; Furumai, T. Determination of the absolute configuration of synerazol. J. Antibiotics 2004, 57, 537–540. [Google Scholar] [CrossRef]
  12. Yamada, T.; Imai, E.; Nakatsuji, K.; Numata, A.; Tanaka, R. Cephalimysin A, a potent cytotoxic metabolite from an Aspergillus species separated from a marine fish. Tetrahedron Lett. 2007, 48, 6294–6296. [Google Scholar] [CrossRef]
  13. Yamada, T.; Kitada, H.; Kajimoto, T.; Numata, A.; Tanaka, R. The Relationship between the CD Cotton Effect and the Absolute Configuration of FD-838 and Its Seven Stereoisomers. J. Org. Chem. 2010, 75, 4146–4153. [Google Scholar] [CrossRef] [PubMed]
  14. Wang, F.Z.; Li, D.H.; Zhu, T.J.; Zhang, M.; Gu, Q.Q. Pseurotin A1 and A2, two new 1-oxa-7-azaspiro[4.4]non-2-ene-4,6-diones from the holothurian-derived fungus Aspergillus fumigatus WFZ-25. Can. J. Chem. 2011, 89, 72–76. [Google Scholar] [CrossRef]
Figure 1. Structures of pseurotins and FD-838.
Marinedrugs 14 00074 g001
Figure 2. (A) The comparison of CD spectra of 1 and 3; (B) The comparison of CD spectra of 3 and 5.
Marinedrugs 14 00074 g002
Figure 3. CD spectra of pseurotin A2 and 3.
Marinedrugs 14 00074 g003
Figure 4. Key NOESY correlations of acetonide derivatives 6 (A) and 7 (B).
Marinedrugs 14 00074 g004
Table 1. NMR spectral data forpseurotins in CDCl3.
PositionPseurotin A1 (1)Pseurotin A235
δH am, J/HzδC δH am, J/HzδC δH am, J/HzδC δH am, J/HzδC
1
2 183.4qC 183.5qC 186.0qC 186.4,qC
3 113.2qC 114.3qC 113.4qC 114.8,qC
4 196.2qC 199.7qC 196.5qC 201.1,qC
5 89.5qC 87.3qC 92.7qC 86.5,qC
6 169.4qC 166.9qC 166.8qC 167.5,qC
78.53s 7.70s 8.38s 7.34s
8 96.5qC 93.2qC 90.5qC 96.4,qC
94.88s76.6CH4.42br d, 12.0 (9-OH)74.2CH4.69br s73.2CH4.86d, 5.4 (9-OH)78.6,CH
104.60br s70.5CH4.73d, 3.0 (11)70.1CH4.59d, 5.4 (11)70.7CH4.69br d, 5.4 (11)70.9,CH
114.76d, 7.8 (12)71.0CH4.94dd,
8.4 (12) 3.0 (10)
70.6CH4.75dd,
10.8 (12) 5.4 (10)
70.7CH4.81dd,
10.8 (12) 5.4 (10)
69.6,CH
125.23dd,
10.8 (13) 7.8 (11)
126.4CH5.28dd,
10.8 (13) 8.4 (11)
125.3CH5.28dd,
11.2 (13) 10.8 (11)
126.4CH5.43dd,
11.2 (13) 10.8 (11)
125.6,CH
135.64dt,
10.8 (12) 7.2 (14)
136.9CH5.64dt,
10.8 (12) 7.2 (14)
137.4CH5.59dt,
11.2 (12) 7.8 (14)
136.8CH5.74dt,
11.2 (12) 7.8 (14)
138.2,CH
14A2.09m21.4CH22.14m21.4CH22.09m21.4CH22.15m21.5,CH2
14B2.15m 2.19m 2.15m 2.21m
150.99t, 7.8 (14)14.1CH31.03t, 7.2 (14)14.1CH30.98t, 9.0 (14)14.1CH31.05t, 7.2 (14)14.2,CH3
161.68s6.2CH31.67s5.9CH31.68s6.0CH31.78s5.6,CH3
17 194.3qC 194.0qC 195.2qC 192.4,qC
18 133.5qC 132.8qC 132.4qC 133.8,qC
198.27d, 8.4 (20)130.0CH8.34d, 8.4 (20)130.7CH8.31d, 8.4 (20)130.7CH8.20d, 8.4 (20)129.4,CH
207.49t, 8.4 (19, 21)128.8CH7.48t, 8.4 (19, 21)128.6CH7.49t, 8.4 (19, 21)128.7CH7.50t, 8.4 (19, 21)128.8,CH
217.64t, 8.4 (20, 22)134.4CH7.63t, 8.4 (20, 22)134.6CH7.64t, 8.4 (20, 22)134.7CH7.63t, 8.4 (20, 22)134.2,CH
227.49t, 8.4 (21, 23)128.8CH7.48t, 8.4 (21, 23)128.6CH7.49t, 8.4 (21, 23)128.7CH7.50t, 8.4 (21, 23)128.8,CH
238.27d, 8.4 (22)130.0CH8.34d, 8.4 (22)130.7CH8.31d, 8.4 (22)130.7CH8.20d, 8.4 (22)129.4,CH
8-OCH33.37s51.7CH33.30s51.9CH33.44s51.8CH33.27s51.5,CH3
9-OH3.94br s 4.22br d, 12.0 (9) 4.25br s 4.97d, 5.4 (9)
a 1H chemical shift values (δ ppm from SiMe4) followed by multiplicity and then the coupling constants (J/Hz). Figures in parentheses indicate the proton coupling with that position.

