Biosynthetic Studies on Water-Soluble Derivative 5c (DTX5c)


Abstract
:1. Introduction

2. Results and Discussion
 ], and in black those after addition of [2-13C] sodium acetate experiment [
  ].
], and in black those after addition of [2-13C] sodium acetate experiment [ ].
].
], and in black those after addition of [2-13C] sodium acetate experiment [ ].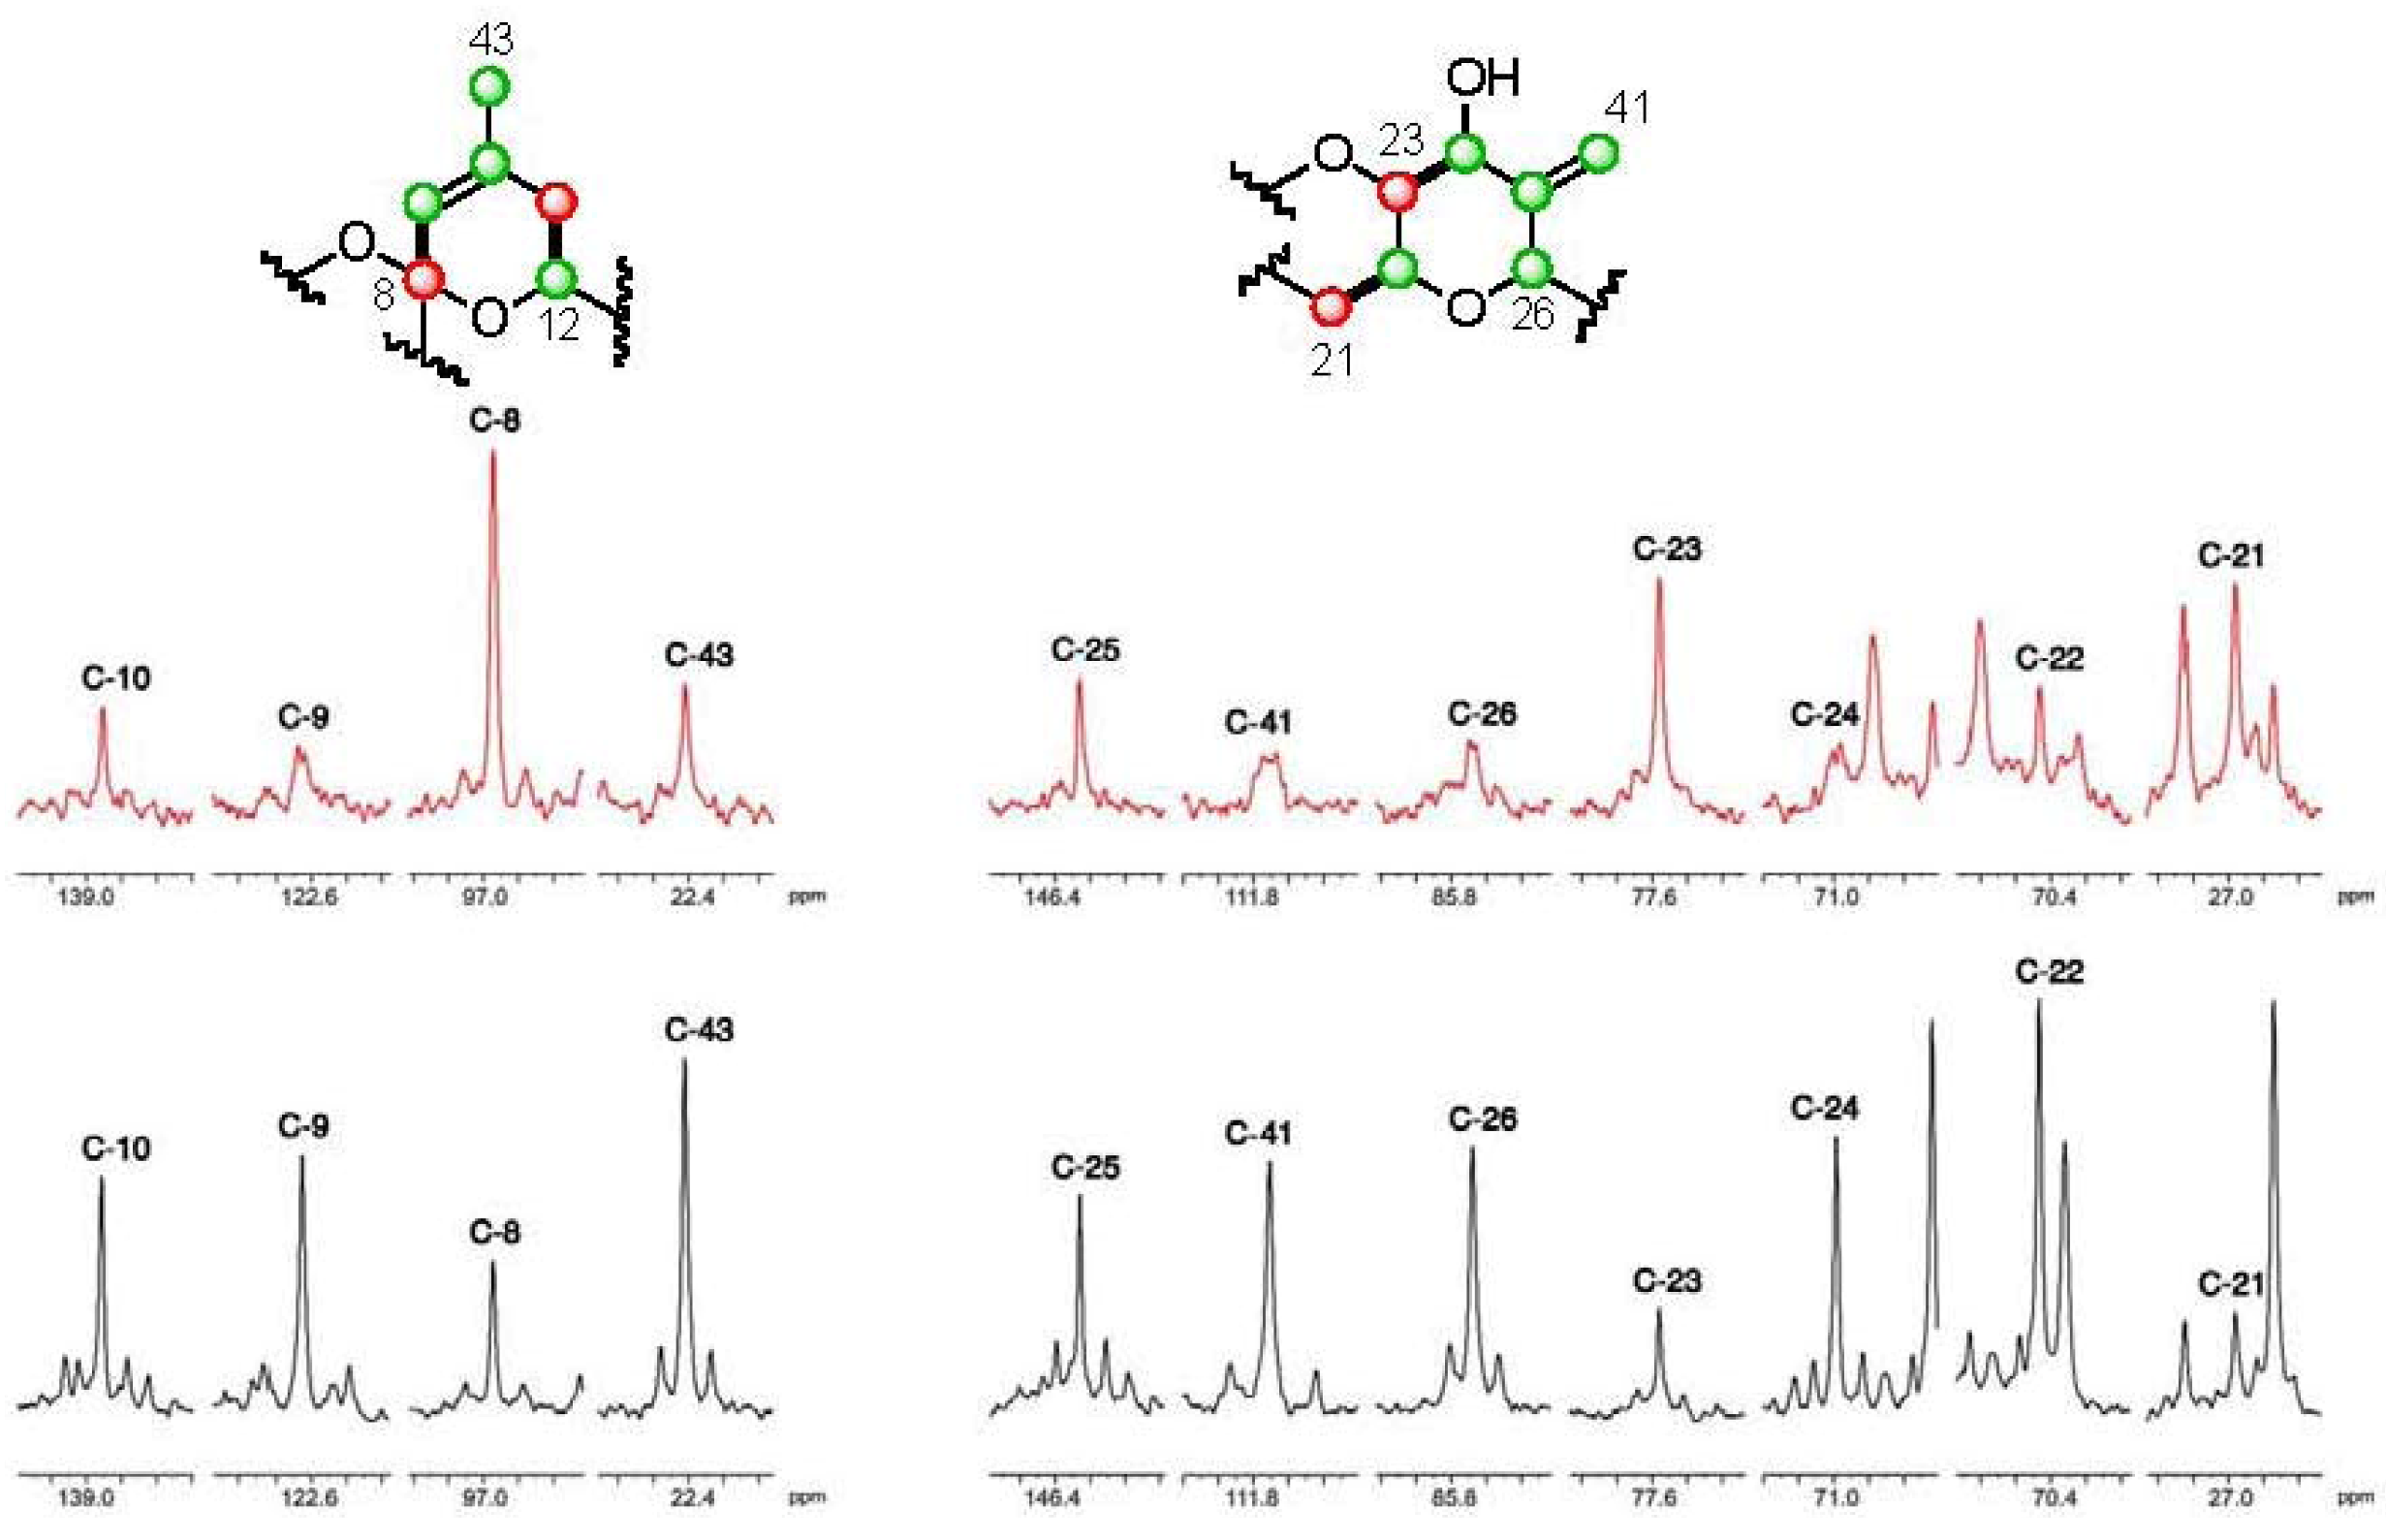 ], and in black those from the [2-13C] sodium acetate experiment [ ].
], and in black those from the [2-13C] sodium acetate experiment [ ].
], and in black those from the [2-13C] sodium acetate experiment [ ].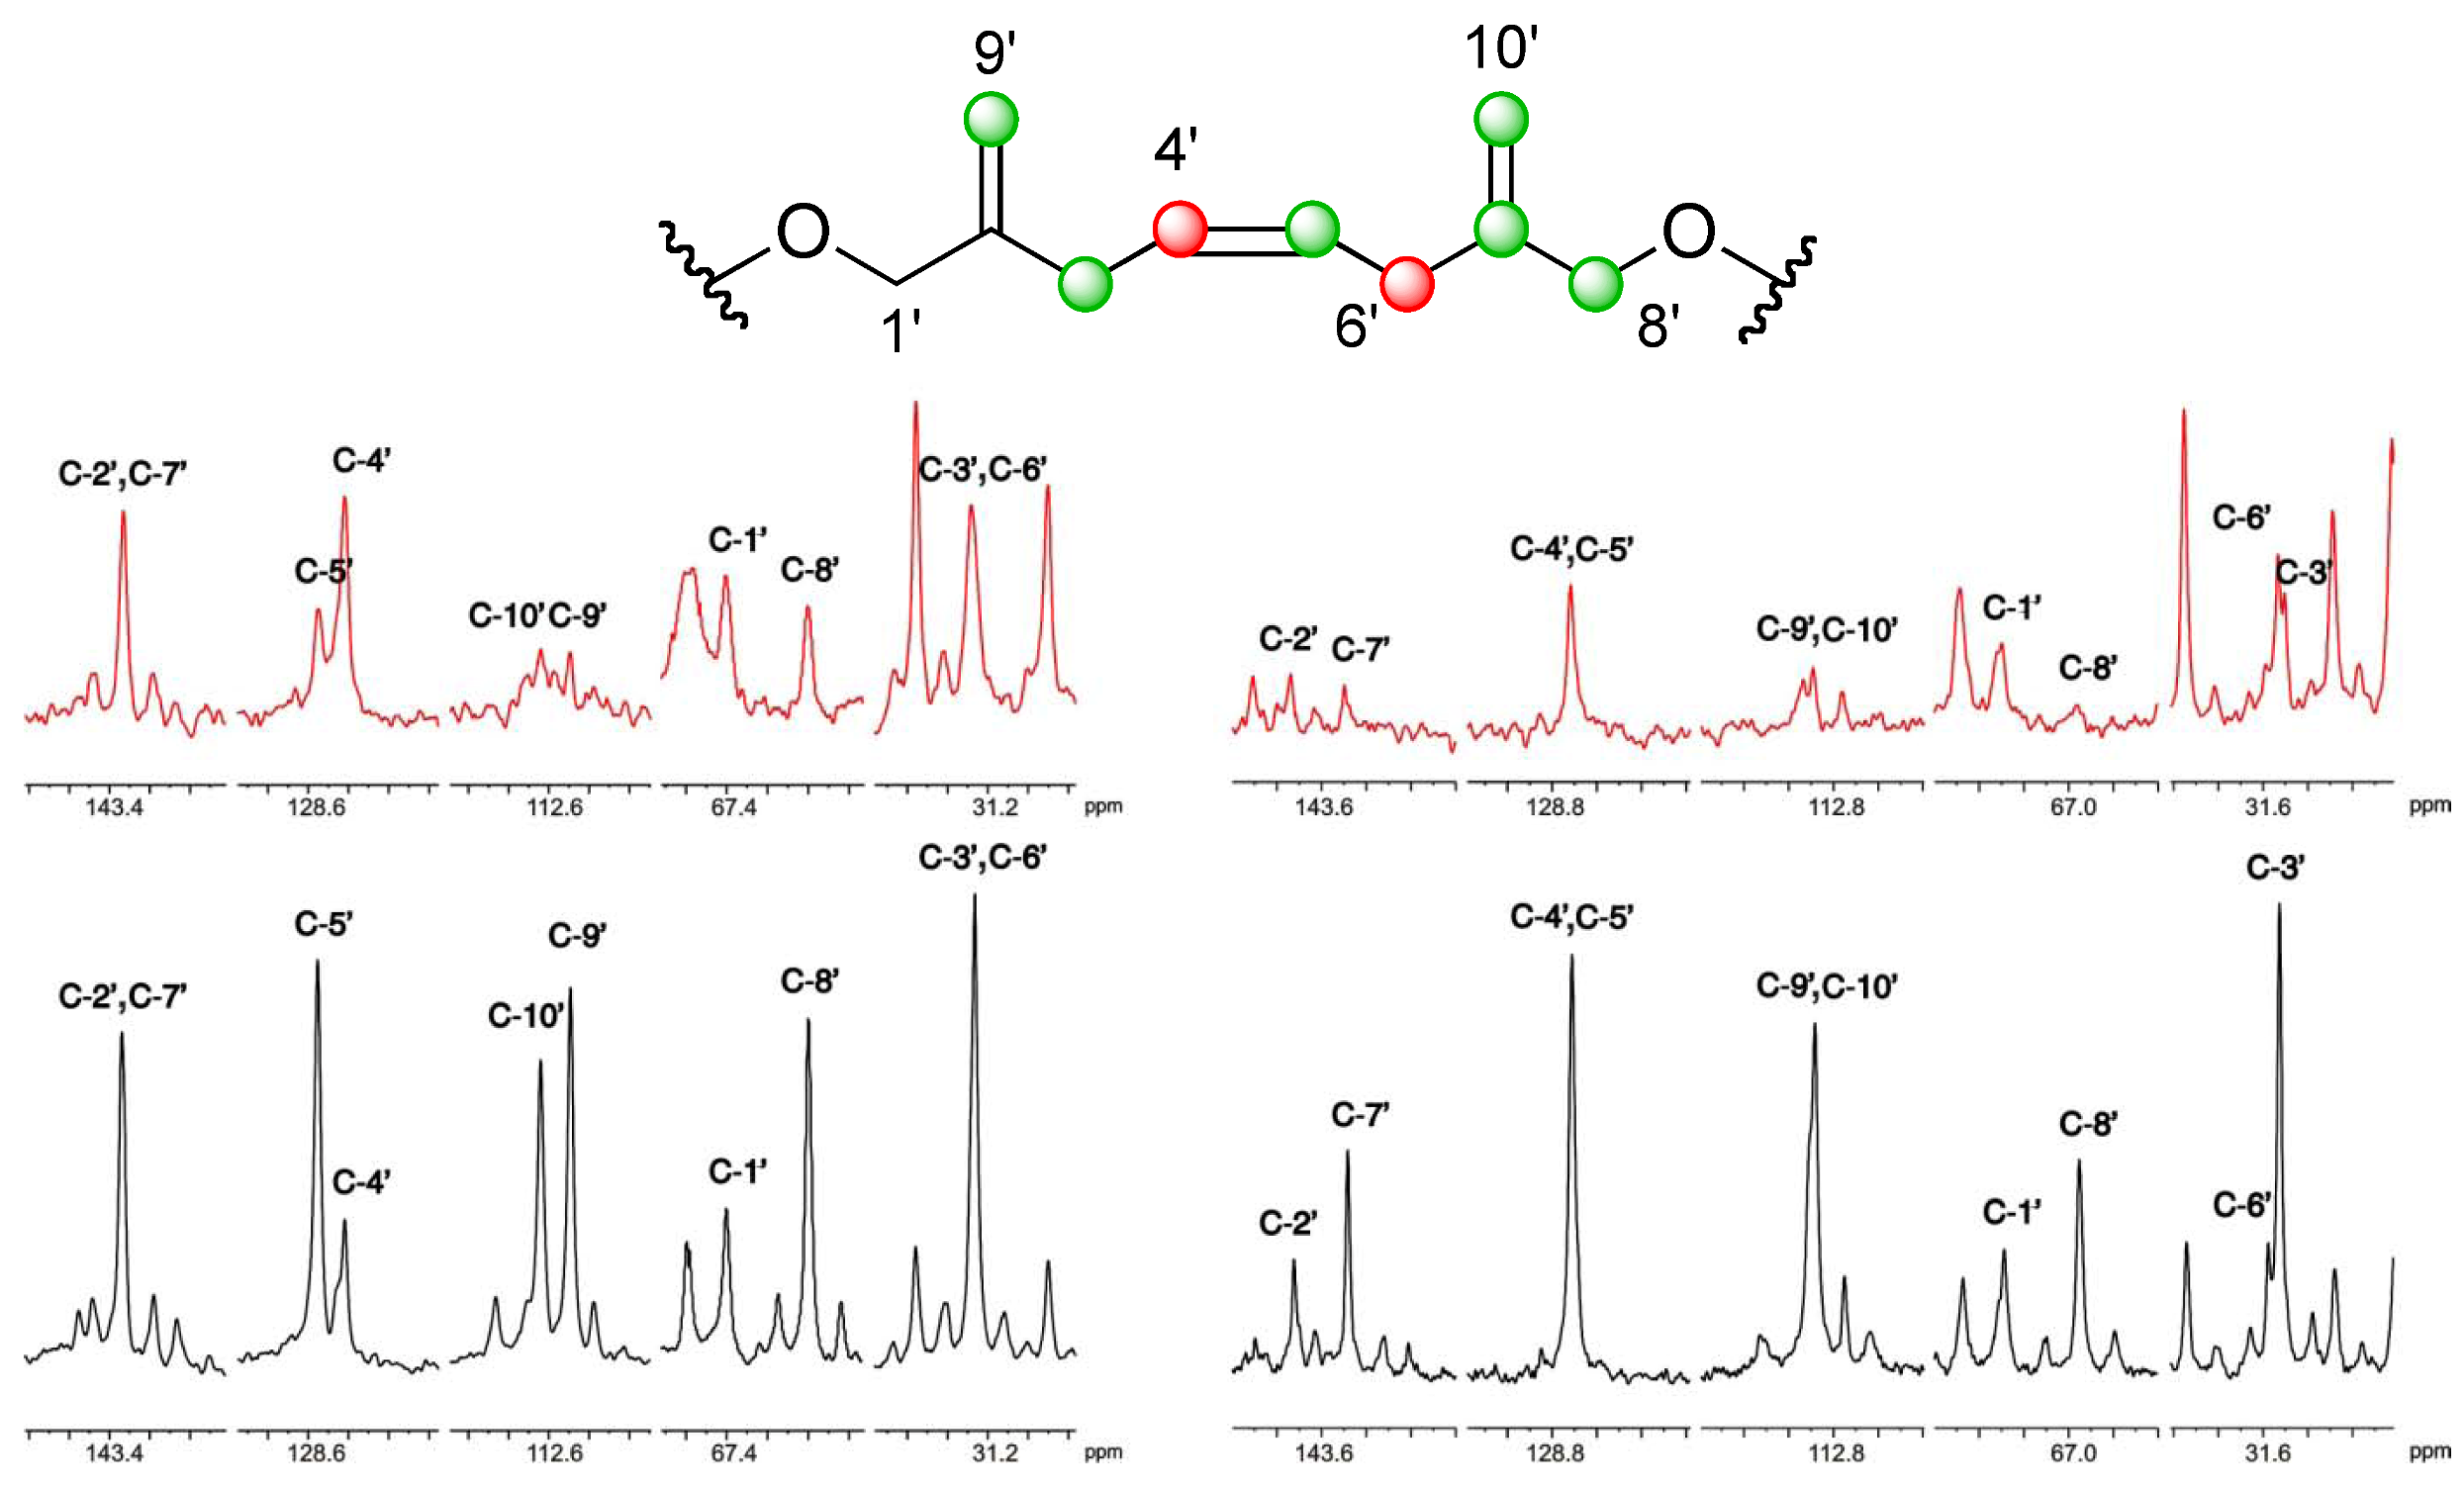 ], and the [2-13C] sodium acetate experiment is represented by [ ].
], and the [2-13C] sodium acetate experiment is represented by [ ].
], and the [2-13C] sodium acetate experiment is represented by [ ].

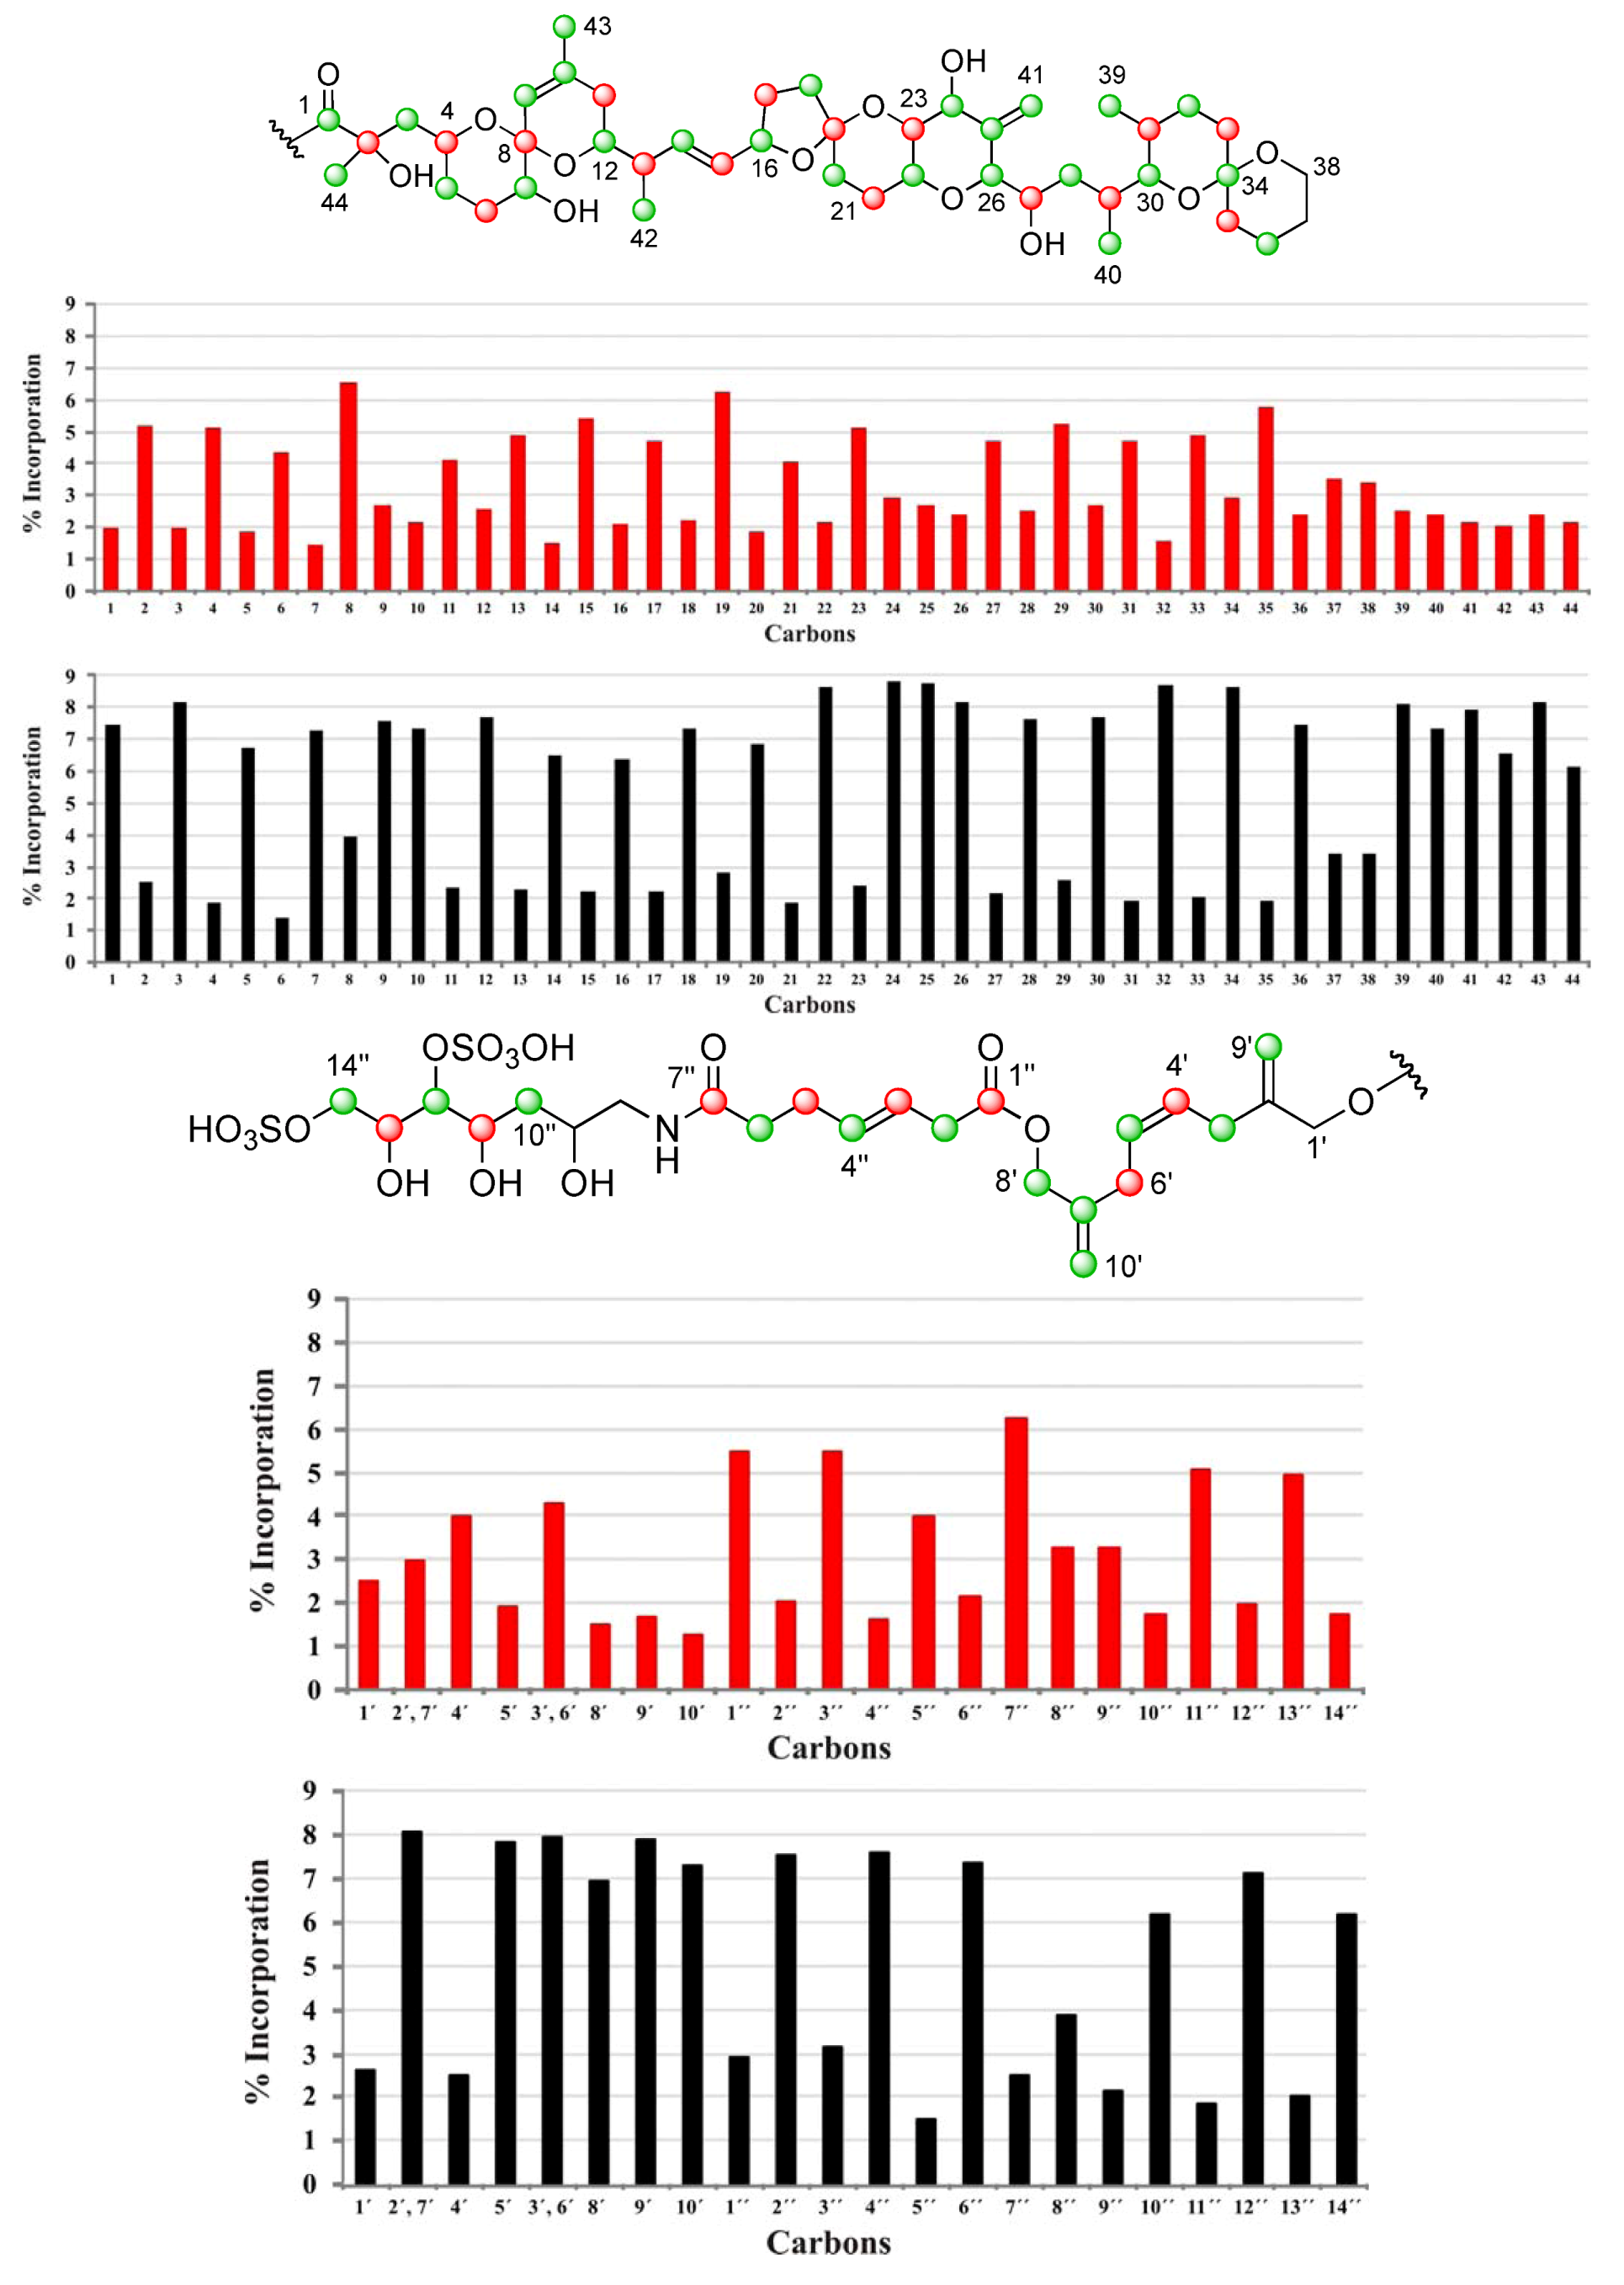
| C | δC | Origin | % Inc a [2-13C] | % Inc a [1-13C] | C | δC | Origin | % Inc a [2-13C] | % Inc a [1-13C] |
|---|---|---|---|---|---|---|---|---|---|
| 1 | 176.05 | m | 7.5 | 2.0 | 34 | 96.21 | m | 8.6 | 2.9 |
| 2 | 74.93 | c | 2.5 | 5.1 | 35 | 36.21 | c | 1.9 | 5.7 |
| 3 | 45.39 | m | 8.2 | 2.0 | 36 | 19.01 | m | 7.5 | 2.4 |
| 4 | 67.57 | c | 1.9 | 5.1 | 37 | 25.73 | 3.4 | 3.5 | |
| 5 | 32.62 | m | 6.7 | 1.8 | 38 | 60.56 | 3.4 | 3.4 | |
| 6 | 27.21 | c | 1.4 | 4.3 | 39 | 10.27 | m | 8.1 | 2.5 |
| 7 | 72.26 | m | 7.3 | 1.4 | 40 | 15.89 | m | 7.4 | 2.4 |
| 8 | 96.86 | c | 4.0 | 6.6 | 41 | 111.70 | m | 7.9 | 2.2 |
| 9 | 122.61 | m | 7.6 | 2.7 | 42 | 15.79 | m | 6.6 | 2.1 |
| 10 | 138.87 | m | 7.3 | 2.2 | 43 | 22.41 | m | 8.2 | 2.4 |
| 11 | 33.19 | c | 2.3 | 4.1 | 44 | 25.34 | m | 6.1 | 2.2 |
| 12 | 71.46 | m | 7.7 | 2.6 | 1′ | 67.38 | 2.6 | 2.5 | |
| 13 | 42.20 | c | 2.3 | 4.9 | 2′, 7′ | 143.35 | 8.0 | 3.0 | |
| 14 | 135.78 | m | 6.5 | 1.5 | 4′ | 128.42 | c | 2.5 | 4.0 |
| 15 | 131.58 | c | 2.2 | 5.4 | 5′ | 128.56 | m | 7.8 | 1.9 |
| 16 | 79.64 | m | 6.4 | 2.1 | 3′, 6′ | 31.23 | 7.9 | 4.3 | |
| 17 | 30.86 | c | 2.2 | 4.7 | 8′ | 66.97 | m | 6.9 | 1.5 |
| 18 | 37.24 | m | 7.3 | 2.2 | 9′ | 112.45 | m | 7.9 | 1.7 |
| 19 | 106.34 | c | 2.8 | 6.3 | 10′ | 112.60 | m | 7.3 | 1.3 |
| 20 | 33.36 | m | 6.9 | 1.9 | 1″ | 172.47 | c | 2.9 | 5.5 |
| 21 | 26.92 | c | 1.9 | 4.0 | 2″ | 37.96 | m | 7.5 | 2.0 |
| 22 | 70.42 | m | 8.7 | 2.2 | 3″ | 123.29 | c | 3.1 | 5.5 |
| 23 | 77.56 | c | 2.4 | 5.1 | 4″ | 133.38 | m | 7.5 | 1.6 |
| 24 | 70.97 | m | 8.8 | 2.9 | 5″ | 29.01 | c | 1.4 | 4.0 |
| 25 | 146.25 | m | 8.7 | 2.7 | 6″ | 35.88 | m | 7.3 | 2.2 |
| 26 | 85.66 | m | 8.2 | 2.4 | 7″ | 174.99 | c | 2.5 | 6.3 |
| 27 | 65.27 | c | 2.2 | 4.7 | 8″ | 45.67 | 3.8 | 3.2 | |
| 28 | 35.97 | m | 7.6 | 2.5 | 9″ | 68.43 | 2.1 | 3.2 | |
| 29 | 31.51 | c | 2.6 | 5.2 | 10″ | 38.01 | m | 6.2 | 1.8 |
| 30 | 76.02 | m | 7.7 | 2.7 | 11″ | 69.06 | c | 1.8 | 5.1 |
| 31 | 27.94 | c | 1.9 | 4.7 | 12″ | 79.82 | m | 7.1 | 2.0 |
| 32 | 26.70 | m | 8.7 | 1.5 | 13″ | 70.76 | c | 2.0 | 4.9 |
| 33 | 30.46 | c | 2.1 | 4.9 | 14″ | 70.27 | m | 6.2 | 1.7 |

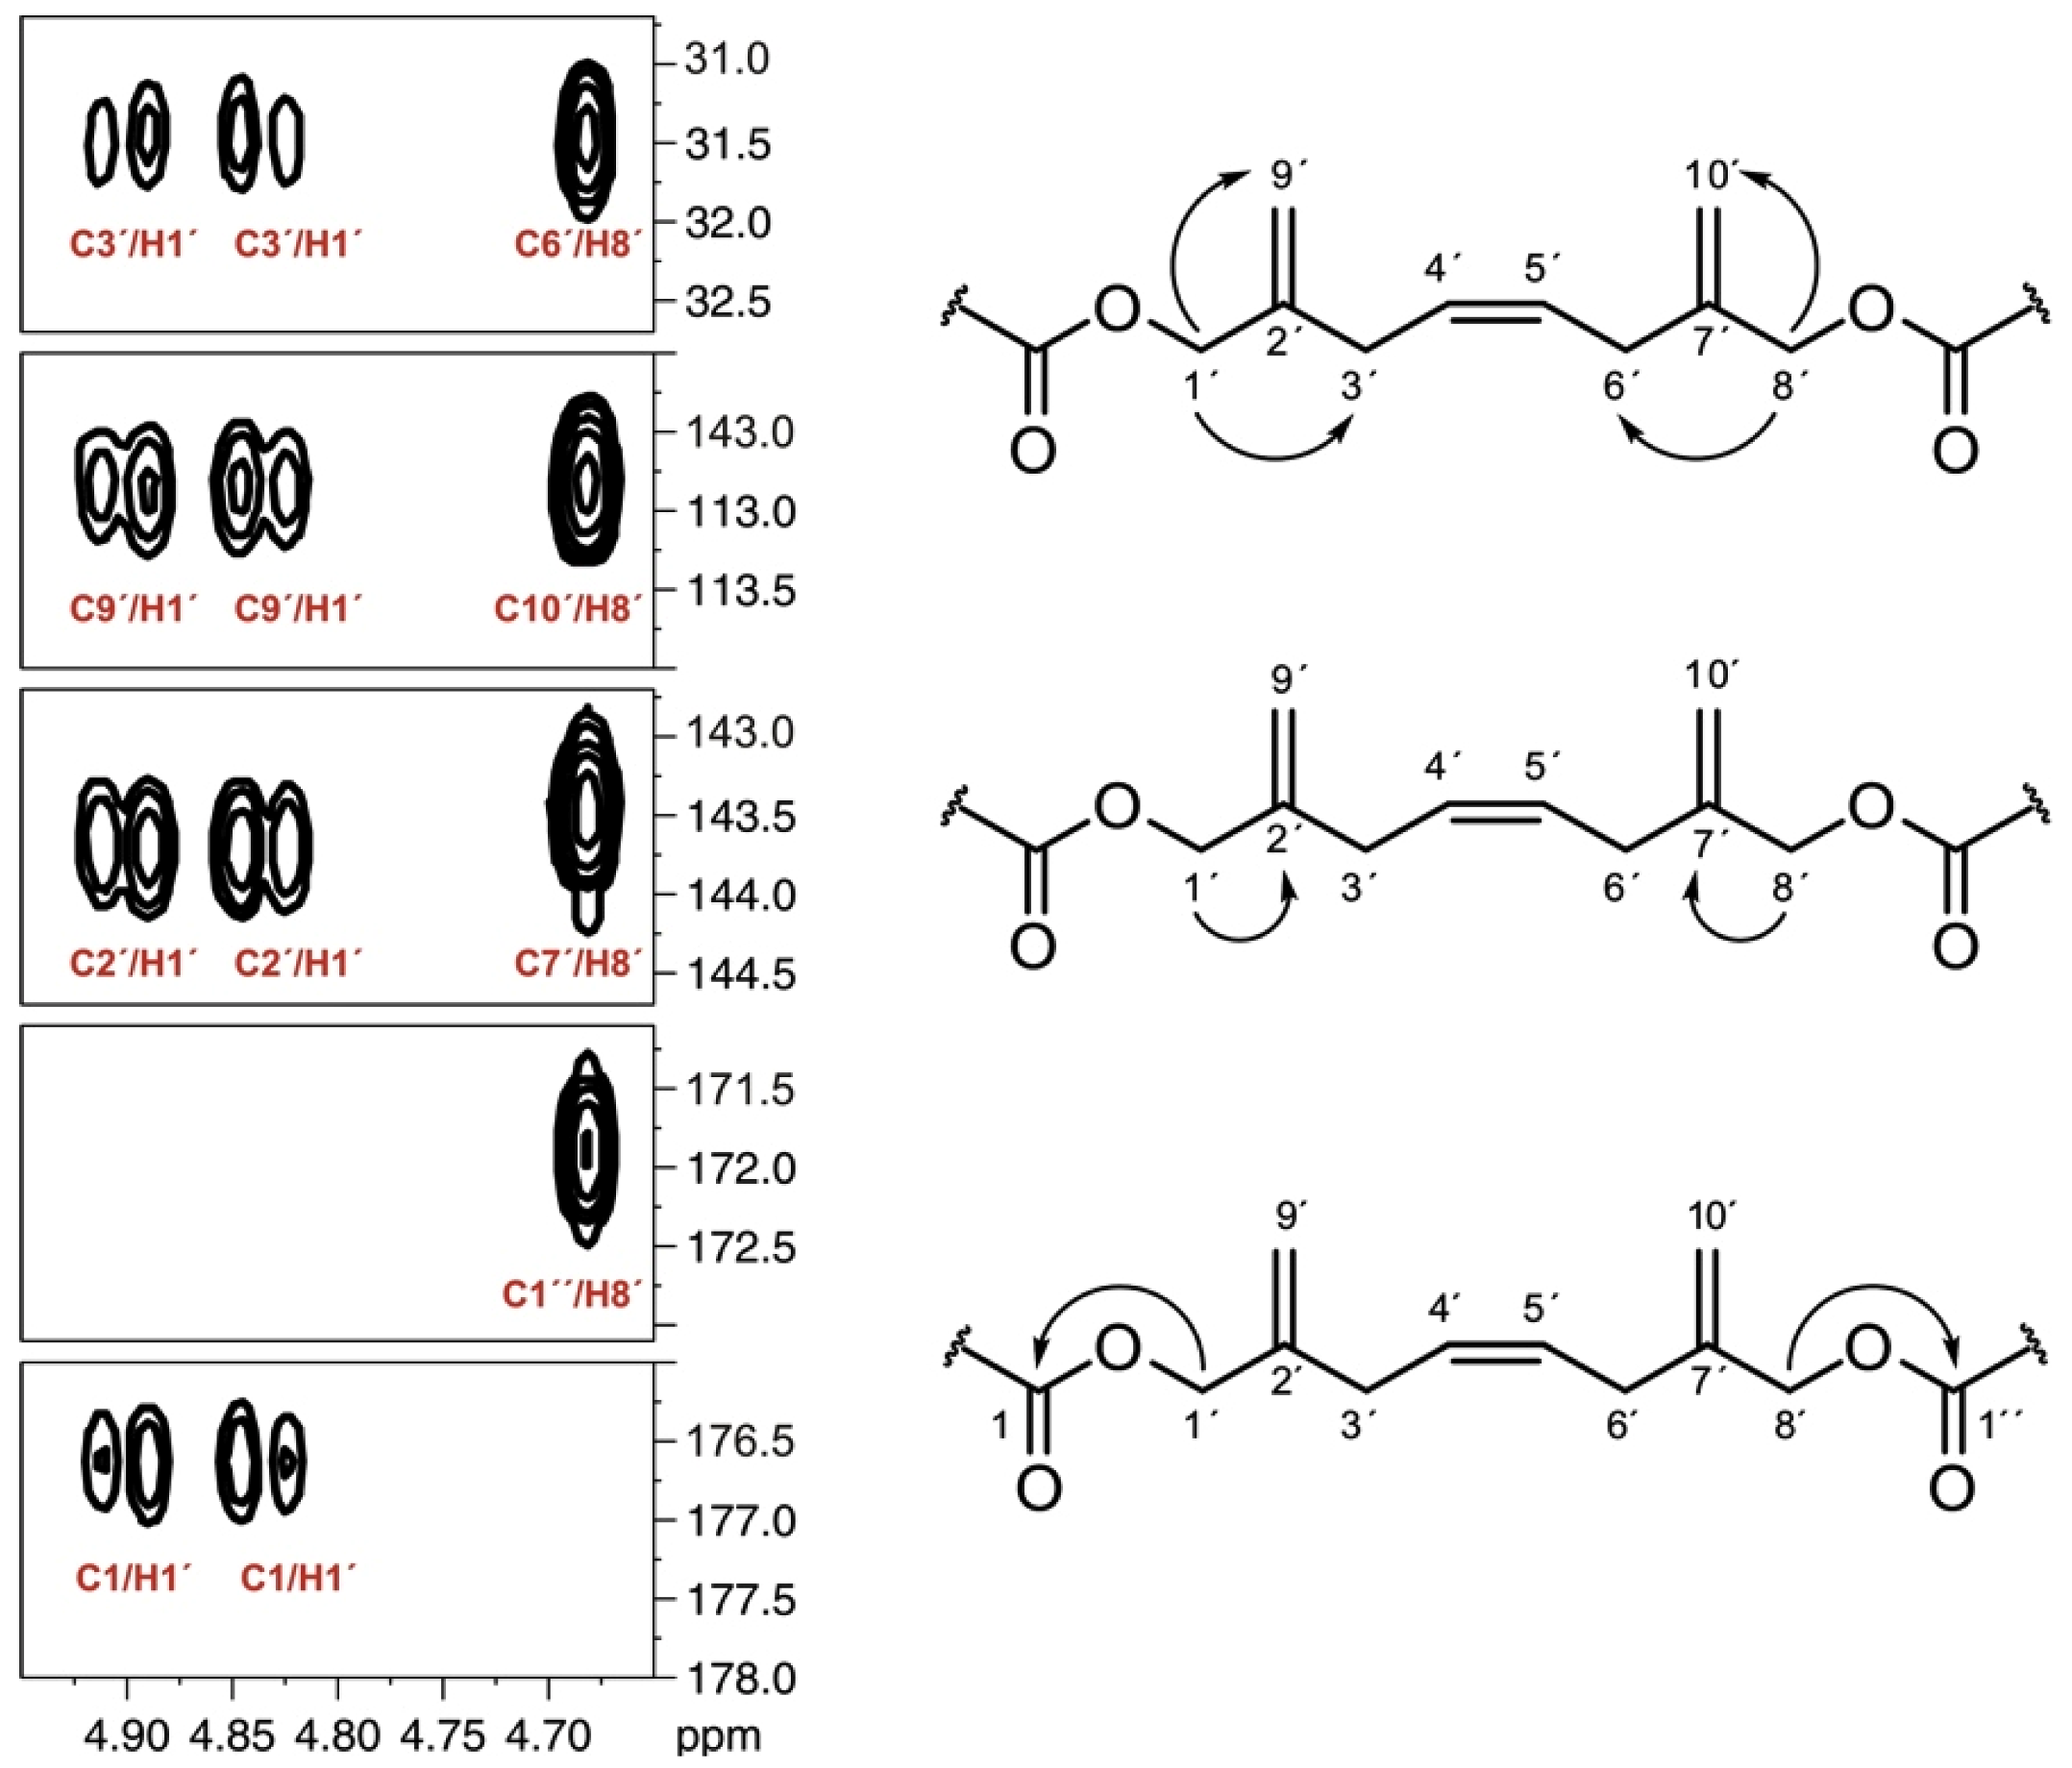
| Carbon | δC CD3OD | δC Pyridine-d5 | % Inc * [2-13C] a | % Inc * [1-13C] a |
|---|---|---|---|---|
| 1′ | 67.38 | 67.28 | 2.6 b | 2.5 b |
| 2′ | 143.35 | 143.73 | 1.9 c | 1.8 c |
| 3′ | 31.23 | 31.53 | 6.6 c | 1.5 c |
| 4′ | 128.42 | 128.72 | 2.5 b | 4.0 b |
| 5′ | 128.56 | 128.72 | 7.8 b | 1.9 b |
| 6′ | 31.23 | 31.56 | 1.3 c | 2.8 c |
| 7′ | 143.35 | 143.50 | 6.1 c | 1.2 c |
| 8′ | 66.97 | 66.94 | 6.9 b | 1.5 b |
| 9′ | 112.45 | 112.84 | 7.9 b | 1.7 b |
| 10′ | 112.60 | 112.84 | 7.3 b | 1.3 b |
] and [ ], respectively.
] and [ ], respectively.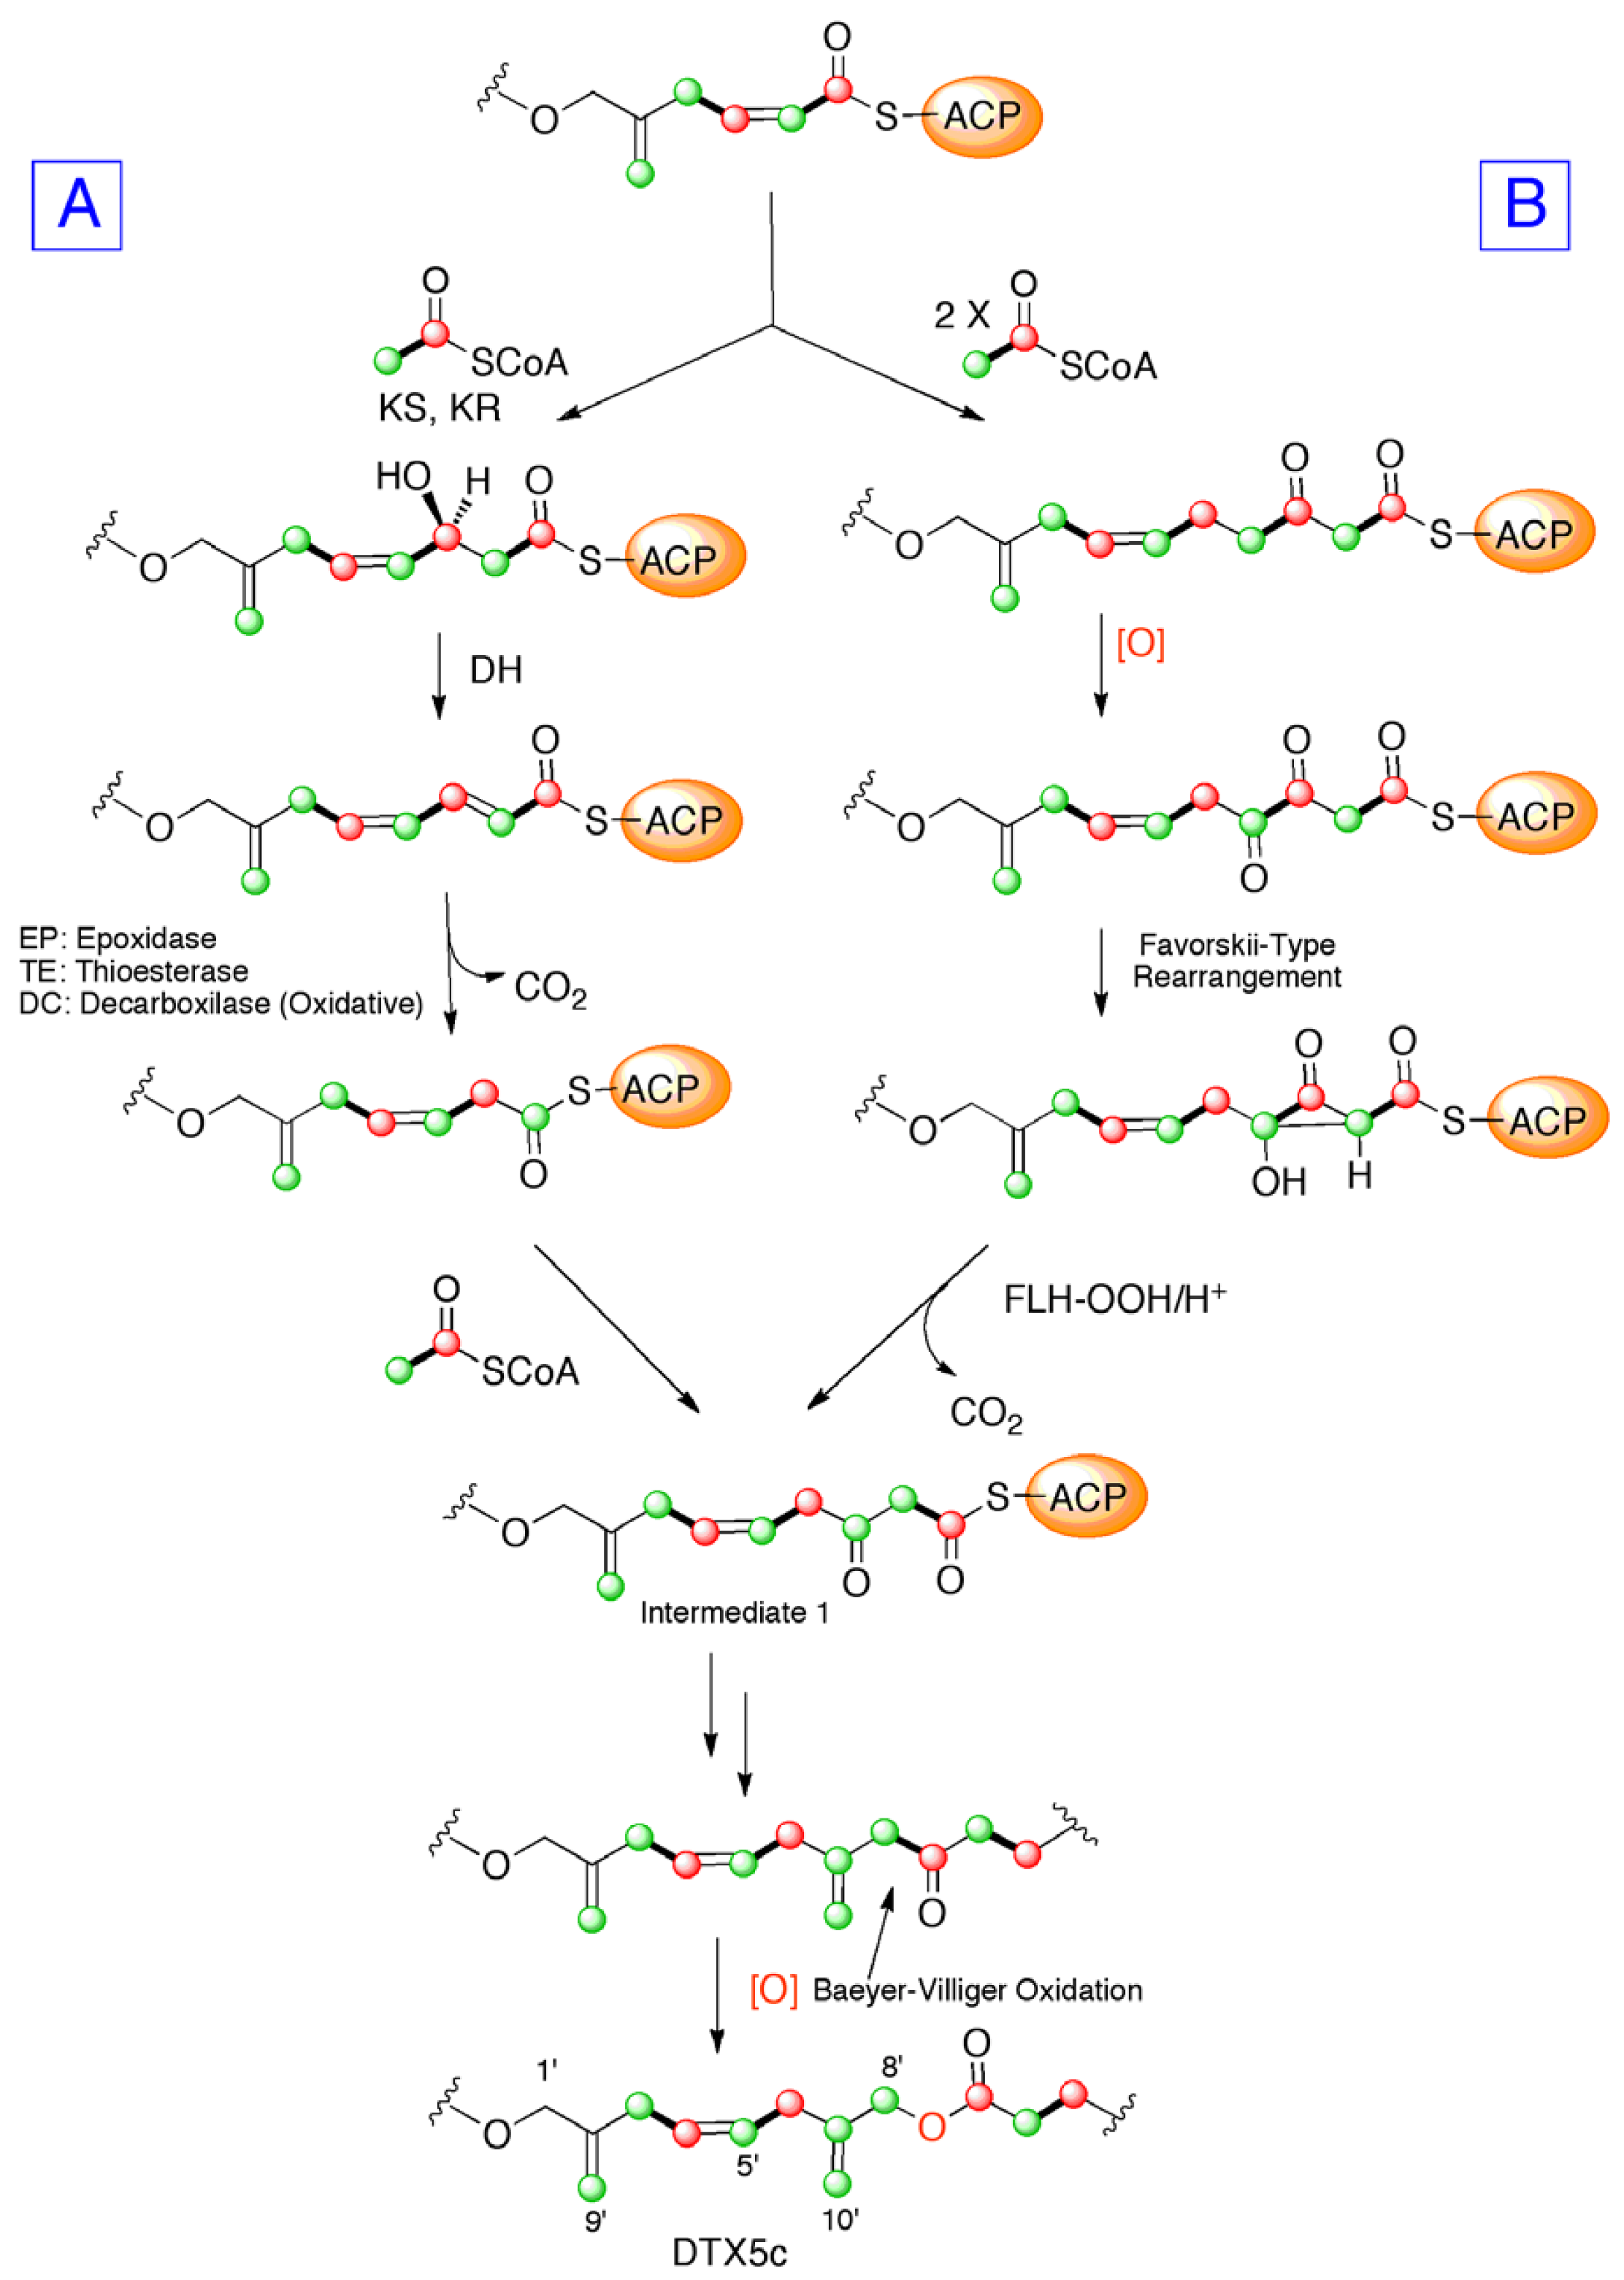
3. Experimental Section
3.1. Instrumentation and General Methods
3.2. Prorocentrum belizeanum Cultures
3.3. Preparation of Prorocentrum belizeanum Isotopic Enriched Cultures
3.4. Extraction and Isolation of DTX5c Labelled Samples
4. Conclusions
Acknowledgments
References
- Aune, T. Risk assessment of marine toxins. In Seafood and Freshwater Toxins, Pharmacology, Physiology and Detection, 2nd; Botana, L.M., Ed.; CRC Press: Boca Raton, Florida, FL, USA, 2008; pp. 3–20. [Google Scholar]
- Fusetani, N.; Kem, W. Marine Toxins: An Overview. In Marine Toxins as Research Tools (Progress in Molecular and Subcellular Biology/Marine Molecular Biotechnology); Fusetani, N., Kem, W., Eds.; Springer-Verlag: Berlin, Germany, 2009; pp. 1–44. [Google Scholar]
- Domínguez, H.J.; Paz, B.; Daranas, A.H.; Norte, M.; Franco, J.M.; Fernández, J.J. Dinoflagellate polyether within the yessotoxin, pectenotoxin and okadaic acid toxin groups: Characterization, analysis and human health implications. Toxicon 2010, 56, 1191–1217. [Google Scholar]
- Bialojan, C.; Takai, A. Inhibitory effect of a marine-sponge toxin, okadaic acid, on protein phosphatases. Biochem. J. 1988, 256, 2283–2290. [Google Scholar]
- Fernández, J.J.; Candenas, M.L.; Souto, M.L.; Trujillo, M.M.; Norte, M. Okadaic acid, useful tools for studying cellular processes. Curr. Med. Chem. 2002, 9, 229–262. [Google Scholar]
- Fujiki, H.; Suganuma, M. Carcinogenic Aspects of Protein Phosphatase 1 and 2A Inhibitors. In Marine Toxins as Research Tools; Fusetani, N., Kem, W., Eds.; Springer-Verlag: Berlin, Germany, 2009; pp. 221–254. [Google Scholar]
- Rein, K.S.; Snyder, R.V. The biosynthesis of polyketide metabolites by dinoflagellates. Adv. Appl. Microbiol. 2006, 59, 93–125. [Google Scholar] [CrossRef]
- Kalaitzis, J.A.; Chau, R.; Kohli, G.S.; Murray, S.A.; Neilan, B.A. Biosynthesis of toxic naturally-occurring seafood contaminants. Toxicon 2010, 56, 244–258. [Google Scholar] [CrossRef]
- Perez, R.; Liu, L.; Lopez, J.; An, T.; Rein, K.S. Diverse bacterial PKS sequences derived from okadaic acid-producing dinoflagellates. Mar. Drugs 2008, 6, 164–179. [Google Scholar] [CrossRef]
- Kellmann, R.; Stüken, A.; Orr, R.J.S.; Svendsen, H.M.; Jakobsen, K.S. Biosynthesis and molecular genetics of polyketides in marine dinoflagellates. Mar. Drugs 2010, 8, 1011–1048. [Google Scholar] [CrossRef]
- Norte, M.; Padilla, A.; Fernández, J.J. Studies on the biosynthesis of the polyether marine toxin dinophysistoxin-1 (DTX1). Tetrahedron Lett. 1994, 35, 1441–1444. [Google Scholar]
- Norte, M.; Padilla, A.; Fernández, J.J.; Souto, M.L. Structural determination and biosynthetic origin of two ester derivatives of okadaic acid isolated from Prorocentrum lima. Tetrahedron 1994, 50, 9175–9180. [Google Scholar] [CrossRef]
- Wright, J.L.C.; Hu, T.; McLachlan, J.L.; Needham, J.; Walter, J.A. Biosynthesis of DTX-4: Confirmation of and polyketide pathway, proof of a Baeyer-Villiger Oxidation step, and evidence for an unusual carbon deletion process. J. Am. Chem. Soc. 1996, 118, 8757–8758. [Google Scholar]
- Macpherson, G.R.; Burton, I.W.; LeBlanc, P.; Walter, J.A.; Wright, J.L.C. Studies of the biosynthesis of DTX5a and DTX5b by the dinoflagellate Prorocentrum maculosum: Regiospecificity of the putative Baeyer-Villigerase and insertion of a single amino acid in a polyketide chain. J. Org. Chem. 2003, 68, 1659–1664. [Google Scholar] [CrossRef]
- Daranas, A.H.; Fernández, J.J.; Norte, M.; Gavin, J.A.; Suarez-Gomez, B.; Souto, M.L. Biosynthetic studies of the DSP toxin skeleton. Chem. Record 2004, 4, 1–9. [Google Scholar] [CrossRef]
- Cruz, P.G.; Daranas, A.H.; Fernández, J.J.; Souto, M.L.; Norte, M. DTX5c, a new OA sulphate ester derivative from cultures of Prorocentrum belizeanum. Toxicon 2006, 47, 920–924. [Google Scholar] [CrossRef]
- Paz, B.; Daranas, A.H.; Cruz, P.G.; Franco, J.M.; Napolitano, J.G.; Norte, M.; Fernández, J.J. Identification and characterization of DTX-5c and 7-hydroxymethyl-2-methylene-octa-4,7-dienyl okadaate from Prorocentrum belizeanum cultures by LC-MS. Toxicon 2007, 50, 470–478. [Google Scholar] [CrossRef]
- Shimizu, Y. Microalgal metabolites. Curr. Opin. Microbiol. 2003, 6, 236–243. [Google Scholar]
- Samples Availability: Available from the authors.
© 2012 by the authors; licensee MDPI, Basel, Switzerland. This article is an open-access article distributed under the terms and conditions of the Creative Commons Attribution license (http://creativecommons.org/licenses/by/3.0/).
Share and Cite
Vilches, T.S.; Norte, M.; Daranas, A.H.; Fernández, J.J. Biosynthetic Studies on Water-Soluble Derivative 5c (DTX5c). Mar. Drugs 2012, 10, 2234-2245. https://doi.org/10.3390/md10102234
Vilches TS, Norte M, Daranas AH, Fernández JJ. Biosynthetic Studies on Water-Soluble Derivative 5c (DTX5c). Marine Drugs. 2012; 10(10):2234-2245. https://doi.org/10.3390/md10102234
Chicago/Turabian StyleVilches, Tamara S., Manuel Norte, Antonio Hernández Daranas, and José J. Fernández. 2012. "Biosynthetic Studies on Water-Soluble Derivative 5c (DTX5c)" Marine Drugs 10, no. 10: 2234-2245. https://doi.org/10.3390/md10102234