
Efficiency Assessment of Bacterial Cellulose on Lowering Lipid Levels In Vitro and Improving Lipid Metabolism In Vivo


Abstract
1. Introduction
2. Materials and Methods
2.1. Materials and Chemicals
2.2. In Vitro Adsorption Properties of BC
2.3. The Effect of BC on the Improvement of Lipid Metabolism in Hyperlipidemia Mice
2.3.1. Establishment of a Hyperlipidemia Mouse Model and Feeding Interventions
2.3.2. Measurement of Blood Lipid Index
2.3.3. Histopathological Observation of Liver Tissue
2.4. Analysis of Intestinal Microflora of Mice
2.4.1. DNA Extraction and Amplification
2.4.2. Illumina Sequencing and Alpha and Beta Diversity Analysis
2.4.3. Processing of Sequencing Data
2.5. Data Processing
3. Results and Discussion
3.1. In Vitro Adsorption Properties of BC
3.1.1. Adsorption of Cholesterol by BC
3.1.2. Adsorption of Sodium Cholate by BC
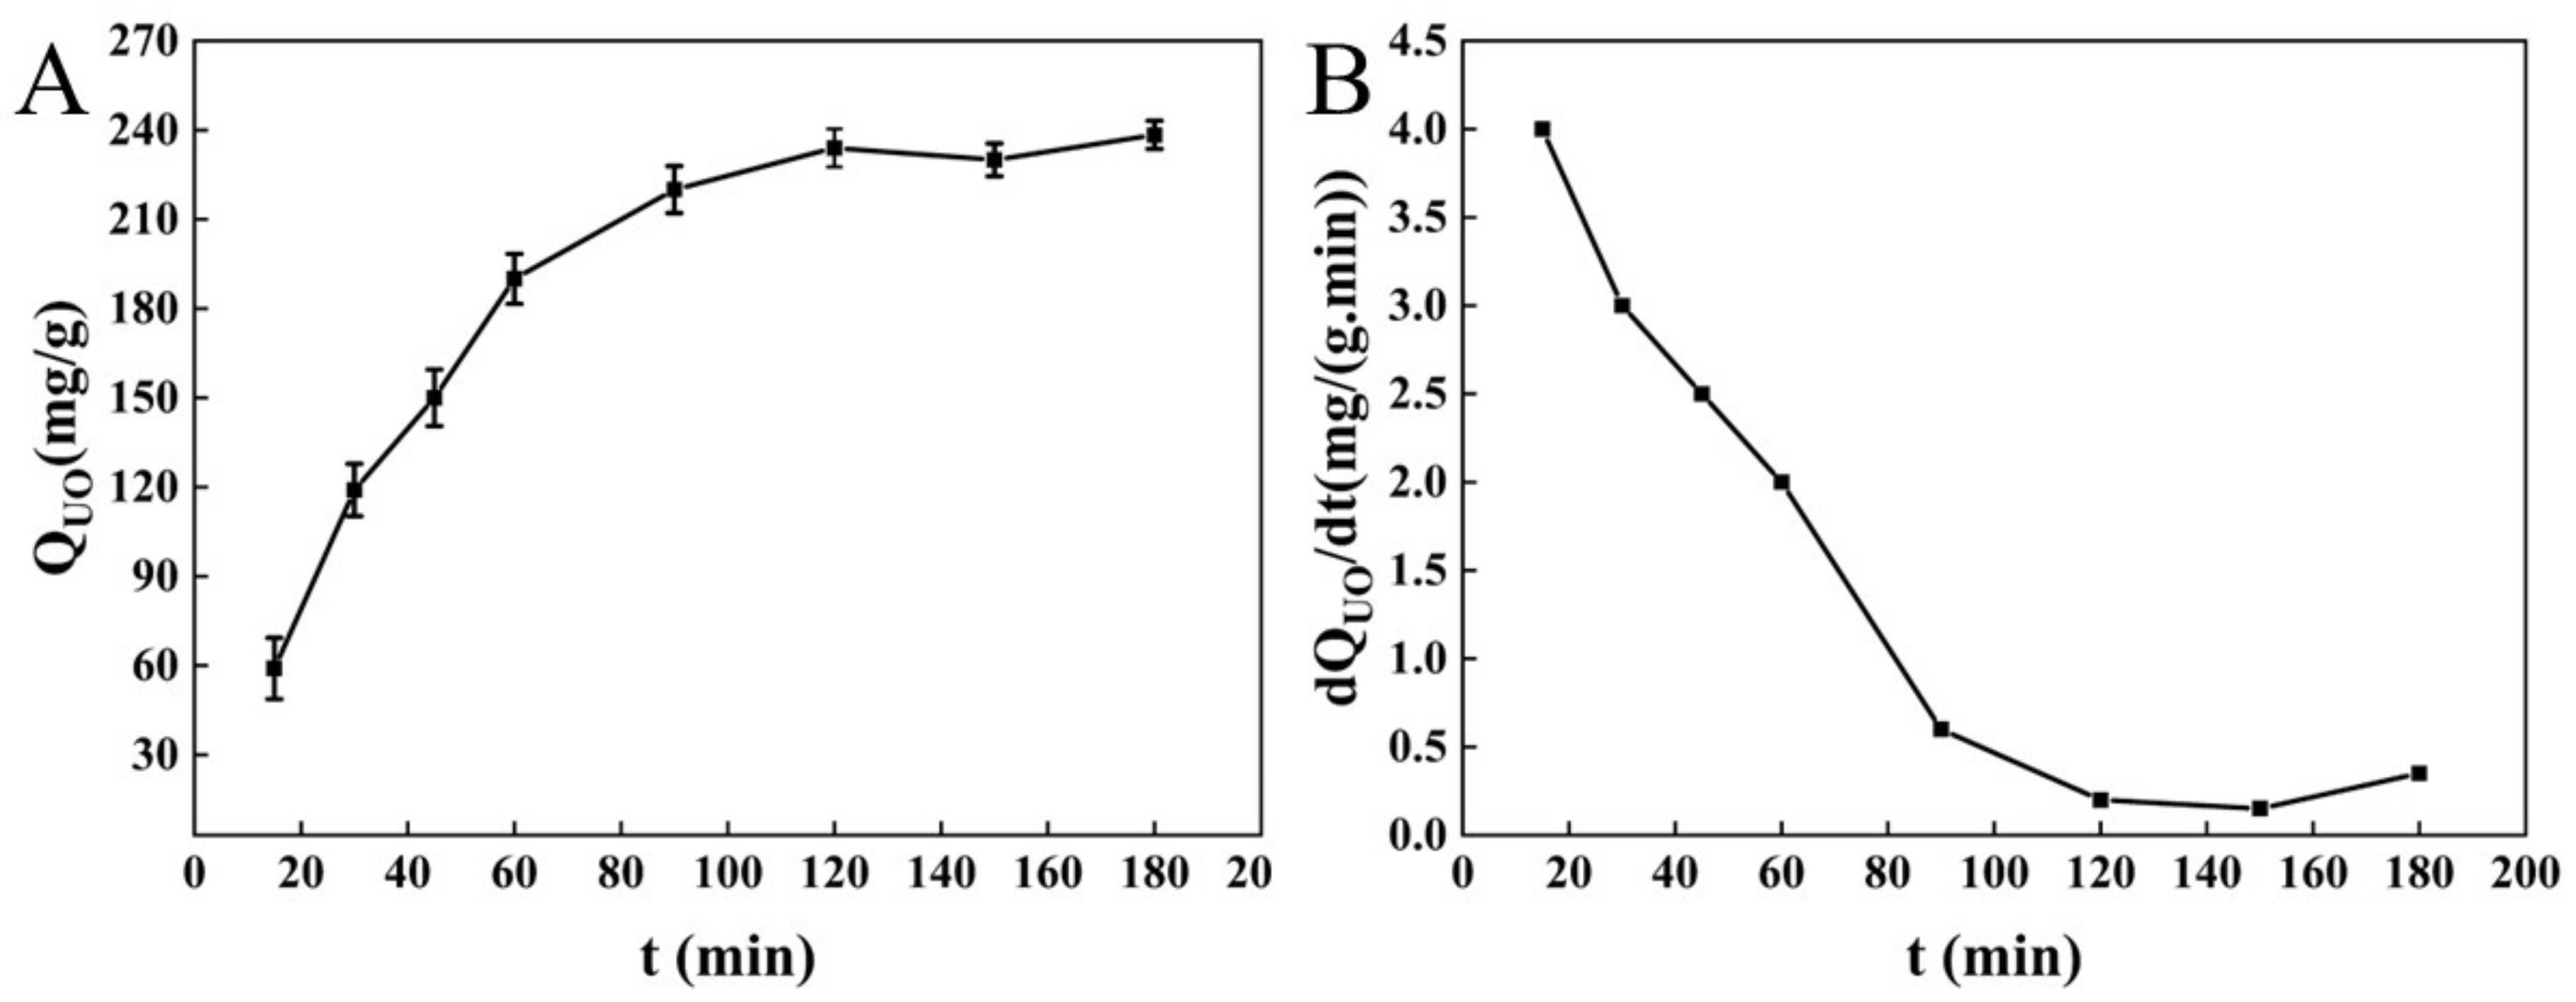
3.1.3. Adsorption of Unsaturated Oil by BC
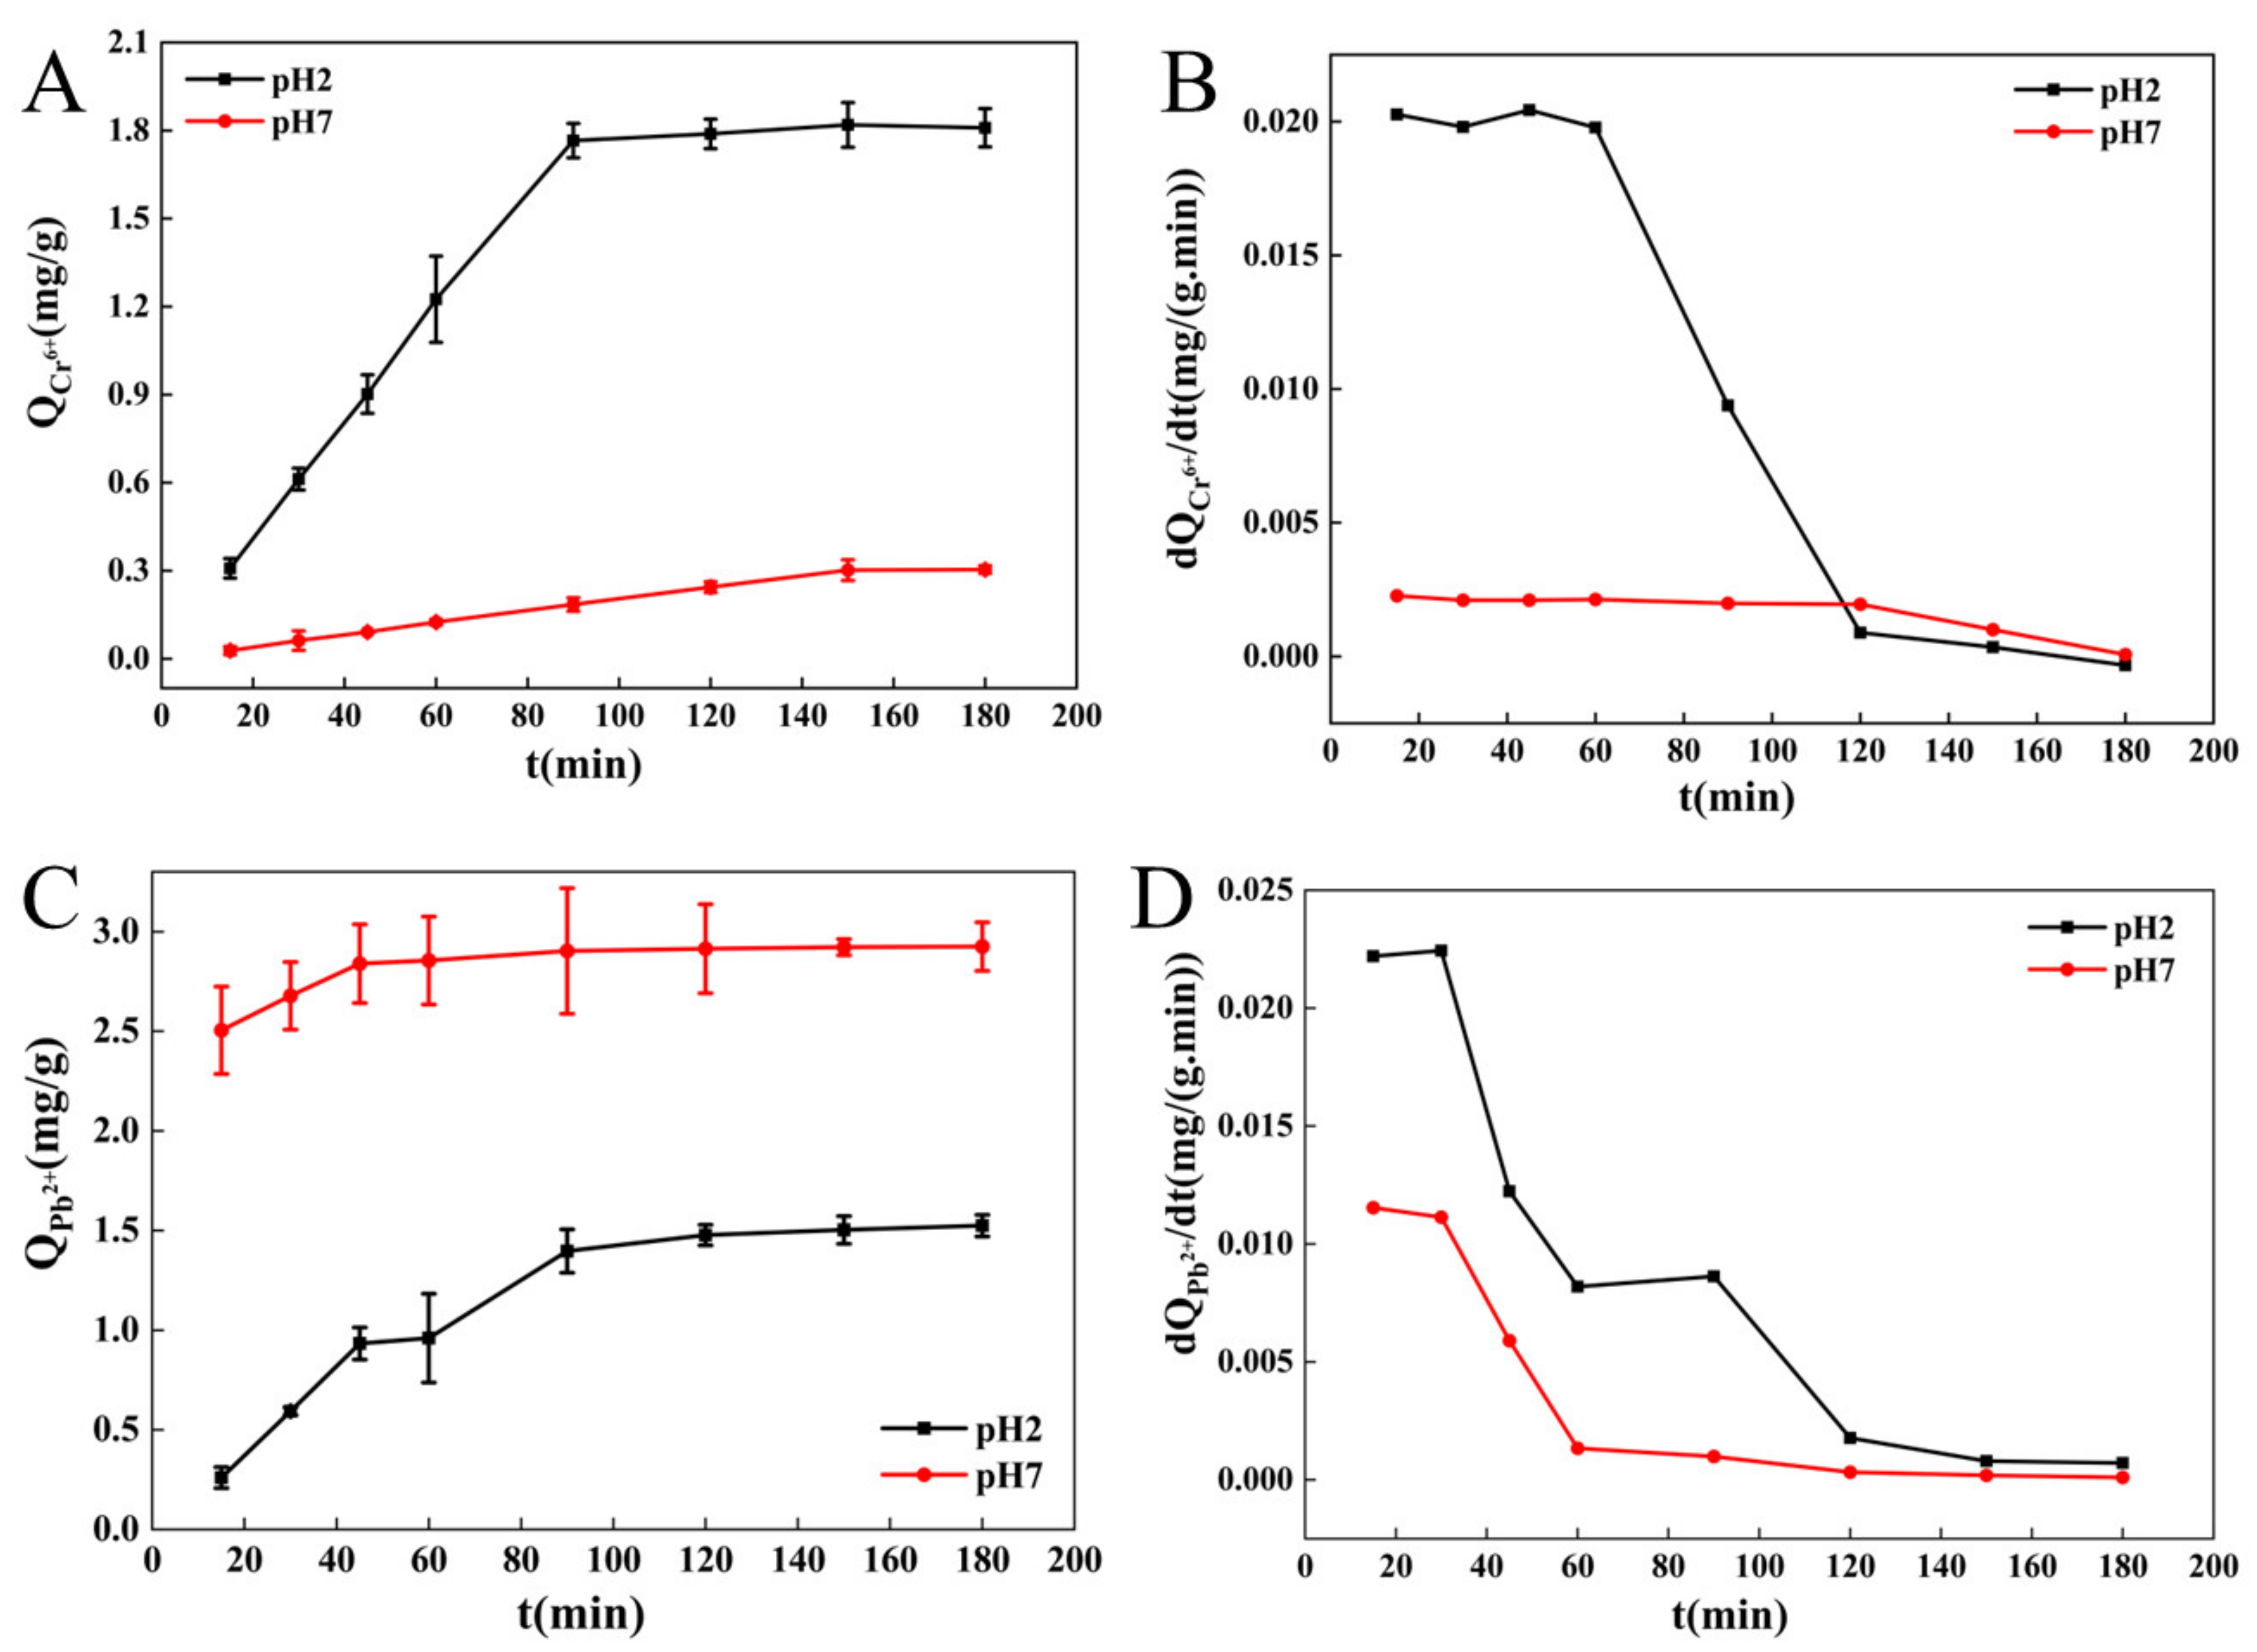
3.1.4. Adsorption of Cr6+and Pb2+ by BC
3.2. Effect of BC on Lipid Metabolism in Hyperlipidemia Mice
3.2.1. In Vivo Lipid-Lowering Effect of BC
3.2.2. Effect of BC on Hepatic Histomorphology
3.2.3. Diversity of Intestinal Microflora
Alpha Diversity and Venn Diagram
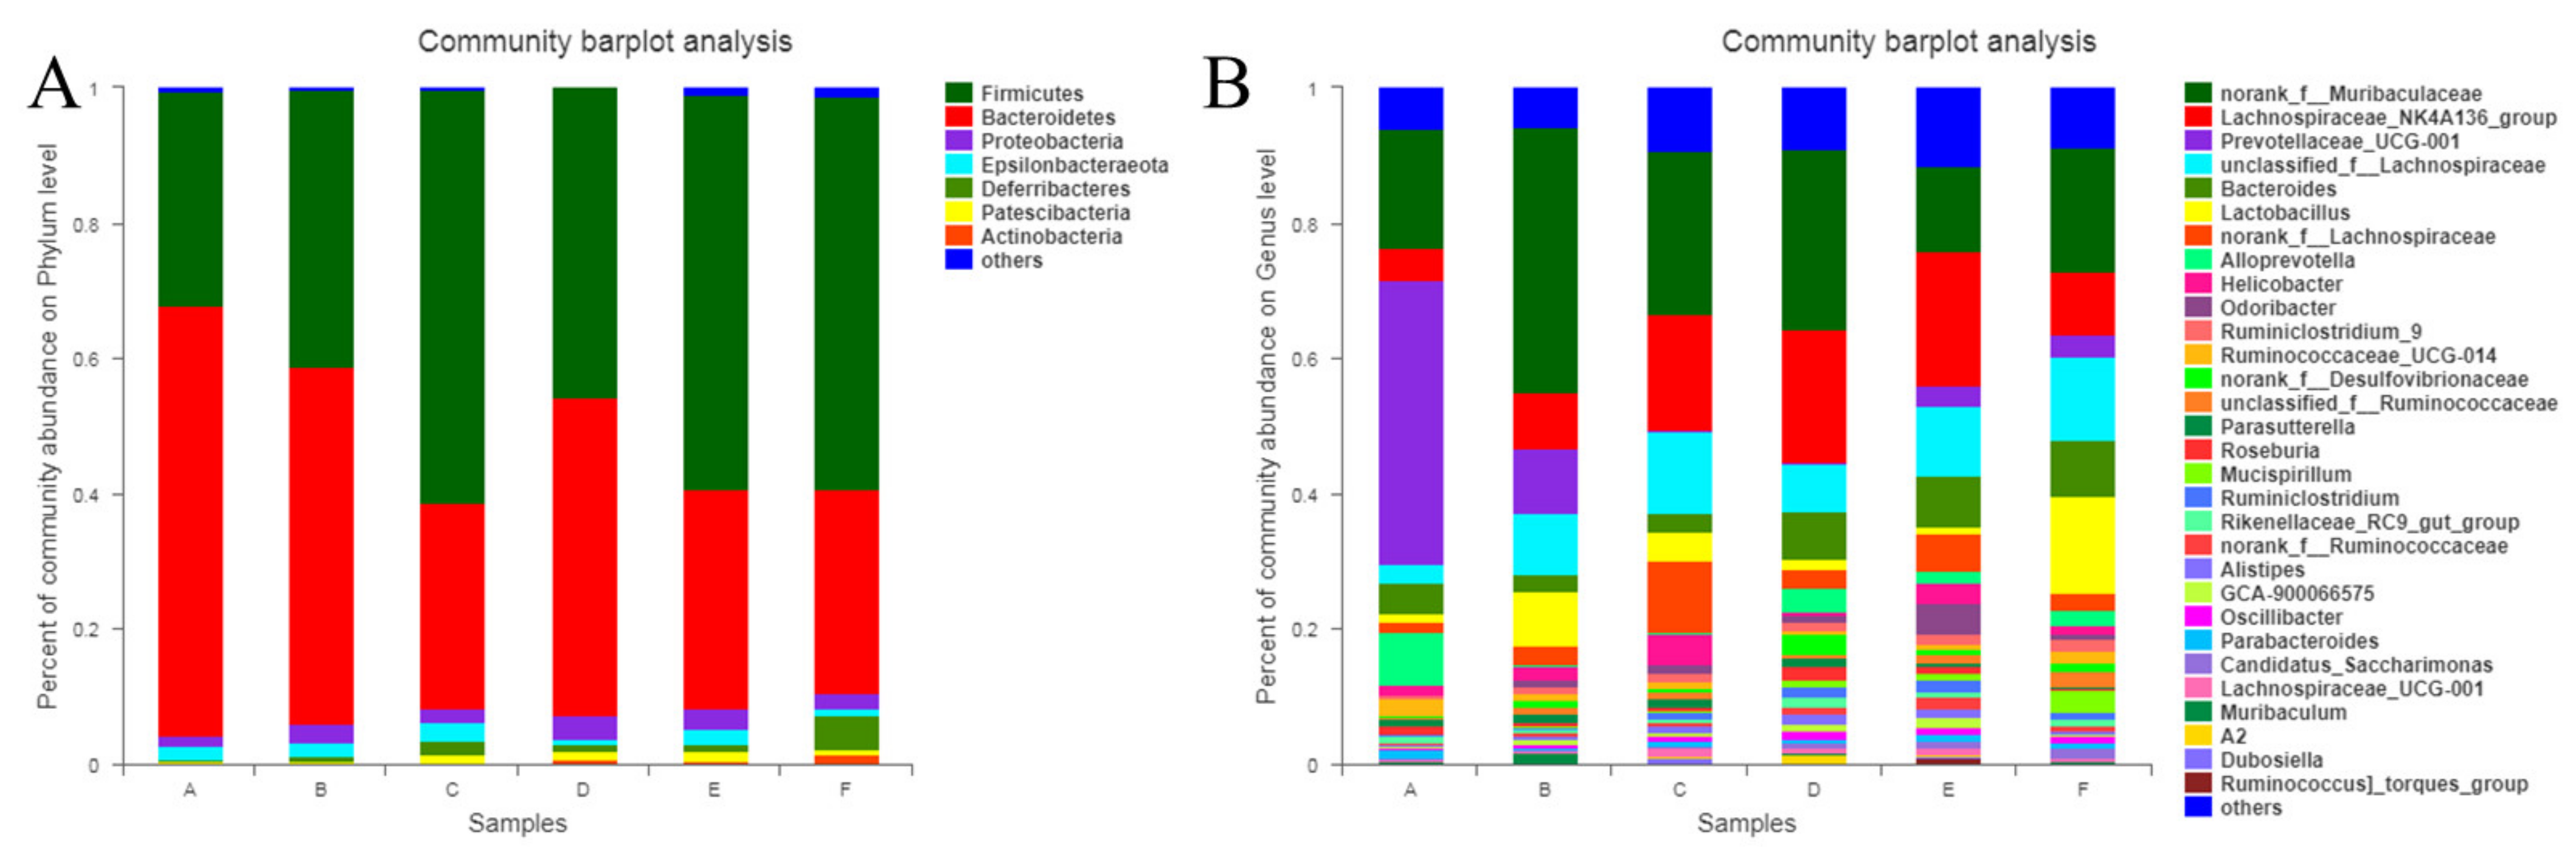
Diversity of Intestinal Microflora
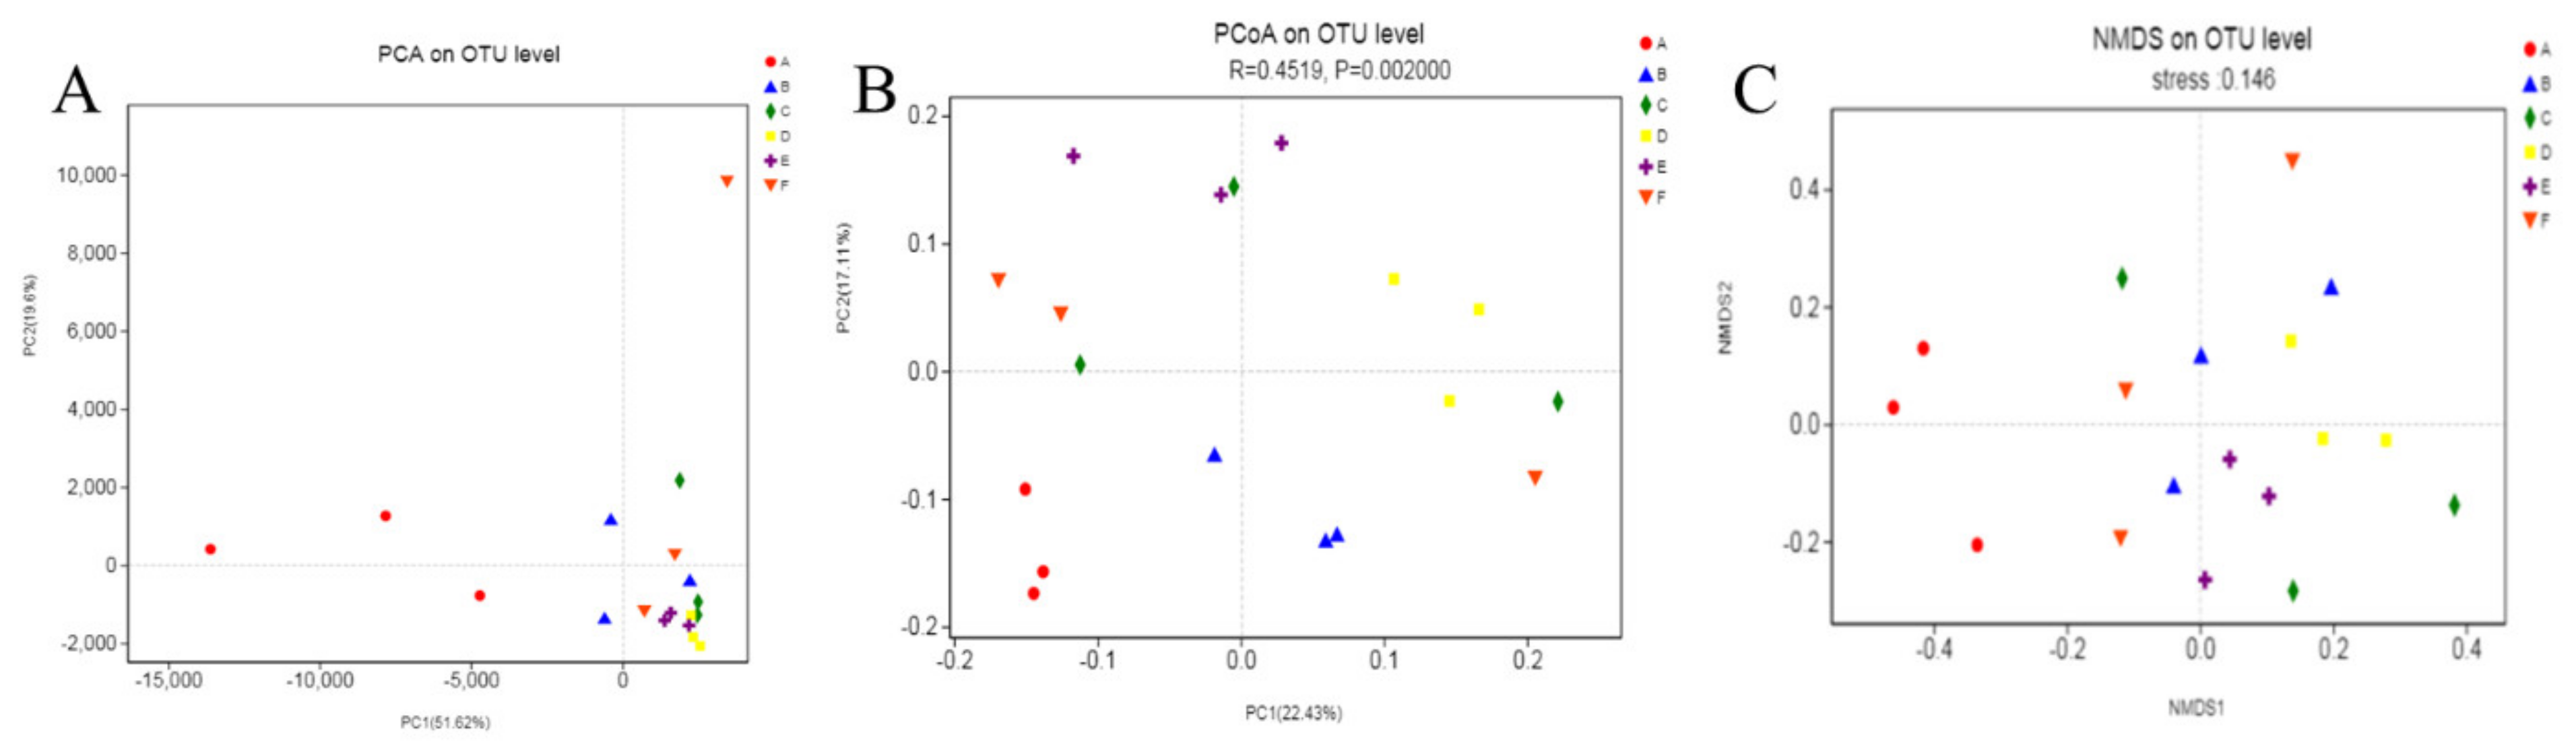
Beta Diversity
4. Conclusions
Author Contributions
Funding
Institutional Review Board Statement
Informed Consent Statement
Data Availability Statement
Conflicts of Interest
References
- Takahashi, H.; Chi, H.Y.; Mohri, S.; Kamakari, K.; Nakata, K.; Ichijo, N.; Nakata, R.; Inoue, H.; Goto, T.; Kawada, T. Rice Koji Extract Enhances Lipid Metabolism through Proliferator-Activated Receptor Alpha (PPARalpha) Activation in Mouse Liver. J. Agric. Food Chem. 2016, 64, 8848–8856. [Google Scholar] [CrossRef] [PubMed]
- Abelson, P.; Kennedy, D. The Obesity Epidemic. Science 2004, 304, 1413. [Google Scholar] [CrossRef] [PubMed]
- Choi, E.-H.; Chun, Y.-S.; Kim, J.; Ku, S.-K.; Jeon, S.; Park, T.-S.; Shim, S.-M. Modulating lipid and glucose metabolism by glycosylated kaempferol rich roasted leaves of Lycium chinense via upregulating adiponectin and AMPK activation in obese mice-induced type 2 diabetes. J. Funct. Foods 2020, 72, 104072. [Google Scholar] [CrossRef]
- Berg, M.C.; Jonsson, I.; Conner, M.T.; Lissner, L. Relation between Breakfast Food Choices and Knowledge of Dietary Fat and Fiber Among Swedish Schoolchildren. J. Adolesc. Health 2002, 31, 199–207. [Google Scholar] [CrossRef]
- Delzenne, N.M.; Olivares, M.; Neyrinck, A.M.; Beaumont, M.; Kjolbaek, L.; Larsen, T.M.; Benitez-Paez, A.; Romani-Perez, M.; Garcia-Campayo, V.; Bosscher, D.; et al. Nutritional interest of dietary fiber and prebiotics in obesity: Lessons from the MyNewGut consortium. Clin. Nutr. 2020, 39, 414–424. [Google Scholar] [CrossRef] [PubMed]
- Elangbam, C.S. REVIEW PAPER Current Strategies in the Development of Anti-obesity Drugs and Their Safety Concerns. Vet. Pathol. 2009, 46, 10–24. [Google Scholar] [CrossRef]
- Dai, B.; Huang, S.; Deng, Y. Modified insoluble dietary fibers in okara affect body composition, serum metabolic properties, and fatty acid profiles in mice fed high-fat diets: An NMR investigation. Food Res. Int. 2019, 116, 1239–1246. [Google Scholar] [CrossRef]
- Kuda, T.; Yokota, Y.; Shikano, A.; Takei, M.; Takahashi, H.; Kimura, B. Dietary and lifestyle disease indices and caecal microbiota in high fat diet, dietary fibre free diet, or DSS induced IBD models in ICR mice. J. Funct. Foods 2017, 35, 605–614. [Google Scholar] [CrossRef]
- Arun, K.B.; Thomas, S.; Reshmitha, T.R.; Akhil, G.C.; Nisha, P. Dietary fibre and phenolic-rich extracts from Musa paradisiaca inflorescence ameliorates type 2 diabetes and associated cardiovascular risks. J. Funct. Foods 2017, 31, 198–207. [Google Scholar] [CrossRef]
- Benítez-Páez, A.; Gómez Del Pulgar, E.M.; Kjølbæk, L.; Brahe, L.K.; Astrup, A.; Larsen, L.; Sanz, Y. Impact of dietary fiber and fat on gut microbiota re-modeling and metabolic health. Trends Food Sci. Technol. 2016, 57, 201–212. [Google Scholar] [CrossRef]
- Leontowicz, M.; Gorinstein, S.; Bartnikowska, E.; Leontowicz, H.; Kulasek, G.; Trakhtenberg, S. Sugar beet pulp and apple pomace dietary fibers improve lipid metabolism in rats fed cholesterol. Food Chem. 2001, 72, 73–78. [Google Scholar] [CrossRef]
- Luo, X.; Wang, Q.; Zheng, B.; Lin, L.; Chen, B.; Zheng, Y.; Xiao, J. Hydration properties and binding capacities of dietary fibers from bamboo shoot shell and its hypolipidemic effects in mice. Food Chem. Toxicol. 2017, 109, 1003–1009. [Google Scholar] [CrossRef] [PubMed]
- Ming-mei, L.; Zhou, Y.; Zuo, L.; Nie, D.; Xiao-an, L. Dietary Fiber Regulates Intestinal Flora and Suppresses Liver and Systemic Inflammation to Alleviate Liver Fibrosis in Mice. Nutrition 2021, 81, 110959. [Google Scholar]
- Medina-Vera, I.; Sanchez-Tapia, M.; Noriega-Lopez, L.; Granados-Portillo, O.; Guevara-Cruz, M.; Flores-Lopez, A.; Avila-Nava, A.; Fernandez, M.L.; Tovar, A.R.; Torres, N. A dietary intervention with functional foods reduces metabolic endotoxaemia and attenuates biochemical abnormalities by modifying faecal microbiota in people with type 2 diabetes. Diabetes Metab. 2019, 45, 122–131. [Google Scholar] [CrossRef]
- Wang, X.; Yang, Z.; Xu, X.; Jiang, H.; Cai, C.; Yu, G. Odd-numbered agaro-oligosaccharides alleviate type 2 diabetes mellitus and related colonic microbiota dysbiosis in mice. Carbohydr. Polym. 2020, 240, 116261. [Google Scholar] [CrossRef]
- Cheng, W.; Lu, J.; Li, B.; Lin, W.; Zhang, Z.; Wei, X.; Sun, C.; Chi, M.; Bi, W.; Yang, B.; et al. Effect of Functional Oligosaccharides and Ordinary Dietary Fiber on Intestinal Microbiota Diversity. Front. Microbiol. 2017, 8, 1750. [Google Scholar] [CrossRef]
- Brockman, D.A.; Chen, X.; Gallaher, D.D. High-viscosity dietary fibers reduce adiposity and decrease hepatic steatosis in rats fed a high-fat diet. J. Nutr. 2014, 144, 1415–1422. [Google Scholar] [CrossRef]
- Huang, S.; He, Y.; Zou, Y.; Liu, Z. Modification of insoluble dietary fibres in soya bean okara and their physicochemical properties. Int. J. Food Sci. Tech. 2015, 50, 2606–2613. [Google Scholar] [CrossRef]
- Zhang, N.; Huang, C.; Ou, S. In vitro binding capacities of three dietary fibers and their mixture for four toxic elements, cholesterol, and bile acid. J. Hazard. Mater. 2011, 186, 236–239. [Google Scholar] [CrossRef]
- Turnbaugh, P.J.; Ridaura, V.K.; Faith, J.J.; Rey, F.E.; Knight, R.; Gordon, J.I. The effect of diet on the human gut microbiome: A metagenomic analysis in humanized gnotobiotic mice. Sci. Transl. Med. 2009, 1, 6ra14. [Google Scholar] [CrossRef]
- Cacicedo, M.L.; Castro, M.C.; Servetas, I.; Bosnea, L.; Boura, K.; Tsafrakidou, P.; Dima, A.; Terpou, A.; Koutinas, A.; Castro, G.R. Progress in bacterial cellulose matrices for biotechnological applications. Bioresour. Technol. 2016, 213, 172–180. [Google Scholar] [CrossRef]
- Liu, Z.; Lin, D.; Lopez-Sanchez, P.; Yang, X. Characterizations of bacterial cellulose nanofibers reinforced edible films based on konjac glucomannan. Int. J. Biol. Macromol. 2018, 145, 634–645. [Google Scholar] [CrossRef] [PubMed]
- Shi, Z.; Zhang, Y.; Phillips, G.O.; Yang, G. Utilization of bacterial cellulose in food. Food Hydrocoll. 2014, 35, 539–545. [Google Scholar] [CrossRef]
- Zhang, W.; Wang, X.-C.; Wang, J.-J.; Zhang, L.-L. Drugs adsorption and release behavior of collagen/bacterial cellulose porous microspheres. Int. J. Biol. Macromol. 2019, 140, 196–205. [Google Scholar] [CrossRef] [PubMed]
- Zhu, H.; Jia, S.; Yang, H.; Jia, Y.; Yan, L.; Li, J. Preparation and Application of Bacterial Cellulose Sphere: A Novel Biomaterial. Biotechnol. Biotechnol. Equip. 2014, 25, 2233–2236. [Google Scholar] [CrossRef]
- Rezaee, A.; Asadikaram, G.; Mirzai, M.; Naimi, N.; Dargahi, R.; Sadegi, A. Removal of Arsenic Using Acetobacter xylinum Cellulose. J. Biol. Sci. 2008, 8, 209–212. [Google Scholar]
- Xu, X.; Chen, X.; Yang, L.; Zhao, Y.; Zhang, X.; Shen, R.; Sun, D.; Qian, J. Film-like bacterial cellulose based molecularly imprinted materials for highly efficient recognition and adsorption of cresol isomers. Chem. Eng. J. 2020, 382, 123007. [Google Scholar] [CrossRef]
- Zhou, H.; Sun, D.-P.; Zhu, C.-L.; Xu, C.-Y. Study on the Adsorption of Noxious Substances in Human Body by Bacterial Cellulose. J. Cellul. Sci. Technol. 2009, 17, 41–46. [Google Scholar]
- Mesomya, W.; Cuptapun, Y.; Hengsawadi, D.; Tangkanakul, P.; Jittanoonta, P.; Pakpeankitvatana, R. Serum lipid-lowering in rats fed with high dietary fiber from cereal and nata de coco. Witthayasan Kasetsat 2002, 36, 189–197. [Google Scholar]
- Lin, K.W.; Lin, H.Y. Quality Characteristics of Chinese-style Meatball Containing Bacterial Cellulose (Nata). J. Food Sci. 2004, 69, 107–111. [Google Scholar] [CrossRef]
- Hu, Y.-B.; Wang, Z.; Xu, S.-Y. Treatment of corn bran dietary fiber with xylanase increases its ability to bind bile salts, in vitro. Food Chem. 2008, 106, 113–121. [Google Scholar] [CrossRef]
- Deng, Z.-H.; Hui-hua, H. Bile Salt-binding Capacity and Lipid-lowering Mechanisms of Water Extracts from Fresh Tea Leaves and Tea Flowers. Food Sci. 2011, 19, 96–99. (In Chinese) [Google Scholar]
- Hu, Y.; Ren, L.; Sun, G.; Zhang, L.; Li, J.; Huang, H. Establishment and application of a rapid microbial intracellular lipid determination method based on colorimetric microplate format. China Oils Fats 2013, 38, 89–94. (In Chinese) [Google Scholar]
- Hsu, P.-K.; Chien, P.-J.; Chen, C.-H.; Chau, C.-F. Carrot insoluble fiber-rich fraction lowers lipid and cholesterol absorption in hamsters. LWT 2006, 39, 338–343. [Google Scholar] [CrossRef]
- Yeung, C.K.; Wang, G.; Yao, Y.; Liang, J.; Tenny Chung, C.Y.; Chuai, M.; Lee, K.K.; Yang, X. BRE modulates granulosa cell death to affect ovarian follicle development and atresia in the mouse. Cell Death Dis. 2017, 8, e2697. [Google Scholar] [CrossRef] [PubMed]
- Shen, M.; Weihao, W.; Cao, L. Soluble dietary fibers from black soybean hulls: Physical and enzymatic modification, structure, physical properties, and cholesterol binding capacity. J. Food Sci. 2020, 85, 1668–1674. [Google Scholar] [CrossRef]
- Song, Y.; Su, W.; Mu, Y.C. Modification of bamboo shoot dietary fiber by extrusion-cellulase technology and its properties. Int. J. Food Prop. 2018, 21, 1219–1232. [Google Scholar] [CrossRef]
- Hua, M.; Lu, J.; Qu, D.; Liu, C.; Zhang, L.; Li, S.; Chen, J.; Sun, Y. Structure, physicochemical properties and adsorption function of insoluble dietary fiber from ginseng residue: A potential functional ingredient. Food Chem. 2019, 286, 522–529. [Google Scholar] [CrossRef]
- Zhu, Y.; Chu, J.; Lu, Z.; Lv, F.; Bie, X.; Zhang, C.; Zhao, H. Physicochemical and functional properties of dietary fiber from foxtail millet (Setaria italic) bran. J. Cereal Sci. 2018, 79, 456–461. [Google Scholar] [CrossRef]
- Sieminska-Kuczer, A.; Szymanska-Chargot, M.; Zdunek, A. Recent advances in interactions between polyphenols and plant cell wall polysaccharides as studied using an adsorption technique. Food Chem. 2022, 373, 131487. [Google Scholar] [CrossRef]
- Wang, C.; Song, R.; Wei, S.; Wang, W.; Li, F.; Tang, X.; Li, N. Modification of insoluble dietary fiber from ginger residue through enzymatic treatments to improve its bioactive properties. LWT 2020, 125, 109220. [Google Scholar] [CrossRef]
- Zhao, G.; Zhang, R.; Dong, L.; Liu, L.; Zhang, M. Research progress on insoluble dietary fiber in regulating lipid metabolism. J. Chin. Inst. Food Sci. Technol. 2021, 21, 319–328. [Google Scholar]
- Hu, G.; Huang, S.; Chen, H.; Wang, F. Binding of four heavy metals to hemicelluloses from rice bran. Food Res. Int. 2010, 43, 203–206. [Google Scholar] [CrossRef]
- Zhang, W.; Wang, X.-C.; Li, X.-Y.; Zhang, L.-L.; Jiang, F. A 3D porous microsphere with multistage structure and component based on bacterial cellulose and collagen for bone tissue engineering. Carbohydr. Polym. 2020, 236, 116043. [Google Scholar] [CrossRef]
- Raman, M.; Ambalam, P.; Doble, M. Preventive and Therapeutic Effects of Dietary Fibers Against Cardiovascular Diseases. In Food Quality: Balancing Health and Disease; Academic Press: London, UK, 2018; pp. 365–393. [Google Scholar]
- Zhang, X.-H.; Yao, J.; Qin, D.-M. Protective effects of Cichorium glandulosum Boiss extracts against liver fibrosis in mice. World Chin. J. Digestol. 2020, 28, 86–91. [Google Scholar] [CrossRef]
- Wang, H.; Hong, T.; Li, N.; Zang, B.; Wu, X. Soluble dietary fiber improves energy homeostasis in obese mice by remodeling the gut microbiota. Biochem. Biophys. Res. Commun. 2018, 498, 146–151. [Google Scholar] [CrossRef]
- Li, D.; Wang, P.; Wang, P.; Hu, X.; Chen, F. Gut microbiota promotes production of aromatic metabolites through degradation of barley leaf fiber. J. Nutr. Biochem. 2018, 58, 49–58. [Google Scholar] [CrossRef]
- Li, F.; Liu, J.; Liu, X.; Wang, Y.; Gao, X.; Meng, X.; Tu, G. High Performance Soluble Polyimides from Ladder-Type Fluorinated Dianhydride with Polymorphism. Polymers 2018, 10, 546. [Google Scholar] [CrossRef]
- Ramette, A. Multivariate analyses in microbial ecology. FEMS Microbiol. Ecol. 2007, 62, 142–160. [Google Scholar] [CrossRef]
- Wu, W.; Hu, J.; Gao, H.; Chen, H.; Fang, X.; Mu, H.; Han, Y.; Liu, R. The potential cholesterol-lowering and prebiotic effects of bamboo shoot dietary fibers and their structural characteristics. Food Chem. 2020, 332, 127372. [Google Scholar] [CrossRef]
- Liu, T.; Wang, N.; Xu, X.; Wang, D. Effect of high quality dietary fiber of Hericium erinaceus on lowering blood lipid in hyperlipidemia mice. J. Future Foods 2022, 2, 61–68. [Google Scholar] [CrossRef]
- Li, M.; Liu, Y.; Yang, G.; Sun, L.; Song, X.; Chen, Q.; Bao, Y.; Luo, T.; Wang, J. Microstructure, physicochemical properties, and adsorption capacity of deoiled red raspberry pomace and its total dietary fiber. LWT 2022, 153, 112478. [Google Scholar] [CrossRef]


| System | BC/g | pH | Egg Yolk Emulsion/mL | Sodium Cholate/g | NaCl/g | Soybean Oil/mL | K2Cr2O7/mg | Pb(NO3)2/mg | Water/mL |
|---|---|---|---|---|---|---|---|---|---|
| Cholesterol adsorption system | 2.0 | 2.0 | 10 | - | - | - | - | - | 90 |
| 7.0 | |||||||||
| Sodium cholate adsorption system | 2.0 | 7.0 | - | 0.3 | 0.877 | - | - | - | 100 |
| Unsaturated oil adsorption system | 0.8 | 7.0 | - | - | - | 100 | - | - | - |
| Cr6+ adsorption system | 0.08 | 2.0 | - | - | - | 0.4 | - | 100 | |
| 7.0 | - | ||||||||
| Pb2+ adsorption system | 0.08 | 2.0 | - | - | - | - | - | 0.4 | 100 |
| 7.0 |
Publisher’s Note: MDPI stays neutral with regard to jurisdictional claims in published maps and institutional affiliations. |
© 2022 by the authors. Licensee MDPI, Basel, Switzerland. This article is an open access article distributed under the terms and conditions of the Creative Commons Attribution (CC BY) license (https://creativecommons.org/licenses/by/4.0/).
Share and Cite
Zhang, W.; Zhang, Q.-Y.; Wang, J.-J.; Zhang, L.-L.; Dong, Z.-Z. Efficiency Assessment of Bacterial Cellulose on Lowering Lipid Levels In Vitro and Improving Lipid Metabolism In Vivo. Molecules 2022, 27, 3495. https://doi.org/10.3390/molecules27113495
Zhang W, Zhang Q-Y, Wang J-J, Zhang L-L, Dong Z-Z. Efficiency Assessment of Bacterial Cellulose on Lowering Lipid Levels In Vitro and Improving Lipid Metabolism In Vivo. Molecules. 2022; 27(11):3495. https://doi.org/10.3390/molecules27113495
Chicago/Turabian StyleZhang, Wen, Qian-Yu Zhang, Jian-Jun Wang, Le-Le Zhang, and Zhen-Zhen Dong. 2022. "Efficiency Assessment of Bacterial Cellulose on Lowering Lipid Levels In Vitro and Improving Lipid Metabolism In Vivo" Molecules 27, no. 11: 3495. https://doi.org/10.3390/molecules27113495
APA StyleZhang, W., Zhang, Q.-Y., Wang, J.-J., Zhang, L.-L., & Dong, Z.-Z. (2022). Efficiency Assessment of Bacterial Cellulose on Lowering Lipid Levels In Vitro and Improving Lipid Metabolism In Vivo. Molecules, 27(11), 3495. https://doi.org/10.3390/molecules27113495