Article

Web Applications for Teaching the Respiratory System: Content Validation

by
Susana Mejía
1,
Isabel Cristina Muñoz
1,
Leidy Yanet Serna
2,
Carlos Andrés Sarmiento
1,
Carlos Leonardo Bravo
1 and
Alher Mauricio Hernández
1,*
1
Bioinstrumentation and Clinical Engineering Research Group—GIBIC, Bioengineering Department, Engineering Faculty, Universidad de Antioquia UdeA, Calle 70 No. 52-21, Medellín 050010, Colombia
2
Department of Automatic Control and the Biomedical Engineering Research Centre of the Universitat Politècnica de Catalunya (CIBER-BBN), 08028 Barcelona, Spain
*
Author to whom correspondence should be addressed.
Appl. Sci. 2022, 12(9), 4289; https://doi.org/10.3390/app12094289
Submission received: 27 February 2022 / Revised: 13 April 2022 / Accepted: 15 April 2022 / Published: 24 April 2022
(This article belongs to the Special Issue Technologies and Environments of Intelligent Education)

Abstract

:
The subject of respiratory mechanics has complex characteristics, functions, and interactions that can be difficult to understand in training and medical education contexts. As such, education strategies based on computational simulations comprise useful tools, but their application in the medical area requires stricter validation processes. This paper shows a statistical and a Delphi validation for two modules of a web application used for respiratory system learning: (I) “Anatomy and Physiology” and (II) “Work of Breathing Indexes”. For statistical validation, population and individual analyses were made using a database of healthy men to compare experimental and model-predicted data. For both modules, the predicted values followed the trend marked by the experimental data in the population analysis, while in the individual analysis, the predicted errors were 9.54% and 25.38% for maximal tidal volume and airflow, respectively, and 6.55%, 9.33%, and 11.77% for rapid shallow breathing index, work of breathing, and maximal inspiratory pressure, respectively. For the Delphi validation, an average higher than 4 was obtained after health professionals evaluated both modules from 1 to 5. In conclusion, both modules are good tools for respiratory system learning processes. The studied parameters behaved consistently with the expressions that describe ventilatory dynamics and were correlated with experimental data; furthermore, they had great acceptance by specialists.

1. Introduction

The respiratory system can be described in terms of mechanical properties, including airway resistance (Raw), elastic recoil forces of the lungs, and chest wall compliance (CL and Ccw, respectively). During ventilation, respiratory muscles contract, stretching the chest wall’s elastic tissues and the lungs to displace inelastic tissues and move air towards the airways [1]. Changes in these mechanical properties can make breathing difficult. Therefore, diseases that either reduce the compliance or increase the resistance of the respiratory system, or both, such as restrictive diseases (e.g., pulmonary edema and pneumonia) and obstructive diseases (e.g., asthma and chronic bronchitis), increase the work of breathing in response to changes in mechanical properties and increments of metabolic requirements [2].
Mechanical ventilation (MV) is usually used when respiratory dysfunction produces abnormalities in gas exchange or when the work of breathing is increased [3]. During MV, the effort exerted by respiratory muscles is determined by the patient’s ventilatory mechanics and mechanical ventilator settings, which, in spontaneous ventilation, is mainly defined by parameters such as positive pressure at the end of expiration (PEEP) and pressure support (PS). A proper configuration of the mechanical ventilator allows for decreasing the work of breathing and does not generate an unnecessary burden on the patient [4].
Some ventilation indexes have been proposed to assess the effect of MV. Three of them are widely used, owing to their ease of application in daily clinical practice: the work of breathing (WOB) index, which describes the energy required to achieve ventilation [5]; rapid shallow breathing index (RSBI), proposed by Yang and Tobin in [6] to quantify the degree of shallow breathing, defined as the ratio of respiratory frequency (RR) to tidal volume (VT); and maximal inspiratory pressure (PImax), described as a measure of the strength of inspiratory muscles, primarily the diaphragm, which allows for the assessment of ventilatory failure, restrictive lung disease, and respiratory muscle strength [7].
Maintaining airflow within the pulmonary airways requires a pressure gradient that falls along the direction of flow, the magnitude of which is determined by the flow rate, the frictional resistance to flow, and the elastic recoil of the lungs and the chest wall; the respiratory muscles must overcome those loads for ventilation [8,9]. In fact, like any other mechanism involving fluid dynamics, the respiratory system responds according to thermodynamics and fluid mechanics laws [10], including the equation of air motion. This expression relates the pressure in the system to the different values of volume and airflow as a function of time and the system’s mechanical characteristics (elastance and resistance), so all the respiratory mechanics can be described [11].
Due to the relationship between the dynamics of the respiratory system and classical physics, understanding respiratory behavior may be challenging for some regular students. Moreover, there are medical, scientific, and educational interests to promote medical students’ training in the interaction of mechanical properties in the ventilatory process to determine an accurate and effective treatment with timely diagnostics for some respiratory pathologies.
Some studies [12,13] highlight the advantages of implementing communication and information technologies in the teaching–learning process. For medical training, students approve in silico didactic strategies that facilitate their learning through intuitive and interactive tools.
Simulators and web apps based on mathematical models are the most common strategy currently used by medical schools, so a validation must be made to certify the data output’s accuracy. Sargent [14] defines a model as valid for a set of experimental conditions if the model’s accuracy is within its acceptable range of accuracy, which is the required model accuracy for its intended purpose. According to Hillston [15], there are three approaches to model validation, and any combination of them may be applied according to the characteristics of the system: expert intuition, or how carefully the model inspects the output and its behavior; real system measurements, where a comparison with a real system can be made; and theoretical analysis, to prove if operational laws coincide with the model’s outputs.
However, many of the models and simulators that have been developed for the study of the respiratory system [16,17,18] do not expose a validation that demonstrates the accuracy and precision of the involved systems, hampering their credibility.
This article presents the validation of the modules “Anatomy and Physiology” and “Work of Breathing Indexes” from a web application for teaching the respiratory system (https://healthsimlab.com/, accessed on 19 April 2020). The validation has been carried out based on information collected in databases (DB) of healthy subjects under changes in their respiratory mechanics properties. According to experts, the application has also been validated on a systematic examination of conceptual abstractions by observation and measurement of responses. In addition to providing valuable information about the respiratory system, the modules promote students’ self learning and facilitates their approach to abstract topics.

2. Materials and Methods

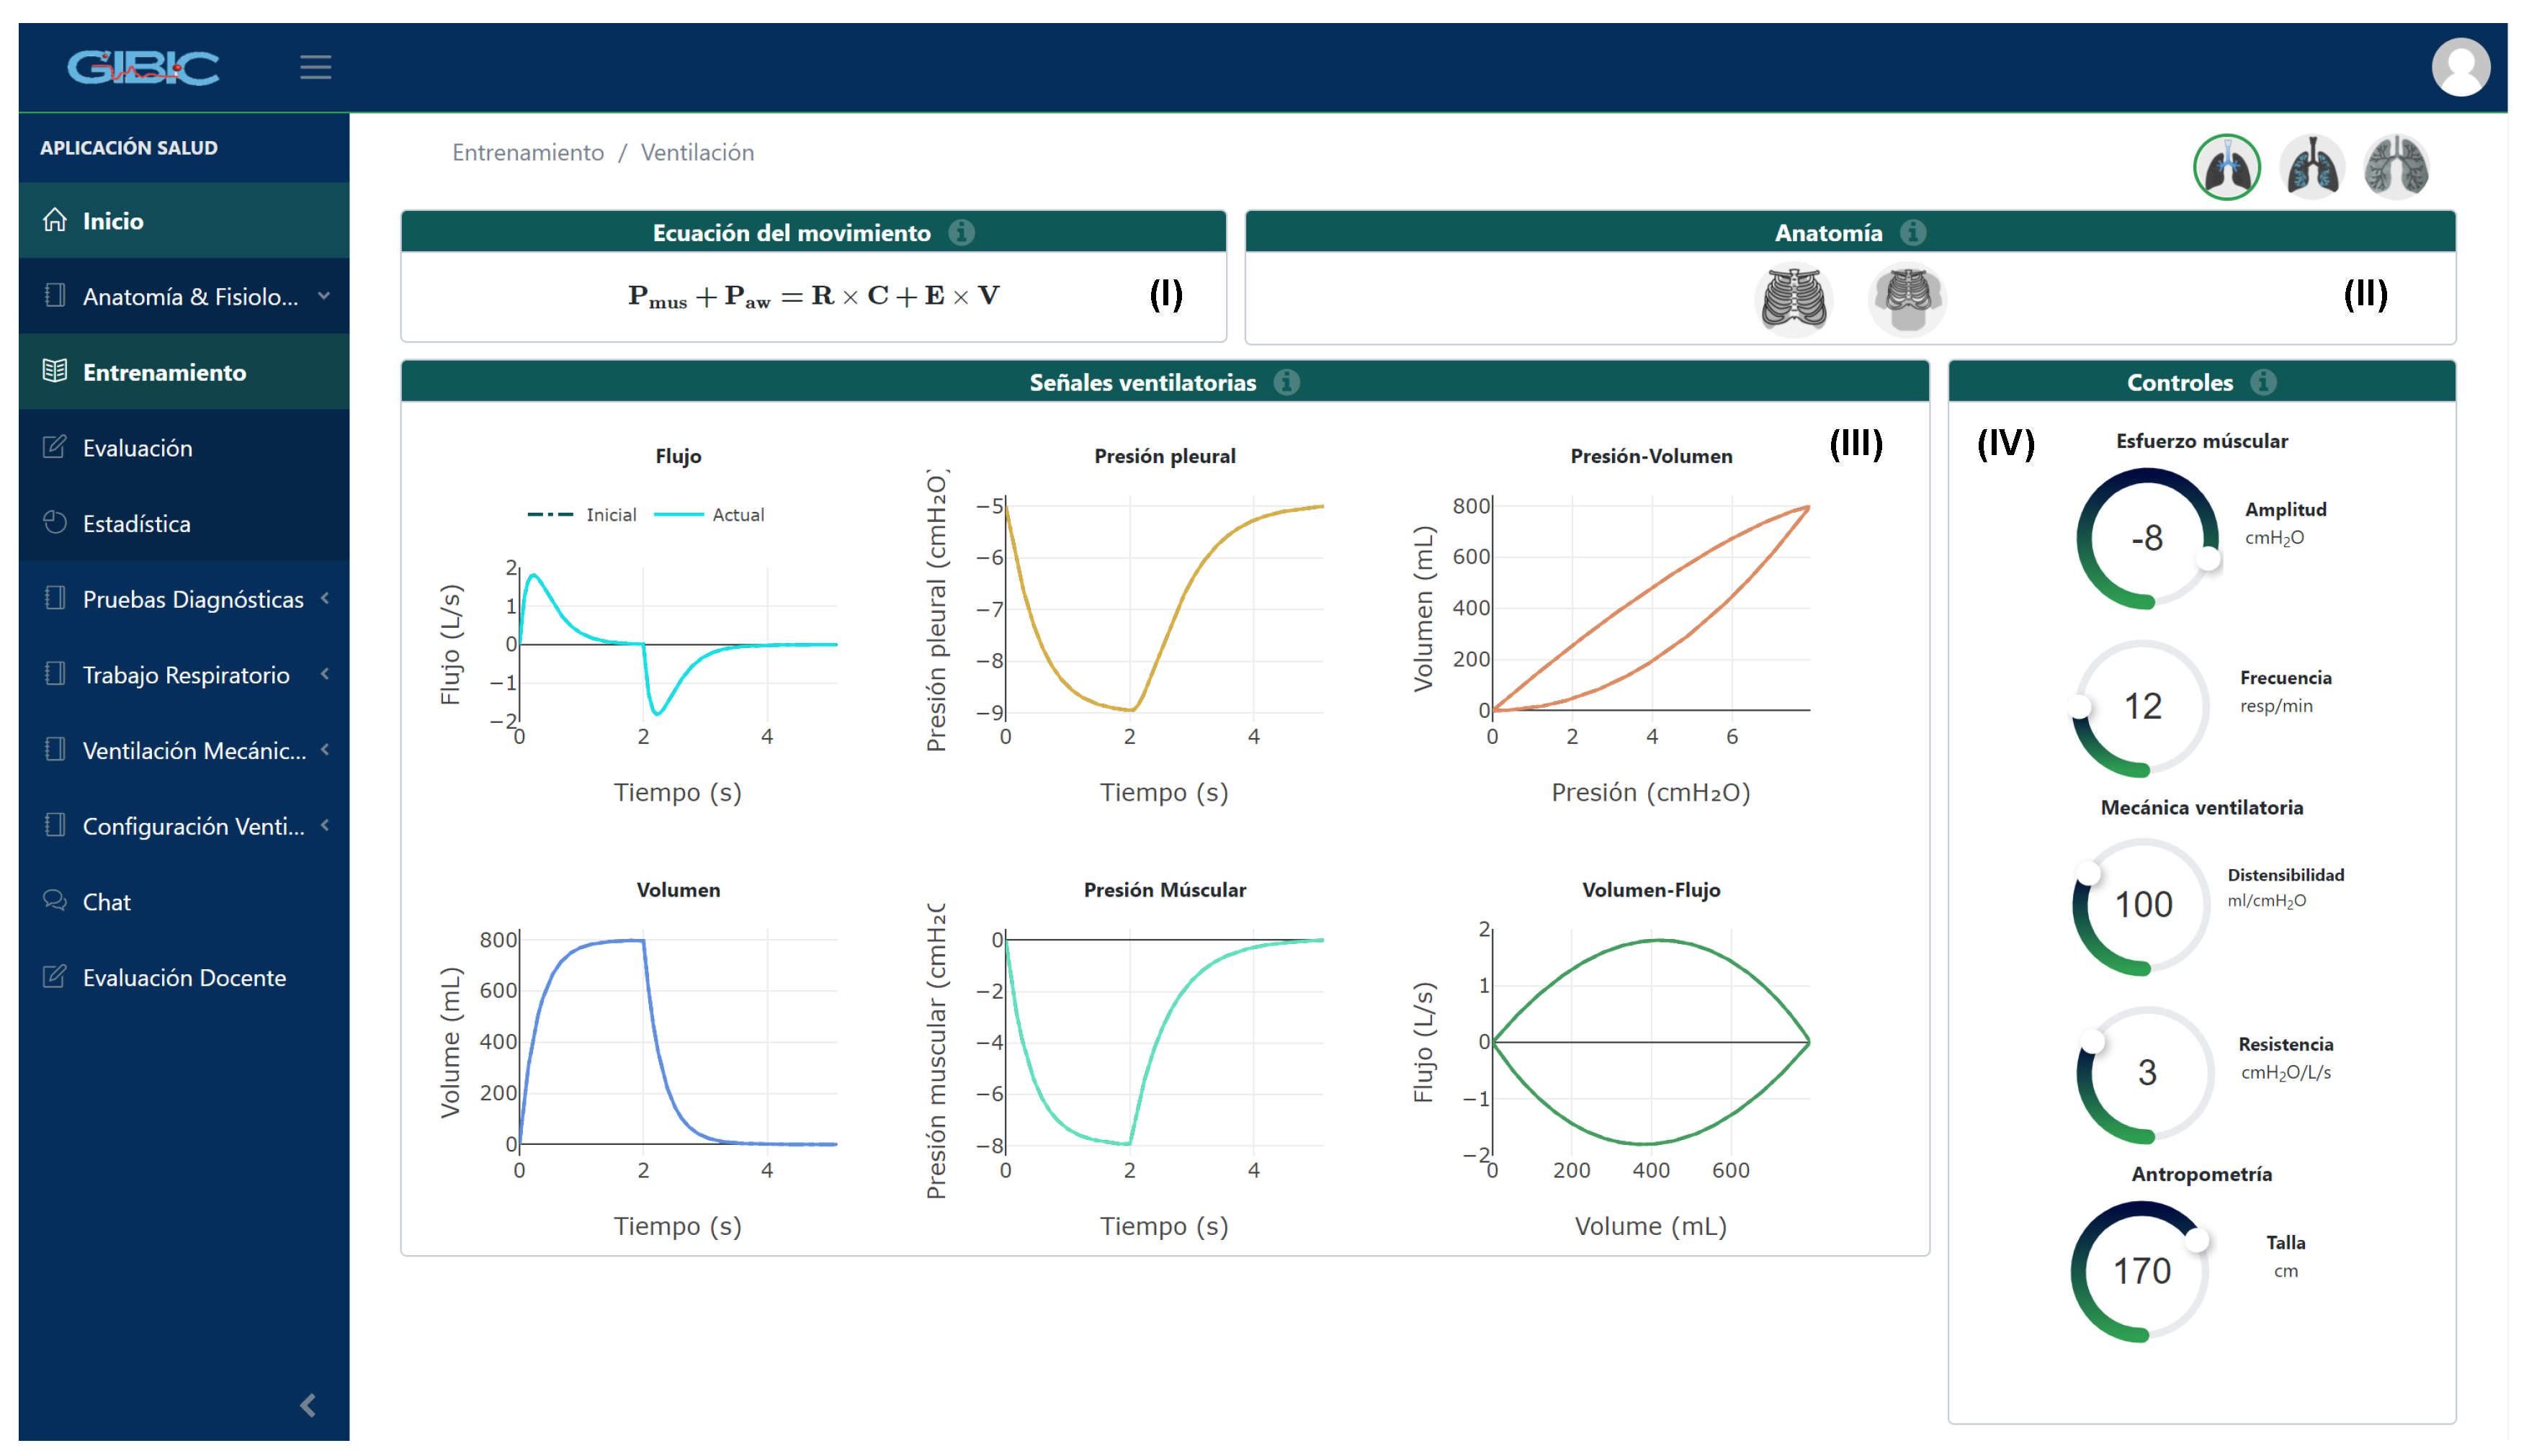
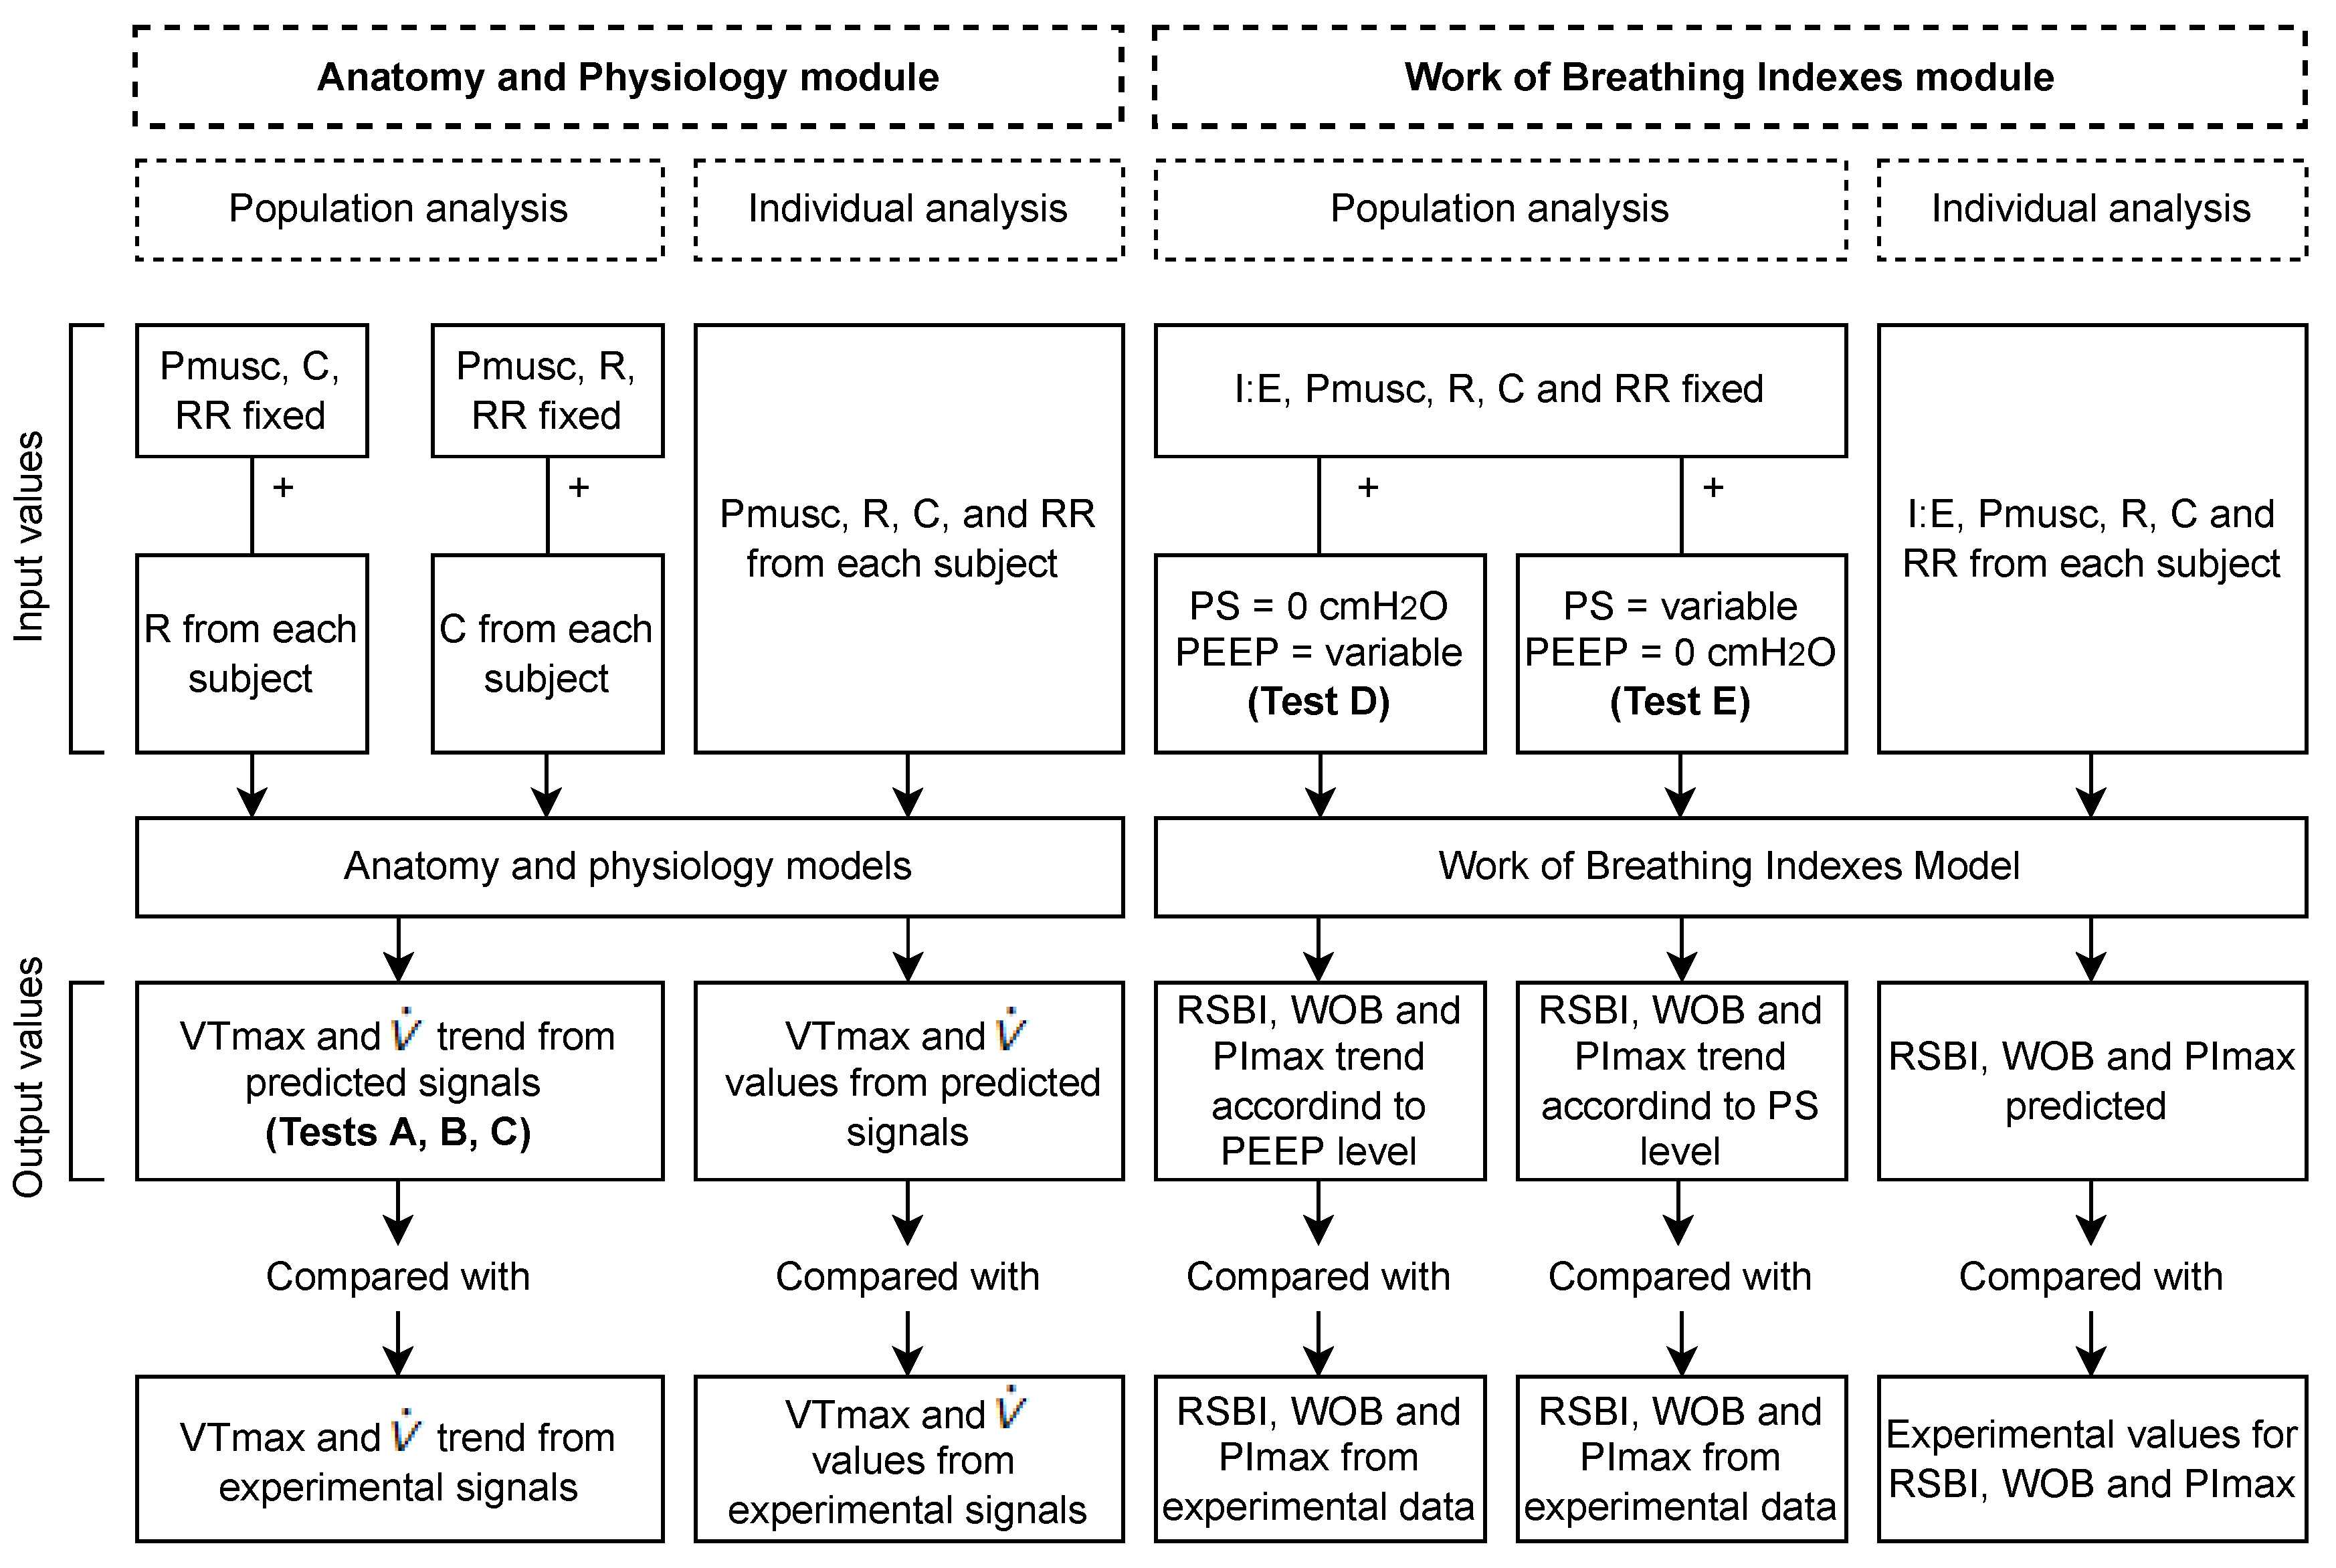
2.1. Application and Modules’ Description

The application developed is structured by modules and sections based on mathematical models covering a specific topic. From them, students will be able to make predictions of ventilatory waveforms such as airflow, volume, and pressure signals, and respiratory effort indexes such as WOB, RSBI, and PImax. At the same time, they can make changes to the controls, according to the model’s parameters, as shown in Figure 1.

2.1.1. Anatomy and Physiology Module

The “Anatomy and Physiology” module has been developed to evaluate the respiratory response to changes in a patient’s mechanics and breathing pattern. It comprises a ventilation section (see Figure 2) that, in turn, is divided into four sub-sections: (I) equation of motion, in which the respiratory system equation of air motion is presented, with a detailed description of each of the terms that compose it; (II) anatomy, which shows graphs referring to ventilatory mechanics, respiratory muscles, and the alveolar ventilatory model—each representation contains points with explanatory information; (III) ventilatory signals, which displays airflow, tidal volume, pleural and muscular pressure waveforms, and pressure–volume and airflow–volume loops in a breath cycle; and (IV) controls, which are the components that allow for modifcations to the variables related to a patient’s effort and mechanical properties, e.g., muscle effort pressure (Pmusc), respiratory rate (RR), lung compliance (C), and airway resistance (R). From these controls, users can interact with the behavior of the ventilatory curves after making changes to every one of them, according to their relationship, through the equation of air motion (Equation (1)):
P m u s c ( t ) + P a w ( t ) = R V ˙ ( t ) + C 1 V T ( t ) ,
where V ˙ is the inspired airflow, and VT represents the tidal volume. In this case, restrictive and obstructive pathologies can be simulated by changing the R and C values, so students can interactively learn about ventilatory behavior in these situations.

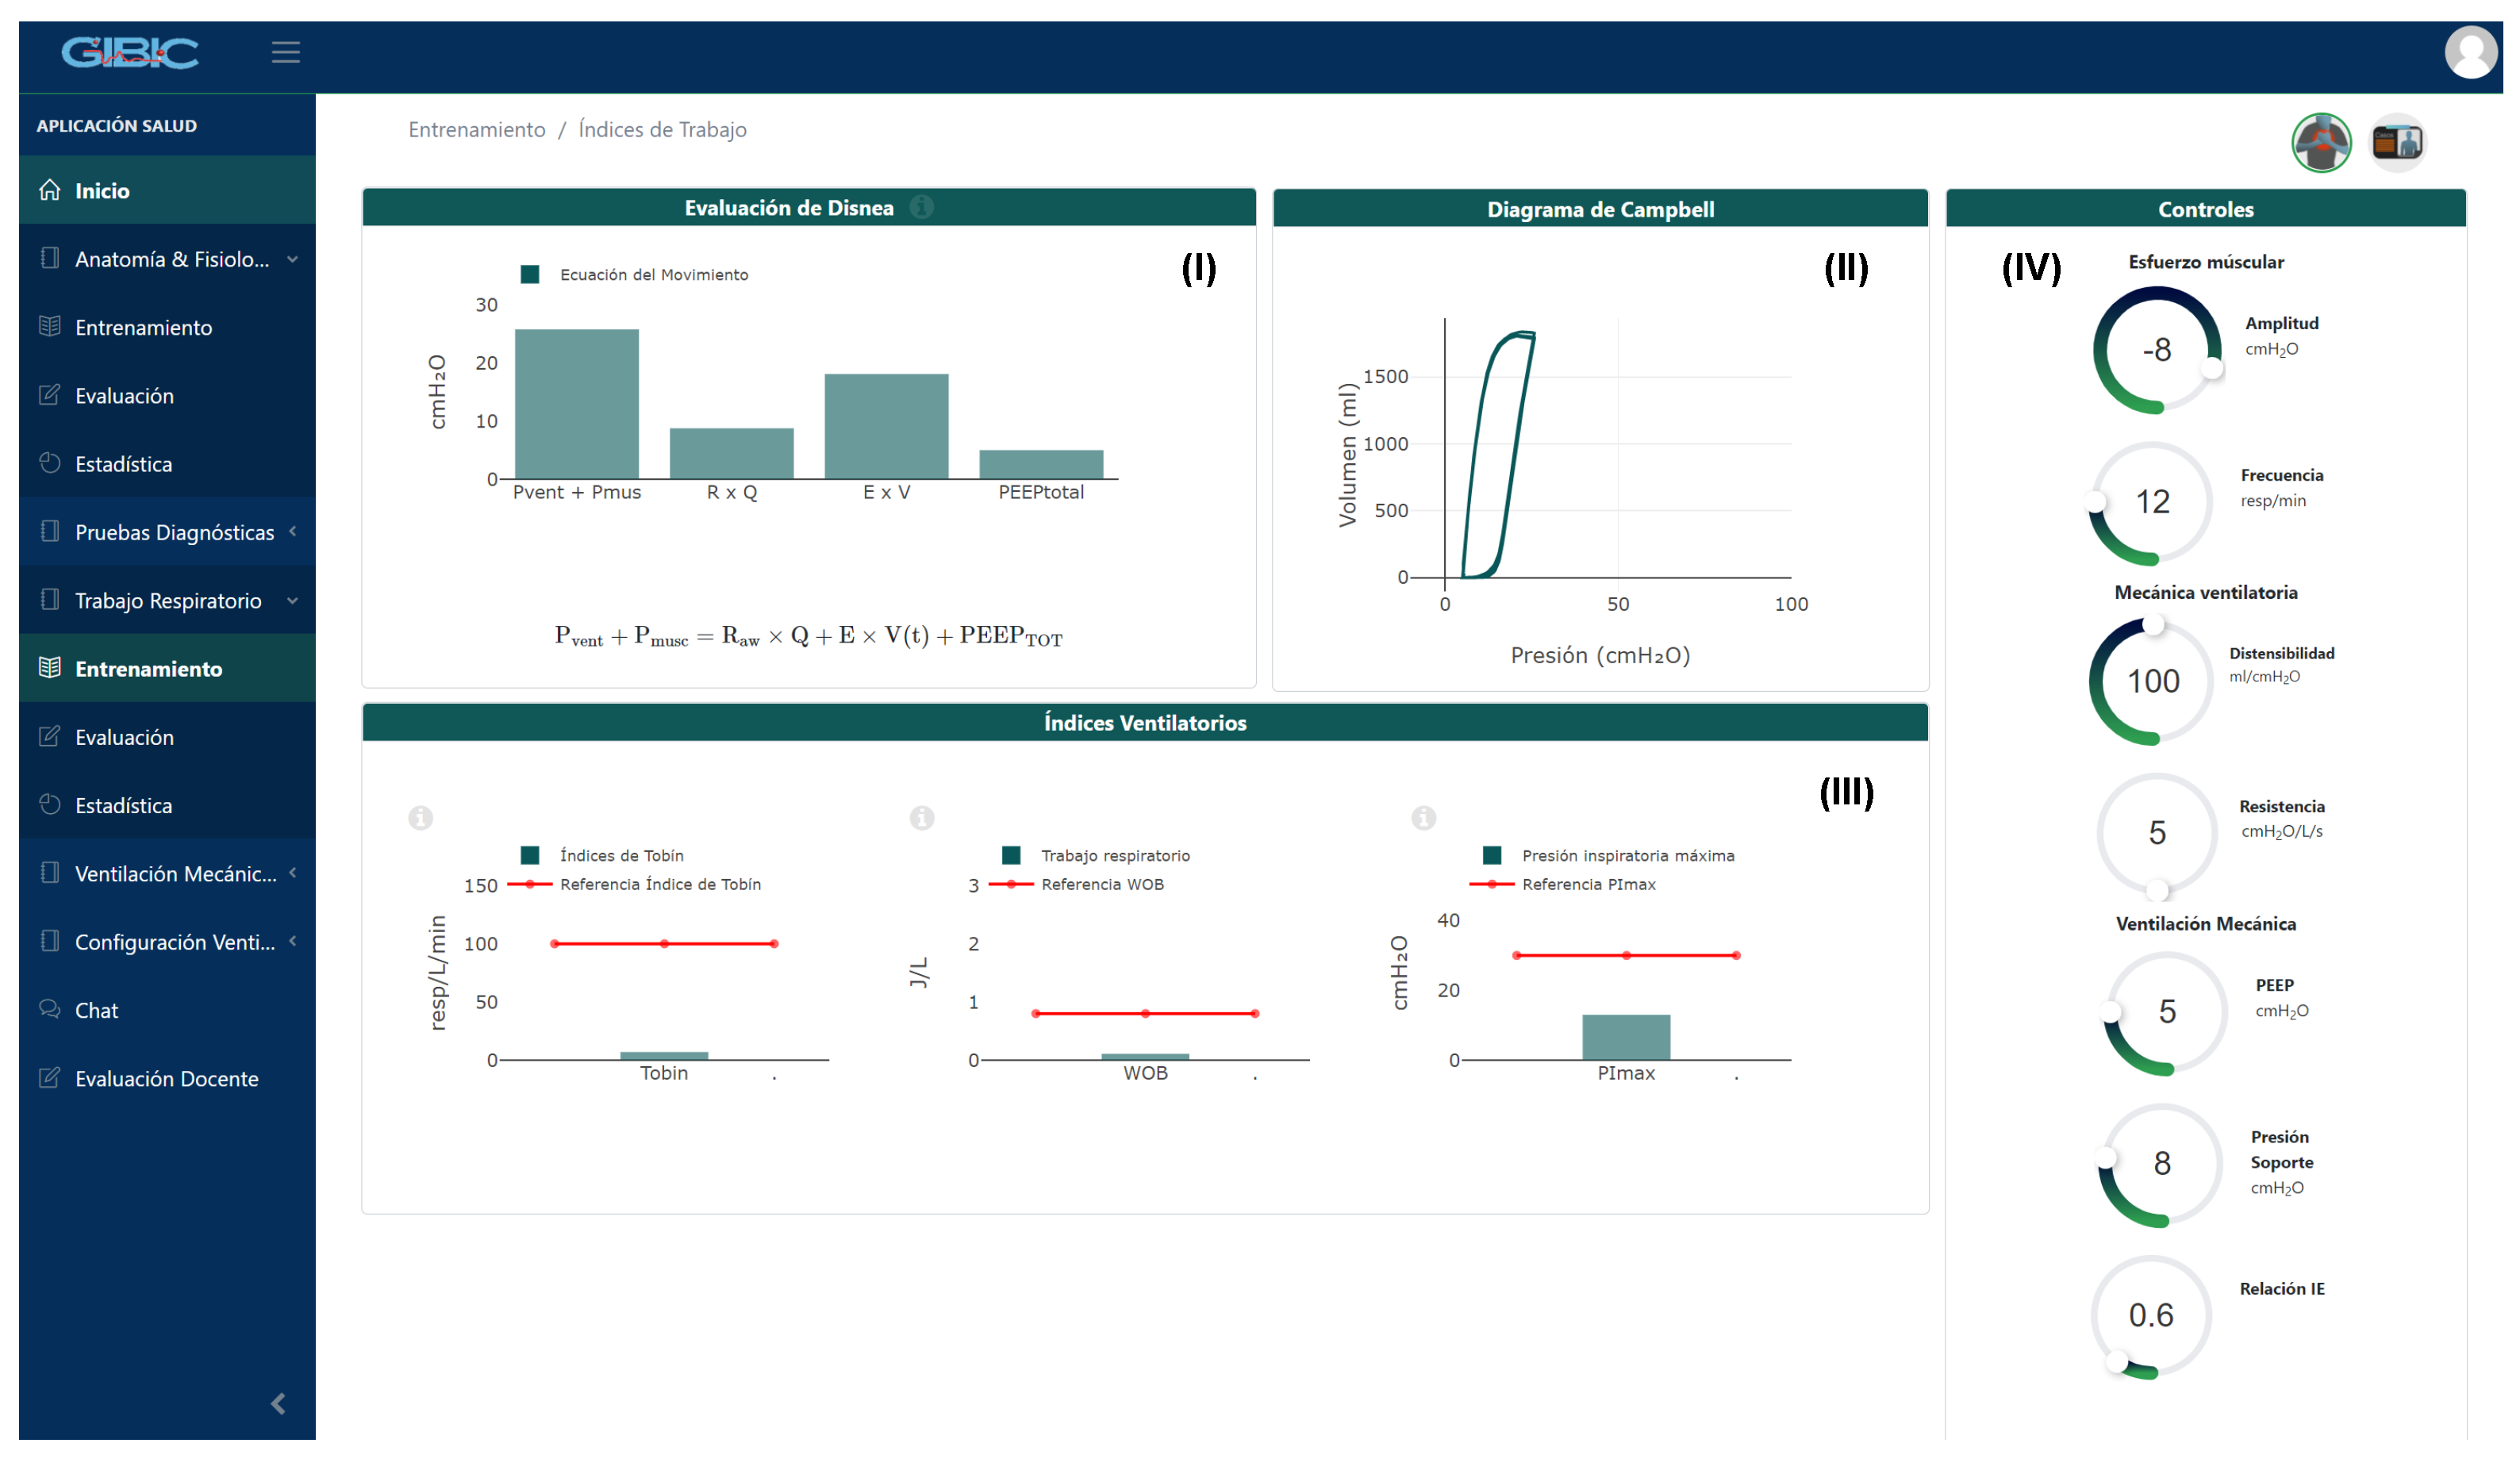
2.1.2. Work of Breathing Indexes Module

The “Work of Breathing Indexes” module has been developed to evaluate the patient’s WOB under spontaneous MV with pressure support (pressure support ventilation, PSV). The main section, called the work of breathing assessment, is composed of four sub-sections: (I) assessment of dyspnea, in which a description of dyspnea and the mechanisms used to determine it are presented; (II) a Campbell diagram, which allows for visualizations of the volume–pressure loop; (III) ventilatory indexes, which display the RSBI, WOB, and PImax index values; and (IV) controls, to modify the variables related to a patient’s effort, mechanical properties, and MV parameters (see Figure 3). This module aims to predict the level of muscular effort of a simulated patient under MV through the controls arranged in the interface. Likewise, the module allows for visualizations of when the subject is exposed to high respiratory work by marking thresholds, according to the literature [4,6,19], so the student can come to a conclusion in this regard.

2.2. Validation Process

A comparative study was performed to evaluate the model prediction capability between experimental (information obtained from subjects under different conditions) and predicted (information obtained from models’ simulators) data, following both a population and an individual approach. In the first case, we evaluated the adjustment between the experimental and simulated trend data using a set of fixed input values. In the latter case, we estimated the similarity between the experimental and simulated data using the mechanic’s pattern from each subject as the input values. The information was compared in both cases using linear trends and box plots. Figure 4 presents a concise diagram of the input parameters and the output values from the models, and the variables used to compare with the experimental data.

2.2.1. Anatomy and Physiology Module

Description of the Database

A proprietary database of 41 healthy male subjects (age 26.49 ± 5.21, weight 73.87 ± 9.62 kg, size 1.73 ± 0.05 m, and BMI 28.89 ± 2.96 kg/m 2 ) was used to quantify the performance and the scope of the models involved. Subjects underwent an obstructive maneuver, wherein three levels of obstruction were applied to obtain, as a result, three modifications in R and, with that, changes in the ventilatory signals (see Equation (1)). Table 1 summarizes the obtained ventilatory mechanics. The sensor types and resistors used for the registration of the DB, the inclusion criteria, the ethical approval, and other acquisition aspects are detailed in the work carried out by the GIBIC research group in [20].

Analysis

Inspiratory airflow amplitude ( V ˙ ) and maximum tidal volume (VTmax) variables were selected for the analysis because they allow for knowledge of both the airflow limitations and the lung capacity in a normal respiratory cycle without forced inspiration maneuvers.
For the population analysis, changes in V ˙ and VTmax were assessed after variations of R or C (see Figure 4). For that, fixed values of Pmusc, RR, and C or R (depending on the case) were defined. Values for R and C were fixed as equal to the first (Q1), second (Q2), and third (Q3) experimental quartiles (see values in Table 1), and labeled as Test A, Test B, and Test C, respectively, to represent the data variability. Muscle effort values, such as Pmusc and RR, were established considering the normal values for an adult in 8 cmH 2 O and 12 bpm, respectively [21,22], to limit the analysis to changes in the ventilatory mechanics parameters (R and C).
The models’ prediction capability was evaluated by comparing the linear trends between the experimental and predicted values of the assessed variables, V ˙ and VTmax.
On the other hand, the individual analysis assesses the model performance on a subject-to-subject basis. For that, the prediction error between the experimental and model-predicted data for both V ˙ and VTmax was evaluated using Equation (2). For experimental data, V ˙ and VTmax were measured in equal and stationary epochs and, for model simulation, the following inputs were considered: Pmusc, RR, R, and C, specific to each subject.
% E = 100 | A p p V a l u e R e a l V a l u e | R e a l V a l u e

2.2.2. Work of Breathing Indexes Module

Description of the Database

A proprietary database comprising 35 healthy men (age 26.60 ± 5.40, weight 73.12 ± 9.15 kg, size 1.72 ± 0.05 m, and BMI 24.58 ± 2.76 kg/m 2 ) was used to validate the models involved in the “Work of Breathing Indexes” module. Volunteers were involved in two trials of PEEP and PS variations during non-invasive spontaneous ventilation. In Test D, the PEEP was changed from 0 to 10 cmH 2 O, with increments of 2 cmH 2 O every 3 minutes, while the PS was kept at 0 cmH 2 O. In Test E, the PS was varied from 0 to 10 cmH 2 O with increments of 2 cmH 2 O every 3 min, while the PEEP was preserved at 0 cmH 2 O. Each trial consisted of 210 records, 6 per subject. Table 2 summarizes the ventilatory mechanics and MV parameters of both tests. The registration protocol, inclusion criteria, and ethical approval are detailed in the work carried out by the GIBIC research group in [4].

Analysis

For both the population analysis and the individual analysis (see Figure 4), the WOB, RSBI, and PImax indexes were compared. They were calculated from information extracted from the DBs, following the expressions in Equations (3)–(5), and averaging their values for at least five respiratory cycles.
The WOB was calculated as the area under the Campbell diagram curve, which relates the pressure exerted through the respiratory system with the resulting changes in volume [23]. For this, Equation (3) was used for a respiratory cycle:
W O B = 1 V T t 0 t P musc ( t ) * V ˙ ( t ) d t .
The RSBI was calculated by Equation (4), according to Yang and Tobin’s proposal [6]:
R S B I = R R V T .
The PImax was calculated according to the American Thoracic Society/European Respiratory Society, ATS/ERS [24], as the maximum pressure that a subject can generate in the mouth during inspiration, as shown in Equation (5), where t0 and t correspond to the onset and final inspiration times:
PI max = m a x P a w ( t ) t 0 t .
For the population analysis, the trend and the behavior of the indexes predicted by the models were compared to the data obtained from subjects in the DBs and analyzed. The experimental data were grouped according to their PEEP and PS levels for Tests D and E, respectively. To obtain the predicted data (WOB, RSBI, and PImax), the median values of the muscular effort (RR and Pmusc), ventilatory mechanics (R and C), and I:E variables were used as the input parameters for the models, according to Table 2. Corresponding PEEP and PS values were used for each level.
Regarding the individual analysis, predicted values of the WOB, RSBI, and PImax were obtained using experimental values of RR, Pmusc, R, C, and I:E of each subject as the module’s inputs. Then, the prediction error was calculated as the average difference between the experimental data (obtained from each record) and simulated data (see Equation (2)).

2.2.3. Delphi Validation

The content validation of the application corresponded to health professionals’ evaluations, with experience in the areas of anatomy, physiology, and the pathophysiology of the respiratory system. The inclusion criteria for selecting participants were focused on medical specialty (anesthesiology and intensive care medicine) and experience in the clinical field.
The aspects evaluated were focused on both the theoretical solidity and graphic quality of the content presented. The theoretical solidity aims to assess the relevance, sufficiency, and veracity of the concepts and clinical cases presented in the modules. In contrast, the graphic quality seeks to evaluate the definition, ordering, and veracity of the images (X-rays) and other visual resources (anatomical representations and charts).
The instruments built for the validation consisted of questionnaires based on the Likert scale (1 to 5), in which statements related to each of the contents displayed in the modules were presented. Every statement aimed to evaluate the aforementioned aspects and collect related comments, opinions, or suggestions. The instruments were designed following the structure of the modules, i.e., the statements were grouped according to their sections and sub-sections.
The built-in instruments were available to evaluators on a website specifically designed for validation.
The validation was carried out by eight evaluators who were contextualized about the procedure before obtaining their informed consent. Virtual sessions were scheduled to record the data, which at least two researchers supported. Their role included guiding the evaluators regarding the use of the website, and collecting comments, opinions, and suggestions.

2.3. Statistical Techniques

In both applications, the Lilliefors test was implemented to characterize the distribution of the groups. Once the free distribution of the data was corroborated, the Kruskal–Wallis nonparametric test was used in conjunction with the Tukey method to detect statistically significant differences between each pair of datasets, with a significance level of p < 0.05. The data was processed and computationally tabulated in MATLAB (MathWorks, R2018a).

3. Results

3.1. Anatomy and Physiology Module

3.1.1. Statistical Analysis
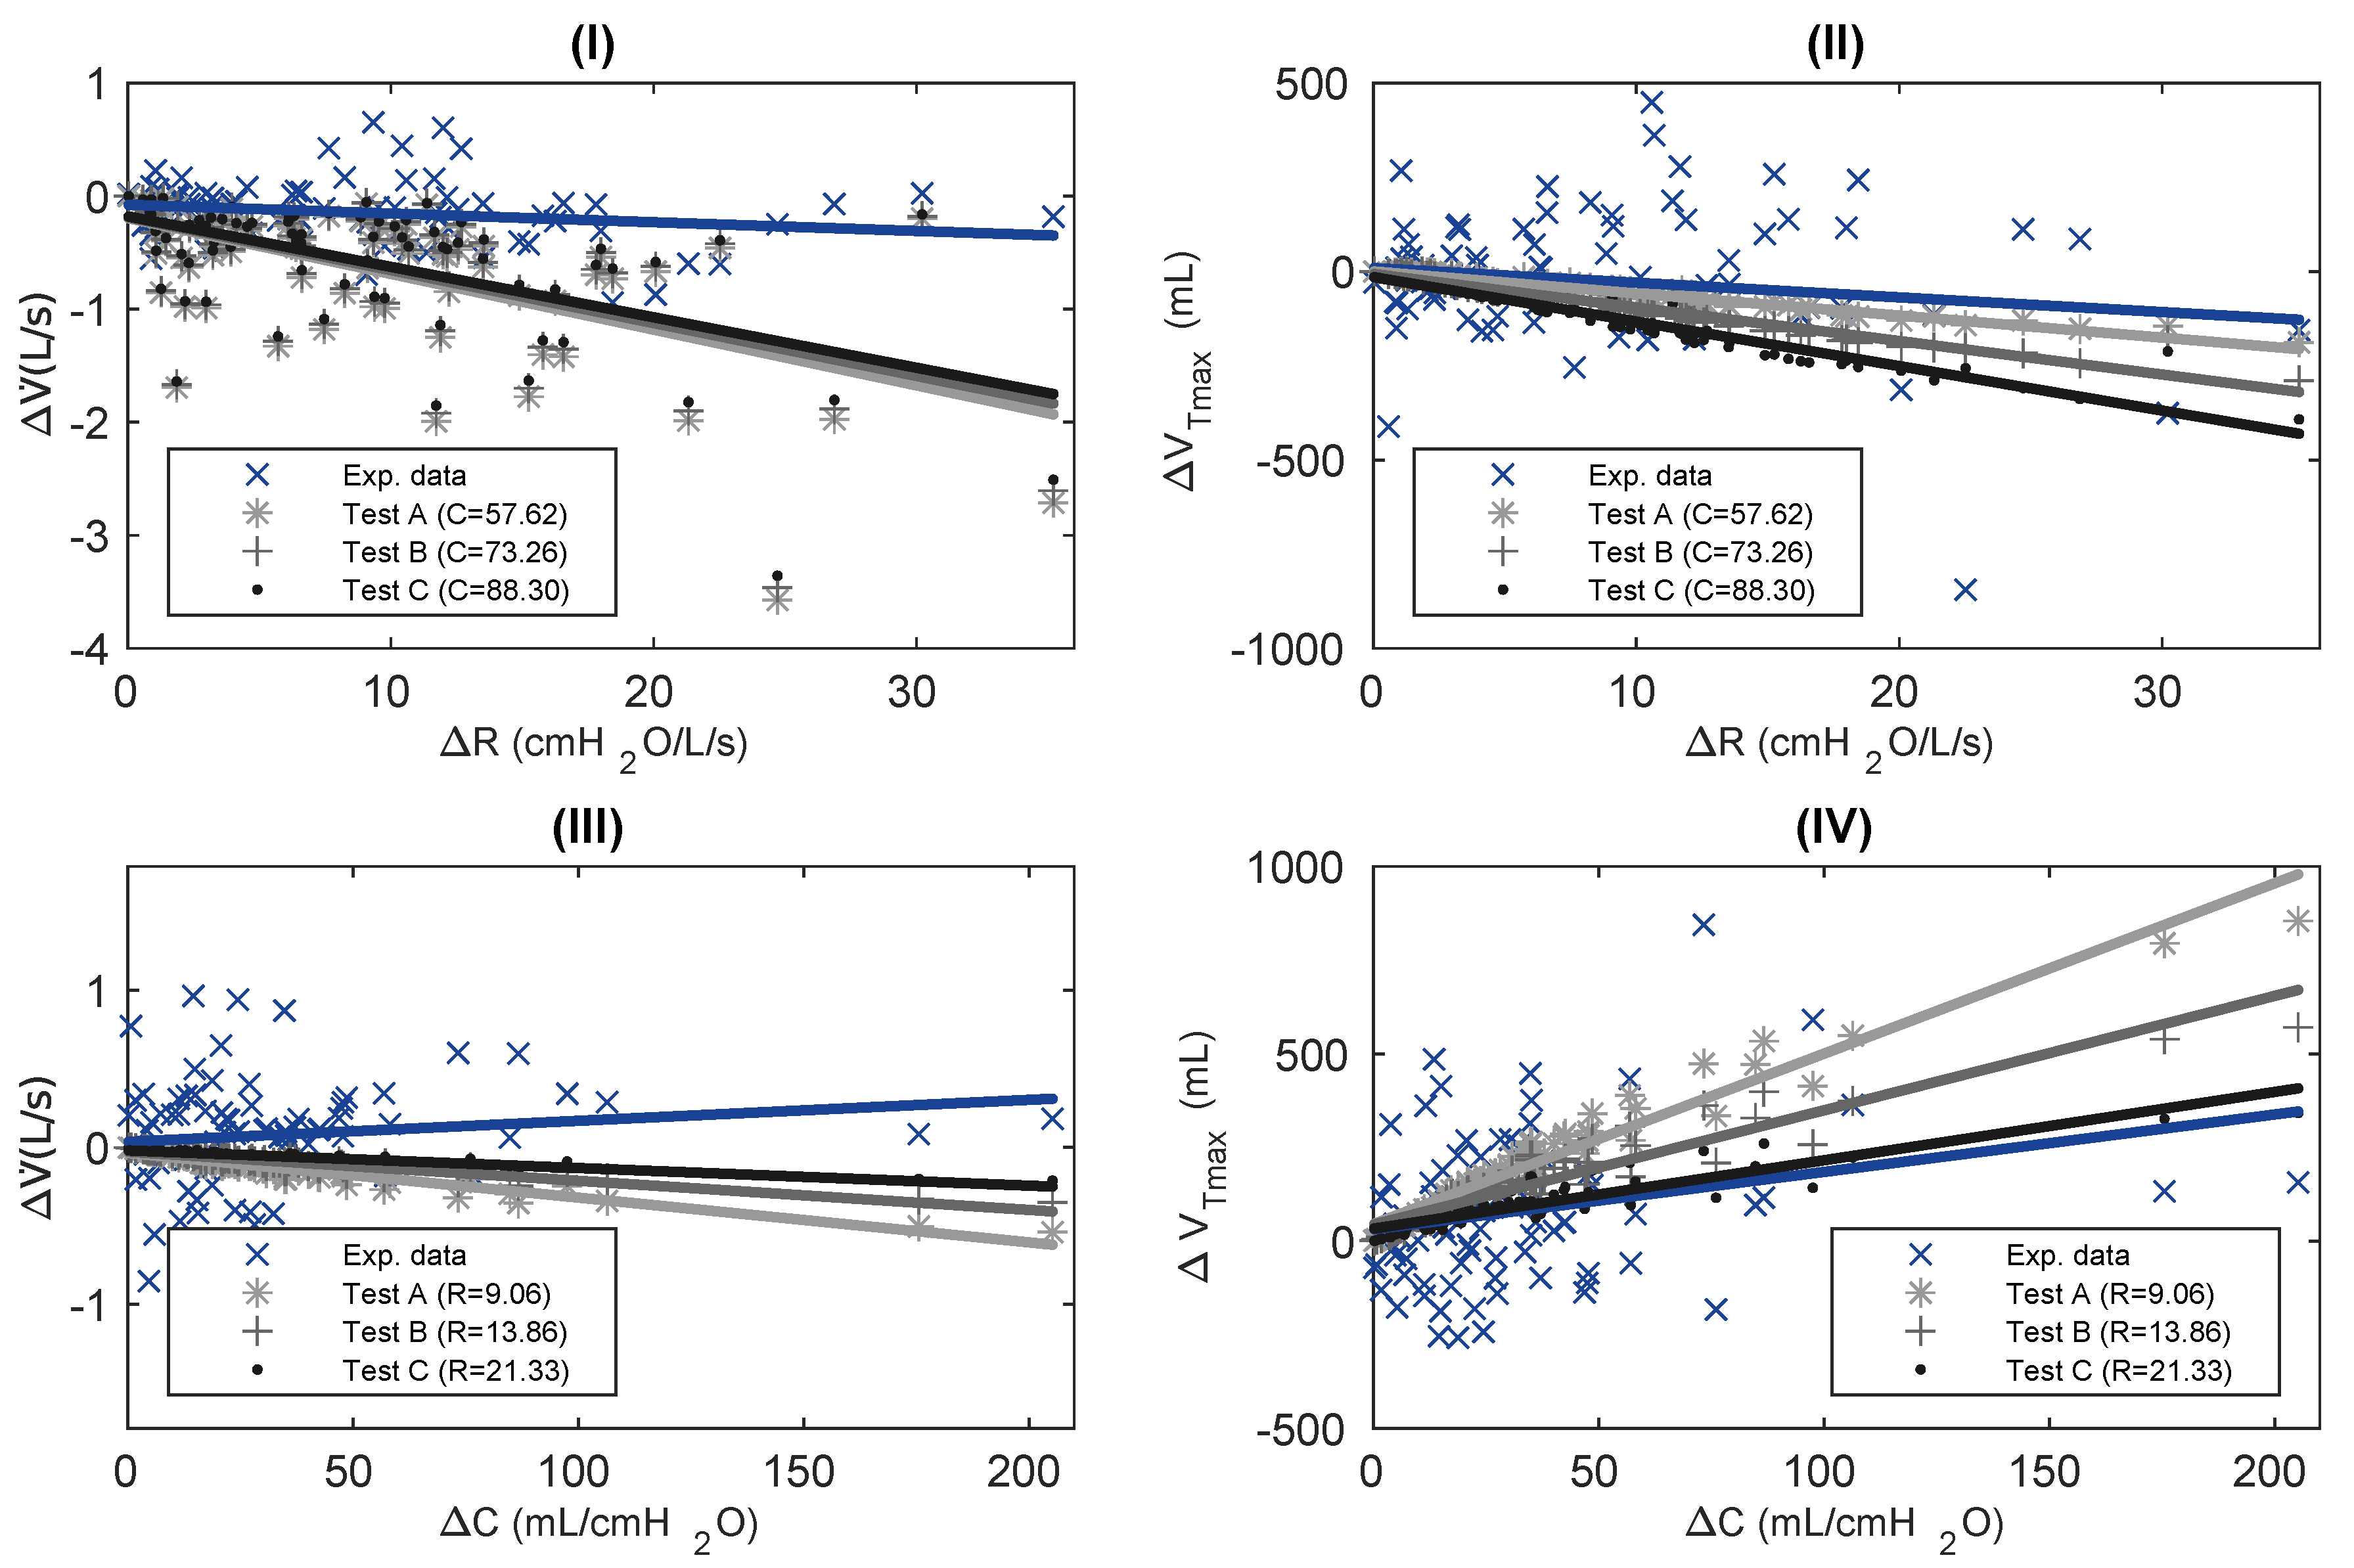
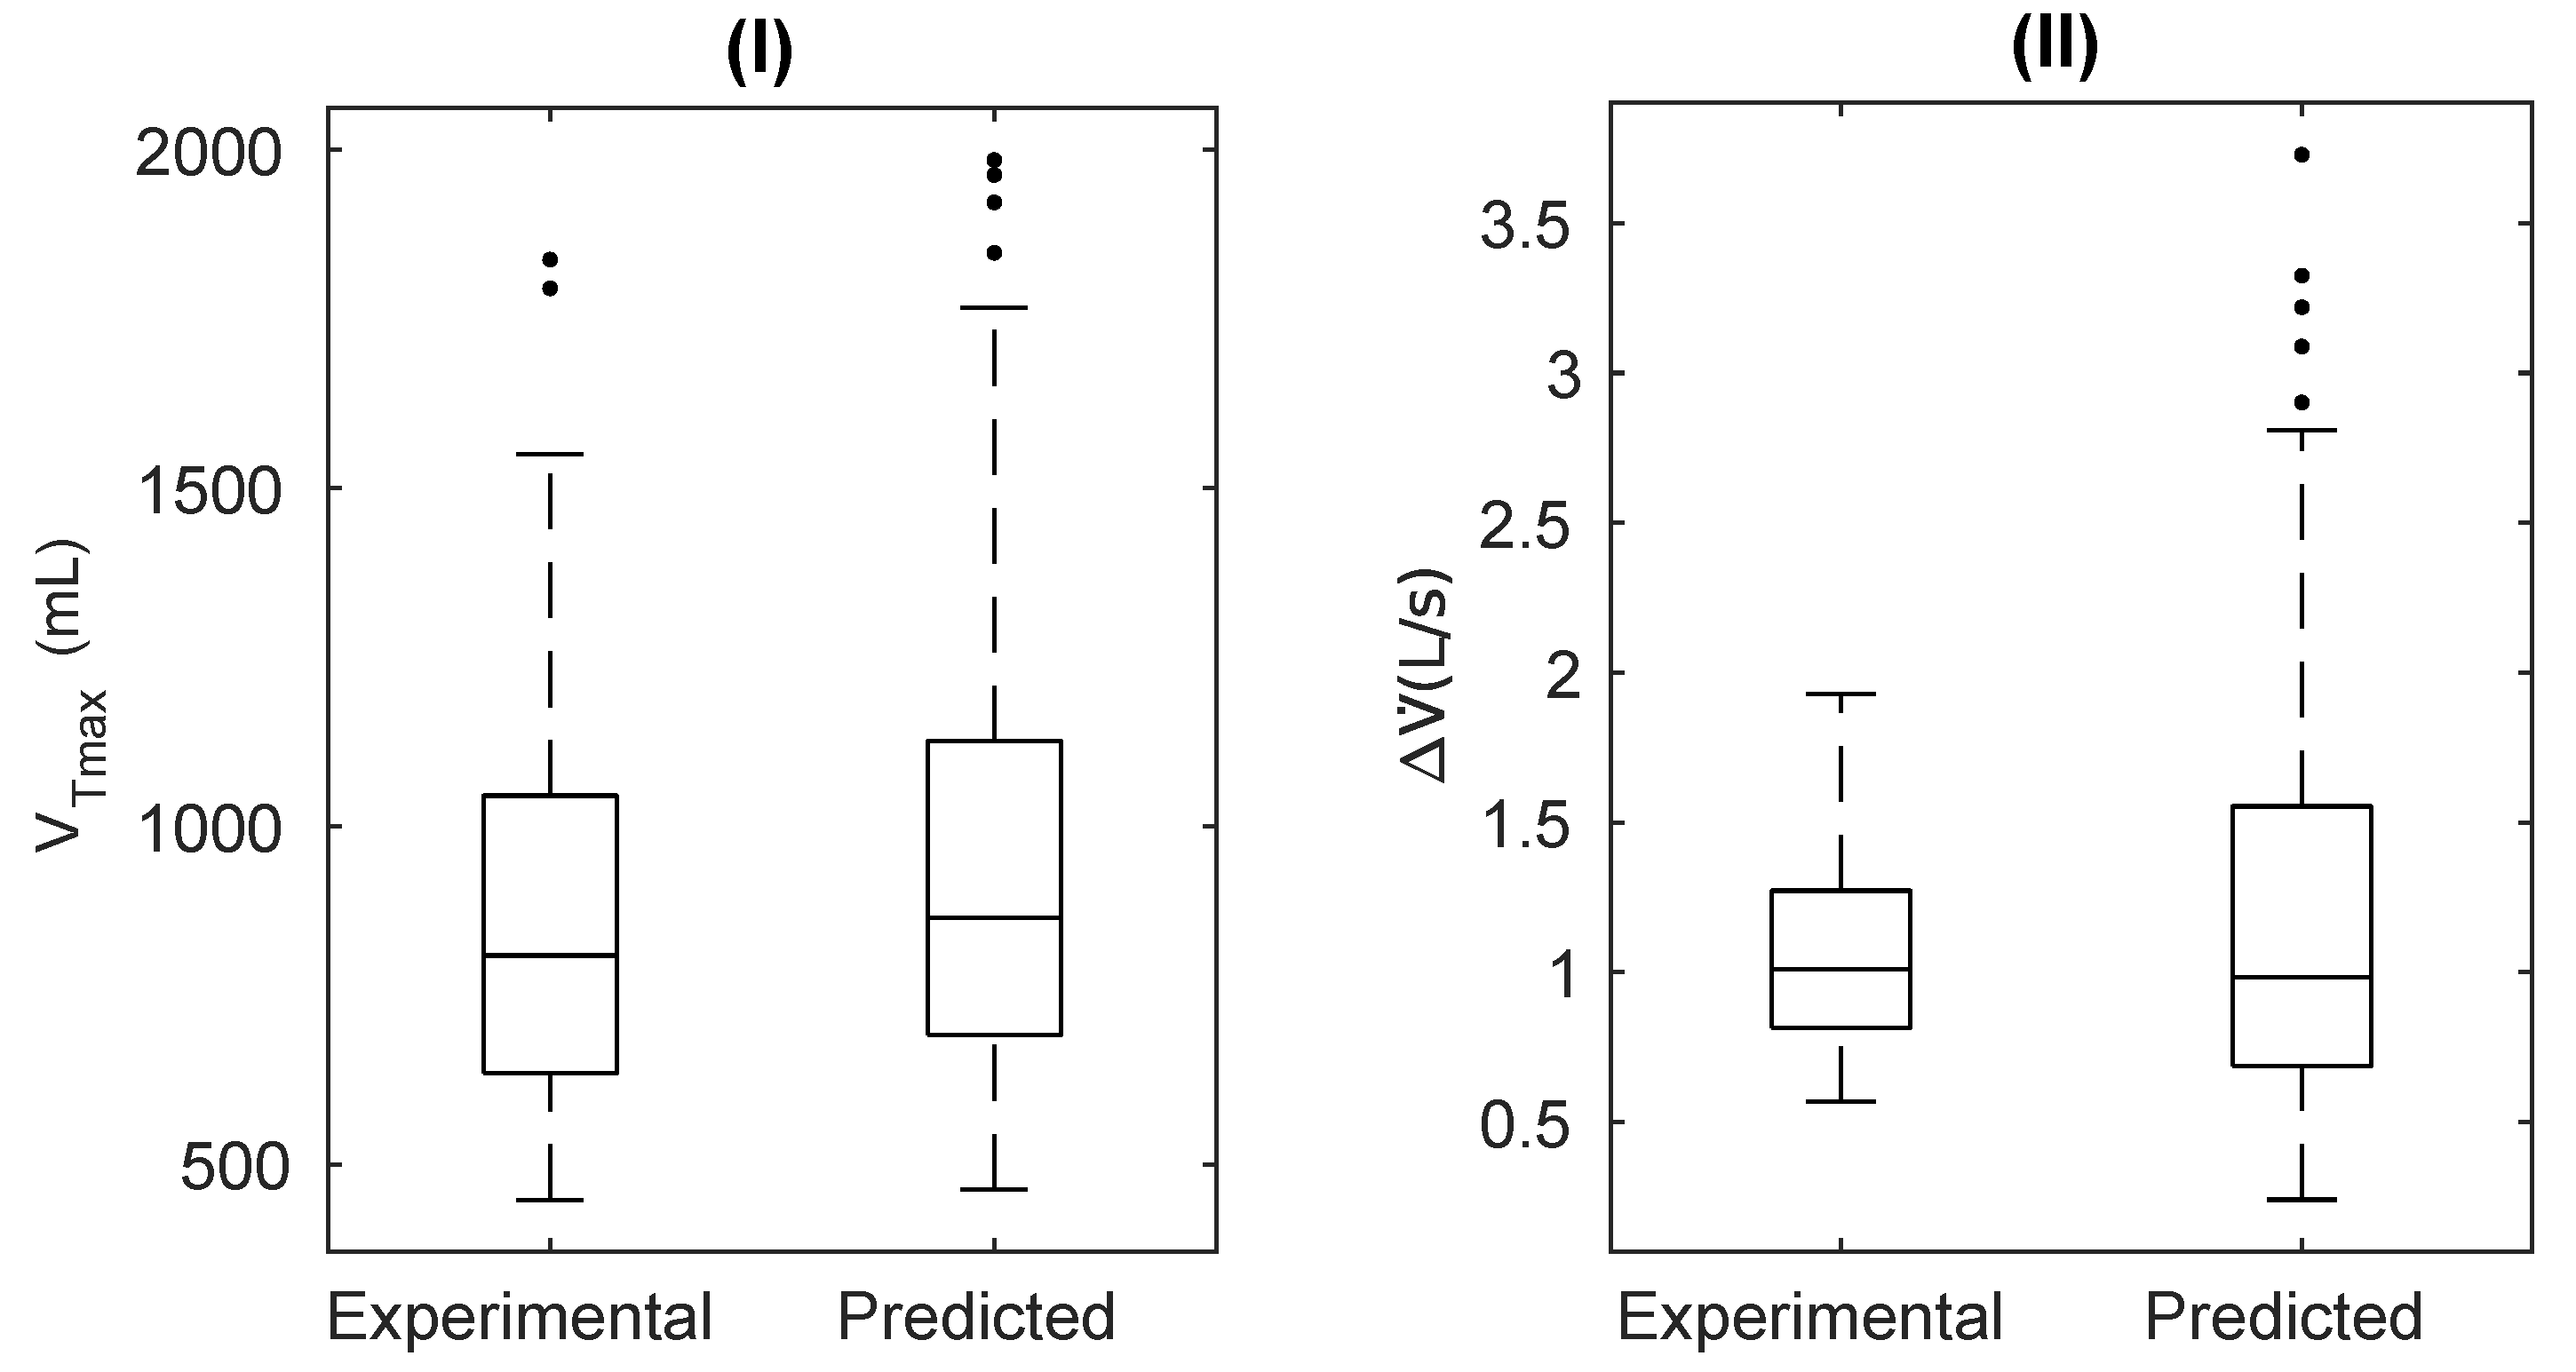
Population Analysis

Figure 5 shows the results obtained after the R and C variations using the values presented in Table 1 and with a RR of 12 bpm and Pmusc of 8 cmH 2 O. Results are shown as the difference ( Δ ) between the parameter and each volunteer’s biologically nominal value (i.e., the subject’s R and C values without applying any maneuvers).
Although there is high dispersion in the population information of the DBs, after a qualitative inspection of the curves, the predicted values followed the expected trend, which was checked by verifying the slope value in each trial. Table 3 shows the median values, the interquartile ranges, and the slopes of the experimental and predicted data (Tests A, B, and C) for each curve.

Individual Analysis

A sample with 122 data points was selected to estimate the model’s predictive capacity. The V ˙ and VTmax were obtained for the experimental data using the subjects’ corresponding values of R, C, Pmusc, and RR. Figure 6 shows the experimental and predicted data distribution for comparative purposes. According to the results of the Kruskal–Wallis test, no statistically significant differences were found between each pair of data (p-value of 0.81 and 0.09 for V ˙ and VTmax, respectively).
In graphic (I) of Figure 6, the VTmax prediction describes high similarity in the data distribution; furthermore, the median values differ by 2.85% and the interquartile range differs by 5.93%, which is considered a good prediction. In graphic (II), for V ˙ , differences between the experimental and predicted median data were similar (2.85% of error). Although V ˙ shows differences in the data distribution, it did not show any statistical difference.
Table 4 reports the median and the interquartile range corresponding to the dispersion of the error calculated with Equation (2) for the total data, and separated according to the RR of each record. The errors obtained for V ˙ show that the model’s predictive power increases when the subject’s RR is lower than 12 bpm (errors remain smaller than 38%). In the case of VTmax, the total error shows a reasonable degree of prediction of the model due to the similarity and lower dispersion of the data shown in Figure 6(I), so there is no direct dependence with the RR. No case had errors greater than 20%.

3.1.2. Delphi Validation

Table 5 presents the Delphi validation results regarding the sub-sections of the module, scored from 1 to 5. The scores obtained show a general assessment of the content as adequate, mainly highlighting the excellent result for the ventilatory signals and the possibility of improving the equation of air motion learning.
The Delphi validation results regarding the evaluated aspects are presented in Table 6. Regarding this classification, a good and similar assessment is generally evidenced for all aspects, mainly highlighting the perceived sufficiency.

3.2. Work of Breathing Indexes Module

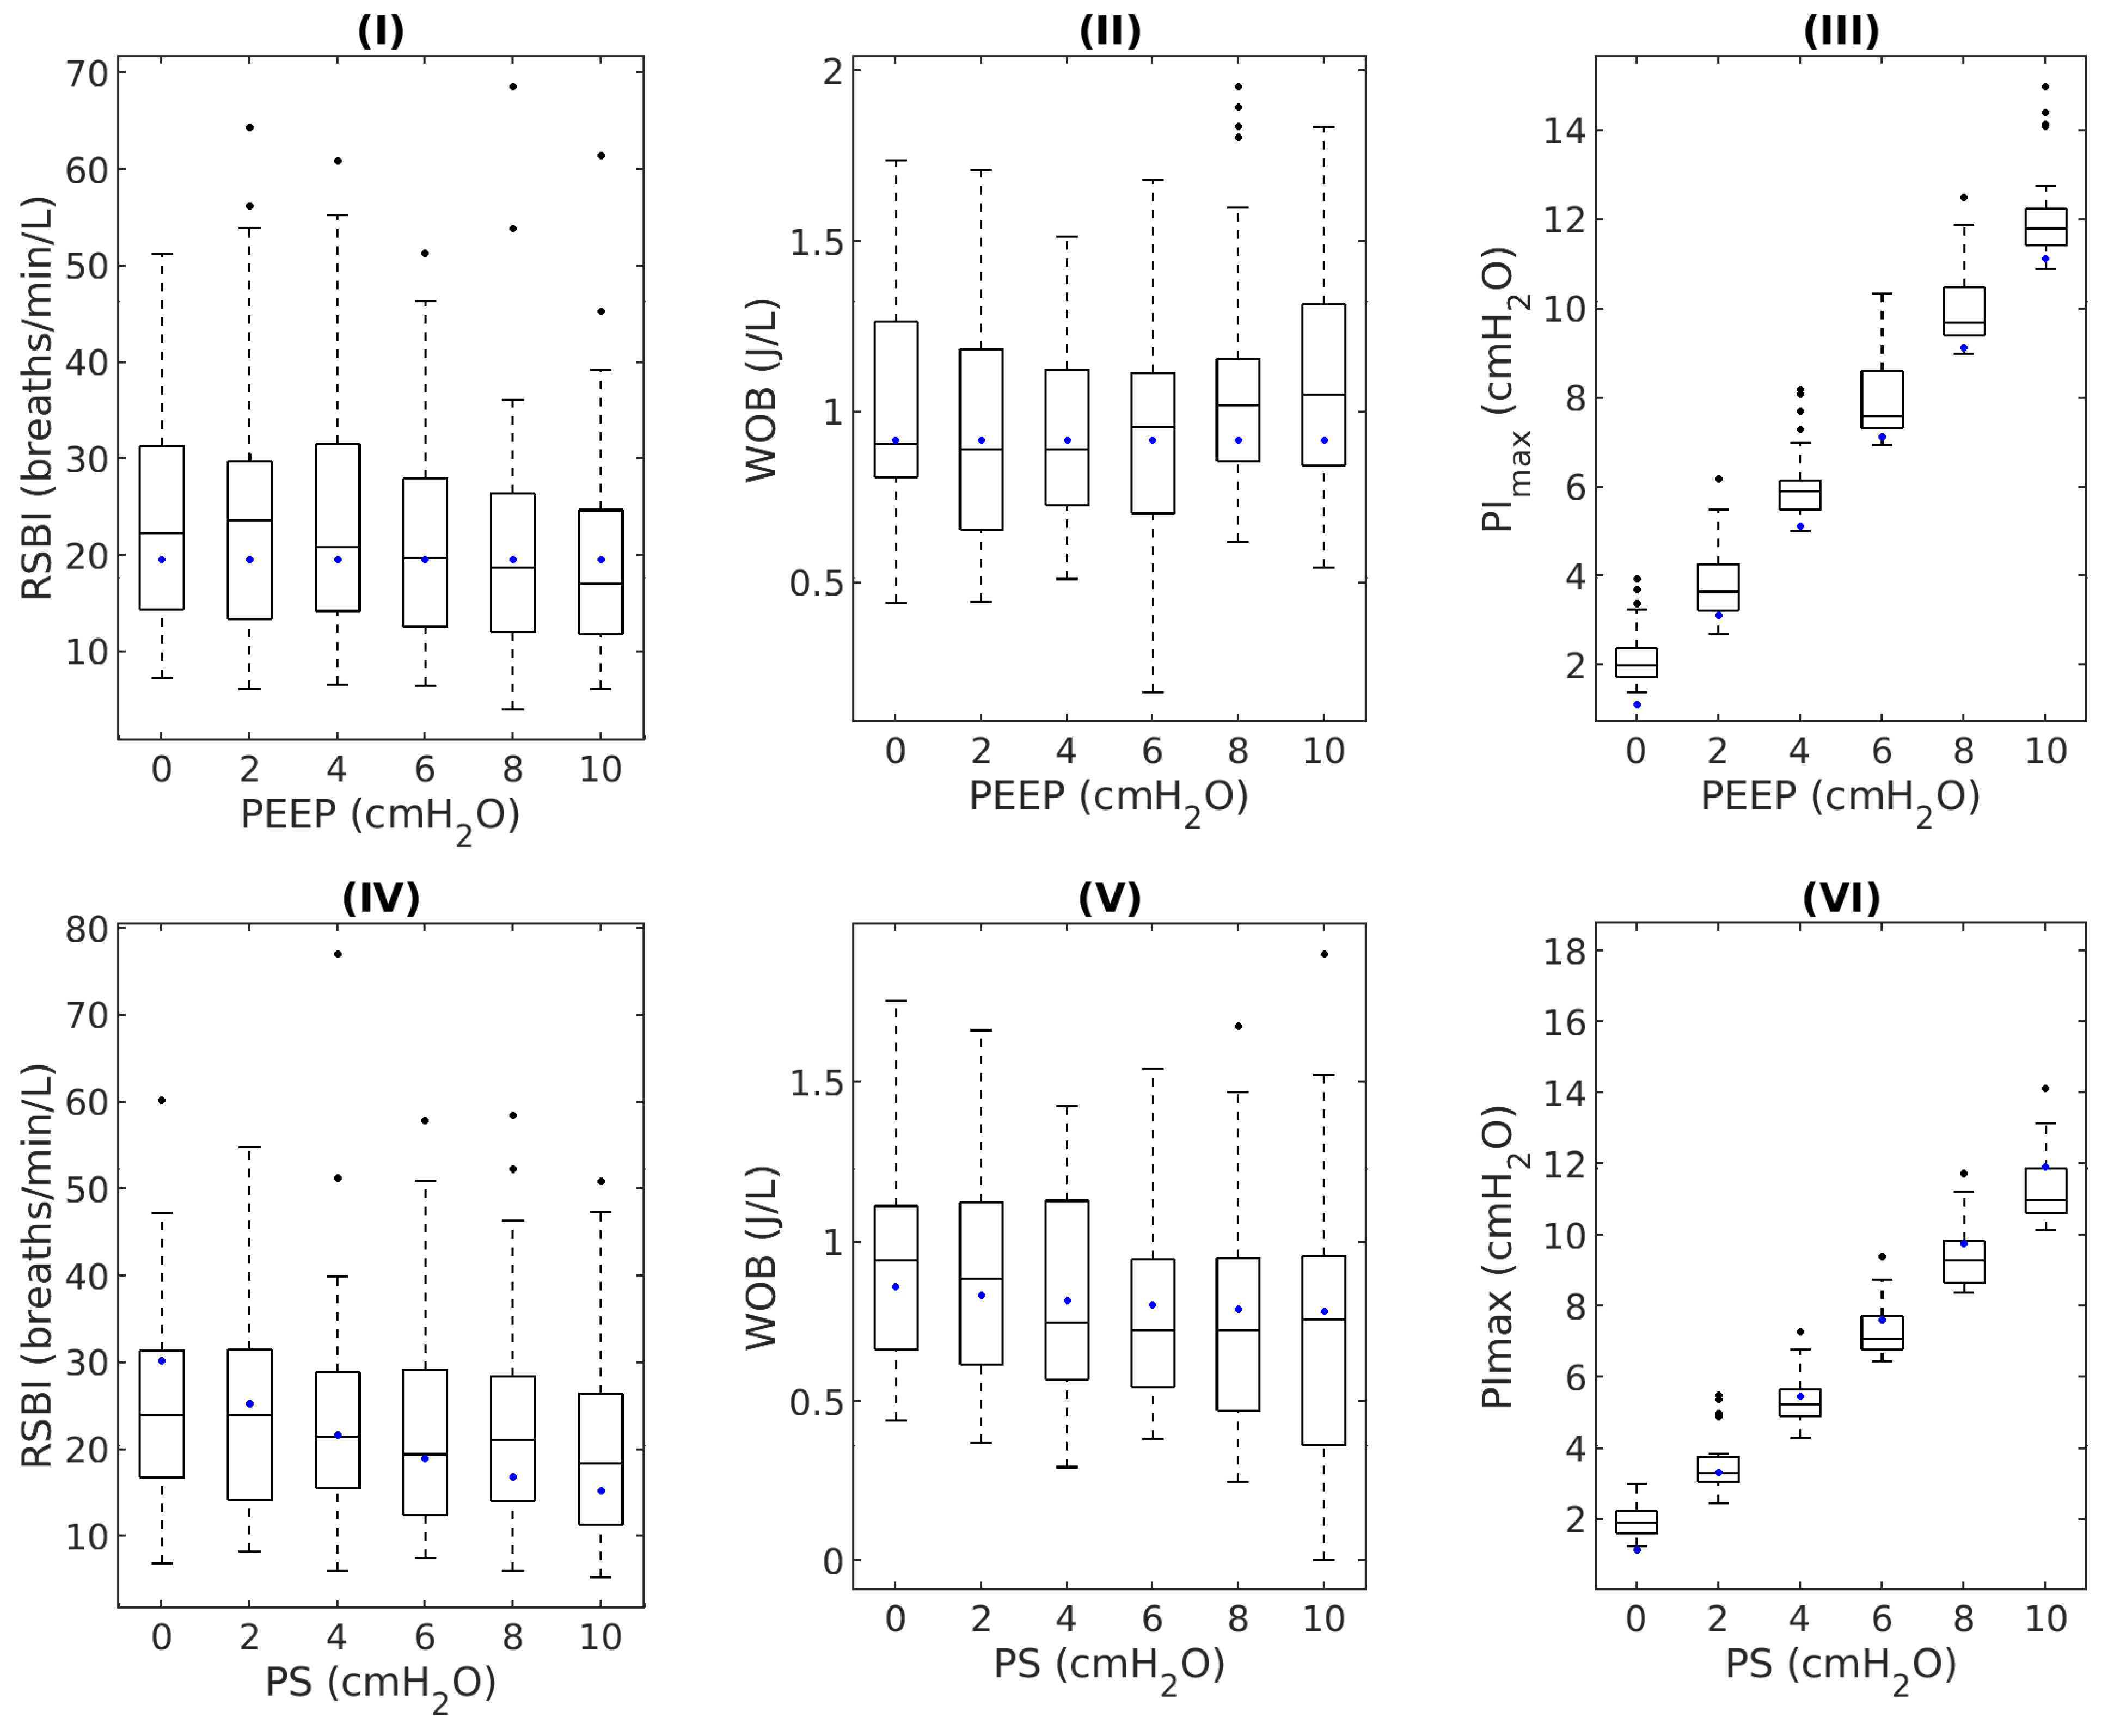
3.2.1. Statistical Analysis
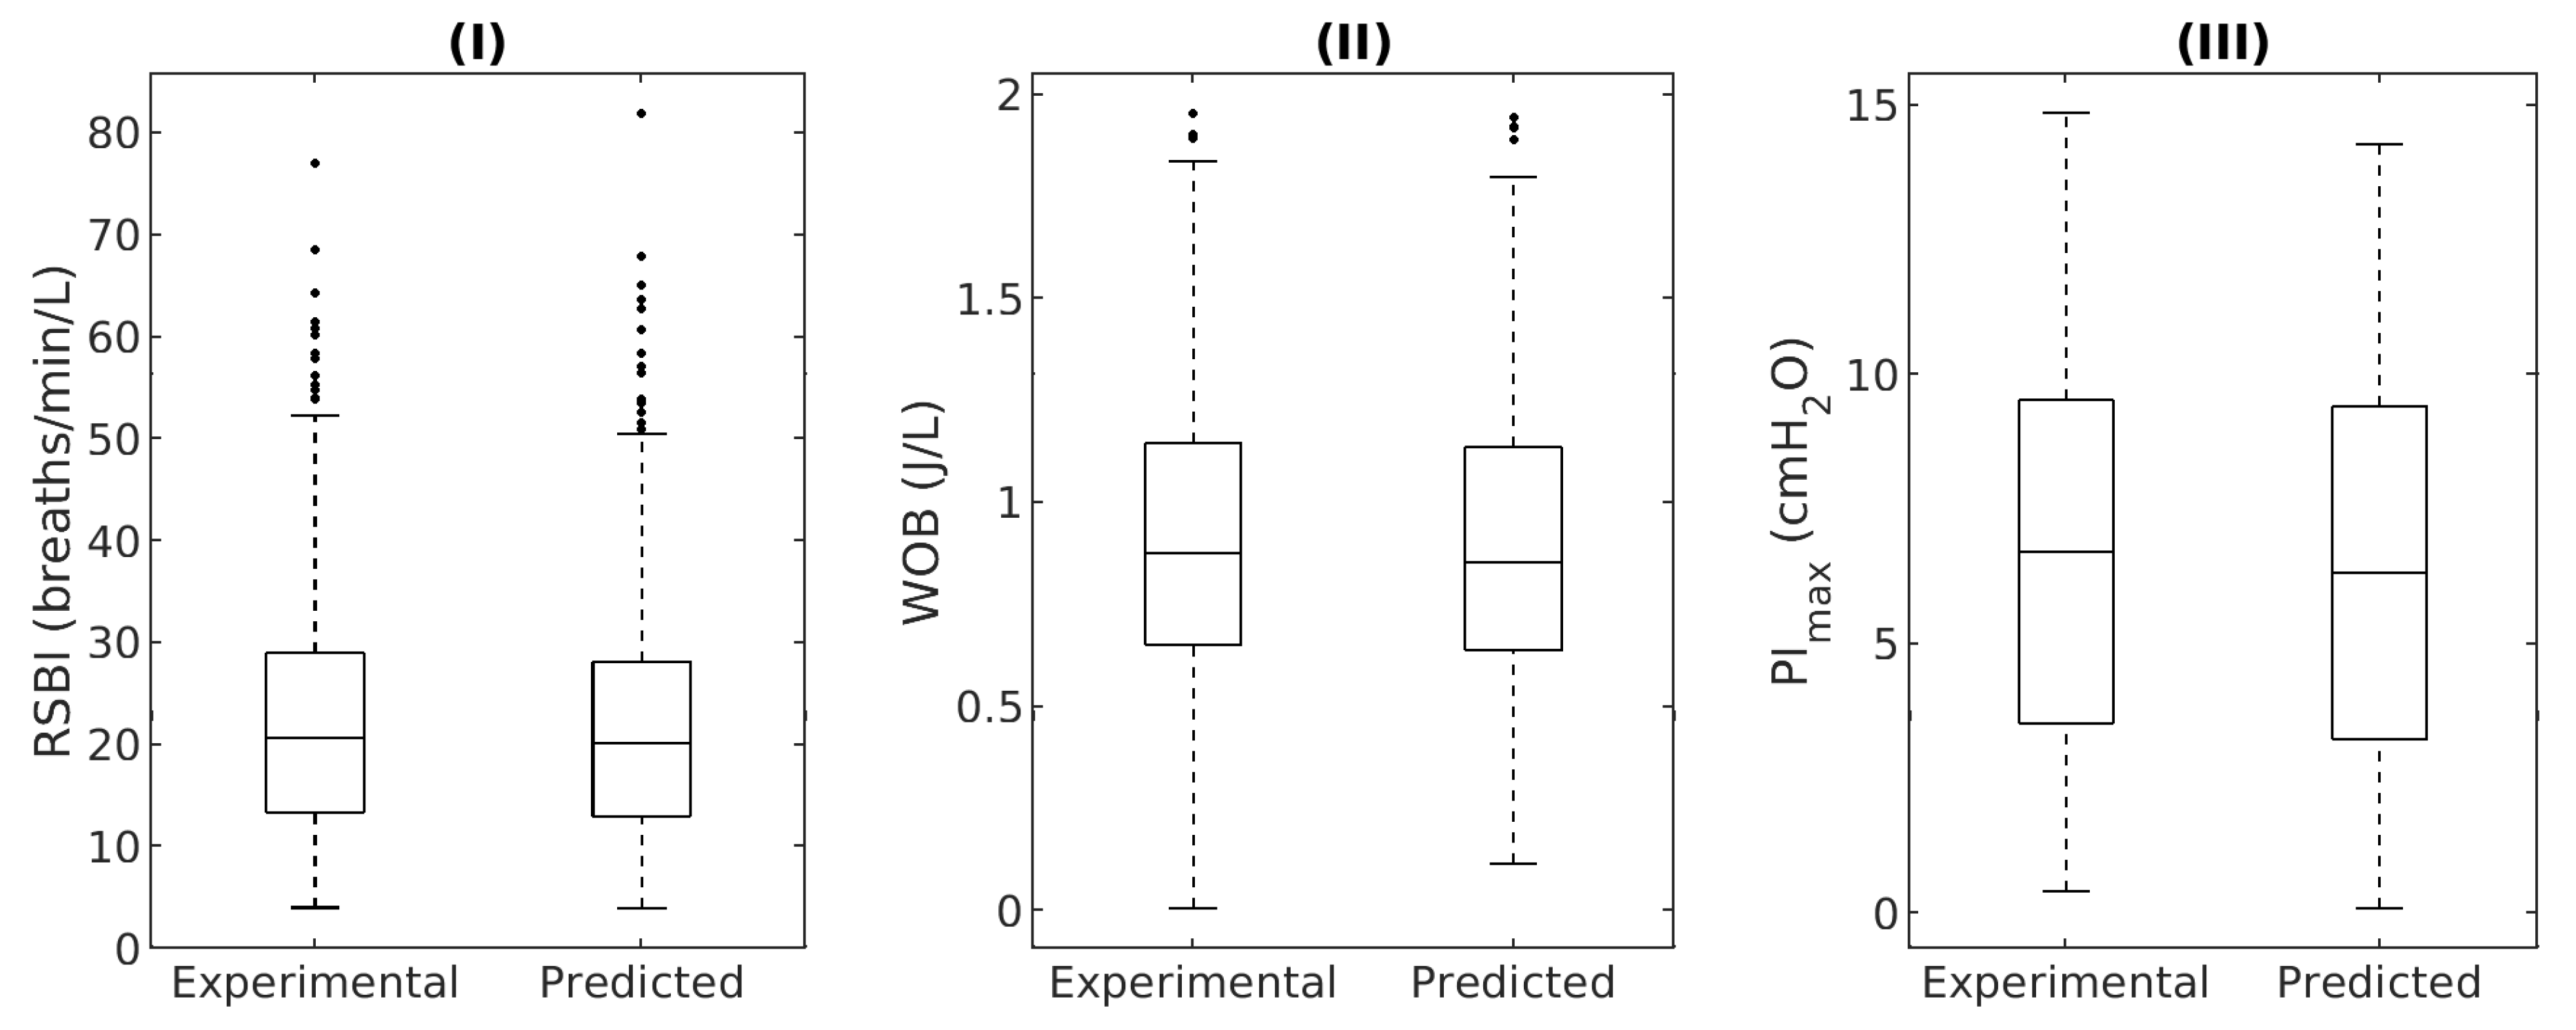
Population AnalysisFigure 7 presents the distribution of the RSBI, WOB, and PImax values obtained from six records at different values of PEEP and PS of 35 male volunteers. In addition, the RSBI, WOB, and PImax values predicted by the model are reported. The Figure shows that the response follows the trend marked by the population data as the pressure increases in spontaneous ventilation. In both Tests D and E, the work of breathing and the Tobin index predicted by the model are within the first and third quartiles. Furthermore, in some cases, including the PImax, some values are highly approximate to the median and, despite the dispersion of the experimental data, the models show very good fitting.

Individual Analysis

A total of 420 records were used to elaborate the comparative graphs of Figure 8, taking, as input parameters, the information of ventilatory mechanics, muscular effort, and the relationship between the inspiration and expiration time, measured in each variation of PEEP or PS, according to the test. The medians differ by 0.58 breaths/min/L (2.81% error), 0.02 J/L (2.52% error), and 0.40 cmH 2 O (6.02% error) for the RSBI, WOB, and, PImax, respectively, which suggests a good level of prediction. The median, the interquartile range from the predicted error distribution (calculated with Equation (2)), and the p-value between experimental predicted values are reported in Table 7.

3.2.2. Delphi Validation

The Delphi validation results regarding the sections and sub-sections of the application are presented in Table 8. The scores for all the modules show, in general, an adequate perception of their contents, but the obstructive pattern must be improved regarding the clinical evaluation.
The Delphi validation results regarding the evaluated aspects are presented in Table 9. For this classification, the results also show generally high scores, mainly regarding the graphic content.

4. Discussion

Modeling breathing dynamics is key to understanding the progression of many diseases, human performance, and the development of life support systems [25]. Guaranteed mathematical model outputs are required to avoid compromising derivative studies, so quantitative and qualitative research must be conducted. Real predicted comparison data was used for recent related studies [26,27], proving that it is a valid methodology for the respiratory system’s model statistical analysis. In addition, Chan [28] proves that Delphi validation techniques provide qualitative value information for validating the gathered and reviewed data.

4.1. Anatomy and Physiology Module

4.1.1. Statistical Analysis

The elastic and resistive properties of the respiratory system affect the volume and airflow since they intervene in the time constant τ , defined as the product between R and C that determines the rate of change of V ˙ and V when they are evaluated as a function of the ventilation time [29]. In addition, according to the equation of air motion, there is also a linear relationship between these variables, which is why they are the parameters that provide relevant information for evaluating ventilatory signals. This section presents an individual and a population analysis of the response of the mathematical models of the “Anatomy and Physiology” module, after variations in R and C, proving that it responds theoretically with the expressions above and expectedly at the physiological level.

Population Analysis

According to Figure 5, it is found that, regardless of the data dispersion, the linear regression of Tests A, B, and C follow the trend shown by the experimental data in each of the curves, suggesting a good prediction by the model in all cases.
As the airway resistance increases—represented mainly by the upper airway and the trachea, since they have a smaller cross-sectional area concerning the total area product of the lower branches—the gas flow that crosses the tracheobronchial tree decreases as a consequence of frictional losses [4]. This relationship is observed in Tests A, B, and C of Figure 5(I), so the model has a good response in the maximum flow value after changes in R. The small values on the slopes are due to the low rate of fluid loss. However, although the experimental data, as expected, also has a negative slope, its value is much lower than the model responses. This population’s tendency to maintain constant flow after changes in resistance may be a product of the natural response of the healthy subject maintaining the necessary flow for ventilation, since their respiratory muscles allow it (PImax and RR were those of each subject), unlike what happens in subjects with obstructive pathologies, such as EPOC [30,31]. This fact supports the statistically significant differences of the experimental data with Tests A, B, and C.
The magnitude of resistance to airflow also affects lung volume, as shown in Figure 5(II). When the lungs are inflated, the airways tend to open, reducing their resistance [32], so they are inversely proportional. Authors such as Briscoe et al. [33] have compared changes in airway resistance with changes in lung volume at different degrees of lung inflation using plethysmography in healthy men, women, and children, showing that the relationship between both variables is maintained regardless of physical characteristics. These results show the model responds according to expectations with VTmax due to its trend. In addition, the ratio of the slopes indicates a good approximation, as their values increase by a factor of three to compliance increments; see Figure 5(IV). This relation is because the compliance of the respiratory system is usually calculated as the relationship between changes in lung volume and airway pressure [34], so an increase in C results in an increase in volume, as verified by Suter et al. [35]. Therefore, considering the trends and slope values in Figure 5(IV), it is found that the model’s response is validated due to the volume behavior found in the DB, and at a theoretical level, is very similar, i.e., it follows the same trend.
To achieve flow, there must be a pressure difference between two points to overcome the frictional forces. Although the lung tissue’s elastic properties and the rib cage’s structures offer some degree of resistance, approximately 90% of the total resistance of the respiratory system is constituted by that exerted by the airways [36]. The elastic properties and their associated impedance do not represent a parameter that directly affects the airflow through the system. Tests A, B, and C in Figure 5(III) show that the model considers the losses caused by the impedance associated with the elastic and inertial load. However, according to the magnitude of the slopes of each trend (approximately zero in all cases), it is found that the changes in flow are minor as compliance increases, but greater as resistance becomes higher, which is theoretically consistent. The slope of the experimental data reflects the insignificant changes that the airflow undergoes as compliance increases, since in normal conditions, respiratory muscles easily overcome elastic resistance [29]. This airflow behavior is proved by statistically significant differences between experimental data and Tests A, B, and C.

Individual Analysis

The results obtained for V ˙ and VTmax show a good level of prediction due to the similarity between medians and the non-existence of statistically significant differences between the experimental and predicted values, as shown in Figure 6. However, the equations involved in the model do not consider that the respiratory cycle can be altered by reflexes that arise in the lungs, airways, and the cardiovascular system as a result of respiratory control exerted by the nervous system [37]. This reflex mechanism against variations in mechanical parameters, the error related to the experimental data due to electromyography techniques and obstructive maneuvers for signal acquisition, and the respiratory mechanics’ data variability reported in [20] all justify the errors presented in Table 4.
In the VTmax case (see Figure 6(I)), the predicted values do not exceed the normal inspiratory capacity, which is reported around 2500 mL [1], demonstrating that the application is compatible at a physiological level. Moreover, there are no over-peaks when physiologically consistent R, C, Pmusc, and RR values are entered. Studies by Nicolò et al. [38,39] suggest no direct relationship between respiratory rate and volume since ventilatory control responds under different stimuli in each case. Hence, the error is independent, as is presented in the first row of Table 4 after changes in the RR.
On the other hand, the amplitude of the predicted flow presents more significant variability with tendencies to high flows than the information collected in the DB (see Figure 6(II)), as result of the increase in RR, as evidenced in Table 4. The way RR is interpreted in mathematical models defines breathing dynamics and brings critical information for breathing characterization, so the parameter must be effectively evaluated [25].
In healthy subjects, when there is a difference from the normal breathing pattern, neuronal activity is modified, and appropriate changes in ventilation occur [40] because respiratory muscles allow them under normal conditions. When an obstructive disease occurs, such as asthma, subjects respond by increasing the RR by constantly maintaining minute ventilation—and, therefore, flow (in fluid dynamics, flow is defined as the mathematical derivative of volume over time [41], to which both ventilatory parameters are related)—to maintain ventilatory demand [42]. Therefore, using a database of healthy men is a limitation for this validation. Expanding the database with obstructive subjects will show more details and allow us to support the model validation.
However, when there is no significant increase in RR by the healthy subjects analyzed, the pair of experimental predicted values does not present a high error range because the closed-loop control does not intervene in the ventilatory variables.
Although a RR greater than 12 rpm is a limiting factor for the prediction due to the resulting high values that differ from the experimental data, in obstructive patients submitted to MV, a flow whose inspiratory peak is high is usually used to decrease the inspiratory time and increase the expiratory one, reducing the risk of auto-PEEP [34]. Thus, it can be deduced that the model responds adequately to physiological considerations where neuronal control is not involved, as previously mentioned.

4.1.2. Delphi Validation

The results obtained for this module can be considered satisfactory because the scores for each sub-section are greater than or equal to 4.00. The lowest score was obtained for the equation of air motion sub-section. The recommendations for improvement involve incorporating the units in the equation, examples, and a further description of the terms. Regarding the evaluation based on the type of content, the scores also exceeded 4.00. The lowest score was obtained for the relevance aspect and is related to the need for greater accuracy of the descriptions. The associated recommendations focus on the greater detail of the main concepts.

4.2. Work of Breathing Indexes Model

4.2.1. Statistical Analysis

The main objective of MV is to increase the gas exchange and reduce the respiratory effort, or the respiratory muscles’ load, produced by variations in R or C due to restrictive or obstructive pathologies [43]. This load can be measured by indexes related to weaning success, such as RSBI, WOB, and PImax.

Population Analysis

The relation between changes in the MV setting and the RSBI, WOB and, PImax indexes was depicted in Figure 7. The changes assessed were PEEP and PS increments, so as to know the response to changes in respiratory muscles’ loads in a population of healthy men and the response of the predictive model.
PEEP is defined as the positive end-expiratory pressure, and it is detected as an offset in the pressure measured in the mouth. In physiological terms, PEEP is used for alveolar recruitment, raising C and lung capacity [44]. Increases in PEEP improve the gas exchange because they make more alveolar units available [45]. Pelosi et al. [46] analyzed changes in C and the level of oxygenation of healthy and obese subjects under PEEP stimuli of 0 cmH 2 O and 10 cmH 2 O. They found considerable oxygenation improvements and C increments only in PEEP of 10 cmH 2 O and pathological situations, concluding that PEEP does not have a relevant effect when it comes to subjects without obstructive, restrictive, or cardiopulmonary problems. Therefore, both the experimental and predicted RSBI and WOB values (Figure 7(I),(II), respectively) do not present a marked effect as pressure increases.
PS can be remarkably effective in reducing patient effort, avoiding respiratory distress, and can offer a comfortable ventilator support to many patients [47]. Studies with healthy subjects have shown the PS effect for WOB [48] and RSBI decreases [49], just as the results for the predicted and experimental data in Figure 7(IV),(V) suggest.
The PImax increases proportionally under PEEP (Figure 7(III)) and PS (Figure 7(VI)) stimuli, although it does not exceed the muscular overexertion threshold product of the healthy condition of the subjects. In both cases, the increases in each group of data are equivalent to the added pressure value with respect to to the basal state (PEEP and PS = 0 cmH 2 O), due to the fact that the mechanical ventilator applies both pressures, increasing pressure at the mouth (Pao) and consequently increasing airway pressure [24,50,51].

Individual Analysis

The similarities in both the experimental and predicted distribution data of Figure 8, the non-existence of statistically significant differences between both values, and the low percentage of error shown in Table 7 (less than 23%) prove the good level of prediction by the models involved, including the non-dependence on input parameters as long as they are consistent at a physiological level.
The index with the highest error percentage was the PImax, which may be a product of the difficulty in the measurement reported by the ATS/ERS and confirmed by some studies [24,52]. There is a dependence on the participants’ complete collaboration.

4.2.2. Delphi Validation

The results obtained as a function of the sections and sub-sections of the application generally showed high scores, with the “Work Indexes” and “Mixed Pattern” sections standing out as those with the highest median scores. The lowest score was obtained for the “Obstructive Pattern” section, and was related to its clinical evaluation. From the evaluators’ comments, it is identified that the case needs to be modified by another with more appropriate variable values and diagnostic tools.
For the “Restrictive Pattern” section, some of the evaluators agree that the information of the round presented for the clinical case may be confusing and incomplete. This fact is reflected in the score obtained for the clinical evaluation sub-section (4.40 (3.58–4.88)); concerning the diagnostic tests sub-section, the evaluators consider that the values given by arterial blood gas do not correspond to a patient with restrictive failure.
Finally, the “Mixed Pattern” section achieved good scores for all its sub-sections. However, for the diagnostic tests sub-section, some evaluators consider that arterial blood gas results do not correspond to a patient with a mixed pattern, which is why it is recommended to carry out a conduct review of these values.
Concerning the classification by evaluated aspects, given that the scores obtained in median exceeded 4.25, it can be considered an adequate perception of the evaluators. The graphic content for this module stands out for the best scores, mainly concerning the aspects of order and veracity. The lowest score was obtained regarding the sufficiency of the theoretical content and is related to selecting complete and better-defined clinical cases.

5. Conclusions

In this article, the statistical validation of the ventilatory signals in the “Anatomy and Physiology” module and the ventilatory indexes in the “Work of Breathing” module, in conjunction with Delphi validations, is presented. All the methods demonstrate the accuracy and precision of the involved systems, which validates the application for respiratory system teaching.
For both modules, the population analysis showed that the models responded as expected in physiological terms for the studied variables ( V ˙ and VTmax in the “Anatomy and Physiology” module, and RSBI, WOB and PImax in the “Work of Breathing” module). Flow and volume behave consistently with the expressions that describe ventilatory dynamics in healthy subjects after variations in R and C, without including compensations made by the nervous control system when RR increases, which makes it a limiting parameter; furthermore, the ventilatory indexes follow the expected trend according to the population response where PEEP and PS are increased. On the other hand, the individual analysis showed that both applications have a low percentage of error between the experimental and predicted data pair when they are analyzed under consistent physiological conditions.
As with any other validation study, increasing the DB, including women and children, could yield more information regarding the faculties of the models involved to achieve a significant decrease in the limitations and guarantee that the result is independent of the anthropometric characteristics of the simulated subject.
The results obtained from the Delphi validation evidenced an adequate concept of the content of the modules. The scores obtained demonstrated, in both a general and specific way for the modules and aspects evaluated, a good conception by specialists.
The main improvement options were identified for the ventilation section of the “Anatomy and Physiology” module, and the “Obstructive Pattern” sub-module of the “Work of Breathing Indexes” module. The reasons and improvements in both cases are mainly related to more detailed descriptions, including examples, and better-defined clinical cases.

Author Contributions

Conceptualization, S.M., I.C.M., L.Y.S., C.L.B. and C.A.S.; methodology, S.M. and I.C.M.; software, I.C.M. and L.Y.S.; formal analysis, S.M., I.C.M. and L.Y.S.; investigation, S.M., I.C.M. and L.Y.S.; data curation, S.M. and C.L.B.; writing—original draft preparation, S.M. and C.L.B.; writing—review and editing, S.M., I.C.M, L.Y.S., C.A.S., C.L.B. and A.M.H.; supervision, A.M.H.; project administration, A.M.H.; funding acquisition, A.M.H. All authors have read and agreed to the published version of the manuscript.

Funding

This research was funded by Sistema General de Regalías fondos de CTeI de la Gobernación de Antioquia, a través del patrimonio autónomo fondo nacional de financiamiento para la ciencia, la tecnología y la innovación francisco José de Caldas: FP44842-450-2018 “Desarrollo de aplicaciones móviles para el aprendizaje del sistema respiratorio: Conceptos básicos, diagnóstico de enfermedades, terapia y rehabilitación”.

Institutional Review Board Statement

The study was conducted according to the guidelines of the Declaration of Helsinki, and approved by the Ethics Committee of University of Antioquia, Approval report 15-59-664. The extra information of Data Base is detailed in [4,20].

Informed Consent Statement

Informed consent was obtained from all subjects involved in the study. The details of data base is in [4,20].

Conflicts of Interest

The authors declare no conflict of interest.

Abbreviations

The following abbreviations are used in this manuscript:
CRespiratory system compliance
CcwChest wall compliance
CLDynamic lung compliance
DBDatabase
MVMechanical ventilation
PaoPressure at the airway opening
PEEPPositive end-expiratory pressure
PImaxMaximal inspiratory pressure
PmuscPressure developed by respiratory muscles
PSPressure support ventilation
PSVPressure support ventilation
RRespiratory system resistance
RawAirway resistance
RRRespiratory rate
RSBIRapid shallow breathing index or Tobin Index
VVolume
VTTidal volume
VTmaxMaximal tidal volume
V ˙ Airflow
WOBWork of breathing

References

  1. Barret, K.E.; Barman, S.M.; Boitano, S.; Brooks, H. GANONG Fisiología médica, 24th ed.; McGraw-Hill: Mexico City, Mexico, 2012. [Google Scholar]
  2. Kasper, D.; Fauci, A.; Hauser, S.; Longo, D.; Jameson, J.L.; Loscalzo, J. Harrison. Principios de Medicina Interna, 19th ed.; McGraw-Hill: New York, NY, USA, 2016. [Google Scholar]
  3. Tulaimat, A.; Patel, A.; Wisniewski, M.; Gueret, R. The validity and reliability of the clinical assessment of increased work of breathing in acutely ill patients. J. Crit. Care 2016, 34, 111–115. [Google Scholar] [CrossRef] [PubMed]
  4. Ortega, Y.M.; Muñoz, I.C.; Hernández, A.M. Work of Breathing Dynamics under Changes of PEEP and Pressure Support in Non-invasive Mechanical Ventilation. In Applied Computer Sciences in Engineering; Springer: Cham, Switzerland, 2018; pp. 408–417. [Google Scholar]
  5. Grinnan, D.C.; Truwit, J.D. Clinical review: Respiratory mechanics in spontaneous and assisted ventilation. Crit. Care 2005, 9, 472–484. [Google Scholar] [CrossRef] [Green Version]
  6. Yang, K.L.; Tobin, M.J. A Prospective Study of Indexes Predicting the Outcome of Trials of Weaning from Mechanical Ventilation. N. Eng. J. Med. 1991, 324, 1445–1450. [Google Scholar] [CrossRef] [PubMed]
  7. Sachs, M.C.; Enright, P.L.; Stukovsky, K.D.; Jiang, R.; Barr, R.G. Performance of maximum inspiratory pressure tests and maximum inspiratory pressure reference equations for 4 race/ethnic groups. Respir. Care 2009, 54, 1321–1328. [Google Scholar] [PubMed]
  8. Naureckas, E.T.; Solway, J. Disturbances of Respiratory Function. In Harrison’s Principles of Internal Medicine, 20th ed.; McGraw-Hill Education: New York, NY, USA, 2018; Chapter 279. [Google Scholar]
  9. Levitzky, M.G. Mechanics of Breathing. In Pulmonary Physiology, 9th ed.; McGraw-Hill Education: New York, NY, USA, 2017; Chapter 2. [Google Scholar]
  10. Lipscombe, T.C.; Mungan, C.E. Breathtaking Physics: Human Respiration as a Heat Engine. Phys. Teach. 2020, 58, 150–151. [Google Scholar] [CrossRef]
  11. García-Prieto, E.; Amado-Rodríguez, L.; Albaiceta, G. Monitorization of respiratory mechanics in the ventilated patient. Med. Intensiv. (Engl. Ed.) 2014, 38, 49–55. [Google Scholar] [CrossRef] [PubMed]
  12. Ferro, C.; Matínez, A.I.; Otero, M.C. Ventajas del uso de las TICs en el proceso de enseñanza-aprendizaje desde la óptica de los docentes universitarios españoles. Edutec. Rev. Electrón. Tecnol. Educ. 2009, 29, 127–145. [Google Scholar] [CrossRef]
  13. Arenas Márquez, F.J.; Domingo Carillo, M.A.; Molleda Jimena, G.; Ríos Martín, M.A.; Ruiz del Castillo, J.C. Aprendizaje interactivo en la educación superior a través de sitios web. Un estudio empírico. Pixel-Bit. Rev. Medios Educ. 2009, 35, 127–145. [Google Scholar]
  14. Sargent, R.G. Verification and validation of simulation models. In Proceedings of the Winter Simulation Conference, Syracuse, NY, USA, 5–8 December 2010. [Google Scholar]
  15. Hillston, J. Model Validation and Verification. In Teaching Notes; Technical Report; The University of Edinburgh Scotland: Edinburgh, UK, 2003. [Google Scholar]
  16. Rozanek, M.; Roubik, K. Design of the Mathematical Model of the Respiratory System Using Electroacoustic Analogy. Int. J. Math. Comput. Physical Electri. Comput. Eng. 2008, 2, 783–786. [Google Scholar]
  17. Heili Frades, S.; Peces Barba, G.; Rodríguez Nieto, M.J. Design of a Lung Simulator for Teaching Lung Mechanics in Mechanical Ventilation. Arch. Bronconeumol. 2007, 43, 674–679. [Google Scholar] [CrossRef]
  18. Al-Naggar, N.Q. Modelling and Simulation of Pressure Controlled Mechanical Ventilation System. Biomed. Sci. Eng. 2015, 8, 707–716. [Google Scholar] [CrossRef] [Green Version]
  19. Rodrigues, A.; Da Silva, L.M.; Berton, D.C.; Cipriano, G.; Pitta, F.; O’Donnell, D.E.; Neder, J.A. Maximal Inspiratory Pressure: Does the Choice of Reference Values Actually Matter? Chest 2017, 152, 32–39. [Google Scholar] [CrossRef] [PubMed]
  20. Muñoz, I.C.; Hernández, A.M. Respiratory muscular response to obstructive maneuvers in non-invasively ventilated healthy subjects. Respir. Physiol. Neurobiol. 2018, 258, 76–81. [Google Scholar] [CrossRef] [PubMed]
  21. Daza Lesmes, J. Evaluación Clínico-Funcional del Movimiento Corporal Humano; Editorial médica Panamericana: Colombia, Bogotá, 2007. [Google Scholar]
  22. Paramothayan, S. Essential Respiratory Medicine; Wiley: Hoboken, NJ, USA; Blackwell: Hoboken, NJ, USA, 2019. [Google Scholar]
  23. Grippi, M.A.; Elias, J.; Fishman, J.A.; Kotloff, R.M.; Pack, A.I.; Senior, R.M.; Siegel, M.D. Fishman’s Pulmonary Diseases and Disorders, 5th ed.; McGraw-Hill: New York, NY, USA, 2015. [Google Scholar]
  24. American Thoracic Society/European Respiratory Society. ATS/ERS Statement on Respiratory Muscle Testing. Am. J. Respir. Crit. Care Med. 2002, 166, 518–624. [Google Scholar] [CrossRef] [PubMed]
  25. Napoli, N.J.; Rodrigues, V.R.; Davenport, P.W. Characterizing and Modeling Breathing Dynamics: Flow Rate, Rhythm, Period, and Frequency. Front. Physiol. 2022, 12, 2305. [Google Scholar] [CrossRef] [PubMed]
  26. Chung, J.; Lee, K. A Comparison of the Validity of Three Exercise Tests for Estimating Maximal Oxygen Uptake in Korean Adults Aged 19–64 Years. Appl. Sci. 2022, 12, 1371. [Google Scholar] [CrossRef]
  27. Tamburrano, P.; Sciatti, F.; Distaso, E.; Lorenzo, L.D.; Amirante, R. Validation of a Simulink Model for Simulating the Two Typical Controlled Ventilation Modes of Intensive Care Units Mechanical Ventilators. Appl. Sci. 2022, 12, 2057. [Google Scholar] [CrossRef]
  28. Chan, P. An Empirical Study on Data Validation Methods of Delphi and General Consensus. Data 2022, 7, 18. [Google Scholar] [CrossRef]
  29. Hess, D.R. Respiratory Mechanics in Mechanically Ventilated Patients. Respir. Care 2014, 59, 1773–1794. [Google Scholar] [CrossRef] [Green Version]
  30. García Río, F.; Lores, V.; Rojo, B. Evaluación funcional respiratoria (obstrucción y atrapamiento). Arch. Bronconeumol. 2007, 43, 8–14. [Google Scholar] [CrossRef]
  31. Sauleda Roig, J. Consecuencias clínicas de la disfunción muscular en la enfermedad pulmonar obstructiva crónica. Nutr. Hosp. 2006, 21, 69–75. [Google Scholar] [PubMed]
  32. García Prieto, E.; Amado Rodríguez, L.; Albaiceta, G.M. Monitorización de la mecánica respiratoria en el paciente ventilado. Puesta Med. Intensiv. Vent. Mec. Difer. Entid. 2014, 38, 49–55. [Google Scholar] [CrossRef]
  33. Briscoe, W.A.; Dubois, A.B. The relationship between airway resistance, airway conductance and lung volume in subjects of different age and body size. J. Clin. Investig. 1958, 37, 1279–1285. [Google Scholar] [CrossRef] [Green Version]
  34. Hagberg, C.A. Benumof and Hagberg’s Airway Management; Elsevier: Amsterdam, The Netherlands, 2013. [Google Scholar]
  35. Suter, P.M.; Fairley, H.B.; Isenberg, M.D. Effect of Tidal Volume and Positive End-Expiratory Pressure on Compliance during Mechanical Ventilation. Chest 1978, 73, 158–162. [Google Scholar] [CrossRef] [PubMed]
  36. Chiappero, G.R.; Ríos, F.; Setten, M. Ventilación Mecánica, 3rd ed.; Editorial Médica Panamericana: Bogotá, Colombia, 2018. [Google Scholar]
  37. Raff, H.; Levitzky, M. Fisiología Médica. Un Enfoque por Aparatos y Sistemas; McGraw-Hill Interamericana de España: New York, NY, USA, 2013. [Google Scholar]
  38. Nicolò, A.; Marcora, S.; Bazzucchi, I.; Sacchetti, M. Differential control of respiratory frequency and tidal volume during high-intensity interval training. Exp. Physiol. 2017, 102, 934–949. [Google Scholar] [CrossRef] [PubMed]
  39. Nicolò, A.; Girardi, M.; Sacchetti, M. Control of the depth and rate of breathing: Metabolic vs. non-metabolic inputs. J.Physiol. 2017, 595, 6363–6364. [Google Scholar] [CrossRef] [Green Version]
  40. García, F. Control de la respiración. Arch. Bronconeumol. 2017, 40, 14–20. [Google Scholar] [CrossRef] [PubMed]
  41. Monpín, J. Introducción a la Bioingeniería; Marcombo Boixareu Editores: Barcelona, Spain, 1988. [Google Scholar]
  42. Buchanan, G.F. Timing, Sleep, and Respiration in Health and Disease. In Progress in Molecular Biology and Translational Science; Elsevier: Amsterdam, The Netherlands, 2013; Chapter 8. [Google Scholar]
  43. Alexander, P. Respiratory Physiology for Intensivists. In Critical Heart Disease in Infants and Children; Elsevier: Amsterdam, The Netherlands, 2019; pp. 134–149.e2. [Google Scholar]
  44. Muñoz, I.C.; Hernández, A.M. Cambios en la mecánica ventilatoria debidos a variaciones de la PEEP y la presión soporte: Estudio en sujetos sanos bajo ventilación mecánica no invasiva. Rev. Fac. Med. 2017, 65, 321–328. [Google Scholar] [CrossRef]
  45. Sahetya, S.K.; Goligher, E.C.; Brower, R.G. FiftyYearsofResearchinARDS.Setting Positive End-Expiratory Pressure in Acute Respiratory Distress Syndrome. Am. J. Respir. Crit. Care Med. 2017, 195, 1429–1438. [Google Scholar] [CrossRef] [PubMed]
  46. Pelosi, P.; Ravagnan, I.; Giurati, G.; Panigada, M.; Bottino, N.; Tredici, S.; Eccher, G.; Gattinoni, L. Positive End-expiratory Pressure Improves Respiratory Function in Obese but not in Normal Subjects during Anesthesia and Paralysis. Anesthesiology 1999, 91, 1221. [Google Scholar] [CrossRef] [PubMed]
  47. Tobin, M. Principles and Practice of Mechanical Ventilation; McGraw-Hill Medical: New York, NY, USA, 2013. [Google Scholar]
  48. Fiastro, J.F.; Habib, M.P.; Quan, S.F. Pressure Support Compensation for Inspiratory Work due to Endotracheal Tubes and Demand Continuous Positive Airway Pressure. Chest 1988, 93, 499–505. [Google Scholar] [CrossRef] [Green Version]
  49. Meza, S.; Mendez, M.; Ostrowski, M.; Younes, M. Susceptibility to periodic breathing with assisted ventilation during sleep in normal subjects. J. Appl. Physiol. 1998, 85, 1929–1940. [Google Scholar] [CrossRef] [PubMed] [Green Version]
  50. Lumb, A.B. Respiratory Support and Artificial Ventilation. In Nunn’s Applied Respiratory Physiology; Elsevier: Amsterdam, The Netherlands, 2017; pp. 451–478. [Google Scholar]
  51. Naik, S.; Greenough, A.; Giffin, F.J.; Baker, A. Manoeuvres to elevate mean airway pressure, effects on blood gases and lung function in children with and without pulmonary pathology. Eur. J. Pediatr. 1998, 157, 309–312. [Google Scholar] [CrossRef] [PubMed]
  52. Baptistella, A.R.; Sarmento, F.J.; da Silva, K.R.; Baptistella, S.F.; Taglietti, M.; Zuquello, R.Á.; Filho, J.R.N. Predictive factors of weaning from mechanical ventilation and extubation outcome: A systematic review. J. Crit. Care 2018, 48, 56–62. [Google Scholar] [CrossRef] [PubMed]
Figure 1. Simplified system of the application’s interactivity, emphasizing the input parameters and the output predicted values.
Applsci 12 04289 g001
Figure 2. Graphical interface of the “Anatomy and Physiology” module with its sections: (I) equation of motion, (II) anatomy description and information, (III) ventilatory signals, and (IV) user controls.
Applsci 12 04289 g002
Figure 3. Graphical interface of the “Work of Breathing” module with its sections: (I) assessment of dyspnea, (II) Campbell diagram, (III) ventilatory indexes and, in red, the thresholds indicating high muscle effort, and (IV) user controls.
Applsci 12 04289 g003
Figure 4. Methodology diagram for the statistical validation of both modules for the population and individual analyses, which differ in the input values and the comparison data.
Applsci 12 04289 g004
Figure 5. Airflow ( V ˙ ) and tidal volume (VTmax) variations to changes in R (graphs I and II) and C (graphs III and IV). Values for V ˙ and VTmax are shown as changes regarding the basal value of each subject (i.e., variable values without applying any obstructions). Population curves emphasizing the experimental data are marked in blue. The curves of Tests A, B, and C were constructed using fixed values for C (graphs I and II) and R (graphs III and IV), corresponding to quartiles Q1, Q2, and Q3 of the experimental data. For all tests, Pmusc was set to 8 cmH 2 O and RR to 12 bpm. Solid lines denote the linear fits of each group for (I) Δ V ˙ vs. Δ R ; (II) Δ V T m a x vs. Δ R ; (III) Δ V ˙ vs. Δ C ; (IV) Δ V T m a x vs. Δ C .
Applsci 12 04289 g005
Figure 6. Boxplot constructed with the ventilatory parameters of each subject for the (I) maximum volume and (II) maximum amplitude of the flow.
Applsci 12 04289 g006
Figure 7. Resulting population distribution for Test D (upper row with PS = 0 cmH 2 O) and Test E (lower row with PEEP = 0 cmH 2 O), showing the experimental information obtained from the DB in black and the response of the model to input parameters (medians of I: E, R, C, Pmusc and RR reported in Table 2) in blue dots for (I) and (IV) Tobin Index; (II) and (V) Work of breathing; (III) and (VI) Maximal inspiratory pressure.
Applsci 12 04289 g007
Figure 8. Comparison between experimental data and the predicted results produced by the models, according to input parameters of I: E, RR, Pmusc, C, and R of each subject for (I) RSBI, (II) WOB, and (III) PImax.
Applsci 12 04289 g008
Table 1. Median and interquartile ranges of ventilatory mechanics data for obstructive DB.
Ventilatory MechanicsValues
R (cmH 2 O/L/s)13.86 (9.06–21.33)
C (mL/cmH 2 O)73.26 (57.62–88.33)
Pmusc (cmH 2 O)15.78 (12.45–21.81)
RR (bpm)13.58 (10.50–17.38)
Table 2. The median and interquartile range of the MV parameters and ventilatory mechanics of the subjects in Test D and E in DB PS/PEEP.
ParameterTest DTest E
PEEP (cmH 2 O)0, 2, 4, 6, 8, 100
PS (cmH 2 O)00, 2, 4, 6, 8, 10
I:E1 : 0.83 (0.73–0.92)1 : 0.83 (0.75–0.93)
R (cmH 2 O/L/s)9.67 (7.62–12.57)12.27 (9.11–15.01)
C (mL/cmH 2 O)99.68 (80.00–139.42)74.99 (61.20–89.97)
Pmusc (cmH 2 O)12.32 (9.07–16.12)11.58 (8.65–15.48)
RR (bpm)15.28 (12.17–17.40)15.98 (13.26–19.24)
Table 3. Median, interquartile range, and slope for each dataset in the population analysis for the “Anatomy and Physiology” module.
CurveTestSlopeMedianInterquartile RangeData Units
Δ V ˙ vs. Δ R Exp. data−0.01−0.12(−0.28–0.00)L/s
A *−0.05−0.44(−0.85–−0.23)
B *−0.05−0.42(−0.81–−0.22)
C *−0.04−0.40(−0.77–−0.21)
Δ V T m a x vs. Δ R Exp. data−3.89−28.87(−101.08–111.33)mL
A−5.85−43.17(−80.78–−12.06)
B *−8.89−72.53(−131.00–−25.20)
C *−11.80−105.58(−181.39–−41.55)
Δ V ˙ vs. Δ C Exp. data0.000.11(−0.12–0.28)L/s
A *0.00−0.11(−0.17–−0.06)
B *0.00−0.08(−0.12–−0.04)
C *0.00−0.05(−0.07–−0.03)
Δ V T m a x vs. Δ C Exp. data1.538.86(−75.35–136.12)mL
A *4.55170.45(85.88–290.27)
B *3.05144.09(73.11–248.05)
C1.82114.28(55.40–185.60)
* Cases where statistically significant differences were found by the Kruskal-Wallis test.
Table 4. Tabulated errors between experimental and predicted data for the “Anatomy and Physiology” module.
ParameterRR ConditionMedian (%)Interquartile Range (%)n (Subjects)
VTmaxRR ≥ 12 bpm9.26(4.72–17.68)77
RR < 12 bpm10.38(5.07–19.57)45
Total9.54(4.80–18.18)122
V ˙ RR ≥ 12 bpm31.01(14.78–65.57)77
RR < 12 bpm22.62(12.54–37.52)45
Total25.38(13.15–51.35)122
Table 5. Delphi validation results of the “Anatomy and Physiology” module, organized by sections and sub-sections and scored from 1 to 5.
SectionSub-SectionScoren (Evaluated Items)
VentilationEquation of motion4.00 (3.95–4.30)6
Anatomy4.60 (4.20–4.80)7
Ventilatory signals4.80 (4.60–5.00)26
Controls4.50 (4.25–4.80)8
Table 6. Delphi validation results of the “Anatomy and Physiology” model, organized by aspects evaluated and scored from 1 to 5.
Content TypeAspectScoren (Evaluated Items)
TheoreticalRelevance4.30 (4.05–4.85)4
Sufficience4.80 (4.15–4.80)14
Veracity4.60 (4.50–4.85)6
Table 7. Percentage of error and p-values between experimental and predicted data for each of the evaluated indexes of the “Work of Breathing Indexes” module.
Indexp-ValueMedian (%)Interquartile Range (%)
RSBI0.436.55(3.04–11.49)
WOB0.439.33(3.84–18.40)
PImax0.3211.77(5.31–23.00)
Table 8. Delphi validation results of the “Work of Breathing Indexes” module, organized by modules and sub-modules and scored from 1 to 5.
SectionSub-SectionScoren (Evaluated Items)
Work IndexesAssessment of dyspnea5.00 (4.60–5.00)40
Campbell diagram5.00 (4.50–5.00)17
Ventilatory indexes5.00 (4.80–5.00)43
Obstructive PatternClinical evaluation3.80 (3.30–4.30)15
Pulmonary function charts and ventilatory monitoring4.50 (4.00–5.00)17
Ventilatory loops5.00 (3.80–5.00)7
Diagnostic tests4.80 (4.50–5.00)35
Restrictive PatternClinical evaluation4.40 (3.58–4.88)12
Pulmonary function charts and ventilatory monitoring4.80 (4.00–5.00)15
Ventilatory loops5.00 (4.80–5.00)7
Diagnostic tests4.15 (3.50–4.68)12
Mixed PatternClinical evaluation4.30 (4.00–4.80)16
Pulmonary function charts and ventilatory monitoring5.00 (4.30–5.00)15
Ventilatory loops5.00 (4.80–5.00)7
Diagnostic tests5.00 (2.80–5.00)18
Table 9. Delphi validation results of the “Work of Breathing Indexes” model, organized by aspects evaluated and scored from 1 to 5.
Content-TypeAspectScoren (Evaluated Items)
Relevance4.75 (4.31–5.00)28
TheoreticalSufficience4.25 (3.75–4.75)31
Veracity4.75 (4.00–5.00)147
Definition4.802
GraphicOrdering5.00 (4.50–5.00)3
Veracity5.00 (4.75–5.00)65
Publisher’s Note: MDPI stays neutral with regard to jurisdictional claims in published maps and institutional affiliations.

