
Exploring the Development Strategies of Science Parks Using the Hybrid MCDM Approach


Abstract
:1. Introduction
2. The Driving Factors of Science Park
2.1. Public Infrastructure (PI)
2.2. Environmental Quality
2.3. Business Environment (BE)
2.4. Working Environment (WE)
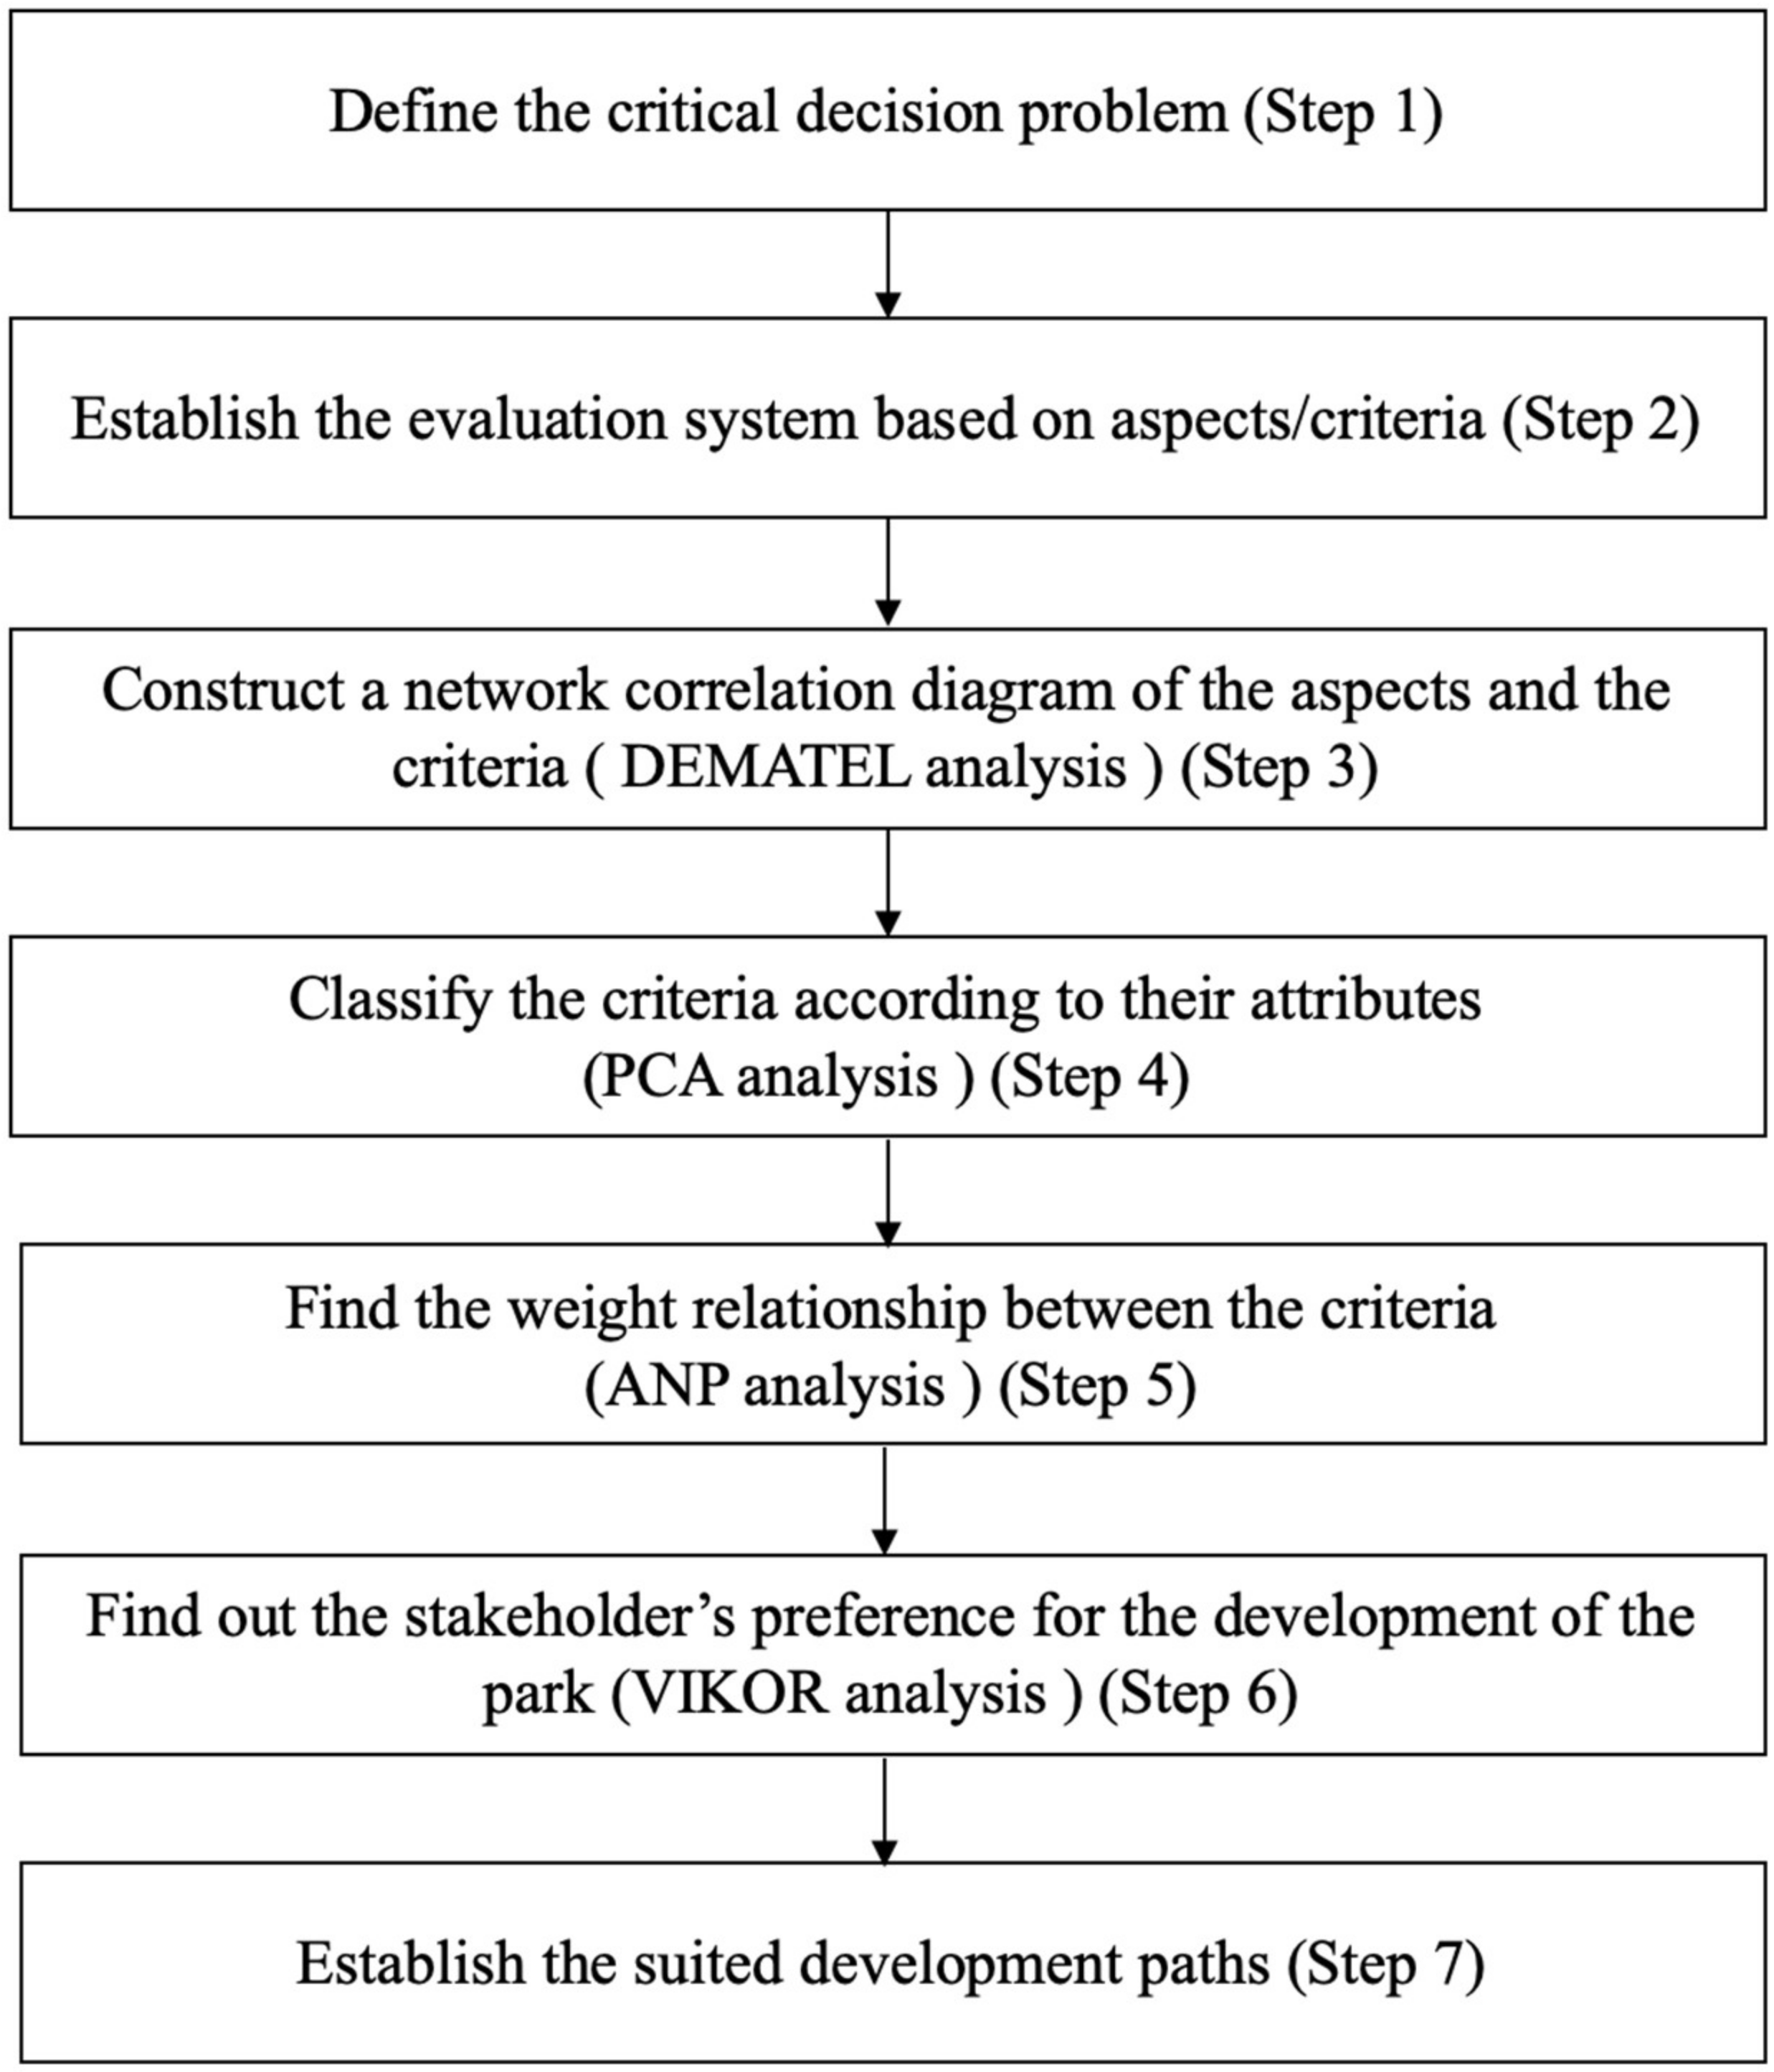
3. The Evaluation Model of Development Strategies for Science Park
3.1. Decision-Making Trial and Evaluation Laboratory, DEMATEL
3.1.1. Calculating the Initial Average Matrix
3.1.2. Calculating the Direct Influence Matrix
3.1.3. Calculating the Indirect Influence Matrix
3.1.4. Calculating the Indirect Influence Matrix
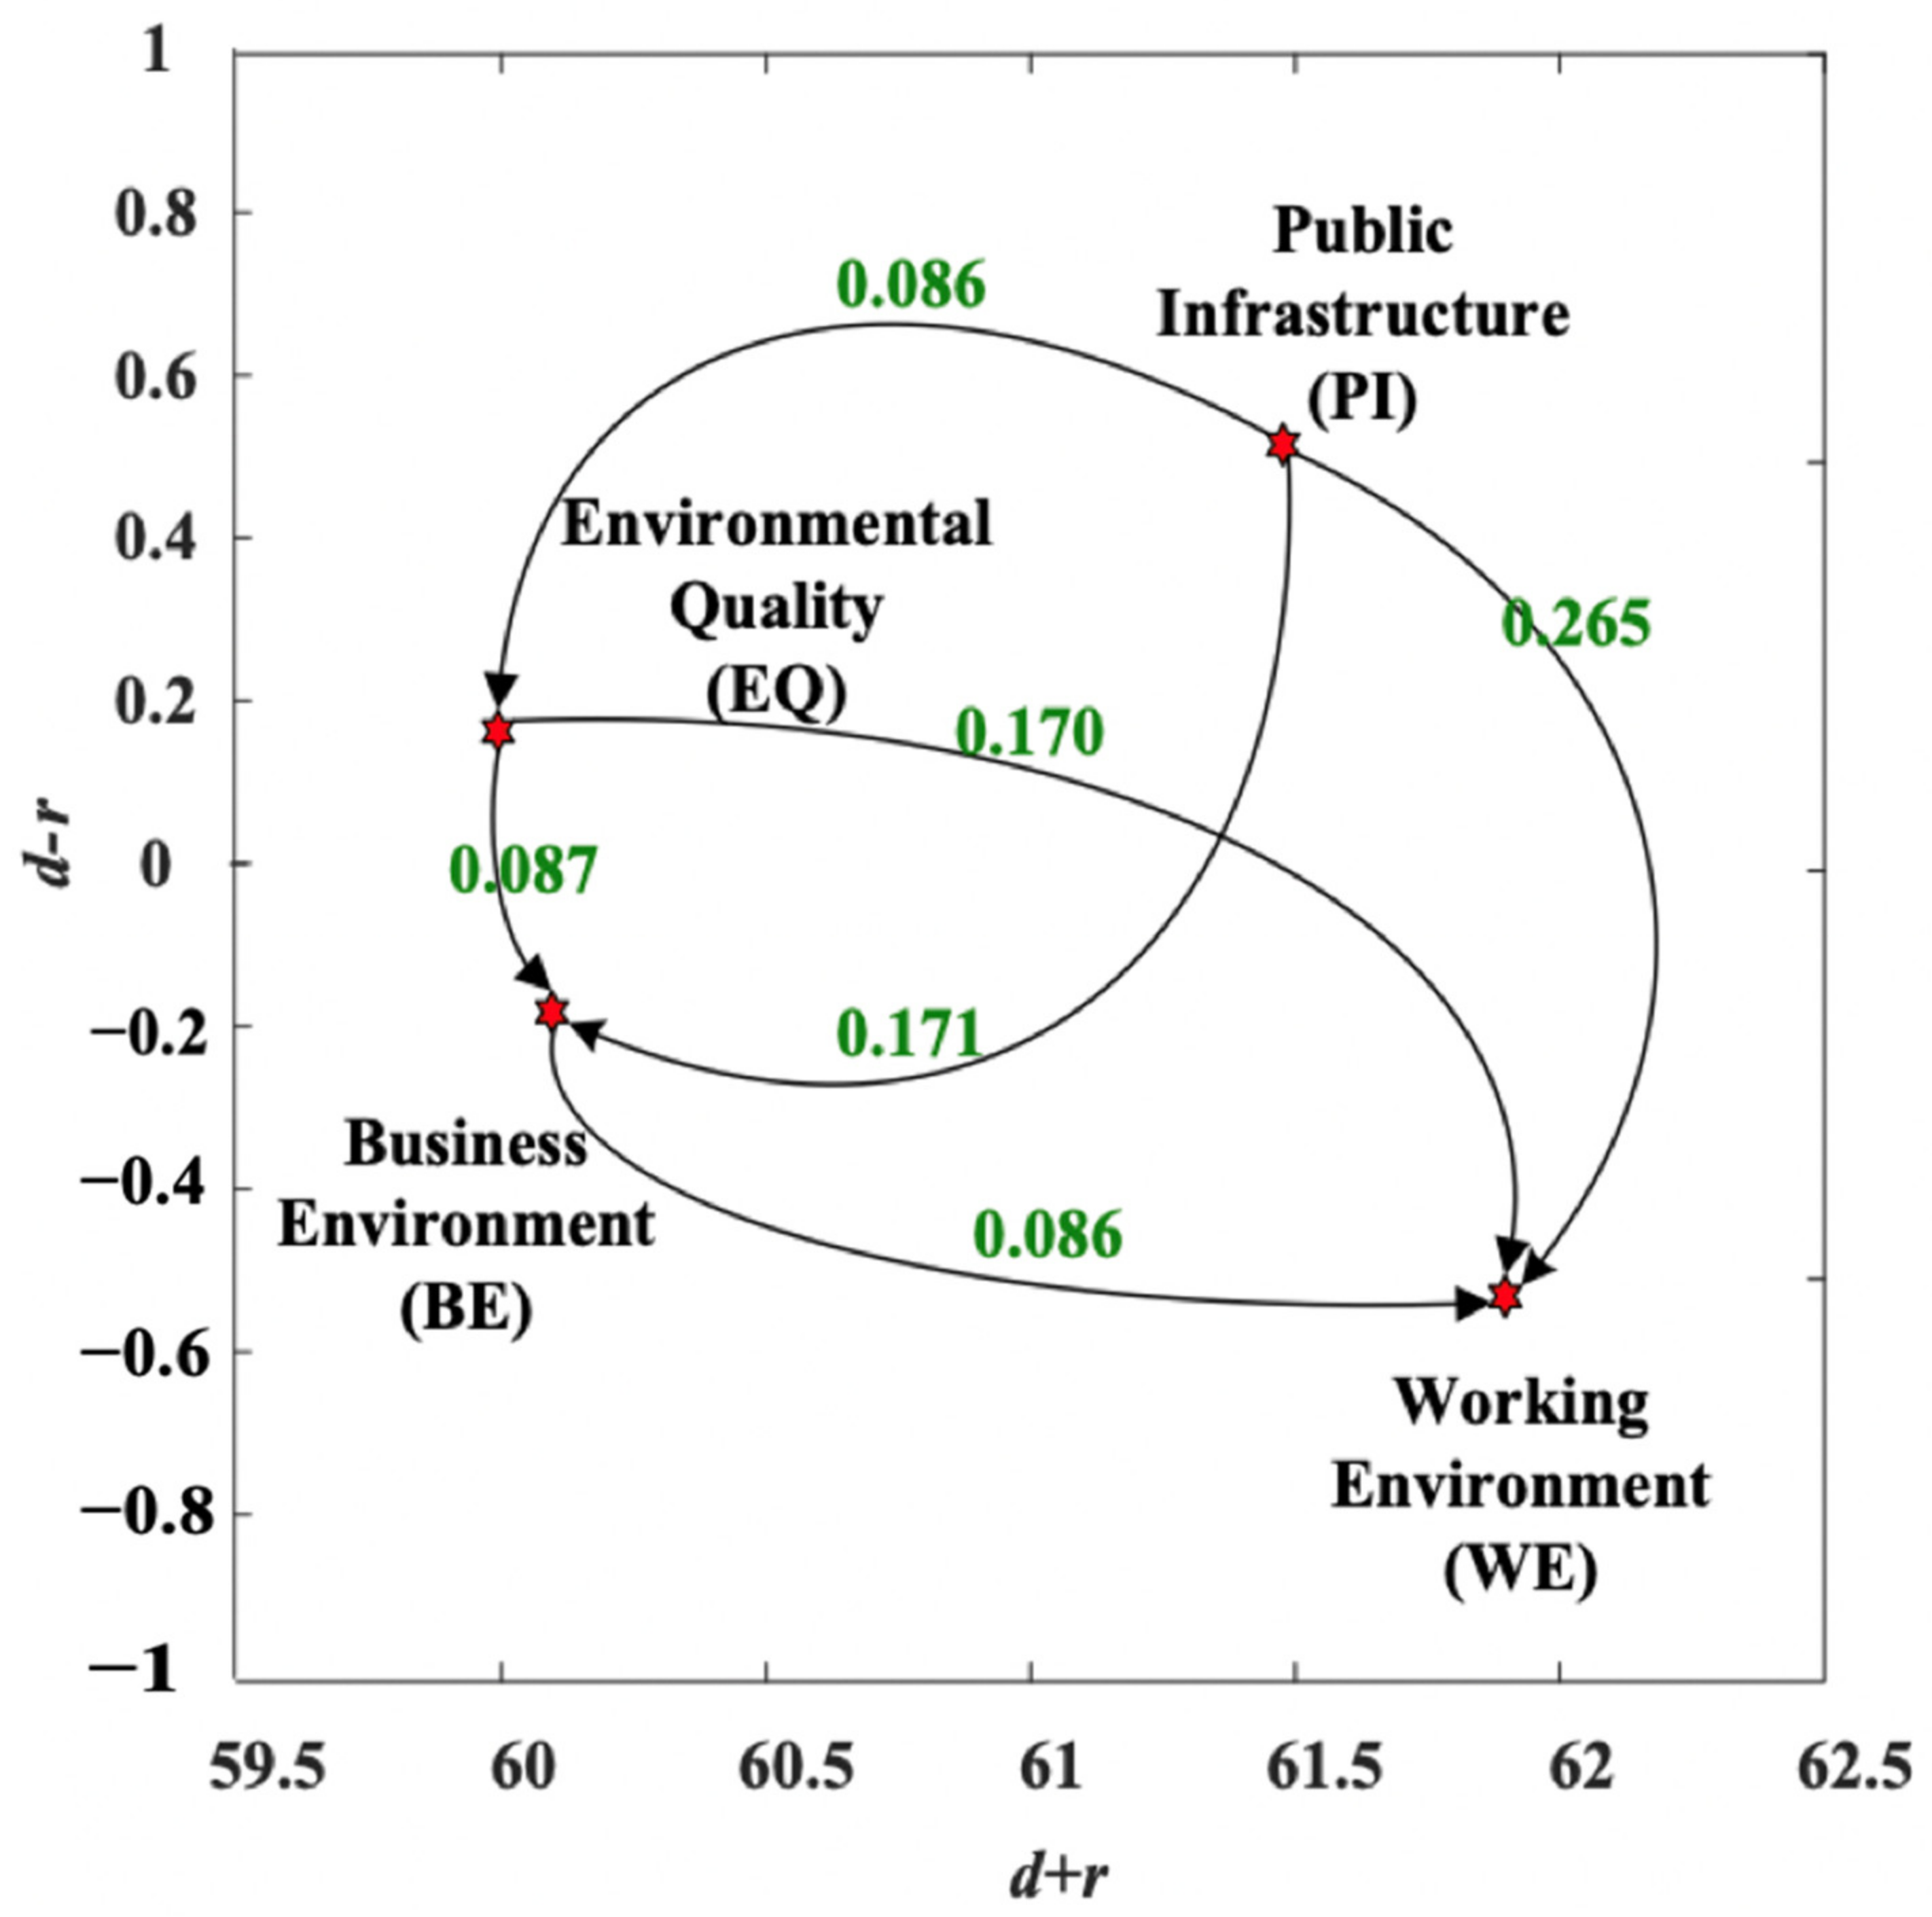
3.1.5. Proposing the Structural Correlation Analysis
3.2. Principal Component Analysis (PCA)
3.3. Analytic Network Process
3.3.1. Define the Problem and Construct Criteria
3.3.2. Design Questionnaire and Investigate
3.3.3. Establish Paired Weights, Calculate Weights and Verify Consistency
3.3.4. Calculate the Transposed Relative Weight Incidence Matrix
3.3.5. Calculate the Supermatrix
3.3.6. Optimal Weight Determination
3.4. Aspect Preference Selection—VIKOR
- 1.
- Find the Positive Ideal Solution and the Negative Ideal Solution
- 2.
- Calculate and
- 3.
- Calculate
- 4.
- Rank the Alternatives
4. The Analysis of the Driving Force for Science Park Development
4.1. Reliability and Validity Analysis
4.2. Driving Forces of Science Park Development
4.3. Principal Component Analysis
4.4. Aspect Preference Selection—VIKOR
4.4.1. Find the Ideal Solution and the Negative Ideal Solution
4.4.2. Calculate and
4.4.3. Calculate
4.4.4. Rank the Alternatives
4.5. Results and Discussion
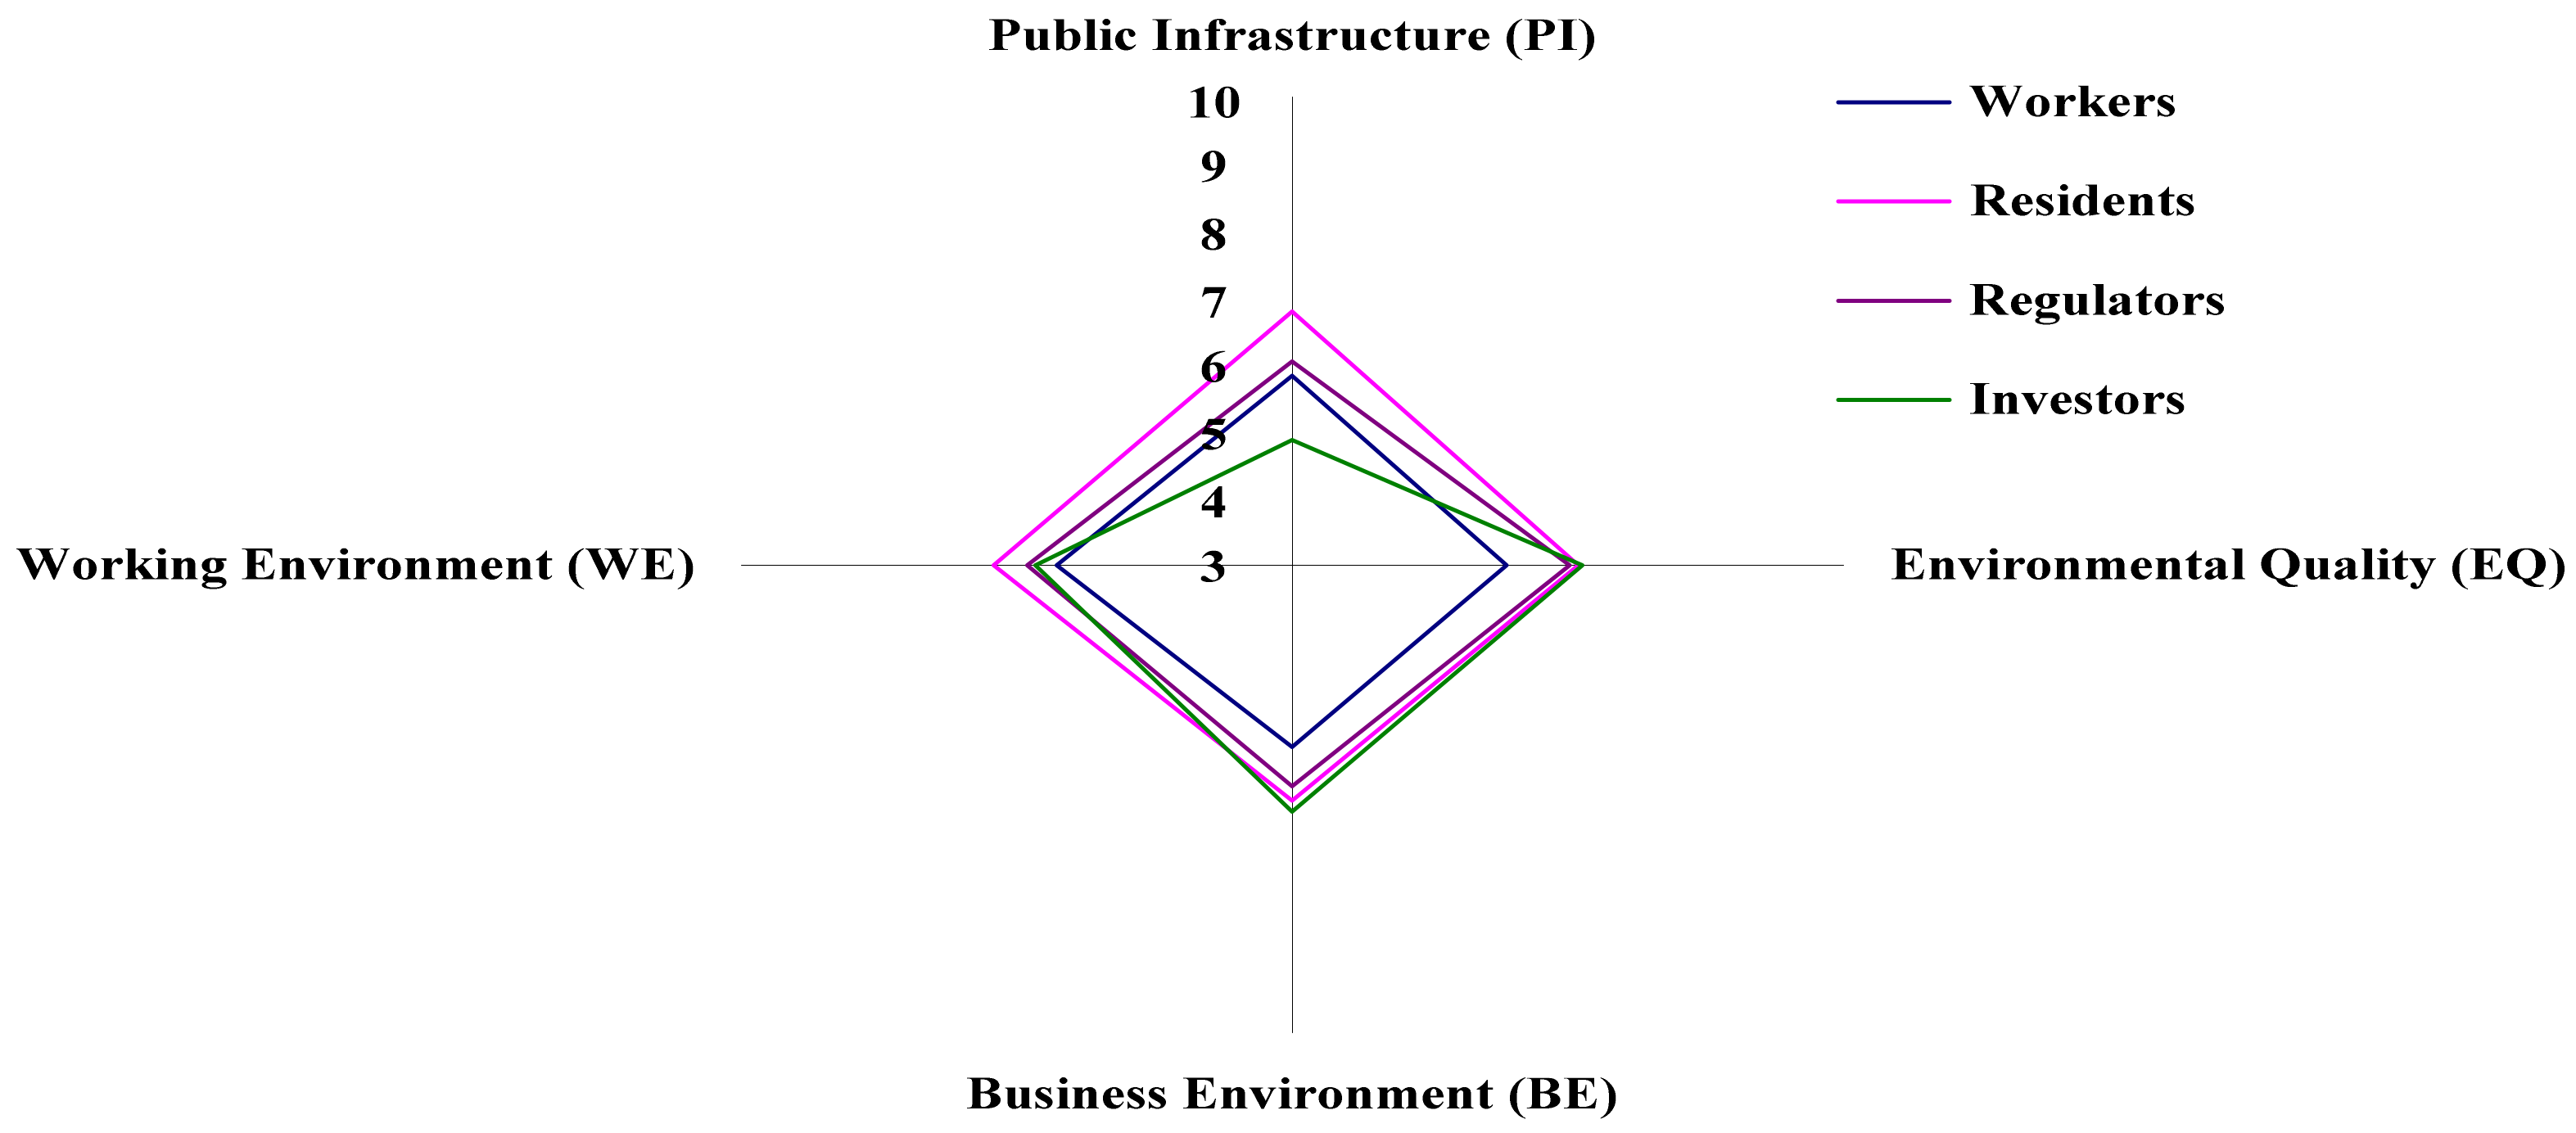
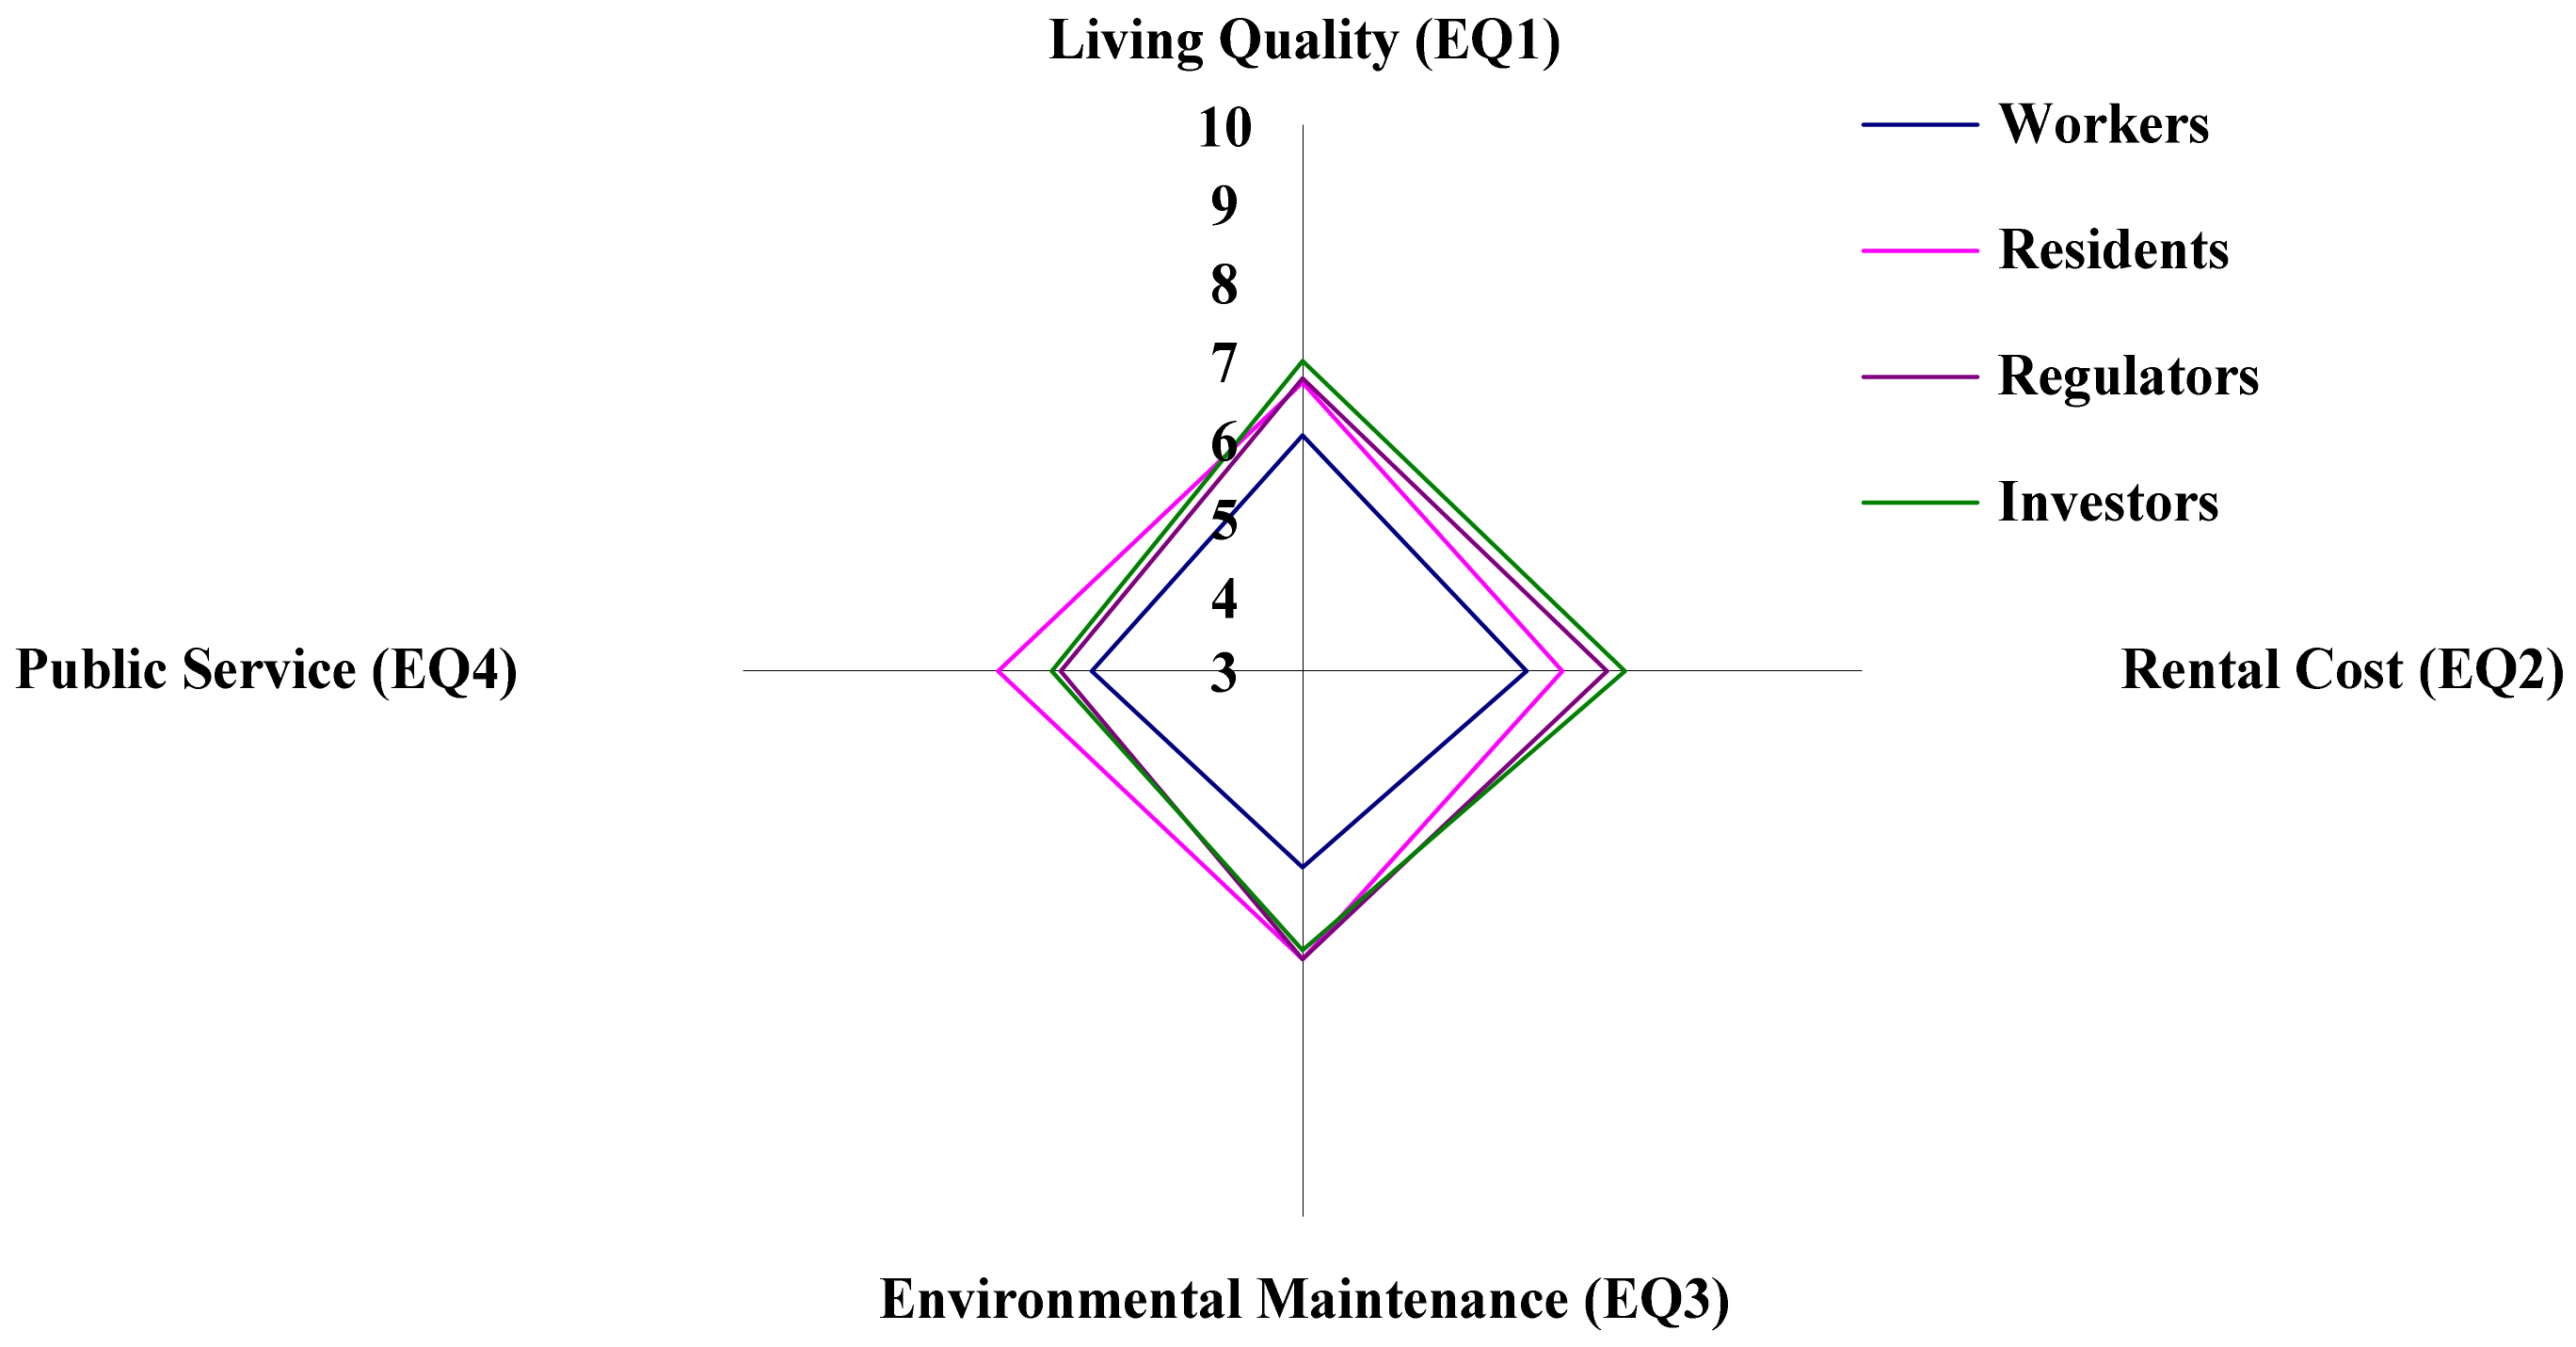
4.5.1. Satisfaction of Different Stakeholders with the Driving Factors for Science Park Development
4.5.2. Strategies to Improve the Satisfaction of Different Stakeholders
5. Conclusions
Author Contributions
Funding
Institutional Review Board Statement
Informed Consent Statement
Data Availability Statement
Conflicts of Interest
References
- Chen, J.K.; Sun, B.S.; Batchuluun, A. Exploring the influence factors for creation one Knowledge hub of Science Park: Comparison between Silicon Valley and Hsinchu Science Park. In Proceedings of the 2016 Portland International Conference on Management of Engineering and Technology (PICMET), Honolulu, HI, USA, 4–8 September 2016; pp. 1156–1171. [Google Scholar]
- Chen, F.-H.; Liu, H.-R. Evaluation of Sustainable Development in Six Transformation Fields of the Central Taiwan Science Park. Sustainability 2021, 13, 4336. [Google Scholar] [CrossRef]
- Tsai, C.-L.; Chang, H.-C. Evaluation of critical factors for the regional innovation system within the HsinChu science-based park. Kybernetes 2016, 45, 699–716. [Google Scholar] [CrossRef]
- Lee, S.; Lin, G.T.; Hsi, P. Industrial Cluster Development and Its Contribution to Economic Growth in Taiwan-Hsinchu Science and Industrial Park (HSIP). J. Sci. Ind. Res. 2017, 76, 273–278. [Google Scholar]
- Krishnamurthy, R.; Desouza, K.C. Chennai, India. Cities 2015, 42, 118–129. [Google Scholar] [CrossRef]
- Futcher, J.; Mills, G.; Emmanuel, R.; Korolija, I. Creating sustainable cities one building at a time: Towards an integrated urban design framework. Cities 2017, 66, 63–71. [Google Scholar] [CrossRef] [Green Version]
- Lin, C.-L.; Tzeng, G.-H. A value-created system of science (technology) park by using DEMATEL. Expert Syst. Appl. 2009, 36, 9683–9697. [Google Scholar] [CrossRef]
- Li, Y.; Beeton, R.J.; Sigler, T.; Halog, A. Modelling the transition toward urban sustainability: A case study of the industrial city of Jinchang, China. J. Clean. Prod. 2016, 134, 22–30. [Google Scholar] [CrossRef] [Green Version]
- Vedovello, C. Science parks and university-industry interaction: Geographical proximity between the agents as a driving force. Technovation 1997, 17, 491–531. [Google Scholar] [CrossRef]
- Tselios, V.; Rovolis, A.; Psycharis, Y. Regional economic development, human capital and transport infrastructure in Greece: The role of geography. In Regional Upgrading in Southern Europe; Springer: Berlin/Heidelberg, Germany, 2017; pp. 151–174. [Google Scholar]
- Eberts, R.W. Public infrastructure and regional economic development. Econ. Rev. 1990, 26, 15–27. [Google Scholar]
- Andrews, R.; Beynon, M.J. Configurational analysis of access to basic infrastructure services: Evidence from Turkish provinces. Eur. J. Dev. Res. 2019, 31, 1341–1370. [Google Scholar] [CrossRef]
- Wang, N.; Zhu, Y.; Yang, T. The impact of transportation infrastructure and industrial agglomeration on energy efficiency: Evidence from China’s industrial sectors. J. Clean. Prod. 2020, 244, 118708. [Google Scholar] [CrossRef]
- Dai, R.; Mookherjee, D.; Quan, Y.; Zhang, X. Industrial clusters, networks and resilience to the Covid-19 shock in China. J. Econ. Behav. Organ. 2021, 183, 433–455. [Google Scholar] [CrossRef]
- Mattar, L.; Higgins, S.S.S.; Neves, J.A.B. Diversity and autonomy in the structuration of a multilevel organizational social network in a technology park. Soc. Netw. 2022, 68, 346–355. [Google Scholar] [CrossRef]
- Huang, S.; Chau, K.; Yin, F.; Chen, Q. The effect of the economic performance of a science park on air quality: An empirical study of Hsinchu science park in Taiwan. Appl. Ecol. Environ. Res. 2018, 16, 8105–8118. [Google Scholar] [CrossRef]
- Dadashpoor, H.; Ahani, S. Land tenure-related conflicts in peri-urban areas: A review. Land Use Policy 2019, 85, 218–229. [Google Scholar] [CrossRef]
- Ng, W.K.B.; Junker, R.; Appel-Meulenbroek, R.; Cloodt, M.; Arentze, T. Perceived benefits of science park attributes among park tenants in the Netherlands. J. Technol. Transf. 2020, 45, 1196–1227. [Google Scholar] [CrossRef] [Green Version]
- Ziller, C.; Andreß, H.-J. Quality of local government and social trust in European cities. Urban Stud. 2021, 00420980211019613. [Google Scholar] [CrossRef]
- Yan, M.-R.; Chien, K.-M.; Hong, L.-Y.; Yang, T.-N. Evaluating the collaborative ecosystem for an innovation-driven economy: A systems analysis and case study of science parks. Sustainability 2018, 10, 887. [Google Scholar] [CrossRef] [Green Version]
- Jan, C.-G.; Chan, C.-C.; Teng, C.-H. The effect of clusters on the development of the software industry in Dalian, China. Technol. Soc. 2012, 34, 163–173. [Google Scholar] [CrossRef]
- Abbas, A.; Hosseini, S.; Fatima, A.; Zhao, S. University-industry collaboration ecosystem in China: Internal and external R&D activities for educational innovation and industrial products development. In Proceedings of the 2019 2nd International Conference on Education Technology Management, Barcelona, Spain, 18–20 December 2019; pp. 40–43. [Google Scholar]
- Abbas, A.; Avdic, A.; Xiaobao, P.; Hasan, M.M.; Ming, W. University-government collaboration for the generation and commercialization of new knowledge for use in industry. J. Innov. Knowl. 2019, 4, 23–31. [Google Scholar] [CrossRef]
- Abbas, A.; Avdic, A.; Xiaobao, P.; Zhao, S.L.; Chong, R. Strategic Framework of Collaboration in Knowledge Transfer of High-tech Industries. Qual. Access Success 2018, 19, 74–80. [Google Scholar]
- Zhang, J.; Guan, J. The time-varying impacts of government incentives on innovation. Technol. Forecast. Soc. Change 2018, 135, 132–144. [Google Scholar] [CrossRef]
- Xie, K.; Song, Y.; Zhang, W.; Hao, J.; Liu, Z.; Chen, Y. Technological entrepreneurship in science parks: A case study of Wuhan Donghu High-Tech Zone. Technol. Forecast. Soc. Change 2018, 135, 156–168. [Google Scholar] [CrossRef]
- Wei, F.; Yang, Y.; Chen, Y.; Yang, F. The effects of venture capital investments on industrial innovative opportunities and technological arbitrage opportunities. Small Bus. Econ. 2021, 58, 2261–2280. [Google Scholar] [CrossRef]
- Acheampong, R.A. Towards incorporating location choice into integrated land use and transport planning and policy: A multi-scale analysis of residential and job location choice behaviour. Land Use Policy 2018, 78, 397–409. [Google Scholar] [CrossRef] [Green Version]
- Huang, K.-P.; Wang, Y. A Study on the Correlation between Working Pressure and Job Satisfaction from the Viewpoint of Work Exhaustion. Rev. De Cercet. Si Interv. Soc. 2019, 64, 235–245. [Google Scholar] [CrossRef]
- Krishnakumar, J.; Nogales, R. Education, skills and a good job: A multidimensional econometric analysis. World Dev. 2020, 128, 104842. [Google Scholar] [CrossRef]
- Cadorin, E.; Klofsten, M.; Löfsten, H. Science Parks, talent attraction and stakeholder involvement: An international study. J. Technol. Transf. 2021, 46, 1–28. [Google Scholar] [CrossRef] [Green Version]
- Wu, W.-W.; Lee, Y.-T. Developing global managers’ competencies using the fuzzy DEMATEL method. Expert Syst. Appl. 2007, 32, 499–507. [Google Scholar] [CrossRef]
- Seyed-Hosseini, S.M.; Safaei, N.; Asgharpour, M. Reprioritization of failures in a system failure mode and effects analysis by decision making trial and evaluation laboratory technique. Reliab. Eng. Syst. Saf. 2006, 91, 872–881. [Google Scholar] [CrossRef]
- Saaty, T.L. Rank from comparisons and from ratings in the analytic hierarchy/network processes. Eur. J. Oper. Res. 2006, 168, 557–570. [Google Scholar] [CrossRef]
- Shyur, H.-J. COTS evaluation using modified TOPSIS and ANP. Appl. Math. Comput. 2006, 177, 251–259. [Google Scholar] [CrossRef]
- Opricovic, S.; Tzeng, G.H. Multicriteria planning of post-earthquake sustainable reconstruction. Comput. Aided Civ. Infrastruct. Eng. 2002, 17, 211–220. [Google Scholar] [CrossRef]
- Tzeng, G.-H.; Teng, M.-H.; Chen, J.-J.; Opricovic, S. Multicriteria selection for a restaurant location in Taipei. Int. J. Hosp. Manag. 2002, 21, 171–187. [Google Scholar] [CrossRef]
- Tzeng, G.-H.; Tsaur, S.-H.; Laiw, Y.-D.; Opricovic, S. Multicriteria analysis of environmental quality in Taipei: Public preferences and improvement strategies. J. Environ. Manag. 2002, 65, 109–120. [Google Scholar] [CrossRef] [PubMed] [Green Version]
- Opricovic, S.; Tzeng, G.-H. Defuzzification within a multicriteria decision model. Int. J. Uncertain. Fuzziness Knowl. Based Syst. 2003, 11, 635–652. [Google Scholar] [CrossRef]
- Opricovic, S.; Tzeng, G.-H. Compromise solution by MCDM methods: A comparative analysis of VIKOR and TOPSIS. Eur. J. Oper. Res. 2004, 156, 445–455. [Google Scholar] [CrossRef]
- Tzeng, G.-H.; Lin, C.-W.; Opricovic, S. Multi-criteria analysis of alternative-fuel buses for public transportation. Energy Policy 2005, 33, 1373–1383. [Google Scholar] [CrossRef]
- Opricovic, S.; Tzeng, G.-H. Extended VIKOR method in comparison with outranking methods. Eur. J. Oper. Res. 2007, 178, 514–529. [Google Scholar] [CrossRef]
- Sun, R.; Li, F.; Chen, L. A demand index for recreational ecosystem services associated with urban parks in Beijing, China. J. Environ. Manag. 2019, 251, 109612. [Google Scholar] [CrossRef]


| Aspect/Criteria | Description of the Criterion |
|---|---|
| Public Infrastructure (PI) | |
| Transportation Infrastructure | The comprehensive transportation construction in the science park can provide users with more convenient transportation and commuting services. |
| Information Infrastructure | The comprehensive information facilities in the science park can provide facility users with more convenient information services. |
| Sports and Leisure Infrastructure | The comprehensive sports and leisure facilities in the science park can meet the residents’ need for rest. |
| Basic Infrastructure | The complete water, electricity, oil and gas facilities in the science park can meet the basic needs of business operations. |
| Environmental Quality (EQ) | |
| Living Quality | Science parks will attract many immigrants, often leading to improper additions and doubts about residential safety. |
| Rental Cost | Excessive rental costs in science parks often cause immigrants to deter the development of settlements. |
| Environmental Maintenance | The science park will attract many immigrants, which often causes local environmental pollution and affects the quality of housing. |
| Public Service | The provision of medical and educational facilities in the science park will help meet the needs of local public services. |
| Business Environment (BE) | |
| Tax Concessions | The implementation of preferential tax policies in the science park will help reduce the cost of investment firms to set up factories. |
| New Ventures | The abundant new venture investment in the science park helps to increase the willingness of manufacturers to invest and the demand for plant expansion. |
| Business Activities | Business activities in the science park will help drive regional economic development and attract immigrants. |
| Industrial Policies | The supporting industrial policies provided by the science park will help attract competitive manufacturers to invest. |
| Working Environment (WE) | |
| Employment Opportunities | The provision of high-quality and sufficient employment opportunities in the science park will help attract outstanding talents to invest in development. |
| Working Conditions | The high-quality working conditions in the science park will help attract outstanding talents to invest and stay long-term. |
| Living Function | The science park provides comprehensive life function services to meet the daily needs of workers. |
| Price Levels | The local price level in the science park will affect the workers’ motivation for job hunting and their willingness to move. |
| Aspect | PI | EQ | BE | WE | Total |
|---|---|---|---|---|---|
| Public infrastructure (PI) | 0.000 | 2.897 | 2.793 | 2.938 | 8.628 |
| Environmental Quality (EQ) | 2.855 | 0.000 | 2.621 | 2.814 | 8.290 |
| Business Environment (BE) | 2.745 | 2.545 | 0.000 | 2.945 | 8.234 |
| Working Environment (WE) | 2.834 | 2.779 | 2.897 | 0.000 | 8.510 |
| Total | 8.434 | 8.221 | 8.310 | 8.697 | - |
| Aspect | PI | EQ | BE | WE | Total |
|---|---|---|---|---|---|
| Public Infrastructure (PI) | 0.000 | 0.333 | 0.321 | 0.338 | 0.992 |
| Environmental Quality (EQ) | 0.328 | 0.000 | 0.301 | 0.324 | 0.953 |
| Business Environment (BE) | 0.316 | 0.293 | 0.000 | 0.339 | 0.947 |
| Working Environment (WE) | 0.326 | 0.320 | 0.333 | 0.000 | 0.979 |
| Total | 0.970 | 0.945 | 0.956 | 1.000 | - |
| Aspect | Sum of Columns | Sum of Rows | Sum of Rows and Columns | Rank of Influence |
|---|---|---|---|---|
| Public Infrastructure (PI) | 0.992 | 0.970 | 1.962 | 2 |
| Environmental Quality (EQ) | 0.953 | 0.945 | 1.898 | 4 |
| Business Environment (BE) | 0.947 | 0.956 | 1.902 | 3 |
| Working Environment (WE) | 0.979 | 1.000 | 1.979 | 1 |
| Aspect | PI | EQ | BE | WE | Sum |
|---|---|---|---|---|---|
| Public Infrastructure (PI) | 7.575 | 7.351 | 7.411 | 7.671 | 30.008 |
| Environmental Quality (EQ) | 7.270 | 7.214 | 7.198 | 7.448 | 29.129 |
| Business Environment (BE) | 7.245 | 7.119 | 7.239 | 7.411 | 29.013 |
| Working Environment (WE) | 7.418 | 7.282 | 7.331 | 7.679 | 29.709 |
| Sum | 29.507 | 28.965 | 29.179 | 30.208 | - |
| Aspect | PI | EQ | BE | WE | Sum |
|---|---|---|---|---|---|
| Public Infrastructure (PI) | 7.575 | 7.684 | 7.732 | 8.009 | 31.000 |
| Environmental Quality (EQ) | 7.598 | 7.214 | 7.499 | 7.772 | 30.082 |
| Business Environment (BE) | 7.561 | 7.412 | 7.239 | 7.750 | 29.961 |
| Working Environment (WE) | 7.744 | 7.602 | 7.664 | 7.679 | 30.688 |
| Sum | 30.477 | 29.911 | 30.134 | 31.209 | - |
| Aspect | ||||
|---|---|---|---|---|
| Public Infrastructure (PI) | 31.000 | 30.477 | 61.477 | 0.522 |
| Environmental Quality (EQ) | 30.082 | 29.911 | 59.993 | 0.171 |
| Business Environment (BE) | 29.961 | 30.134 | 60.095 | −0.173 |
| Working Environment (WE) | 30.688 | 31.209 | 61.897 | −0.521 |
| Aspect | PI | EQ | BE | WE |
|---|---|---|---|---|
| Public Infrastructure (PI) | - | |||
| Environmental Quality (EQ) | −0.086 | - | ||
| Business Environment (BE) | −0.171 | −0.087 | - | |
| Working Environment (WE) | −0.265 | −0.170 | −0.086 | - |
| Principal Component | ||||
|---|---|---|---|---|
| Aspect | Principal Component | Criteria | 1 | Communality |
| Public infrastructure(PI) | Information and transportation infrastructure (PIP1) | Information infrastructure (PE2) | 0.917 | 0.842 |
| Living infrastructure (PE4) | 0.913 | 0.834 | ||
| Transportation infrastructure (PE1) | 0.898 | 0.807 | ||
| Leisure infrastructure (PE3) | 0.897 | 0.804 | ||
| Eigenvalue λ | 3.287 | |||
| % of Variance | 82.184 | |||
| Cumulative (%) | 82.184 | |||
| Cronbach’s α | 0.928 |
| Aspect | PI | EQ | BE | WE |
|---|---|---|---|---|
| Public Infrastructure (PI) | 0.244 | 0.253 | 0.252 | 0.252 |
| Environmental Quality (EQ) | 0.248 | 0.240 | 0.247 | 0.248 |
| Business Environment (BE) | 0.249 | 0.249 | 0.242 | 0.250 |
| Working Environment (WE) | 0.258 | 0.258 | 0.259 | 0.250 |
| Sum | 1.000 | 1.000 | 1.000 | 1.000 |
| Aspect | Component | PIP1 | EQP1 | BEP1 | WEP1 |
|---|---|---|---|---|---|
| Public Infrastructure (PI) | Information and transportation infrastructure (PIP1) | 1.000 | 1.000 | 1.000 | 1.000 |
| Environmental Quality (EQ) | Secure and public services (EQP1) | 1.000 | 1.000 | 1.000 | 1.000 |
| Business Environment (BE) | Policy and investment incentives (BEP1) | 1.000 | 1.000 | 1.000 | 1.000 |
| Working Environment (WE) | Consumption and labor conditions (WEP1) | 1.000 | 1.000 | 1.000 | 1.000 |
| Sum | 4.000 | 4.000 | 4.000 | 4.000 |
| Aspect | Component | PIP1 | EQP1 | BEP1 | WEP1 |
|---|---|---|---|---|---|
| Public Infrastructure (PI) | Information and transportation infrastructure (PIP1) | 0.244 | 0.253 | 0.252 | 0.252 |
| Environmental Quality (EQ) | Secure and public services (EQP1) | 0.248 | 0.240 | 0.247 | 0.248 |
| Business Environment (BE) | Policy and investment incentives (BEP1) | 0.249 | 0.249 | 0.242 | 0.250 |
| Working Environment (WE) | Consumption and labor conditions (WEP1) | 0.258 | 0.258 | 0.259 | 0.250 |
| Sum | 1.000 | 1.000 | 1.000 | 1.000 |
| Aspect | Component | PIP1 | EQP1 | BEP1 | WEP1 |
|---|---|---|---|---|---|
| Public Infrastructure (PI) | Information and transportation infrastructure (PIP1) | 0.250 | 0.250 | 0.250 | 0.250 |
| Environmental Quality (EQ) | Secure and public services (EQP1) | 0.246 | 0.246 | 0.246 | 0.246 |
| Business Environment (BE) | Policy and investment incentives (BEP1) | 0.248 | 0.248 | 0.248 | 0.248 |
| Working Environment (WE) | Consumption and labor conditions (WEP1) | 0.256 | 0.256 | 0.256 | 0.256 |
| Sum | 1.000 | 1.000 | 1.000 | 1.000 |
| Aspect | Component | Weight |
|---|---|---|
| Public Infrastructure (PI) | Information and transportation infrastructure (PIP1) | 0.250 |
| Environmental Quality (EQ) | Secure and public services (EQP1) | 0.246 |
| Business Environment (BE) | Policy and investment incentives (BEP1) | 0.248 |
| Working Environment (WE) | Consumption and labor conditions (WEP1) | 0.256 |
| Sum | 1.000 |
| Item | Alpha | Results |
|---|---|---|
| Overall | 0.922 | Highly credible |
| Public Infrastructure (PI) | 0.928 | Highly credible |
| Environmental Quality (EQ) | 0.885 | Highly credible |
| Business Environment (BE) | 0.930 | Highly credible |
| Working Environment (WE) | 0.938 | Highly credible |
| Workers | Residents | Regulators | Investors | |
|---|---|---|---|---|
| Horizontal analysis | ||||
| Public Infrastructure (PI) | 5.856 (3) | 6.813 (1) | 6.066 (2) | 4.882 (4) |
| Environmental Quality (EQ) | 5.740 (4) | 6.614 (3) | 6.553 (2) | 6.691 (1) |
| Business Environment (BE) | 5.731 (4) | 6.518 (2) | 6.329 (3) | 6.706 (1) |
| Working Environment (WE) | 5.990 (4) | 6.804 (1) | 6.355 (2) | 6.250 (3) |
| Vertical analysis | ||||
| Public Infrastructure (PI) | 5.856 (2) | 6.813 (1) | 6.066 (4) | 4.882 (4) |
| Environmental Quality (EQ) | 5.740 (3) | 6.614 [(3) | 6.553 (1) | 6.691 (2) |
| Business Environment (BE) | 5.731 (4) | 6.518 (4) | 6.329 (3) | 6.706 (1) |
| Working Environment (WE) | 5.990 (1) | 6.804 (2) | 6.355 (2) | 6.250 (3) |
| Workers | Residents | Regulators | Investors | |
|---|---|---|---|---|
| Horizontal analysis | ||||
| Transportation Infrastructure (PI1) | 5.308 (3) | 6.578 (1) | 5.789 (2) | 4.412 (4) |
| Information Infrastructure (PI2) | 5.923 (3) | 6.952 (1) | 6.000 (2) | 4.529 (4) |
| Sports and Leisure Infrastructure (PI3) | 5.769 (3) | 6.735 (1) | 6.053 (2) | 4.588 (4) |
| Basic Infrastructure (PI4) | 6.423 (2) | 6.988 (1) | 6.421 (3) | 6.000 (4) |
| Vertical analysis | ||||
| Transportation Infrastructure (PI1) | 5.308 (4) | 6.578 (4) | 5.789 (4) | 4.412 (4) |
| Information Infrastructure (PI2) | 5.923 (2) | 6.952 (2) | 6.000 (3) | 4.529 (3) |
| Sports and Leisure Infrastructure (PI3) | 5.769 (3) | 6.735 (3) | 6.053 (2) | 4.588 (2) |
| Basic Infrastructure (PI4) | 6.423 (1) | 6.988 (1) | 6.421 (1) | 6.000 (1) |
| Workers | Residents | Regulators | Investors | |
|---|---|---|---|---|
| Horizontal analysis | ||||
| Living Quality (EQ1) | 6.038 (4) | 6.699 (3) | 6.737 (2) | 7.000 (1) |
| Rental Cost (EQ2) | 5.808 (4) | 6.229 (3) | 6.789 (2) | 7.059 (1) |
| Environmental Maintenance (EQ3) | 5.500 (4) | 6.699 (1) | 6.684 (2) | 6.588 (3) |
| Public Service (EQ4) | 5.615 (4) | 6.831 (1) | 6.000 (3) | 6.118 (2) |
| Vertical analysis | ||||
| Living Quality (EQ1) | 6.038 (1) | 6.699 (2) | 6.737 (2) | 7.000 (2) |
| Rental Cost (EQ2) | 5.808 (2) | 6.229 (4) | 6.789 (1) | 7.059 (1) |
| Environmental Maintenance (EQ3) | 5.500 (4) | 6.699 (2) | 6.684 (3) | 6.588 (3) |
| Public Service (EQ4) | 5.615 (3) | 6.831 (1) | 6.000 (4) | 6.118 (4) |
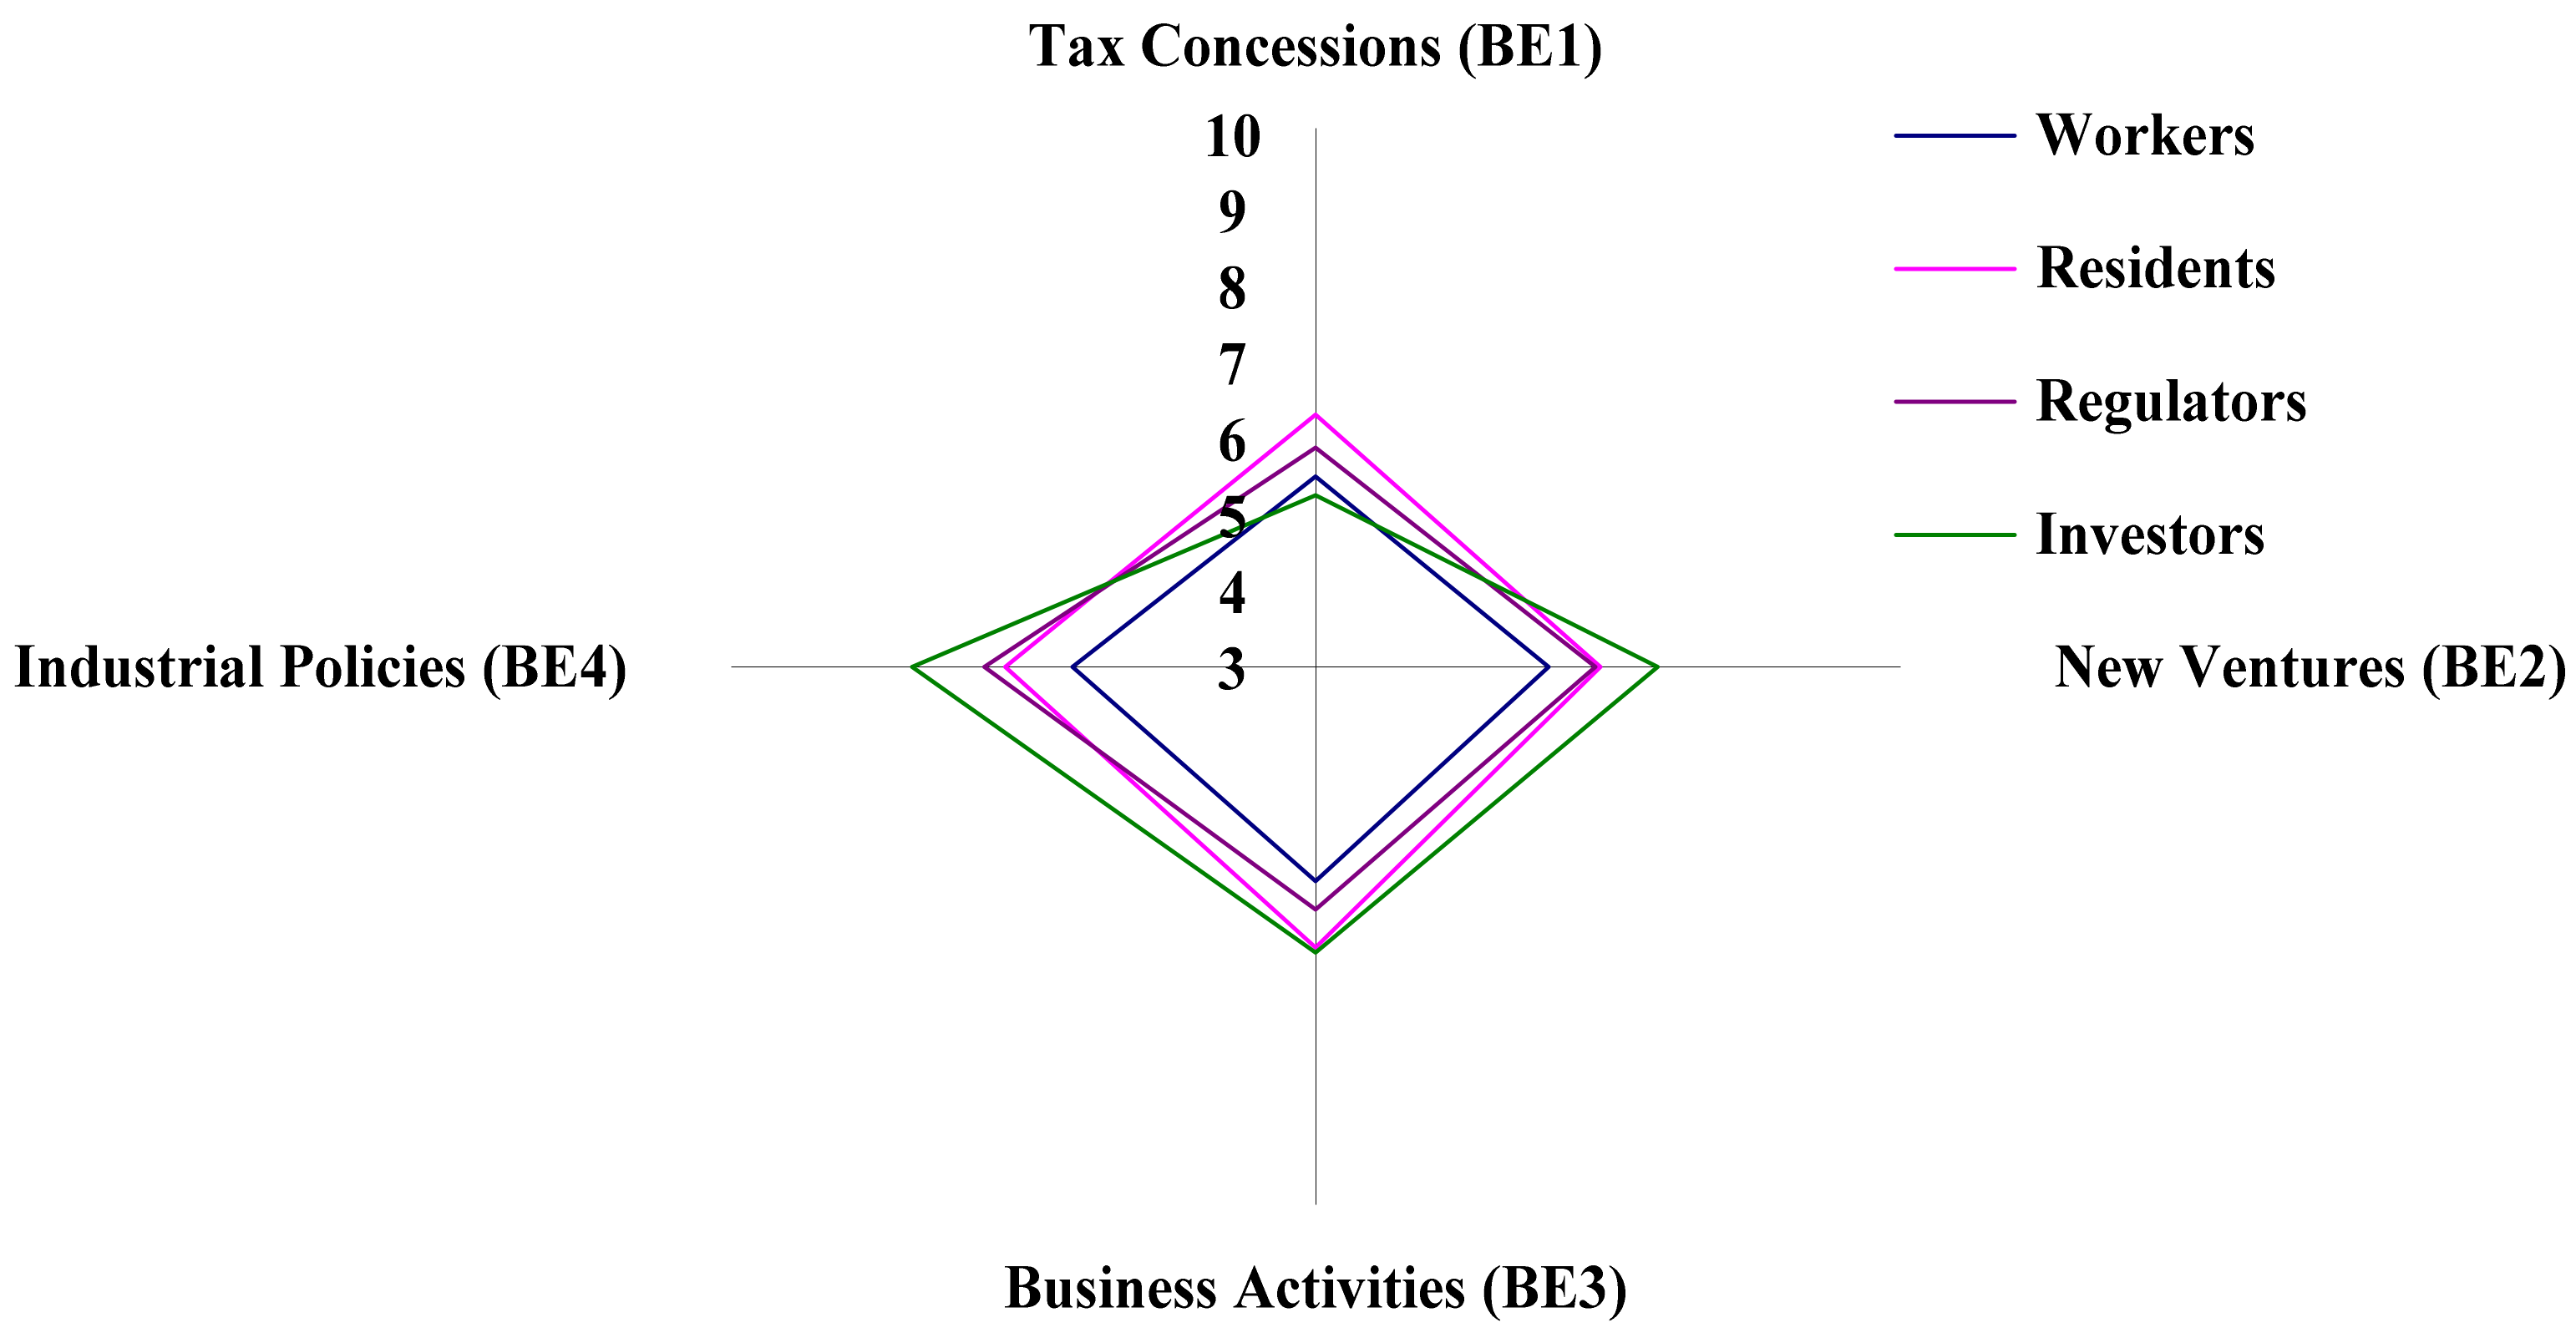
| Workers | Residents | Regulators | Investors | |
|---|---|---|---|---|
| Horizontal analysis | ||||
| Tax Concessions (BE1) | 5.500 (3) | 6.313 (1) | 5.842 (2) | 5.235 (4) |
| New Ventures (BE2) | 5.769 (4) | 6.422 (2) | 6.368 (3) | 7.059 (1) |
| Business Activities (BE3) | 5.769 (4) | 6.627 (2) | 6.158 (3) | 6.706 (1) |
| Industrial Policies (BE4) | 5.885 (4) | 6.711 (3) | 6.947 (2) | 7.824 (1) |
| Vertical analysis | ||||
| Tax Concessions (BE1) | 5.500 (4) | 6.313 (4) | 5.842 (4) | 5.235 (4) |
| New Ventures (BE2) | 5.769 (1) | 6.422 (3) | 6.368 (2) | 7.059 (2) |
| Business Activities (BE3) | 5.769 (1) | 6.627 (2) | 6.158 (3) | 6.706 (3) |
| Industrial Policies (BE4) | 5.885 (3) | 6.711 (1) | 6.947 (1) | 7.824 (1) |
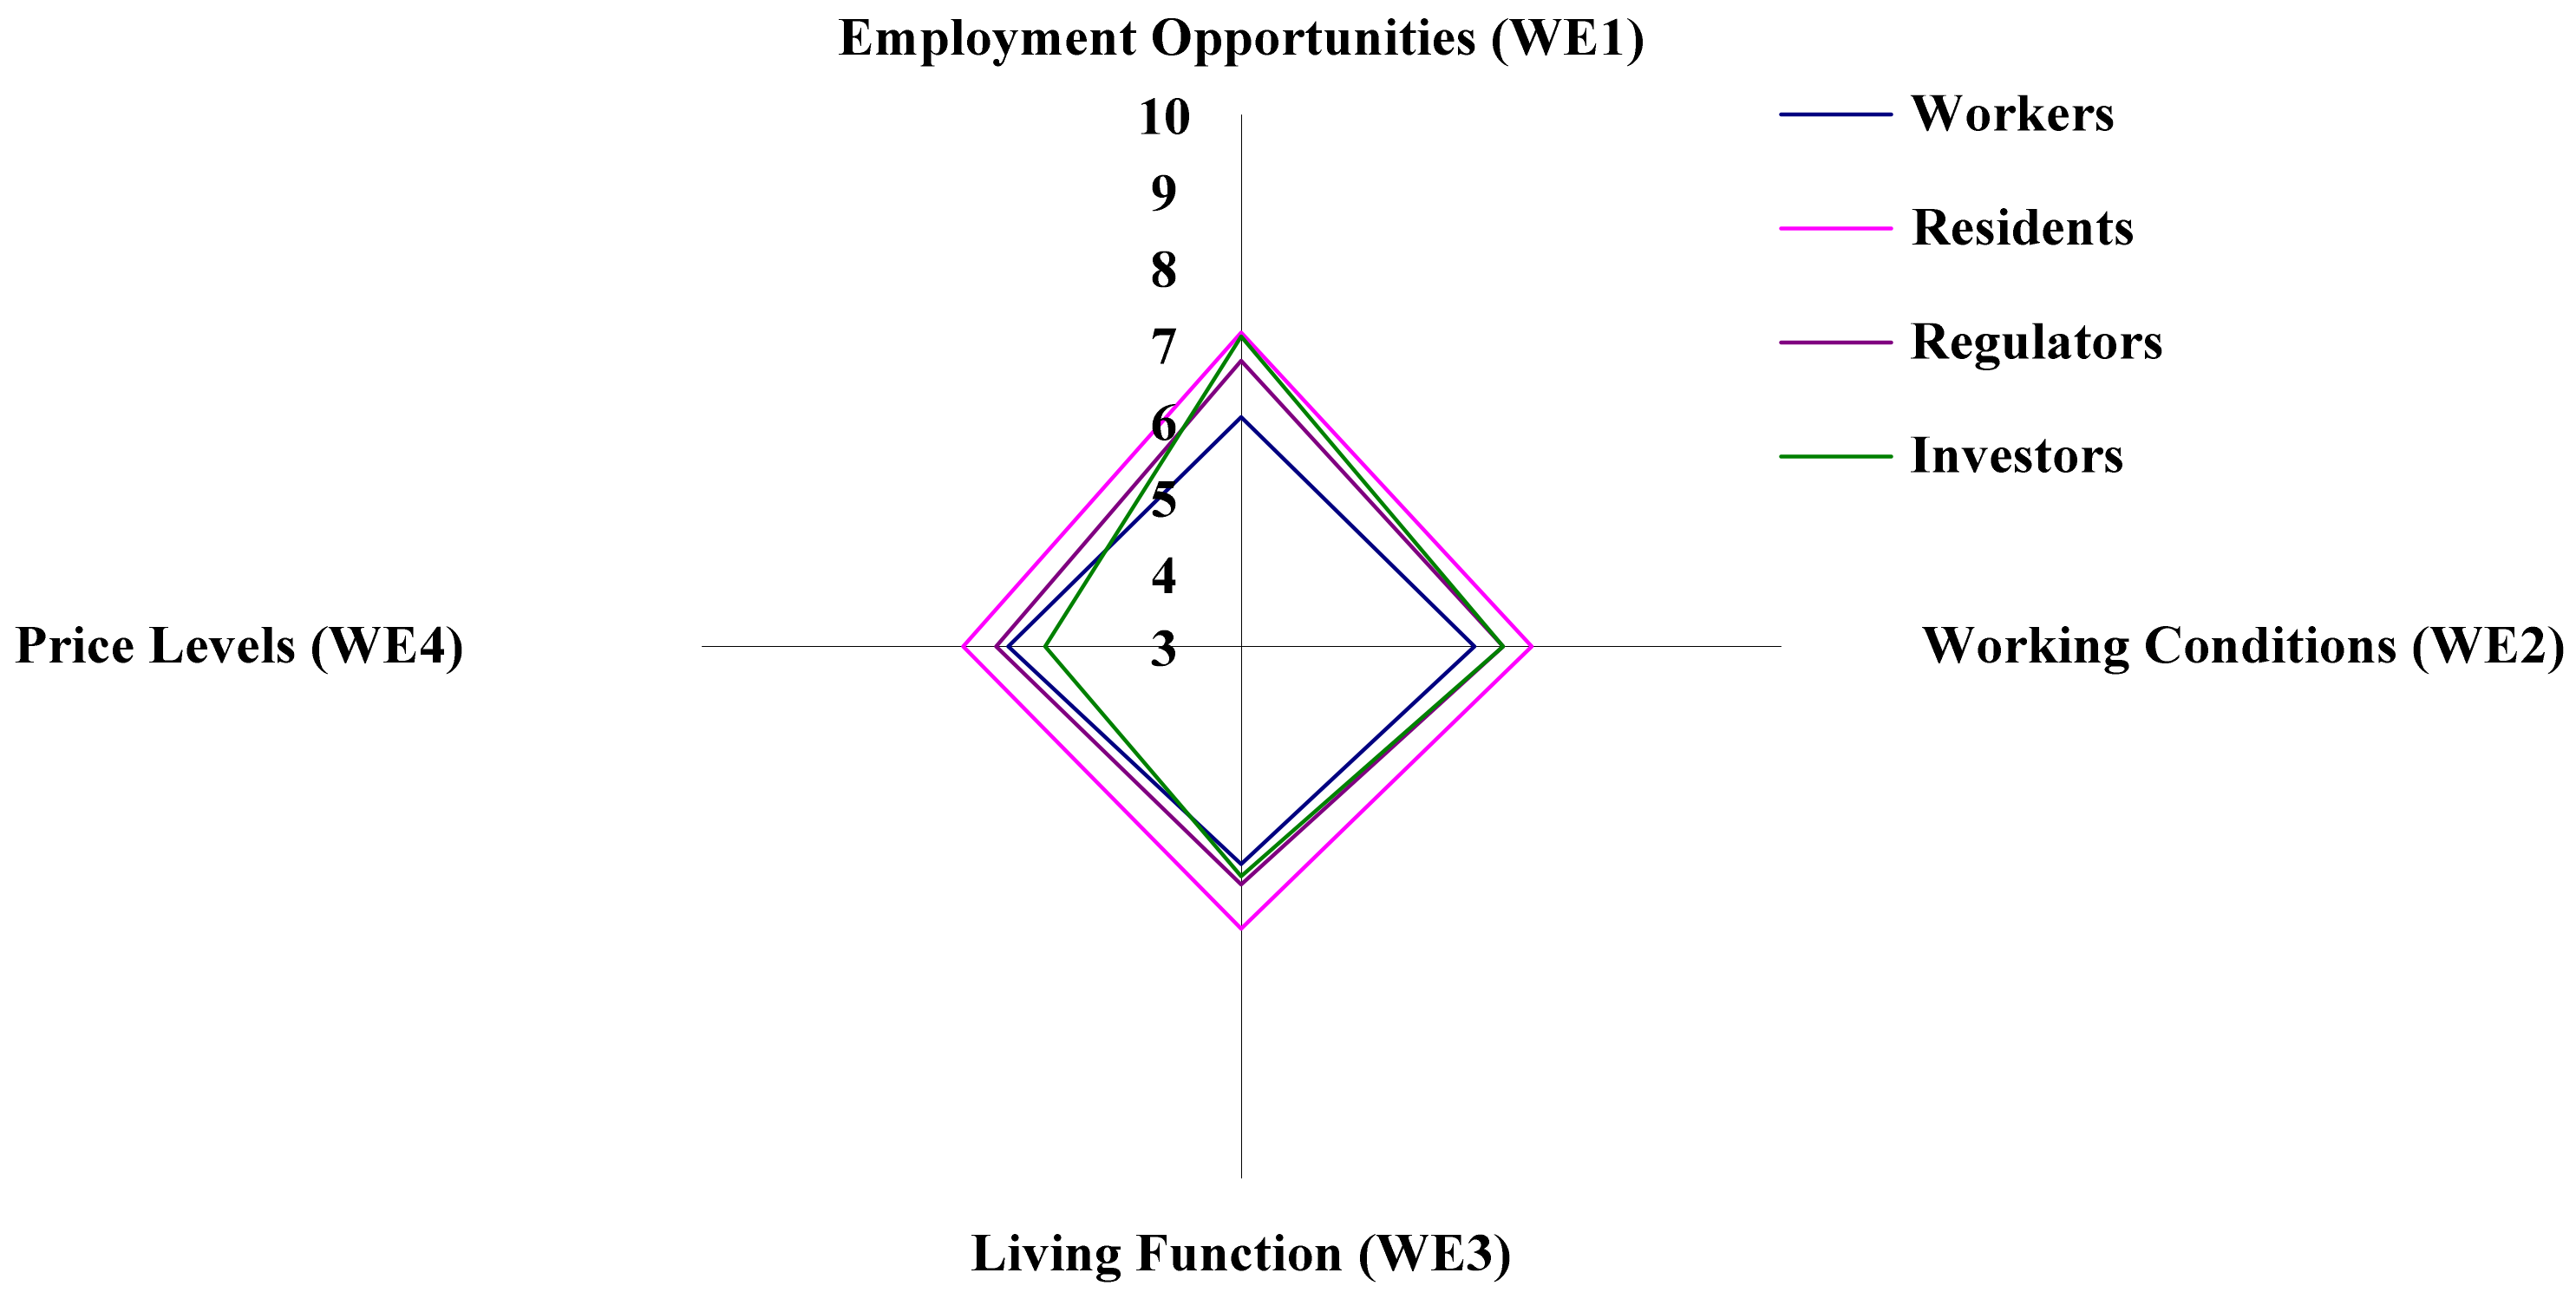
| Workers | Residents | Regulators | Investors | |
|---|---|---|---|---|
| Horizontal analysis | ||||
| Employment Opportunities (WE1) | 6.038 (4) | 7.157 (1) | 6.789 (3) | 7.059 (2) |
| Working Conditions (WE2) | 6.038 (4) | 6.747 (1) | 6.368 (3) | 6.412 (2) |
| Living Function (WE3) | 5.885 (4) | 6.711 (1) | 6.105 (2) | 6.000 (3) |
| Price Levels (WE4) | 6.000 (3) | 6.602 (1) | 6.158 (2) | 5.529 (4) |
| Vertical analysis | ||||
| Employment Opportunities (WE1) | 6.038 (1) | 7.157 (1) | 6.789 (1) | 7.059 (1) |
| Working Conditions (WE2) | 6.038 (1) | 6.747 (2) | 6.368 (2) | 6.412 (2) |
| Living Function (WE3) | 5.885 (4) | 6.711 (3) | 6.105 (4) | 6.000 (3) |
| Price Levels (WE4) | 6.000 (3) | 6.602 (4) | 6.158 (3) | 5.529 (4) |
| Principal Component | ||||
|---|---|---|---|---|
| Aspect | Principal Component | Criteria | 1 | Communality |
| Public Infrastructure (PI) | Information and Transportation Infrastructure (PIP1) | Information Infrastructure (PI2) | 0.917 | 0.842 |
| Basic Infrastructure (PI4) | 0.913 | 0.834 | ||
| Transportation Infrastructure (PI1) | 0.898 | 0.807 | ||
| Sports and Leisure Infrastructure (PI3) | 0.897 | 0.804 | ||
| Eigenvalue λ | 3.287 | |||
| % of Variance | 82.184 | |||
| Cumulative (%) | 82.184 | |||
| Cronbach’s α | 0.928 | |||
| Environmental Quality (EQ) | Security and Public Service (EQP1) | Environmental Maintenance (EQ3) | 0.927 | 0.859 |
| Living Quality (EQ1) | 0.903 | 0.815 | ||
| Public Service (EQ4) | 0.871 | 0.758 | ||
| Rental Cost (EQ2) | 0.745 | 0.554 | ||
| Eigenvalue λ | 2.987 | |||
| % of Variance | 74.677 | |||
| Cumulative (%) | 74.677 | |||
| Cronbach’s α | 0.885 | |||
| Business Environment (BE) | Policy and Investment Incentives (BEP1) | New Ventures (BE2) | 0.959 | 0.920 |
| Business Activities (BE3) | 0.913 | 0.834 | ||
| Industrial Policies (BE4) | 0.905 | 0.819 | ||
| Tax Concessions (BE1) | 0.858 | 0.737 | ||
| Eigenvalue λ | 3.309 | |||
| % of Variance | 82.729 | |||
| Cumulative (%) | 82.729 | |||
| Cronbach’s α | 0.930 | |||
| Working Environment (WE) | Consumption and Labor Conditions (WEP1) | Working Conditions (WE2) | 0.951 | 0.905 |
| Living Function (WE3) | 0.937 | 0.879 | ||
| Employment Opportunities (WE1) | 0.917 | 0.841 | ||
| Price Levels (WE4) | 0.868 | 0.753 | ||
| Eigenvalue λ | 3.377 | |||
| % of Variance | 84.435 | |||
| Cumulative (%) | 84.435 | |||
| Cronbach’s α | 0.938 |
| Aspect | Weight | Workers | Residents | Regulators | Investors | ||
|---|---|---|---|---|---|---|---|
| Public Infrastructure (PI) | 0.250 | 5.856 | 6.813 | 6.066 | 4.882 | 10 | 0 |
| Environmental Quality (EQ) | 0.246 | 5.740 | 6.614 | 6.553 | 6.691 | 10 | 0 |
| Business Environment (BE) | 0.248 | 5.731 | 6.518 | 6.329 | 6.706 | 10 | 0 |
| Working Environment (WE) | 0.256 | 5.990 | 6.804 | 6.355 | 6.250 | 10 | 0 |
| Aspect | ANP | Weight | Workers | Residents | Regulators |
|---|---|---|---|---|---|
| Weight | B1 | B2 | B3 | B4 | |
| Public Infrastructure (PI) | 0.250 | 0.414 | 0.319 | 0.393 | 0.512 |
| Environmental Quality (EQ) | 0.246 | 0.426 | 0.339 | 0.345 | 0.331 |
| Business Environment (BE) | 0.248 | 0.427 | 0.348 | 0.367 | 0.329 |
| Working Environment (WE) | 0.256 | 0.401 | 0.320 | 0.364 | 0.375 |
| 0.417 | 0.331 | 0.367 | 0.387 | ||
| 0.427 | 0.348 | 0.393 | 0.512 |
| v | Workers | Residents | Regulators | Investors |
|---|---|---|---|---|
| 0.00 | 0.427 | 0.348 | 0.393 | 0.512 |
| 0.10 | 0.426 | 0.346 | 0.391 | 0.499 |
| 0.20 | 0.425 | 0.345 | 0.388 | 0.487 |
| 0.30 | 0.424 | 0.343 | 0.386 | 0.474 |
| 0.40 | 0.423 | 0.341 | 0.383 | 0.462 |
| 0.50 | 0.422 | 0.340 | 0.380 | 0.449 |
| 0.60 | 0.421 | 0.338 | 0.378 | 0.437 |
| 0.70 | 0.420 | 0.336 | 0.375 | 0.424 |
| 0.80 | 0.419 | 0.334 | 0.373 | 0.412 |
| 0.90 | 0.418 | 0.333 | 0.370 | 0.400 |
| 1.00 | 0.417 | 0.331 | 0.367 | 0.387 |
| v | Workers | Residents | Regulators | Investors |
|---|---|---|---|---|
| (v = 0) | 0.427 | 0.348 | 0.393 | 0.512 |
| VSI | 0.573 | 0.652 | 0.607 | 0.488 |
| Rank | 3 | 1 | 2 | 4 |
| (v = 0.5) | 0.422 | 0.340 | 0.380 | 0.449 |
| VSI | 0.578 | 0.660 | 0.620 | 0.551 |
| Rank | 3 | 1 | 2 | 4 |
| (v = 1.0) | 0.417 | 0.331 | 0.367 | 0.387 |
| VSI | 0.583 | 0.669 | 0.633 | 0.613 |
| Rank | 4 | 1 | 2 | 3 |
| Stakeholders: Workers | |
|---|---|
| Rank of four aspects: WE(1) > PI(2) > EQ(3) > BE(4) | |
| Development path: PI(2) → WE(1) {N} PI(2) → BE(4) → WE(1) {Y} PI(2) → EQ(3) → WE(1) {Y} PI(2) → EQ(3) →BE(4) → WE(1) {Y} | Suggested improvement path: PI(2) → BE(4) → WE(1) {Y} PI(2) → EQ(3) → WE(1) {Y} PI(2) → EQ(3) →BE(4) → WE(1) {Y} |
| Stakeholders: Residents | |
| Rank of four aspects: PI(1) > WE(2) > EQ(3) > BE(4) | |
| Development path: PI(1) → WE(2) {Y} PI(1) → BE(4) → WE(2) {Y} PI(1) → EQ(3) → WE(2) {Y} PI(1) → EQ(3) →BE(4) → WE(2) {Y} | Suggested improvement path: PI(1) → WE(2) {Y} PI(1) → BE(4) → WE(2) {Y} PI(1) → EQ(3) → WE(2) {Y} PI(1) → EQ(3) →BE(4) → WE(2) {Y} |
| Stakeholders: Regulators | |
| Rank of four aspects: EQ(1) > WE(2) > BE(3) > PI(4) | |
| Development path: PI(4) → WE(2) {N} PI(4) → BE(3) → WE(2) {N} PI(4) → EQ(1) → WE(2) {Y} PI(4) → EQ(1) →BE(3) → WE(2) {Y} | Suggested improvement path: PI(4) → EQ(1) → WE(2) {Y} PI(4) → EQ(1) →BE(3) → WE(2) {Y} |
| Stakeholders: Investors | |
| Rank of four aspects: BE(1) > EQ(2) > WE(3) > PI(4) | |
| Development path: PI(4) → WE(3) {N} PI(4) → BE(1) → WE(3) {Y} PI(4) → EQ(2) → WE(3) {Y} PI(4) → EQ(2) →BE(1) → WE(3) {Y} | Suggested improvement path: PI(4) → BE(1) → WE(3) {Y} PI(4) → EQ(2) → WE(3) {Y} PI(4) → EQ(2) →BE(1) → WE(3) {Y} |
Publisher’s Note: MDPI stays neutral with regard to jurisdictional claims in published maps and institutional affiliations. |
© 2022 by the authors. Licensee MDPI, Basel, Switzerland. This article is an open access article distributed under the terms and conditions of the Creative Commons Attribution (CC BY) license (https://creativecommons.org/licenses/by/4.0/).
Share and Cite
Lim, S.S.; Nguyen, H.N.; Lin, C.-L. Exploring the Development Strategies of Science Parks Using the Hybrid MCDM Approach. Sustainability 2022, 14, 4351. https://doi.org/10.3390/su14074351
Lim SS, Nguyen HN, Lin C-L. Exploring the Development Strategies of Science Parks Using the Hybrid MCDM Approach. Sustainability. 2022; 14(7):4351. https://doi.org/10.3390/su14074351
Chicago/Turabian StyleLim, Sirirat Sae, Hong Ngoc Nguyen, and Chia-Li Lin. 2022. "Exploring the Development Strategies of Science Parks Using the Hybrid MCDM Approach" Sustainability 14, no. 7: 4351. https://doi.org/10.3390/su14074351
APA StyleLim, S. S., Nguyen, H. N., & Lin, C.-L. (2022). Exploring the Development Strategies of Science Parks Using the Hybrid MCDM Approach. Sustainability, 14(7), 4351. https://doi.org/10.3390/su14074351