Article

Transcriptomic and Non-Targeted Metabolomic Analyses Reveal the Flavonoid Biosynthesis Pathway in Auricularia cornea

1
Shandong Provincial Key Laboratory of Agricultural Microbiology, College of Plant Protection, Shandong Agricultural University, Tai’an 271018, China
2
Shandong Mushroom Industiral Technology Innonation Research Institute, Jining 272000, China
*
Author to whom correspondence should be addressed.
These authors contributed equally to this work.
Molecules 2022, 27(7), 2334; https://doi.org/10.3390/molecules27072334
Submission received: 18 February 2022 / Revised: 1 April 2022 / Accepted: 1 April 2022 / Published: 4 April 2022

Abstract

:
Flavonoids, which are abundant in plants, are recognized for their antioxidant and anticancer roles in clinical applications. However, little is known about the molecular basis of flavonoid biosynthesis in fungi. In this study, we found that inclusion of leachate of Korshinsk peashrub (Caragana korshinskii) in the fermentation medium increased the total flavonoid content of the edible fungus Auricularia cornea by 23.6% relative to that grown in a control medium. Combined transcriptomic and non-targeted metabolomic analysis of the flavonoid biosynthesis pathway in A. cornea illustrated that there are important metabolites in the phenylpropanoid, coumarin and isoflavonoid biosynthesis pathways. In addition, we found that certain homologous genes encode phenylalanine ammonia lyase (PAL), polyphenol oxidase (PPO) and chalcone isomerase (CHI) in these biosynthesis pathways. These results, in this study, provide a new line for studying the regulation of flavonoid production in edible fungi.

1. Introduction

Flavonoids are important secondary metabolites which can prevent or even ameliorate chronic diseases or disease symptoms such as cancer [1], diabetes [2] and inflammation [3,4]. Dietary flavonoids are present in many commonly consumed fruits, vegetables, grains, herbs and beverages [5]. Recently, mushrooms and other edible fungi have gained importance as functional foods, thus, creating a bridge between medicine and food [6]. Mushrooms and other edible fungi are known to accumulate a variety of secondary metabolites with antioxidant activities, such as phenolic compounds and flavonoids [7].
Auricularia cornea Ehrenb., previously named A. polytricha (Mont.) Sacc [8], is widely cultivated in China [9]. Auricularia spp. has long been used as a dietary supplement and natural-medicinal mushroom. The medicinal properties of this genus are primarily associated with the polysaccharides and flavonoids in their fruiting bodies [10].
Flavonoids are compounds derived from precursors originating via the phenylpropanoid pathway. Briefly, coumaroyl-CoA is synthesized from the amino acid phenylalanine by three enzymatic steps initiated by phenylalanine ammonia-lyase (PAL) [11]. Flavonoid synthesis starts by the condensation of 4-coumaroyl-CoA with three molecules of malonyl-CoA, yielding naringenin chalcone. This reaction is catalyzed by chalcone synthase (CHS). The generated chalcone is subsequently isomerized by chalcone flavanone isomerase (CHI) to yield a flavanone. From these central intermediates, the pathway diverges into several side branches, each yielding a different class of flavonoid, isoflavone, coumarin, etc. [12].
Several studies showed that flavonoid production is regulated by flavonoid structural genes [13] and transcription factors [14], leading to differences in the yield and type of flavonoid [15]. However, these studies primarily focused on plants, and there are few reports concerning the influence on fungal genes involved in flavonoid accumulation. Korshinsk peashrub (Caragana korshinskii Kom.), a drought-tolerant, perennial mesquite shrub, is widely distributed in northeastern, northwestern and northern China [16,17]. Significantly, there are abundant phenolic compounds in Caragana. For this reason, it is an extreme cultivation material for edible mushrooms. Whether the mushrooms can make use of these compounds remains unknown. Therefore, we detected the whole metabolome of the mycelia in the liquid medium with leachate of C. korshinskii. The aims of our study were twofold; one objective was to investigate if leachate from C. korshinskii used as the fermentation medium could increase the total flavonoid content of A. cornea. The second objective was to elucidate the flavonoid biosynthesis pathway in A. cornea.

2. Results

2.1. Overview of Qualitative Metabolomics Analysis of A. cornea

There was a 23.6% increase (p < 0.05) in the total flavonoid content of A. cornea mycelia in the CYM-kps medium compared with that in the CYM medium. The concentration of total flavonoids was the highest, 3.14%, in mycelia cultured in CYM-kps medium with a leachate concentration of 75 g/L (Figure 1A). In order to fully elucidate the molecular basis of flavonoid biosynthesis in A. cornea, we cultured mycelia in CYM-kps medium (leachate concentration of 75 g/L) for all subsequent transcriptomic and non-targeted metabolomic analyses; mycelia cultured in CYM medium was used as the control.
The non-targeted metabolomic analysis was conducted to investigate, in more detail, the possible mechanism of flavonoid biosynthesis caused by media mixing leachate of Korshinsk peashrub. To compare the different metabolite compositions of A. cornea in different media, the mycelia of different media (CYM and CYM-kps) were subjected to an LC–MS analysis. The sample repetition correlation graph showed that the sample reproducibility was good (Figure 1B). A hierarchical heatmap clustering analysis of the samples showed that all the biological replicates were grouped together, indicating the good quality and high reliability of the metabolome data (Figure 1C). Metabolomics data were deposited to the EMBL-EBI MetaboLights database with the identifier MTBLS2337. The complete dataset can be accessed at https://www.ebi.ac.uk/metabolights/MTBLS2337 (accessed on 19 January 2021). The metabolome data can be used for subsequent analyses.

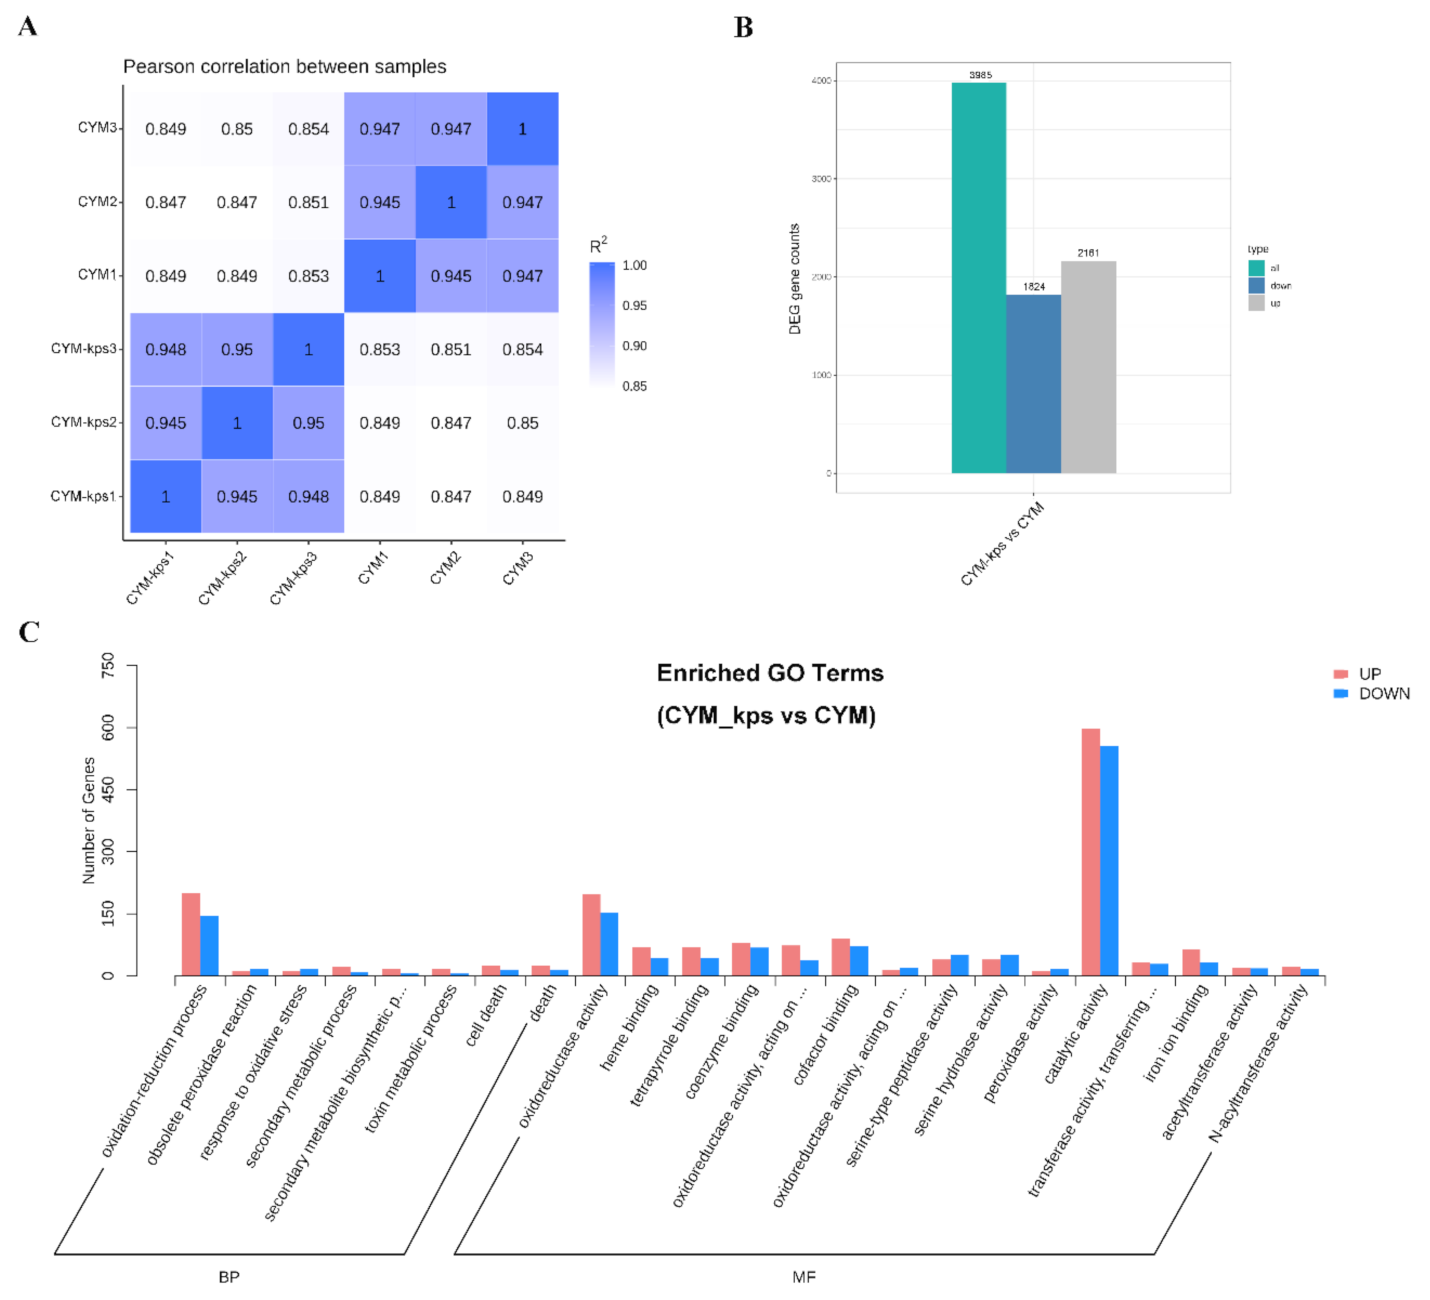
2.2. Overview of Qualitative Transcriptomic Analysis of A. cornea

The results of Pearson correlation analysis between samples showed that the sample reproducibility was good (R2 > 0.8), and the transcriptomic data can be used for subsequent analyses (Figure 2A). Transcriptome data were deposited in the NCBI database with the identifier SAMN17169317-SAMN17169328. The complete dataset can be accessed at https://www.ncbi.nlm.nih.gov/sra/17169317-17169328 (accessed on 21 December 2020).
A total of 3985 different expression genes between CYM and CYM-kps were detected. There were 1824 and 2161 genes down-regulated and up-regulated in the different media, respectively (Figure 2B). All of differential expressed genes were analyzed by GO classification (Figure 2C). The results showed the differential expressed genes were mainly related to the oxidation–reduction process, oxidoreductase activity and catalytic activity, which increased the number of up-regulated genes more than down-regulated genes. In addition, most of the differential expressed genes involved in the secondary metabolic process were up-regulated. The results indicated that a lot of biological process were changed in the different media and suggested that the secondary metabolisms were rearranged.

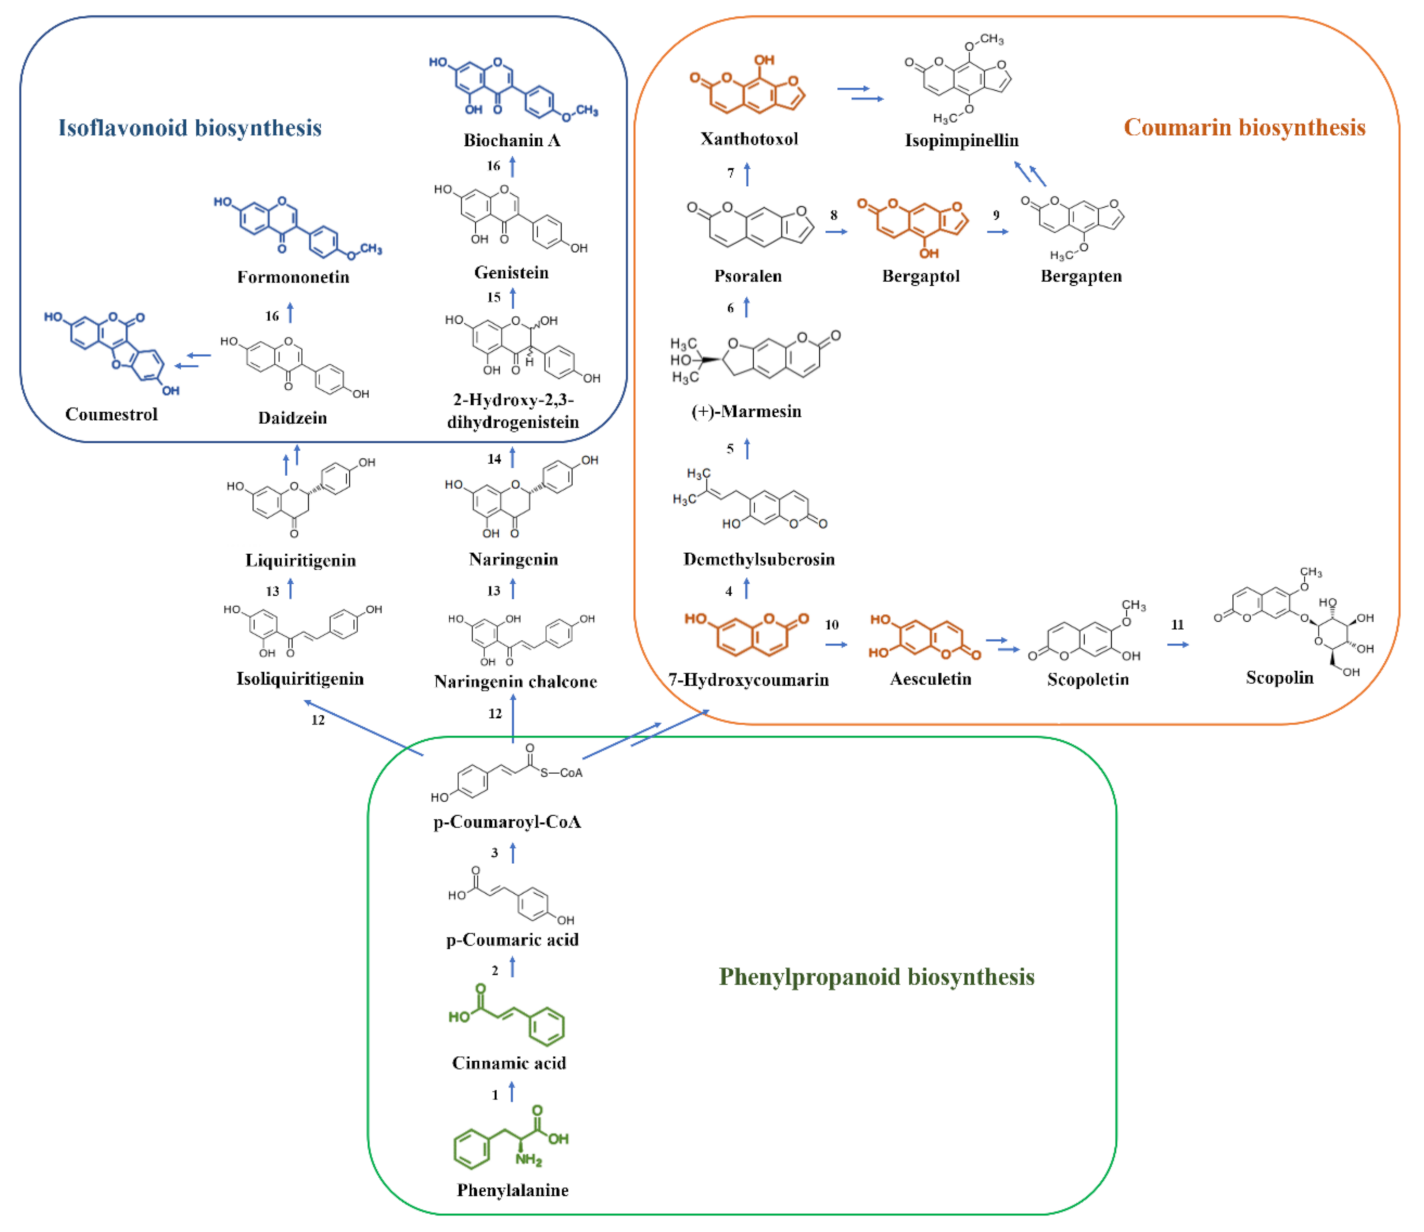
2.3. The Flavonoid Biosynthesis Pathway in A. cornea

Non-targeted metabolomic data analysis indicated nine metabolites in the flavonoid biosynthesis pathways, specifically in the phenylpropanoid biosynthesis, coumarin biosynthesis and isoflavonoid biosynthesis pathways. There were two metabolites, phenylalanine and cinnamic acid, in the phenylpropanoid biosynthesis pathway. There were four metabolites, 7-hydroxycoumarin, aesculetin, xanthotoxol and bergaptol, in the coumarin biosynthesis pathway. The other three metabolites were coumestrol, formonoetin and biochanin A in the isoflavonoid pathway. We mapped a flavonoid biosynthesis pathway in A. cornea (Figure 3).
Metabolomic analysis revealed that the expression patterns of the majority of the nine metabolites identified to be involved in the flavonoid biosynthesis pathway in A. cornea were significantly higher in mycelia cultured in the CYM-kps medium relative to the control (Figure 4, Supplementary Material S1–S2). The expression patterns of 7-hydroxycoumarin, xanthotoxol and bergaptol in the coumarin biosynthesis pathway were 1.31-fold, 1.30-fold and 1.31-fold higher, respectively. Interestingly, aesculetin was not detected in control cultures but was present at a level of 606.11 in mycelia cultured in CYM-kps medium. The expression of biochanin A and formononetin was 8.01-fold and 8.56-fold higher, respectively, in CYM-kps compared to the control. However, no significant difference was observed regarding coumestrol expression. Finally, phenylalanine and cinnamic acid, which are important precursors of some flavonoids, were significantly down-regulated in the CYM-kps medium. A possible explanation for this observation is that they are involved in the coumarin and isoflavonoid biosynthesis pathways.
The aforementioned nine metabolites are depicted in different colors in Figure 3. Blue depicts the isoflavonoid biosynthesis pathway, orange indicates the coumarin biosynthesis pathway and green indicates the phenylpropanoid biosynthesis pathway. The numbers indicate enzymatic activity, and double arrows indicate multistep reactions. 1. Phenylalanine ammonia lyase (PAL); 2. Cinnamate 4-hydroxylase (C4H); 3. 4-coumaric acid coenzyme A ligase (4CL); 4. Umbelliferone 6-dimethylallyltransferase (U6DT); 5. Marmesin synthase (MS); 6. Psoralen synthase (PS); 7. Psoralen 8-hydroxylase (P8H); 8. Psoralen 5-hydroxylase (P5H); 9. Bergaptol 5-O-methyltransferase (B5OMT); 10. Polyphenol oxidase (PPO); 11. Scopoletin glucosyltransferase (SGT); 12. Chalcone synthase (CHS); 13. Chalcone isomerase (CHI); 14. 2-hydroxyisoflavanone synthase (IFS); 15. 2-hydroxyisoflavanone dehydratase (HIDH); 16. Isoflavone 4-O-methyltransferase (HI4OMT).
CYM, complete yeast medium as the control group; CYM-kps, CYM medium with leachate of Korshinsk peashrub (Caragana korshinskii) at a concentration of 75 g/L; * indicates statistical significance (p < 0.05) compared to the control.

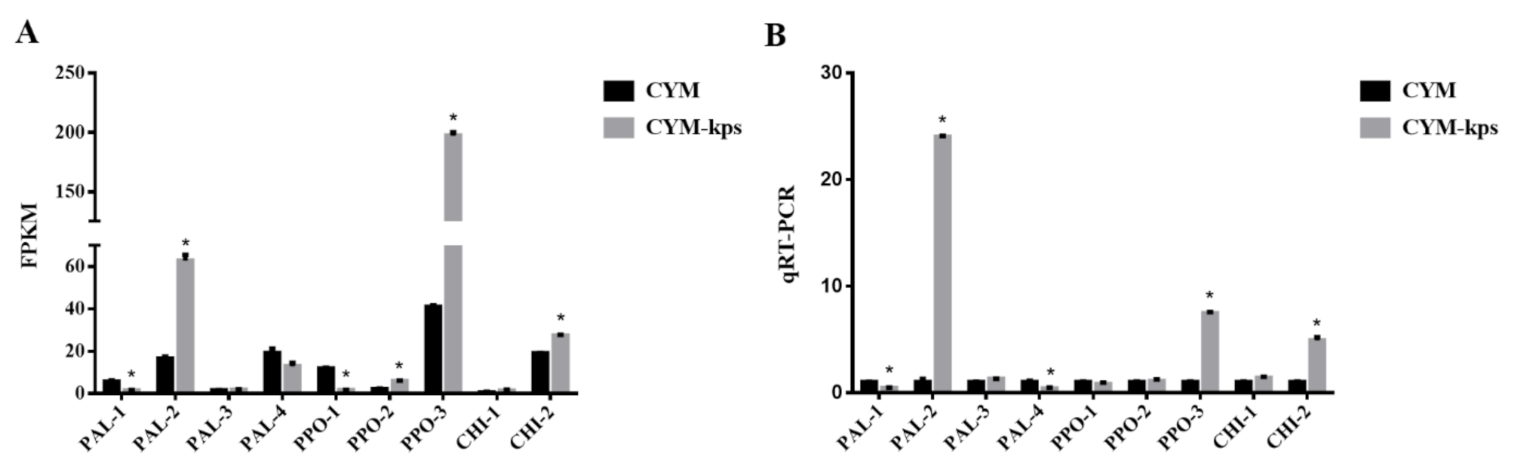
2.4. The Expression Levels of the Genes Encoding Key Enzymes Involved in the Flavonoid Biosynthesis Pathway

There were four homologous genes, PAL-1, PAL-2, PAL-3 and PAL-4 (GenBank accession numbers: MW652285-MW652288), encoding phenylalanine ammonia lyase (PAL), three homologous genes, PPO-1, PPO-2 and PPO-3 (GenBank accession numbers: MW652289-MW652291), encoding polyphenol oxidase (PPO) and two homologous genes, CHI-1 and CHI-2 (GenBank accession numbers: MW922315, MW922316), encoding chalcone isomerase (CHI), identified by transcriptome analysis in A. cornea. The expression levels of PAL-2, PPO-2, PPO-3 and CHI-2 were significantly up-regulated (p < 0.05) in mycelia cultured in CYM-kps medium relative to the control (Figure 5A). The expression levels (FPKM) of PAL-2, PPO-2, PPO-3 and CHI-2 were 3.79-fold, 2.74-fold, 4.81-fold and 1.44-fold higher, respectively, in CYM-kps medium. On the other hand, the expression levels of PAL-1, PAL-4 and PPO-1 were down-regulated. Lastly, the expression levels (FPKM) of PAL-3 and CHI-1 were 1.22-fold and 2.63-fold higher, respectively, in CYM-kps medium, but these differences were not significant (p > 0.05). In addition to transcriptome analysis, we used qRT-PCR to compare these genes’ expression levels in between CYM-kps medium and the control (Figure 5B). The results of qRT-PCR analyses were consistent with the gene expression transcription analyses.

3. Discussion

The presence of flavonoids in edible fungi was once suspected in the past [18,19]. However, some reports found that flavonoids are widespread in edible fungi, for instance, Fistulina hepatica [20], Hericium corallloides [21], Pleurotus florida [22] and Sanghuangporus vaninii [23]. The doubt is due to lack of direct analytical evidence of the presence of flavonoids in edible fungi.
In fact, there are flavonoids in the edible fungi. Firstly, some studies proved the existence of a flavonoid biosynthesis pathway in edible fungi [24]. Several studies reported the total flavonoid content in edible fungi such as Lentinus edodes [25], Volvariella volvacea [26], Tricholoma spp. [27], Pleurotus ostreatus and P. citrinopileatus [28]. Secondly, a genome-wide survey across the fungal kingdom revealed the presence of all the gene/protein sequences associated with flavonoid biosynthesis [24]. They included phenylalanine ammonia lyase [29], chalcone isomerase and flavonol synthase [30]. This indicates that fungi synthesize enzymes associated with flavonoid biosynthesis. Finally, the contents of specific flavonoids, such as quercetin [20] and catechin [31], were measured in edible fungi by high-performance liquid chromatography (HPLC). However, there are no standard assays to quantify flavonoids in edible fungi, and the molecular basis of their biosynthesis remains unclear. To elucidate this in A. cornea, we used metabolomic sequencing by LC–MS. In addition, we compared the expression patterns of genes in the flavonoid biosynthesis pathway between mycelia cultured in CYM medium and CYM-kps medium. Our results illustrated that there are important metabolites in the flavonoid biosynthesis pathway in A. cornea, with transcriptome analysis indicating the involvement of homologous genes encoding PAL, PPO and CHI.
There are more abundant phenolic compounds which were shown to act as excellent antioxidants in Caragana [32]. Interestingly, these phenolic compounds, including flavonoids, gallic acid, chlorogenic acid and rutin, also exist in edible fungus Auricularia spp.; the results suggest that a submerged culture of Auricula is an effective method to produce total phenolics [33,34]. Findings were similar in our study; the results of metabolomic data showed that various phenolic compounds existed in the mycelia of A. cornea. Furthermore, previous studies reported that edible fungi can synthesize flavonoids, and flavonoid contents can be enriched by fermentation [35] or nitric oxide [36]. Consistent with these studies, we found that the flavonoid content in mycelia of A. cornea was enriched by fermentation through the addition of leachate of C. korshinskii. Unfortunately, our data have not identified a specific reason for enhancing the content of flavonoids. We suspect that the different levels of precursors or intermediate stimuli caused this difference. However, the regulation mechanism of leachate is unknown and worthy of further study.
The flavonoid biosynthetic pathway was partially mapped in S. vaninii [30]. However, there have been no studies on the biosynthesis of coumarin and isoflavones in fungi. In this study, non-targeted metabolomic and transcriptomic data confirmed the presence of nine metabolites in the flavonoid biosynthesis pathway, relating to phenylpropanoid, coumarin and isoflavonoid biosynthesis. These results provide a preliminary basis for the study of secondary metabolic biosynthesis pathways in edible and/or medicinal fungi.

4. Materials and Methods

4.1. Strains and Culture Conditions

An A. cornea strain, AC5, was provided by the Collection Center of Mushroom at Jilin Agricultural University. It was grown at 26 °C on potato dextrose agar (PDA) medium for 7 d and then inoculated into 100 mL complete yeast medium (CYM) (1% maltose, 2% glucose, 0.2% yeast extract, 0.2% tryptone, 0.05% MgSO4·7H2O, 0.46% KH2PO4). It is widely known that Caragana is rich in phenolic compounds, and it is an extreme cultivation material for edible mushrooms. Whether the mushroom can make use of these compounds remains unknown. Therefore, we detected the whole metabolome of the mycelia in the CYM and CYM with leachate of Caragana. It is important to note, however, that there are several tannin substances contained in the leachate of Korshinsk peashrub (Caragana korshinskii) which are affected the fungal mycelial growth. Due to this, we performed a screening in four different leachate concentrations in our initial experiments. The mycelia were pre-cultured for 3 d in CYM medium. The branches of Korshinsk peashrub were collected from the Ningxia province in August. The leachate of Korshinsk peashrub was from branches extract. Briefly, the branches of Korshinsk peashrub were cut into small segments of about 2 cm. Distilled water (1L) was added to the different weights (25 g, 50 g, 75 g and 100 g) of Korshinsk peashrub and boiled for 15 min. After filtration, the solution was collected, and the volume was set to 1 L by adding distilled water. The leachate concentrations were 25 g/L, 50 g/L, 75 g/L and 100 g/L, respectively. Following extraction, the 100 mL CYM medium was mixed with 50 mL of leachate of Korshinsk peashrub at several different concentrations as CYM-kps medium, and CYM medium was used as a control (total volume was 150 mL). Mycelia cultures were shaken (160 rpm) at 26 °C for 6 d. The collected mycelia were frozen in liquid nitrogen for RNA extraction and were dried to a constant weight at 60 °C for flavonoid content determination.

4.2. Determination of Total Flavonoid Content

The total flavonoid content was measured using a modified method [37]. Briefly, 0.3 g of dried, ground mycelium was suspended in 10 mL of 100% ethyl alcohol. The mixture was agitated for 1 h using ultrasound. Three milliliters of the extracts was diluted with an additional 12 mL absolute ethyl alcohol. Subsequently, the mixture was sequentially mixed with 1 mL aluminum nitrate (100 g/L, aqueous) and 1mL potassium acetate (98 g/L, aqueous). Finally, the mixture was diluted with distilled water to a total volume of 50 mL and then allowed to rest for 1 h at room temperature. The absorbance at 420 nm was then measured spectrophotometrically. Absolute ethyl alcohol was used as the blank. A standard curve of rutin was graphed based on concentrations of 0.06, 0.13, 0.20, 0.27 and 0.33 mg/mL. The concentration of total flavonoids on a dry matter basis was calculated using the following formula:
X = m/(W × d × 1000) × 100%
where ‘X’ is the total flavonoid content, ‘m’ is the quantity of rutin according to the standard curve (mg), ‘W’ is the quantity of the sample (g) and ‘d’ is the dilution rate.

4.3. Sample Preparation and LC–MS Analysis

Mycelia cultures were shaken (160 rpm) in CYM and CYM-kps media at 26 °C for 9 d (including 3 d pre-culture). Thirty milligrams of mycelial sample, collected by filtration, was extracted by adding 1 mL of a solution composed of methanol–water (7: 3, v/v). Subsequently, two 5 mm steel beads were added to the solution, placed in a fully automatic sample fast grinding machine, Wonbio-E (Shanghai, China), and processed for 2 min at 60 Hz. Ultrasonic extraction was performed in an ice-water bath for 30 min, after which, extracts were stored overnight at −20 °C. Extraction was centrifuged at 13,000 rpm for 10 min. The supernatants were collected, filtered through 0.22 µm polyvinylidene fluoride membrane and stored at −80 °C until subsequent LC–MS analysis. An internal standard of 2-chloro-L-phenylalanine (0.3 mg/mL), dissolved in methanol, was added to all sample extracts.
To identify mycelial metabolites, 12 samples from three independent biological replicates were randomly analyzed by LC–MS analysis. An ACQUITY UPLC I-Class system (Waters Corporation, Milford, MA, USA) coupled with VION IMS QTOF mass spectrometer (Waters Corporation, Milford, MA, USA) was used to analyze the metabolic profile in both ESI-positive and ESI-negative ion modes. Chromatographic separation of samples was performed using an ACQUITY UPLC HSS T3 column (2.1 mm × 100 mm, 1.8 μm). The column temperature was maintained at 45 °C. Mobile phase A was 0.1% formic acid in deionized water, and mobile phase B was acetonitrile containing 0.1% formic acid. The elution profile was set as follows: 0.01 min, 5% B; 2 min, 5% B; 4 min, 30% B; 8 min, 50% B; 10 min, 80% B; 14 min, 100% B; 15.1 min, 5% B; and 16 min, 5% B. The flow rate was 0.35 mL/min, and the injection volume was 2 μL. Instrument settings were as follows: ion source: ESI; capillary temperature: 320 °C; spray voltages: (+3.5, −3) kV; mass scan range: 125–1000; resolution (full scan): 70,000; resolution (HCD MS/MS scans): 17,500; sheath gas flow rate (Arb): 40 (positive ion) and 35 (negative ion); aux. gas flow rate (Arb): 10 (positive ion) and 8 (negative ion).

4.4. Metabolite Identification and Quantification

Raw data were collected using Software UNIFI 1.8.1. Baseline filtration, peak identification, peak alignment, peak filling, retention time (RT) and normalization of the raw data were performed by Progenesis QI v2.3 (Waters Corporation, Milford, MA, USA). Metabolite identifications based on exact mass-to-charge ratios (m/z), isotope distributions, fragmentation patterns and database hits (The Human Metabolome Database, Lipidmaps and METLIN) were performed. Additionally, the self-written R package and in-house, self-built secondary mass spectrometry database, which contained 550 metabolites, was applied in metabolite identification. Data processing parameters were applied as follows: precursor tolerance: 5 ppm; fragment tolerance: 10 ppm; and product ion threshold: 5%. Compounds with more than 50% missing values for each condition were removed, and the remaining missing values were replaced by half of the minimum value. Qualitative data were analyzed according to the score of qualitative results. Compounds with a score of more than 36 (a full score of 60) were accepted, whereas those with a score of less than 36 were deleted. The score consisted of 20 points for MS/MS matching, 20 points for MS/MS fragmentation matching and 20 points for isotopic distribution matching, with a maximum total score of 60 points. In addition, a mixture of 12 samples with equivalent quantities was used as quality control (QC) samples, and the QC samples were injected to monitor the stability of the analysis. Further, R2Y, Q2Y and 200-permutation tests were used to evaluate the quality of the orthogonal partial least squares discriminant analysis (OPLS-DA) mode. Metabolomics data were deposited to the EMBL-EBI MetaboLights database [38].

4.5. Transcriptome Sequencing Analysis

A total amount of 1.5 µg RNA per sample was used as the input for RNA sample preparation. Sequencing libraries were generated using NEBNext® Ultra RNA Library Prep Kit for Illumina® (NEB, Ipswich, MA, USA). The clustering of the index-coded samples was performed on a cBot Cluster Generation System using TruSeq PE Cluster Kit v3-cBot-HS (Illumina) according to the manufacturer’s instructions. After cluster generation, the library preparations were sequenced on an Illumina Hiseq platform and paired-end reads were generated.
Raw data (raw reads) in fastq format were first processed through in-house perl scripts. In this step, clean data (clean reads) were obtained by removing reads containing adapters, reads containing poly-N and low-quality reads from raw data. At the same time, the Q20, Q30, GC-content and sequence duplication level of the clean data were calculated. All of the downstream analyses were based on clean, high-quality data.
Gene function was annotated based on the following databases: Nr (NCBI non-redundant protein sequences); Nt (NCBI non-redundant nucleotide sequences); Pfam (Protein family); KOG/COG (Clusters of Orthologous Groups of Proteins); Swiss-Prot (A manually annotated and reviewed protein sequence database); KO (KEGG Ortholog database); and GO (Gene Ontology).

4.6. Gene Expression Analysis and Statistical Analysis

To evaluate the genes encoding key enzymes in the flavonoid synthesis pathway in A. cornea, total RNA was extracted from samples using the RNAiso Plus Kit (Takara, Kusatsu, Japan) according to our previous study [39]. First-strand cDNA was synthesized from total RNA using the HiScript III RT SuperMix for qPCR (+gDNA wiper) (TransGen Biotech, Beijing, China). We performed qRT-PCR using a LightCycler 96 SW 1.1 instrument with ChamQ Universal SYBR qPCR Master Mix (Vazyme, Nanjing, China) to analyze the transcription levels of genes based on the relative quantitation method. The gene expression level of polyubiquitin (UBQ) was found to be stable under experimental conditions and was accordingly used as the reference gene [40]. The primers for qRT-PCR analysis were designed using Primer5.0 software and are listed in Table 1. The cycling reaction conditions were as follows: 30 s at 95 °C, 40 cycles of 10 s at 95 °C and 30 s at 60 °C. The relative expression levels of specific genes were calculated according to the 2△△ct method [41]. Three biological replicates and three technical replicates were examined. The statistical significance of differences in results was tested with IBM SPSS Statistics 20.

5. Conclusions

The leachate of Korshinsk peashrub (Caragana korshinskii) in the fermentation medium increased the total flavonoid content of the edible fungus Auricularia cornea. Combined transcriptomic and non-targeted metabolomic analysis of the flavonoid biosynthesis pathway in A. cornea illustrated that there are important metabolites in the phenylpropanoid, coumarin and isoflavonoid biosynthesis pathways. In addition, we found that certain homologous genes encode PAL, PPO and CHI in these biosynthesis pathways. These results, in this study, provide a new line for studying the regulation of flavonoid production in edible fungi.

Supplementary Materials

The following are available online at https://www.mdpi.com/article/10.3390/molecules27072334/s1, Supplementary meterial S1: The metabolites data in this study; Supplementary meterial S2: The HPLC chromatograms of metabolises in this study.

Author Contributions

All authors contributed to the study conception and design. Material preparation, data collection and analysis were performed by S.Z., X.B., X.L., Q.W., L.W., W.W. and Z.L. The first draft of the manuscript was written by L.M., and all authors commented on previous versions of the manuscript. All authors have read and agreed to the published version of the manuscript.

Funding

This study was funded by the Mushroom Technology System of Shandong Province (grant number SDAIT-07-06) and the Agricultural Science and Technology Fund of Shandong Province (industrial upgrading project of Park) (grant number 2019YQ006).

Institutional Review Board Statement

Not applicable.

Informed Consent Statement

Not applicable.

Data Availability Statement

The data presented in this study are available on request from the corresponding author.

Acknowledgments

We thank the Shanghai Luming Biological Technology Co., Ltd. (Shanghai, China) for providing metabolomics services.

Conflicts of Interest

The authors declare no conflict of interest.

Sample Availability

Samples are not available.

References

  1. Neuhouser, M.L. Dietary flavonoids and cancer risk: Evidence from human population studies. Nutr. Cancer 2004, 50, 1–7. [Google Scholar] [CrossRef] [PubMed]
  2. Guo, X.; Ruan, Y.; Li, Z.; Li, D. Flavonoid subclasses and type 2 diabetes mellitus risk: A meta-analysis of prospective cohort studies. Crit. Rev. Food Sci. Nutr. 2019, 59, 2850–2862. [Google Scholar] [CrossRef] [PubMed]
  3. Middleton, E. Effect of plant flavonoids on immune and inflammatory cell function. Adv. Exp. Med. Biol. 1998, 439, 175–182. [Google Scholar] [CrossRef] [PubMed]
  4. Maleki, S.J.; Crespo, J.F.; Cabanillas, B. Anti-inflammatory effects of flavonoids. Food Chem. 2019, 299, 125124. [Google Scholar] [CrossRef] [PubMed]
  5. Erdman, J.W., Jr.; Balentine, D.; Arab, L.; Beecher, G.; Dwyer, J.T.; Folts, J.; Harnly, J.; Hollman, P.; Keen, C.L.; Mazza, G.; et al. Flavonoids and heart health: Proceedings of the ILSI North America Flavonoids Workshop, May 31-June 1, 2005, Washington, DC. J. Nutr. 2007, 137, 718S–737S. [Google Scholar] [CrossRef] [PubMed] [Green Version]
  6. Hou, Y.; Jiang, J.G. Origin and concept of medicine food homology and its application in modern functional foods. Food Funct. 2013, 4, 1727–1741. [Google Scholar] [CrossRef]
  7. Azieana, J.; Zainon, M.N.; Noriham, A.; Rohana, M.N. Total phenolic and flavonoid content and antioxidant activities of ten Malaysian wild mushrooms. Open Access Libr. J. 2017, 4, e3987. [Google Scholar] [CrossRef]
  8. Zheng, S.; Huang, H.; Zhang, R.; Cao, L. Removal of Cr (VI) from aqueous solutions by fruiting bodies of the jelly fungus (Auricularia polytricha). Appl. Microbiol. Biotechnol. 2014, 98, 8729–8736. [Google Scholar] [CrossRef]
  9. Jia, D.; Wang, B.; Li, X.; Peng, W.; Zhou, J.; Tan, H.; Tang, J.; Huang, Z.; Tan, W.; Gan, B.; et al. Proteomic Analysis Revealed the Fruiting-Body Protein Profile of Auricularia polytricha. Curr. Microbiol. 2017, 74, 943–951. [Google Scholar] [CrossRef]
  10. Bai, H.; Wang, Z.; Cui, J.; Yun, K.; Zhang, H.; Liu, R.H.; Fan, Z.; Cheng, C. Synergistic Radiation Protective Effect of Purified Auricularia auricular-judae Polysaccharide (AAP IV) with Grape Seed Procyanidins. Molecules 2014, 19, 20675–20694. [Google Scholar] [CrossRef]
  11. Fraser, C.M.; Chapple, C. The phenylpropanoid pathway in Arabidopsis. Arab. Book 2011, 9, e0152. [Google Scholar] [CrossRef] [PubMed] [Green Version]
  12. Winkel, B.S.J. The Biosynthesis of Flavonoids. In The Science of Flavonoids; Grotewold, E., Ed.; Springer: New York, NY, USA, 2006; pp. 71–95. [Google Scholar]
  13. Lucheta, A.R.; Silva-Pinhati, A.C.O.; Basílio-Palmieri, A.C.; Berger, I.J.; Freitas-Astúa, J.; Cristofani, M. An in silico analysis of the key genes involved in flavonoid biosynthesis in Citrus sinensis. Genet. Mol. Biol. 2007, 30, 819–831. [Google Scholar] [CrossRef]
  14. Czemmel, S.; Heppel, S.C.; Bogs, J. R2R3 MYB transcription factors: Key regulators of the flavonoid biosynthetic pathway in grapevine. Protoplasma 2012, 249, S109–S118. [Google Scholar] [CrossRef] [PubMed]
  15. Zha, J.; Wu, X.; Gong, G.; Koffas, M.A.G. Pathway enzyme engineering for flavonoid production in recombinant microbes. Metab. Eng. Commun. 2019, 9, e00104. [Google Scholar] [CrossRef]
  16. Cheng, J.; Wang, J.; Cheng, J.; Luo, Z. Spatial-temporal variability of Caragana korshinskii vegetation growth in the Loess Plateau. Sci. Silvae Sin. 2013, 49, 14–20. [Google Scholar] [CrossRef]
  17. Du, F.; Qu, J.; Hu, Q.; Yuan, X.; Yin, G.; Wang, L.; Zou, Y. Maximizing the value of Korshinsk peashrub branches by the integration of Pleurotus tuoliensis cultivation and anaerobic digestion of spent mushroom substrate. Renew. Energy 2021, 179, 679–686. [Google Scholar] [CrossRef]
  18. Barros, L.; Dueñas, M.; Ferreira, I.C.F.R.; Baptista, P.; Santos-Buelga, C. Phenolic acids determination by HPLC-DAD-ESI/MS in sixteen different Portuguese wild mushrooms species. Food Chem. Toxicol. 2009, 47, 1076–1079. [Google Scholar] [CrossRef]
  19. Gil-Ramírez, A.; Pavo-Caballero, C.; Baeza, E.; Baenas, N.; Garcia-Viguera, C.; Marín, F.R.; Soler-Rivas, C. Mushrooms do not contain flavonoids. J. Funct. Foods 2016, 25, 1–13. [Google Scholar] [CrossRef] [Green Version]
  20. Ribeiro, B.; Valentão, P.; Baptista, P.; Seabra, R.M.; Andrade, P.B. Phenolic compounds, organic acids profiles and antioxidative properties of beefsteak fungus (Fistulina hepatica). Food Chem. Toxicol. 2007, 45, 1805–1813. [Google Scholar] [CrossRef] [Green Version]
  21. Pasailiuk, M.V. Total flavonoid content, lipid peroxidation and total antioxidant activity of Hericium coralloides, Fomes fomentarius and Schizophyllum commune cultivated by the method of direct confrontation. Ital. J. Mycol. 2020, 49, 25–37. [Google Scholar] [CrossRef]
  22. Imran, M.M.; Mahroop, R.M.; Abdul, B.J.; Asarudeen, A. Determination of total phenol, flavonoid and antioxidant activity of edible mushrooms Pleurotus florida and Pleurotus eous. Int. Food Res. J. 2011, 18, 579–582. [Google Scholar]
  23. Ma, X.K.; Ma, H.; Chen, Q.; Ma, Y.; Daugulis, A.J.; Liang, J.; Zheng, P. The influence of monochromatic lights on flavonoid production by the fungus Sanghuangporus vaninii: Modeling of kinetic profiles and expression levels of important genes in flavonoid synthesis. Biochem. Eng. J. 2021, 166, 107876. [Google Scholar] [CrossRef]
  24. Mohanta, T.K. Fungi contain genes associated with flavonoid biosynthesis pathway. J. Funct. Foods 2020, 68, 103910. [Google Scholar] [CrossRef]
  25. Jiang, T.; Luo, Z.; Ying, T. Fumigation with essential oils improves sensory quality and enhanced antioxidant ability of shiitake mushroom (Lentinus edodes). Food Chem. 2015, 172, 692–698. [Google Scholar] [CrossRef]
  26. Butkhup, L.; Samappito, W.; Jorjong, S. Evaluation of bioactivities and phenolic contents of wild edible mushrooms from northeastern Thailand. Food Sci. Biotechnol. 2018, 27, 193–202. [Google Scholar] [CrossRef]
  27. Tel, G.; Apaydın, M.; Duru, M.E.; Öztürk, M. Antioxidant and Cholinesterase Inhibition Activities of Three Tricholoma Species with Total Phenolic and Flavonoid Contents: The Edible Mushrooms from Anatolia. Food Anal. Methods 2012, 5, 495–504. [Google Scholar] [CrossRef]
  28. Yıldız, S.; Yılmaz, A.; Can, Z.; Kılıç, C.; Yıldız, Ü.C. Total phenolic, flavonoid, tannin contents and antioxidant properties of Pleurotus ostreatus and Pleurotus citrinopileatus cultivated on various sawdust. GIDA 2017, 42, 315–323. [Google Scholar] [CrossRef]
  29. Hyun, M.W.; Yun, Y.H.; Kim, J.Y.; Kim, S.H. Fungal and Plant Phenylalanine Ammonia-lyase. Mycobiology 2011, 39, 257–265. [Google Scholar] [CrossRef] [Green Version]
  30. Shao, Y.; Guo, H.; Zhang, J.; Liu, H.; Wang, K.; Zuo, S.; Xu, P.; Xia, Z.; Zhou, Q.; Zhang, H.; et al. The genome of the medicinal macrofungus Sanghuang provides insights into the synthesis of diverse secondary metabolites. Front. Microbiol. 2020, 10, 3035. [Google Scholar] [CrossRef] [Green Version]
  31. Kouassi, K.A.; Kouadio, E.J.P.; Konan, K.H.; Dué, A.E.; Kouamé, L.P. Phenolic compounds, organic acid and antioxidant activity of Lactarius subsericatus, Cantharellus platyphyllus and Amanita rubescens, three edible ectomycorrhizal mushrooms from center of Côte d’Ivoire. Eurasian J. Anal. Chem. 2016, 11, 127–139. [Google Scholar] [CrossRef]
  32. Liaquat, A.; Saima, K.; Mamona, N.; Naheed, R.; Saima, N.; Gokhan, Z.; Mahreen, M.; Shehla, P.; Natasha, S.; Muhammad, S.; et al. Chemical profiling, in vitro biological activities and Pearson correlation between phenolic contents and antioxidant activities of Caragana brachyantha Rech.f. S. Afr. J. Bot. 2021, 140, 189–193. [Google Scholar] [CrossRef]
  33. Si, F.L.; Duan, S.; Wang, X.; Wang, L.L. Phenolic Antioxidants of Auricularia Species and Their Inhibitory Effects on α-Amylase, α-Glucosidase and Acetylcholine Esterase Activities. Curr. Top. Nutraceutical Res. 2020, 18, 132–140. [Google Scholar] [CrossRef]
  34. Hermann, A.; Hyacinthe, A.; Koffi, G.; Appolinaire, K.; Jean, K. Phenolic compound and antioxidant activity of two slightly consumed wild mushrooms (Lentinus squarrosulus and Auricularia politrich) in three regions from center Ivory Coast. Turk. J. Agric. Food Sci. Technol. 2021, 9, 1931–1937. [Google Scholar] [CrossRef]
  35. Ma, X.K.; Li, L.; Peterson, E.C.; Ruan, T.; Duan, X. The influence of naphthaleneacetic acid (NAA) and coumarin on flavonoid production by fungus Phellinus sp.: Modeling of production kinetic profiles. Appl. Microbiol. Biotechnol. 2015, 99, 9417–9426. [Google Scholar] [CrossRef]
  36. Dong, J.; Zhang, M.; Lu, L.; Sun, L.; Xu, M. Nitric oxide fumigation stimulates flavonoid and phenolic accumulation and enhances antioxidant activity of mushroom. Food Chem. 2012, 135, 1220–1225. [Google Scholar] [CrossRef]
  37. Meng, L.; Zhang, S.; Chen, B.; Bai, X.; Li, Y.; Yang, J.; Wang, W.; Li, C.; Li, Y.; Li, Z. The MADS-box transcription factor GlMADS1 regulates secondary metabolism in Ganoderma lucidum. Mycologia 2021, 113, 12–19. [Google Scholar] [CrossRef]
  38. Haug, K.; Cochrane, K.; Nainala, V.C.; Williams, M.; Chang, J.; Jayaseelan, K.V.; O’Donovan, C. MetaboLights: A resource evolving in response to the needs of its scientific community. Nucleic Acids Res. 2019, 48, D440–D444. [Google Scholar] [CrossRef] [Green Version]
  39. Meng, L.; Bai, X.; Zhang, S.; Zhang, M.; Zhou, S.; Mukhtar, I.; Wang, L.; Li, Z.; Wang, W. Enhanced ganoderic acids accumulation and transcriptional responses of biosynthetic genes in Ganoderma lucidum fruiting bodies by elicitation supplementation. Int. J. Mol. Sci. 2019, 20, 2830. [Google Scholar] [CrossRef] [Green Version]
  40. Jia, D.H.; Wang, B.; Li, X.L.; Tan, W.; Gan, B.C.; Peng, W.H. Validation of reference genes for quantitative gene expression analysis in Auricularia cornea. J. Microbiol. Methods 2019, 163, 105658. [Google Scholar] [CrossRef]
  41. Livak, K.J.; Schmittgen, T.D. Analysis of relative gene expression data using real-time quantitative PCR and the 2−ΔΔCt method. Methods 2001, 25, 402–408. [Google Scholar] [CrossRef]
Figure 1. Qualitative metabolomics analysis of A. cornea. (A) the content of total flavonoid. Means within a column carrying the same letter are not significantly different. Different superscript lowercase letters (a, b, c, d, and e) indicate significant differences (p < 0.05). CYM, complete yeast medium as control group; CYM + 25 g/L, CYM + 50 g/L, CYM + 75 g/L and CYM + 100 g/L, respectively, indicate CYM-kps medium with C. korshinskii leachate concentrations of 25 g/L, 50 g/L, 75 g/L and 100 g/L. (B) OPLS-DA analysis between different samples. (C) a hierarchical heatmap clustering analysis of the samples. QC, quality control sample; the QC sample was generated from a mixture of equivalent quantities of the 12 samples in this study. CYM, the metabolites of mycelia growth in the complete yeast medium. CYM-kps, the metabolites of mycelia growth in the CYM medium with C. korshinskii leachate concentration of 75 g/L.
Molecules 27 02334 g001
Figure 2. Qualitative transcriptomic analysis of A. cornea. (A) Pearson correlation between samples. (B) the differential expressed genes counts. (C) GO classification analysis of different samples. CYM, complete yeast medium as control group; CYM-kps, CYM medium with C. korshinskii leachate concentration of 75 g/L.
Molecules 27 02334 g002
Figure 3. The flavonoid biosynthesis pathway in A. cornea.
Molecules 27 02334 g003
Figure 4. The expression pattern of metabolites identified in A. cornea.
Molecules 27 02334 g004
Figure 5. Transcript levels of the homologous genes encoding key enzymes involved in the flavonoid biosynthesis pathway in A. cornea. (A) transcriptome data (FPKM), (B) relative gene expression levels (qRT-PCR). Error bars indicate the standard deviations across three independent samples; FPKM, expected number of fragments per kilobase of transcript sequence per million base pairs sequenced; CYM, complete yeast medium as the control group; CYM-kps, CYM medium with leachate of Korshinsk peashrub (Caragana korshinskii) at a concentration of 75 g/L; qRT-PCR, quantitative real-time polymerase chain reaction; * indicates statistical significance (p < 0.05) compared to the control.
Molecules 27 02334 g005
Table 1. The primers for qRT-PCR analysis in this study.
GenesForward Primer Sequence (5′-3′)Reverse Primer Sequence (5′-3′)
UBQCGGATCTAACAGCGTGGACTCTTCCCTCCTGAGCGATTGGCACTTG
PAL-1CGCCAATCAGGTCGCTATTTGCTGCTTCGTCGGC
PAL-2GCAGGCTCCTTCCATCCAGGCACCTCCTCATCGTC
PAL-3AGTACGACGCACTGGGCCGCATCTGCTCTATCACG
PAL-4CGCAGATGGAGGACAAGCGAGACGAACGAAGC
PPO-1TCGTGGCTTCAGATTGGGCGACGCTTGCTTT
PPO-2AGACCGATCAACTCAGGTTCAGGACGGAGCGATACTT
PPO-3ACGCTTCTCAACACCCTCTTCGTCGCCAAACACC
CHI-1GAGTCTGCCTCCACCTACCTTGATCTCGGCCAGCA
CHI-2CAATGGCTTGGGCTCGTTCGTGCCGCTTCAGATGGT
Publisher’s Note: MDPI stays neutral with regard to jurisdictional claims in published maps and institutional affiliations.

