Article

New Insight on the Stratigraphic-Diffusive Gas Hydrate System since the Pleistocene in the Dongsha Area of the Northeastern South China Sea

1
Key Laboratory of Gas Hydrate, Guangzhou Institute of Energy Conversion, Chinese Academy of Sciences, Guangzhou 510640, China
2
Guangdong Provincial Key Laboratory of New and Renewable Energy Research and Development, Guangzhou Institute of Energy Conversion, Chinese Academy of Sciences, Guangzhou 510640, China
3
University of Chinese Academy of Sciences, Beijing 100049, China
4
Key Laboratory of Heat Transfer Enhancement and Energy Conservation of Education Ministry, School of Chemistry and Chemical Engineering, South China University of Technology, Guangzhou 510640, China
5
MNR Key Laboratory of Marine Mineral Resources, Guangzhou Marine Geological Survey, Ministry of Natural Resources, Guangzhou 510760, China
*
Authors to whom correspondence should be addressed.
J. Mar. Sci. Eng. 2022, 10(3), 434; https://doi.org/10.3390/jmse10030434
Submission received: 15 February 2022 / Revised: 10 March 2022 / Accepted: 11 March 2022 / Published: 16 March 2022

Abstract

:
The stratigraphic-diffusive type of gas hydrate system is formed by microbial methane produced in a shallow slope space when flowing laterally into hydrate stable zones and is worth studying for both energy supply and academic understanding. A deposition production model matching the vertical and lateral seabed morphological characteristics was constructed to show the accumulation process, layer timing sequence, and reservoir quality of the stratigraphic-diffusive hydrate system in the Dongsha slope sediments since the Pleistocene. Six representative key system factors at three selected moments (1.5 Ma, 700 ka B.P., and at present) have been exhibited during debris is continuously accumulating. The coexistence of the hydrate decomposition in the lower part and the formation in the upper part, and the uneven distribution of hydrates within the slope sediment surface are explained clearly. By comparing four geological cases with diverse environments, it is shown that the diffusive hydrate system is likely to develop into moderate geological conditions. The most powerful carbon fixation ability in this system was quantified within the time range of 100−50 ka B.P. Finally, it was verified that residual methane would converge near the seafloor interface and then eventually overflow out of the seabed into the seawater.

1. Introduction

The successful second round of production tests on gas hydrates (GHs) in the Shenhu deep-water slope area of the northern South China Sea (SCS) in March 2020 is a hot topic in the field of natural GH research [1,2]. It has, once again, made natural GH, a new source of energy on Earth, the focus of social development, and also brought it into the awareness of ordinary people. GHs are widely present in active and passive continental marginal seafloors worldwide [3,4,5]. First of all, they can be used as an auxiliary energy supply. It is optimistically predicted that as much as 104 TCF of methane is trapped in resource-grade marine deposits [6]. From the perspective of energy resource development, Pang et al. (2021) estimated that the amount of technically recoverable industrial GH resources that could be made available by 2050 is up to 41.46 × 10¹² m3 [7]. Secondly, there is a coupling and interactive mutual feedback process between the huge amount of natural GHs and global climate change [8,9,10,11]. Finally, the evolution of GH sediments also affects regional ecosystems and geological environments [12,13,14,15]. It can be seen that GHs are an important unknown element and a new research field, both for the oil and gas industry for human society and in terms of scientific discovery.
Passive continental margin slope areas have more stable crustal movement geological environments, thicker fine-grained sedimentary debris, and widely developed full-sized strata fluid pathways, such as faults, fracture zones, and intercommunicating pores [16,17]. Whether organic carbon produces thermogenic or microbial gas, gas-bearing fluids migrate vertically and laterally into shallow sedimentary beds of the continental slope surface, driven by pressure, temperature, and salinity gradients, forming hydrate-bearing layers with different occurrences and contents in the gas hydrate stability zone (HSZ) [18,19,20,21]. Based on the geological background of the Shenhu region and graphical characteristics of GH logging-while-drilling borehole images, Yang et al. (2017) summarized and proposed structural-seepage type GHs, which are firmly associated with thermogenic methane that has migrated vertically from deep strata through faults, and stratigraphic-diffusive type GHs formed by shallow microbial methane, which are often low-content and mostly appear thin-bedded and disseminated [22].
Compared to those structural-seepage GH reservoirs, these stratigraphic-diffusive GHs are more affected by depositional activities, lithological conditions, and the local microbial gas source supply in shallow layers in the deep-water continental slope area (Figure 1). Since the Pliocene, the continental slope area of the northeastern SCS has gradually become a deep-sea semi-topographic landform with a high deposition rate [23,24]. A large amount of organic debris accumulated on the seabed within this period. They were quickly buried in the slope surface, where they were well preserved because they were not subjected to a complex oxidation process. They were ultimately transformed into abundant microbial gases by long-term bacteria activity and stored in the soft fine or coarse argillaceous and silty seafloor muds [25,26,27]. The higher the organic carbon content, the more conducive it is to efficiently produce in situ microbial gas. Meanwhile, a high deposition rate is likely to cause coarse grain and skeleton cementation circumstances under pressure. This creates relatively large spaces in local shallow sediments for gas storage. In addition, the shallow sediment is easily connected with lower faults and other structures to form favorable fluid transport systems. Sedimentary environments, such as turbidite fans, slope fans, canyon mudslides, and gravity flows in the slope canyon, lead to the characteristics of thick sedimentary layers, coarser lithology, and good reservoir properties. All this contributes to the emergence and accumulation of stratigraphic-diffusive type GHs.
The Dongsha area and adjacent Shenhu area both belong to the northern plate structure of the SCS, and thus, their geological background is nearly the same. The seabed of this area is widely developed and has complex topography, including steep slopes, canyons, and troughs. It is estimated that the submarine plateau area on both sides of the slope troughs is very favorable for GH accumulation [28,29,30]. Analysis of the data detected by geophysical methods showed that a large number of faults formed in the extensional environment of the Late Cretaceous–Paleogene penetrate downward into the bedrocks, and the territorial new tectonic movement has been active since the Pliocene. As a result, faults with different strikes cut through newer deep-water undercurrents and turbidity currents to form an S-shaped precursor geological structure that extends to the shallow seafloor. Although structural-seepage GH layers exist that generally operate under the influence of thermally generated cracked gas in the deep crust, this area largely breeds stratigraphic-diffusive GH reservoirs formed by microbial gas, which can be traced back to the Pliocene–Pleistocene and migrates along with fluid within the mud diapirs [31,32,33]. During the China Geological Survey in 2013–2014, Fugro and Geotek carried out the GMGS2 expedition in this sea region. A total of 13 sites were drilled using the M/V REM Etive ship, and eight of them showed abnormal signs of GH existence in the pilot logging curves. Furthermore, large amounts of layered, massive, laminated, nodular, nugget, and disseminated natural GH morphologies were obtained and observed in samples from five sites. Methane gas of microbial origin was verified in this expedition by the multi-means mutual authentication method, for example, the molecular composition of gas samples [34,35,36].
Understanding and pursuing the internal dynamic transformation mechanism and the evolution process of this stratigraphic-diffusive GH system—which widely occurs in the oceanic shallow slope surface—from the perspective of a large spatial scale and long-term geological timescale can help us better estimate its potential for future resource development, test and confirm eustatic sea level changes, and trace the distribution trajectory of its own authigenic carbonate rocks in geobiochemical circulation. It is of great significance in promoting the exploration of the energy industry and enhancing the understanding of the natural environment of GH geological systems. Based on the two important geological features of the deep fault structure and buried shallow sedimentation in the Dongsha area, we constructed a new deposition flow reaction multi-field coupling model. Unlike in our previous work, the aspect of microbial gas production was added to show the accumulation process, layer timing sequence, and reservoir quality of the stratigraphic-diffusive GH system in this region since the Pleistocene [37]. The simulation results ultimately revealed the vertical differentiation sequence and a horizontal spatial extension of the hydrate-enriched area, the non-visible area, and the free gas conversion under the actual geological, geothermal, and geostress field environment.

2. Regional Geological Setting and Slope Stratigraphic Model

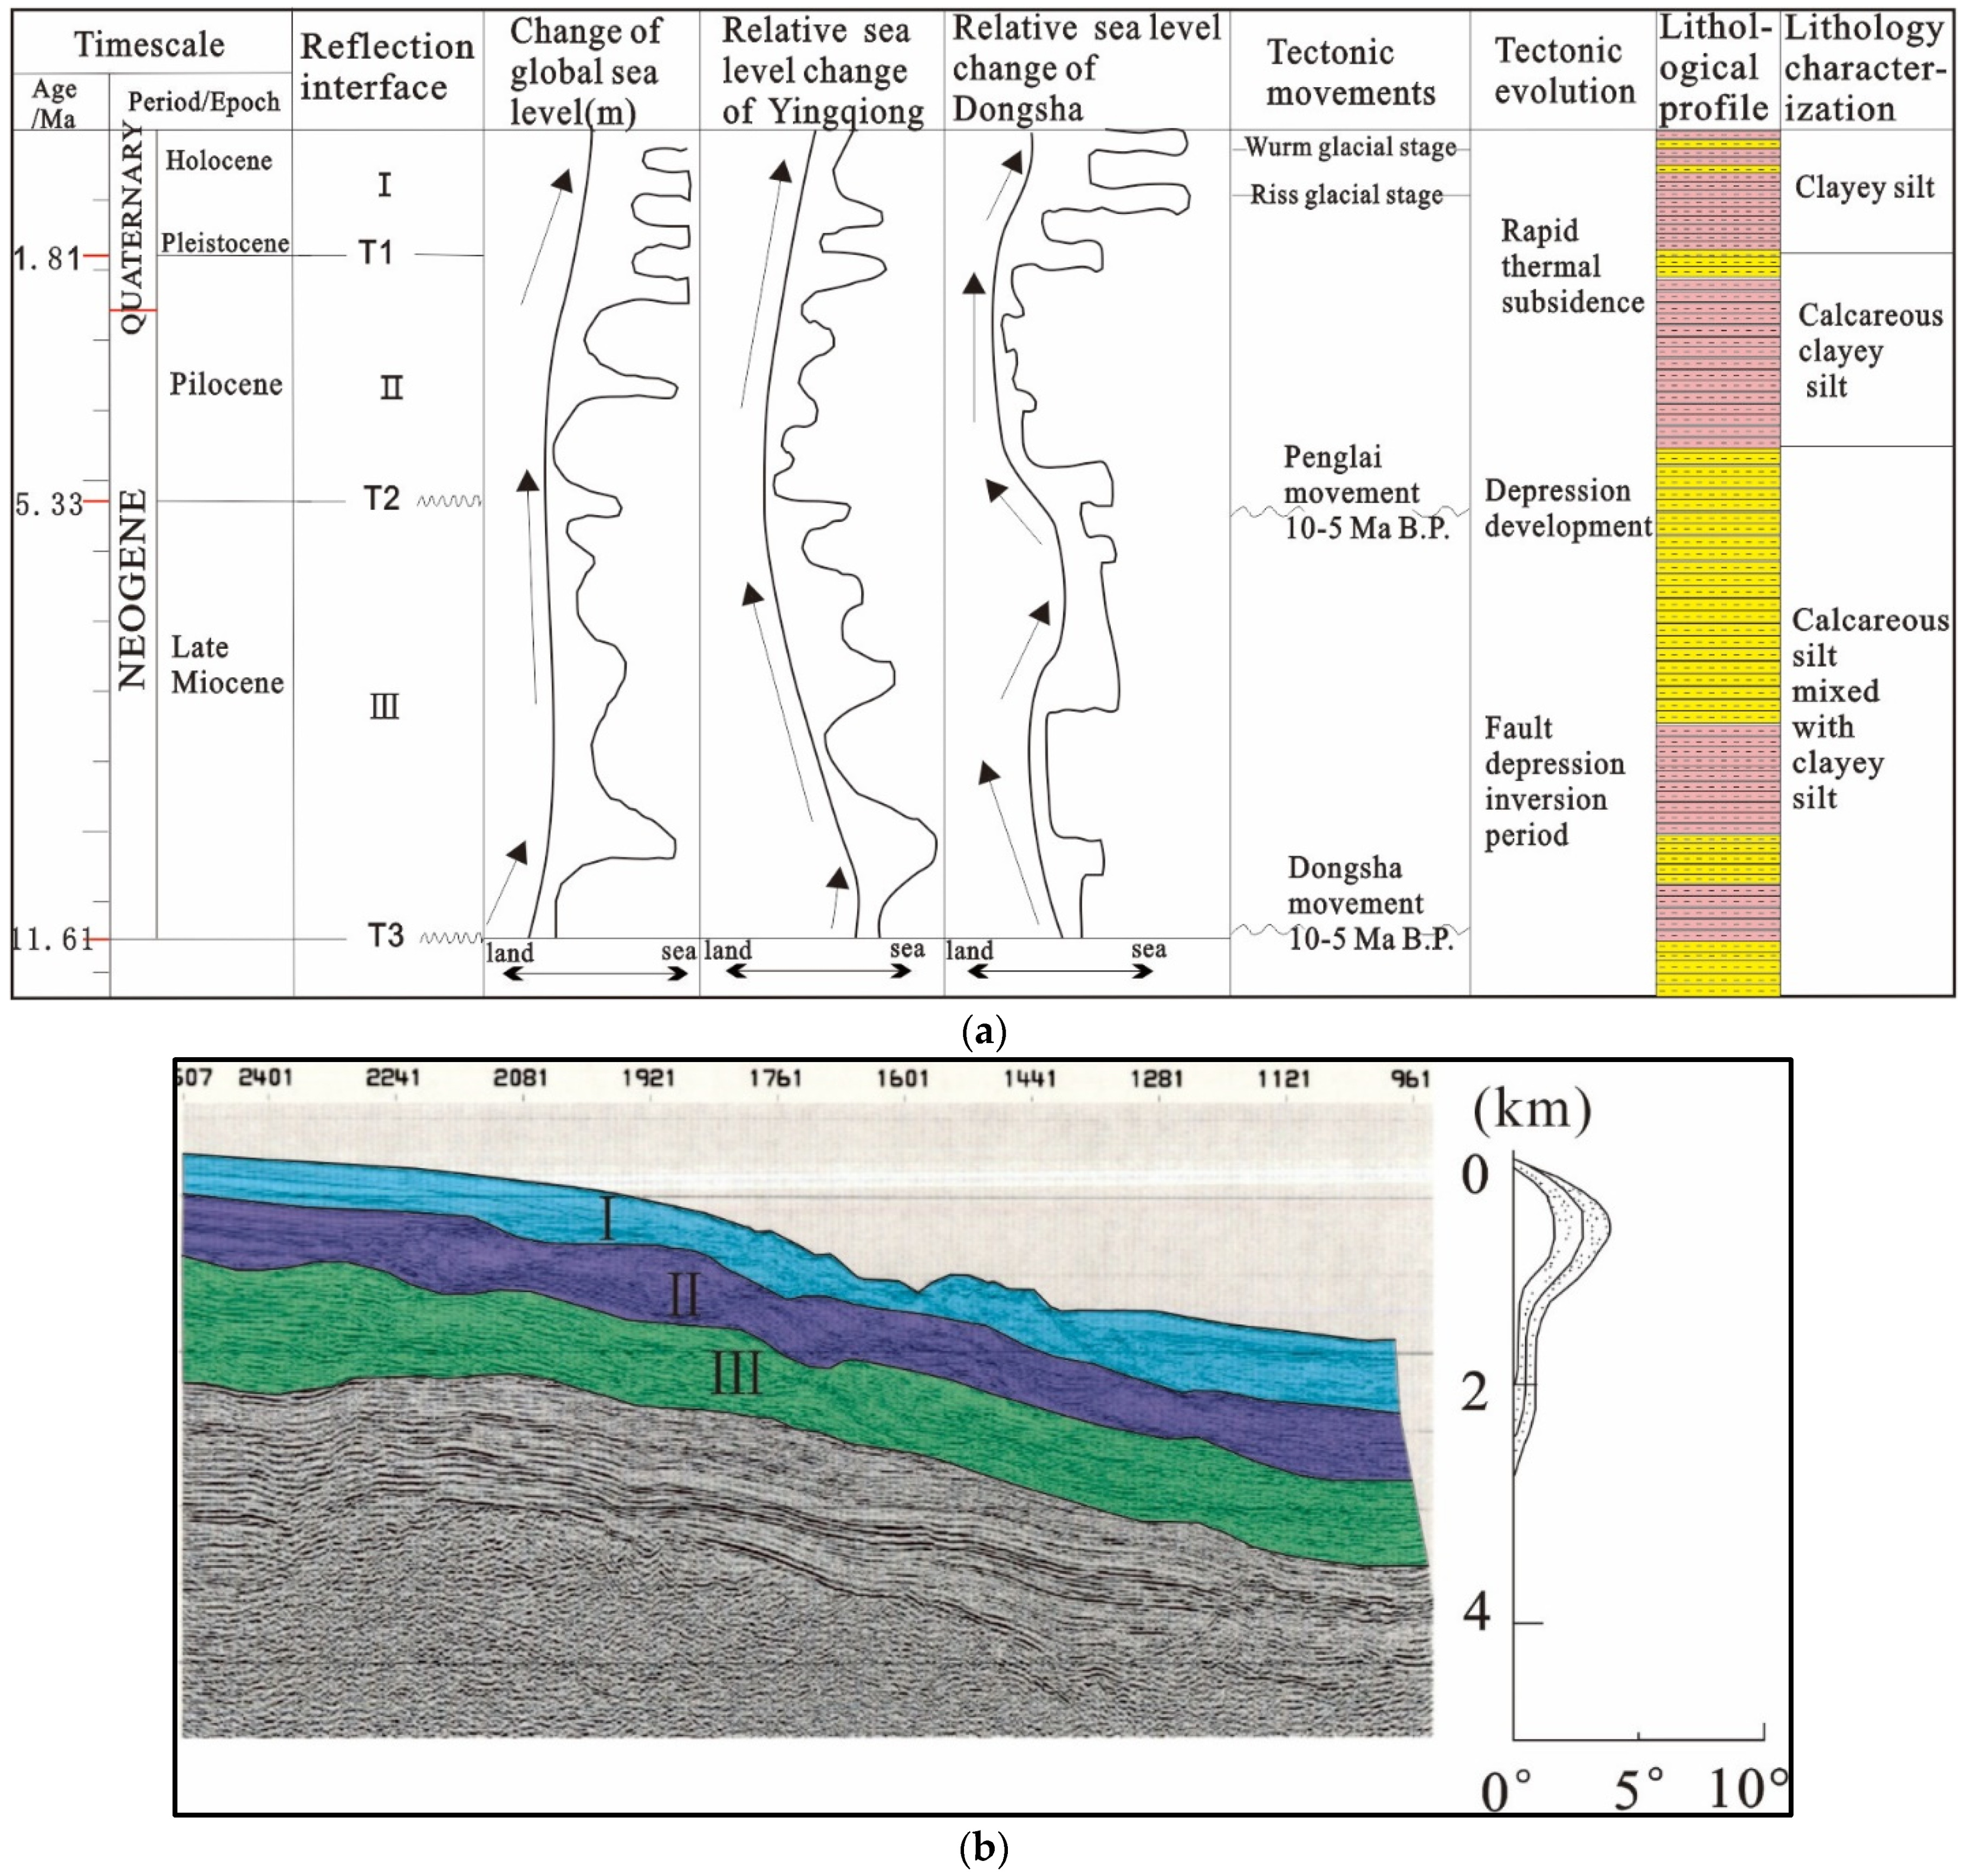
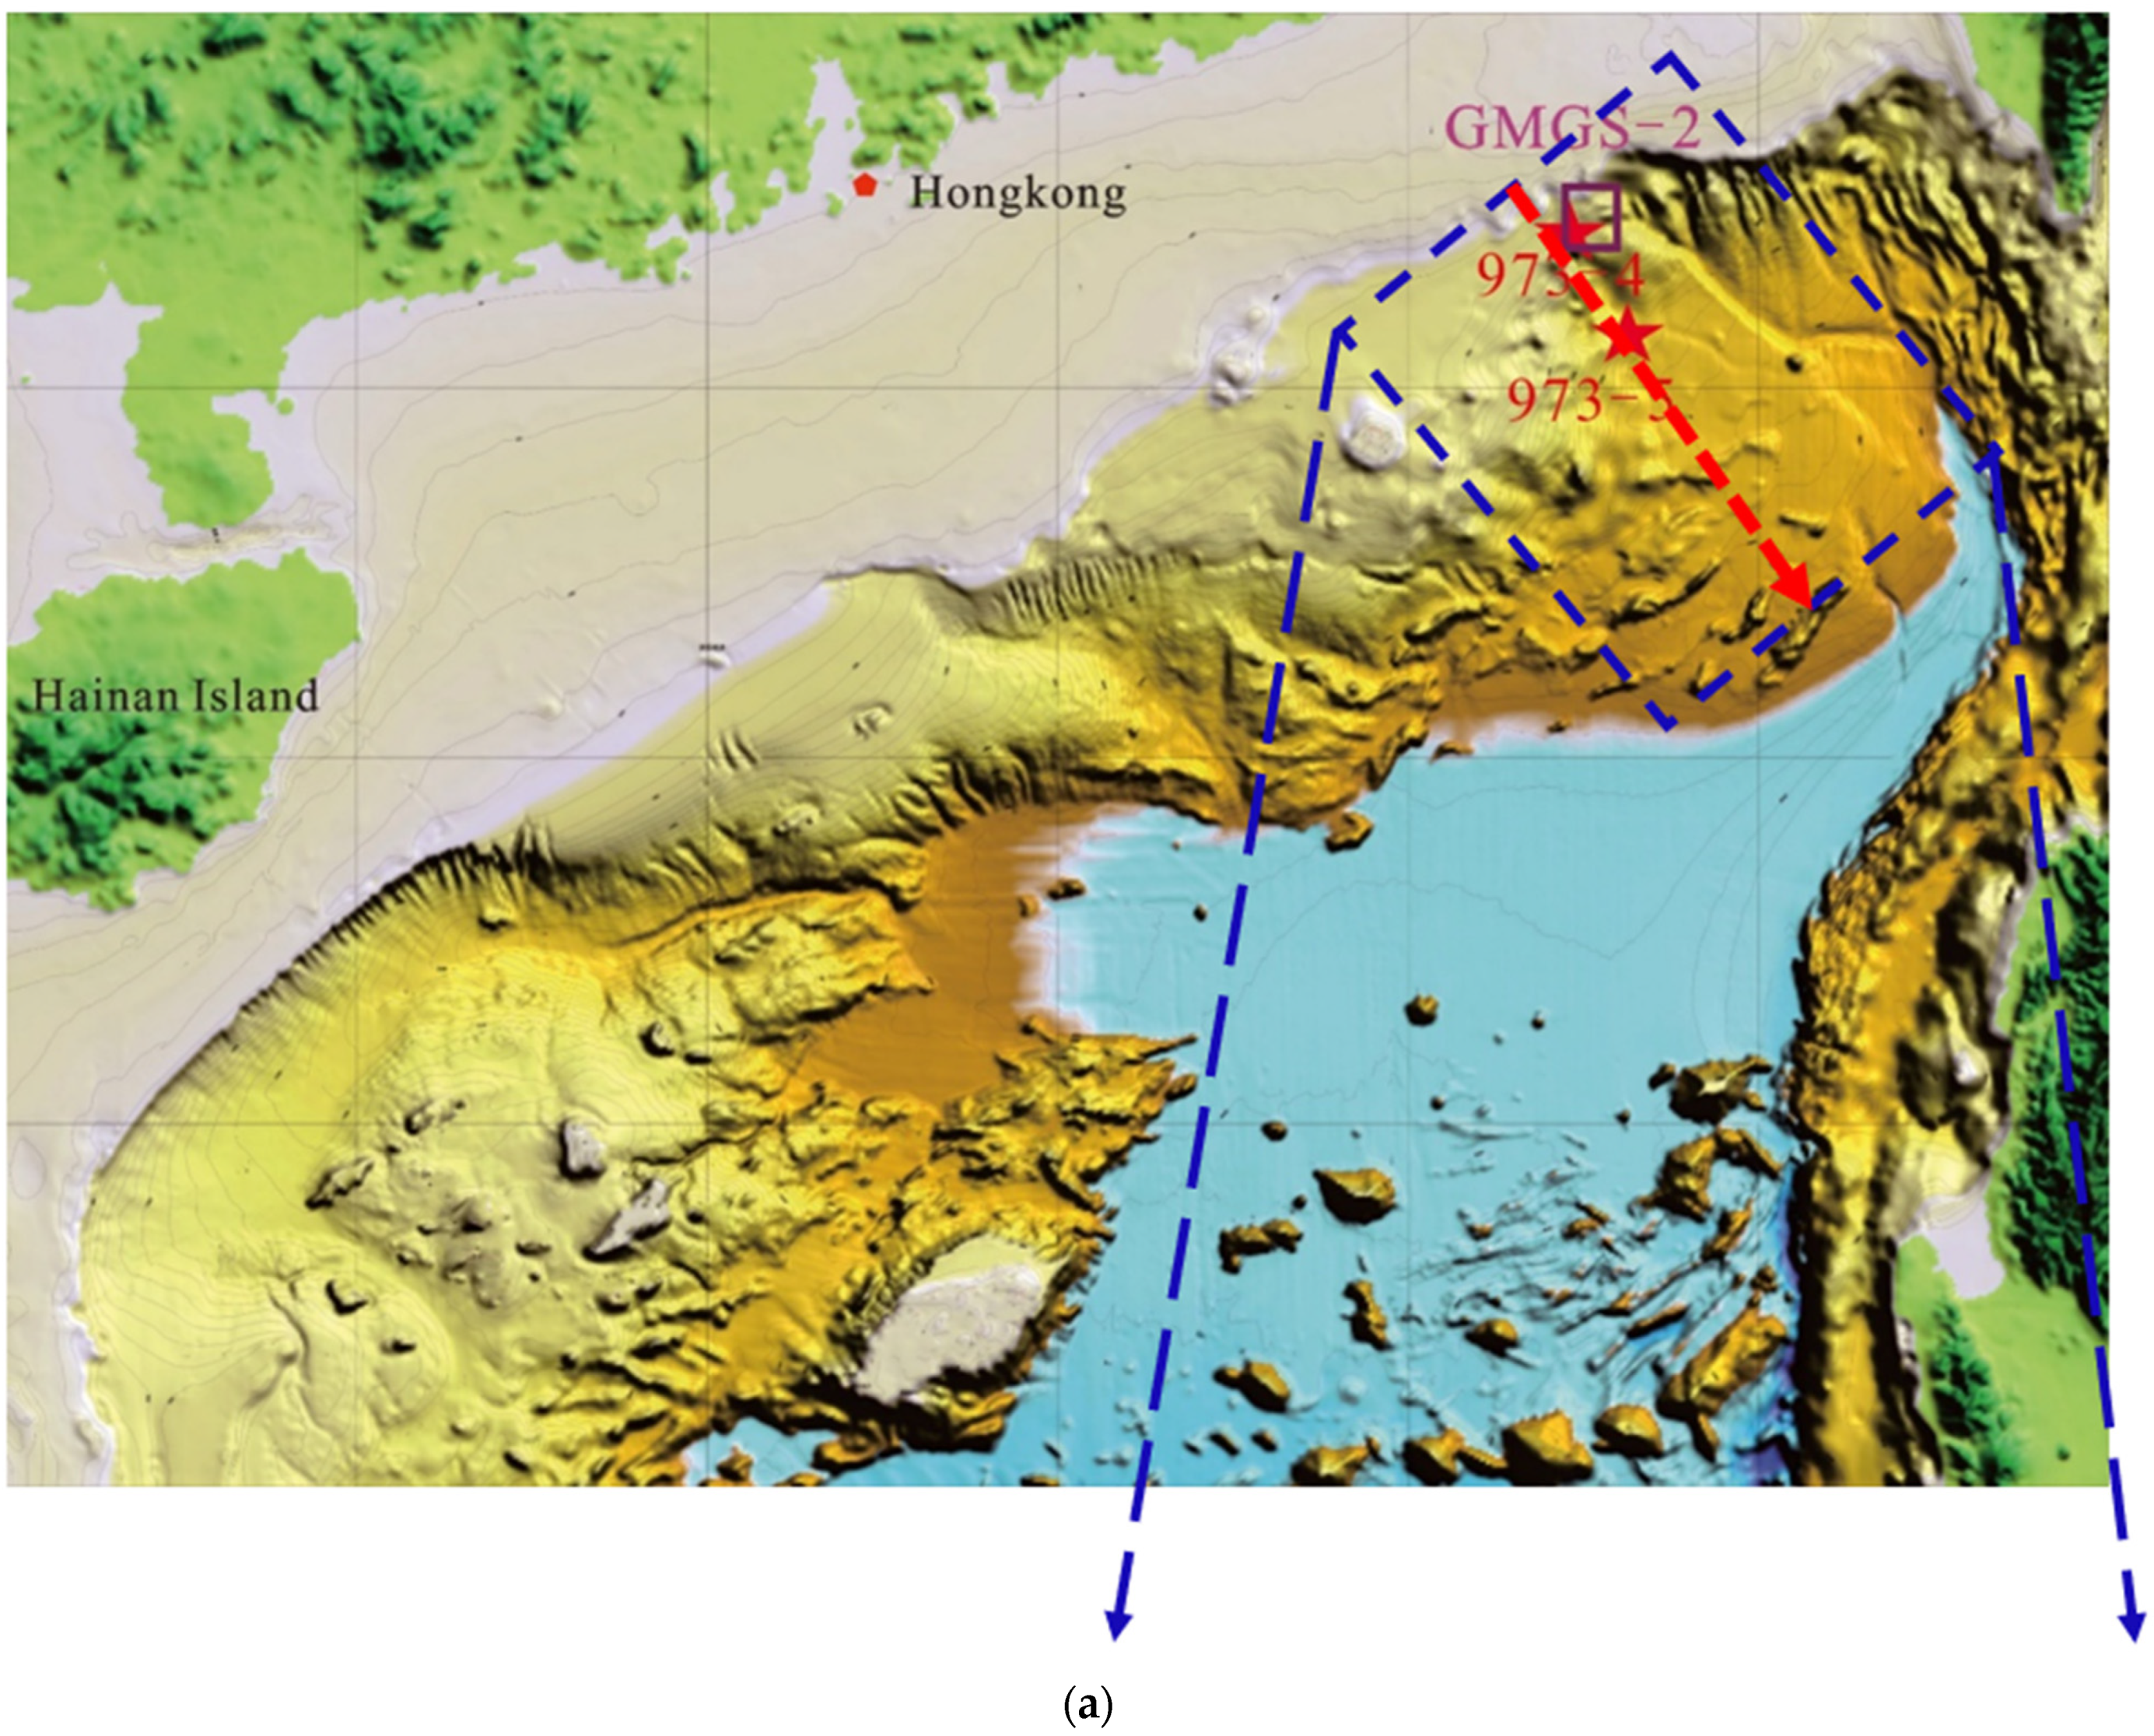
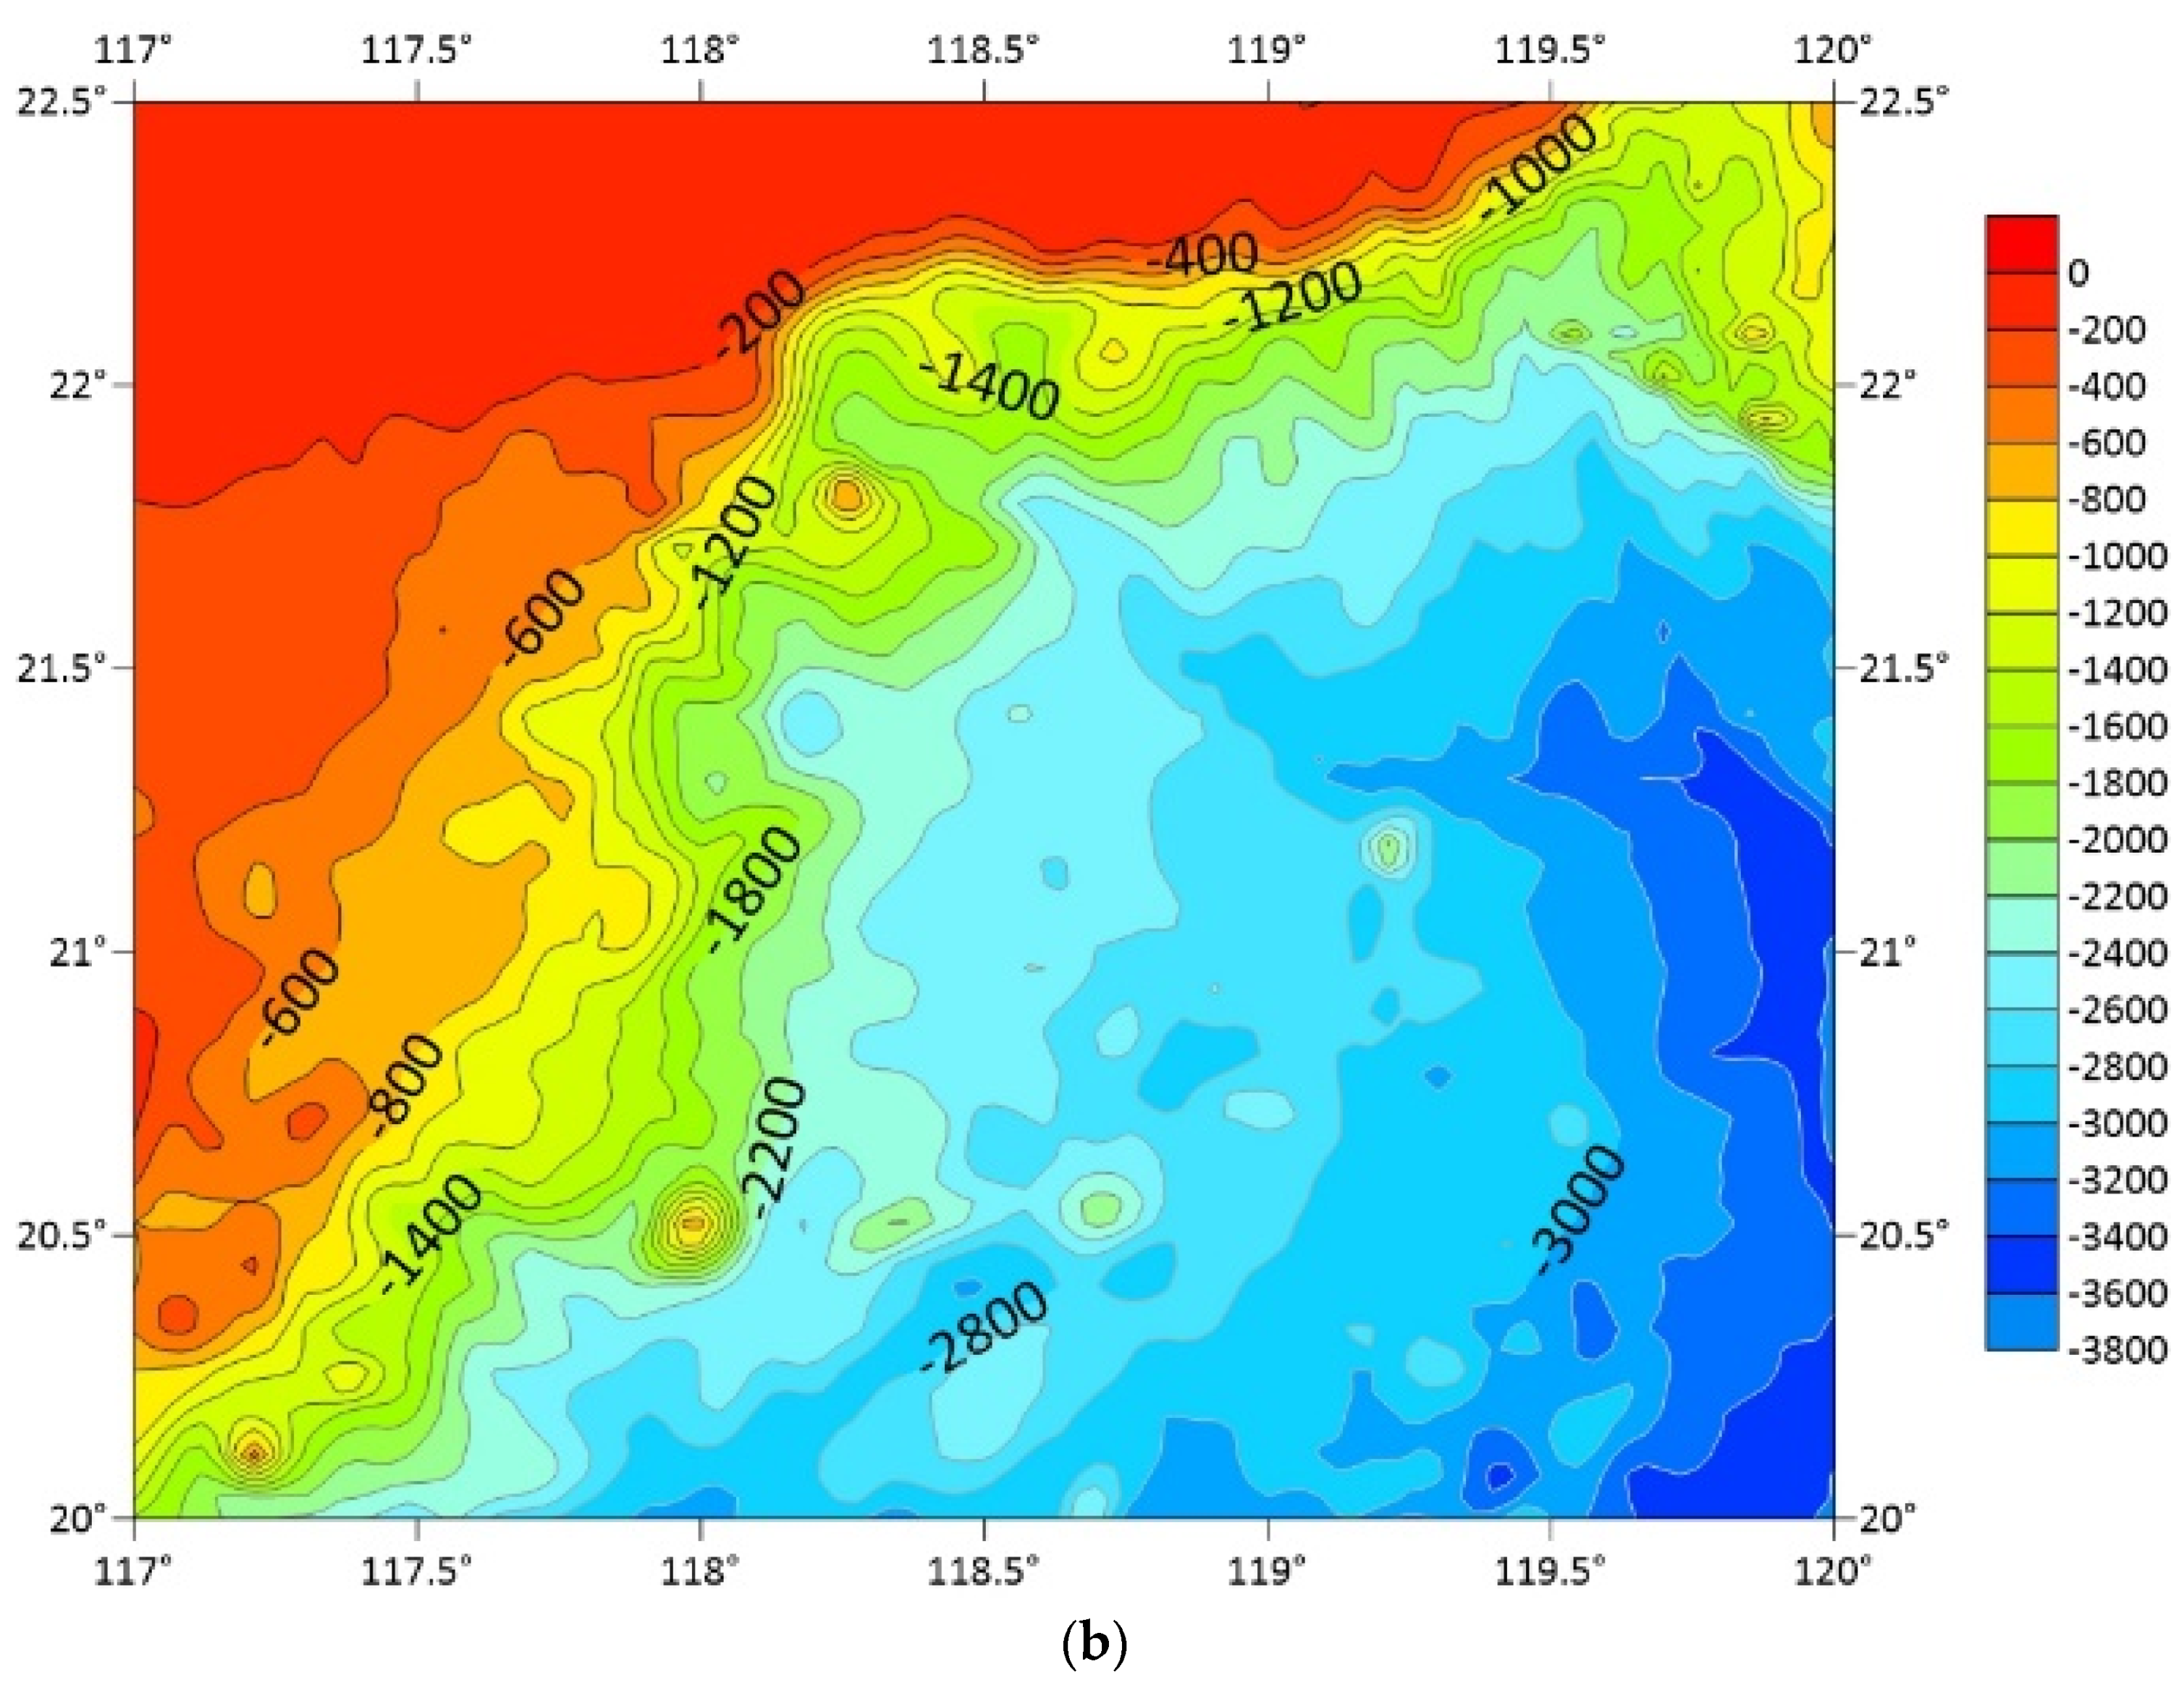
2.1. Geologic Background

The Dongsha area in the northeastern SCS is a deep-water passive continental margin located in the lower part of the Taixinan basin. It is close to the eastern part of the Dongsha Islands and its west side is connected to the Pearl River Mouth Basin. The water depth in this area is 200−3600 m below sea level (mbsl), and it gets deeper in the southeast. The boundary line between its upper and lower slopes lies at around the 2100−2500 mbsl water-depth line. The upland slope area develops a north-northwest direction canyon/gully group, and the downland slope area is relatively wide and flat (Figure 2). The basin has undergone large-scale subsidence activities since the Middle Miocene–Pliocene, and thus, has very thick marine deposits. As a transport channel, the 110 km-long canyon developed in this area is very suitable for the transport of large amounts of sedimentary material. With the activity of the deep-water bottom current carrier, a high deposition rate brings plenty of accumulated debris to this area. Active turbidity currents and undercurrents give this study area a very high sedimentation rate in the SCS. The Taixinan basin has grown two different group faults in the NW-NWW and NNE, and NEE directions, respectively, and mud diapirs are widely distributed. It has been found to contain four (Mesozoic, Paleocene–Eocene, Pliocene–Miocene, and Pliocene) sets of gas source rocks, so the organic maturity is rather high. As mostly humic kerogen is produced here, the methane gas source conditions are fairly good. Regional geological, geophysical, and geochemical surveys have confirmed that GH reservoirs are mainly stored in the Upper Miocene–Holocene stratigraphic sequences [38,39,40,41,42].
The sedimentary circumstances in the Dongsha area are similar to other passive continental margins where hydrate-bearing cores have been drilled out and also preserved, such as the Indian continental margin and the Gulf of Mexico. The sedimentation rate since the Late Miocene has been much higher than that in the Shenhu drilling area and other areas in the SCS. The regional turbidity current system grows vigorously, and the grain size of the sedimentary layer is relatively coarse. The organic carbon content in the sediments is similar to that of the Shenhu area and the average value in both of these areas is 0.7%. The drilling results of GMGS2 showed that the drilled GH samples in the Dongsha deep-water zone are generally dispersed in clayey silt and calcareous silt containing calcareous organisms within 220 m below seafloor (mbsf) to the seafloor. The occurrence and states of the GHs are different. Some hydrate-bearing layers, mainly formed by microbial gas through diffusion conduction are usually low in content. They are invisible and hard to distinguish from the cores with the naked eye because there is no obvious difference between the core of the hydrate and the normal core. However, bubbles or air columns will be generated when they are put into water, and the corresponding sediments will become a porridge-like mixture if the hydrates are decomposed. Several samples that may generate from thermogenic-bearing gas appear to be massive, nodular, and thin-layered, and could have a rather high hydrate content (>45%) [43,44,45].

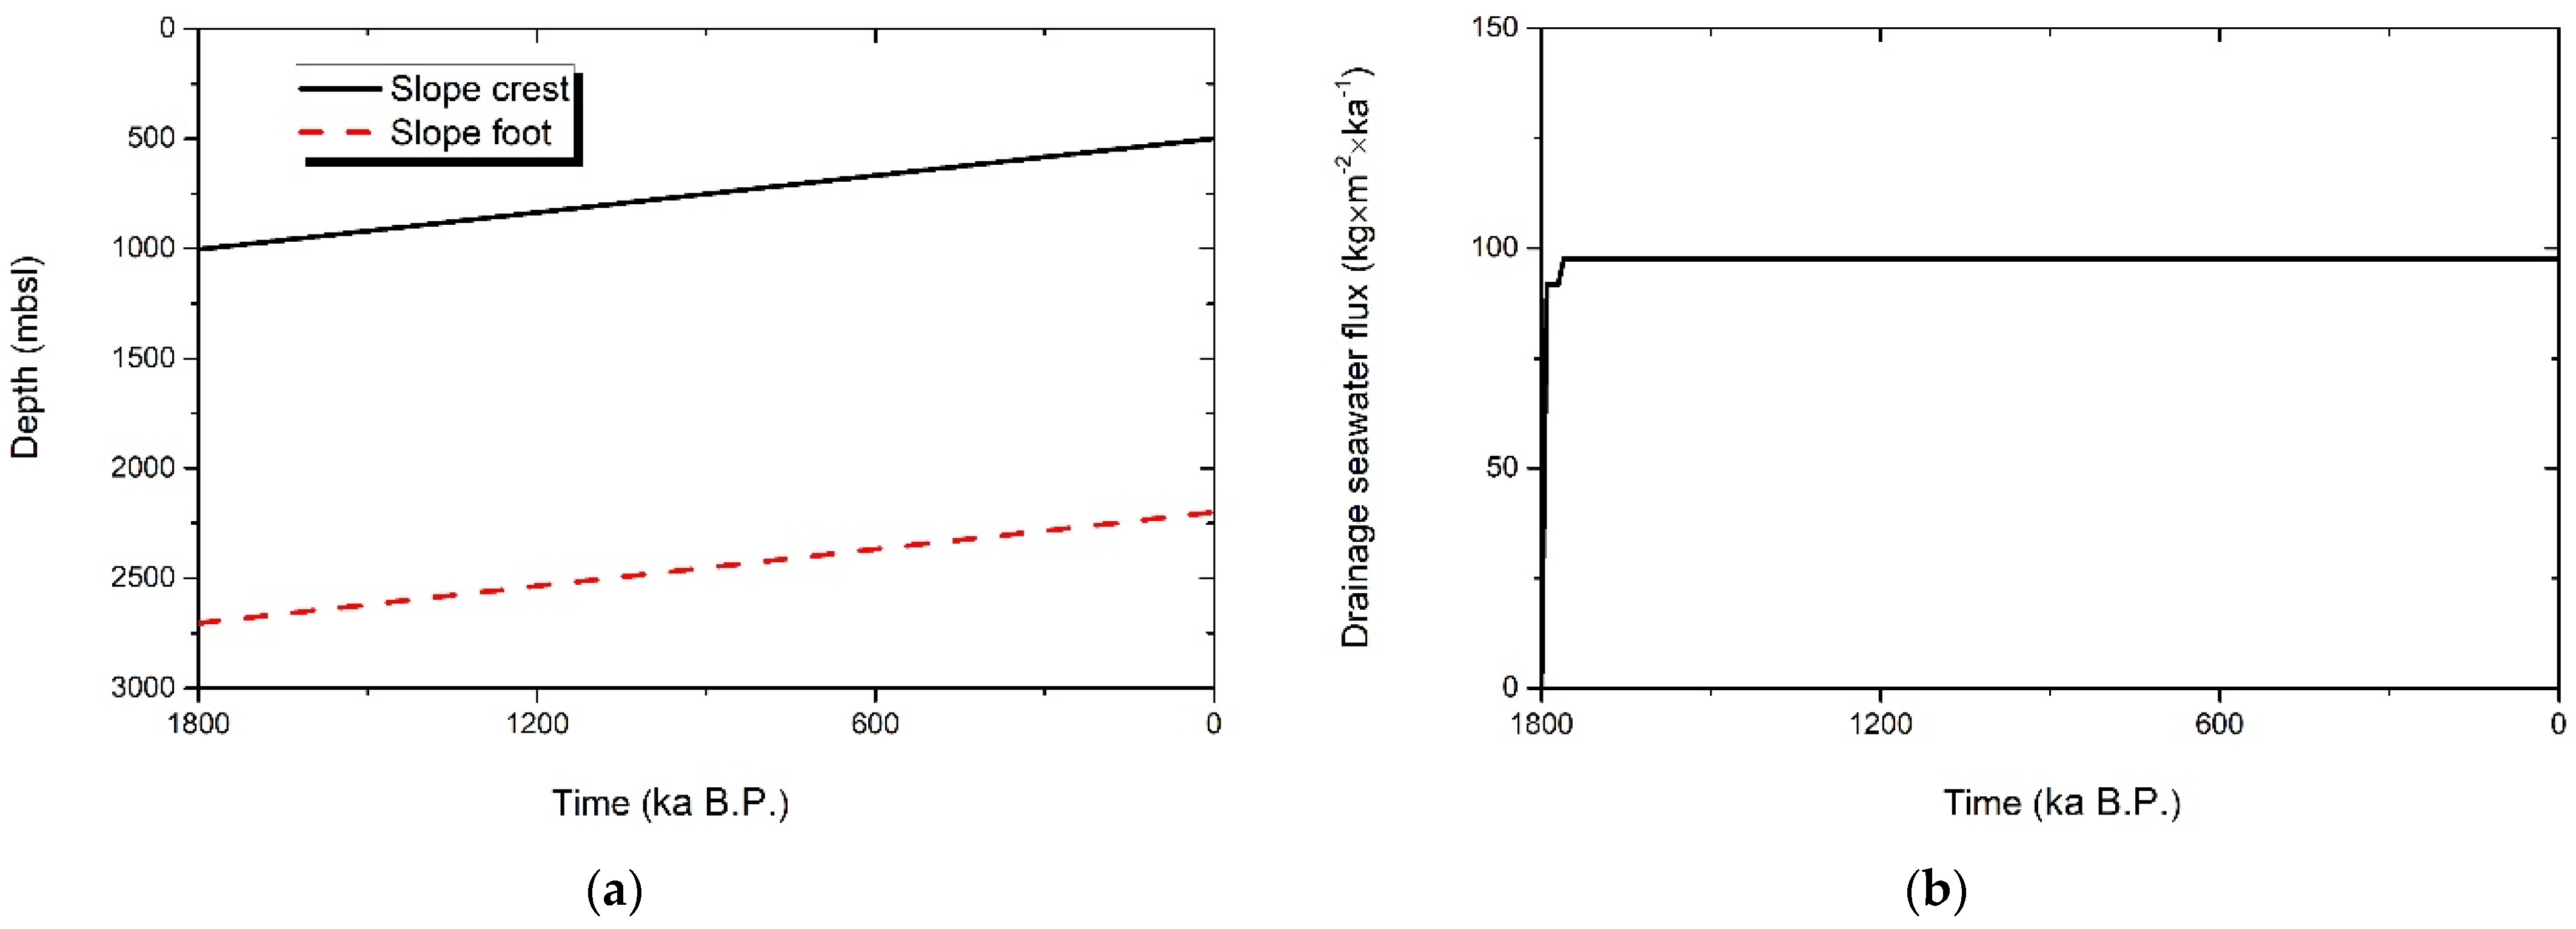
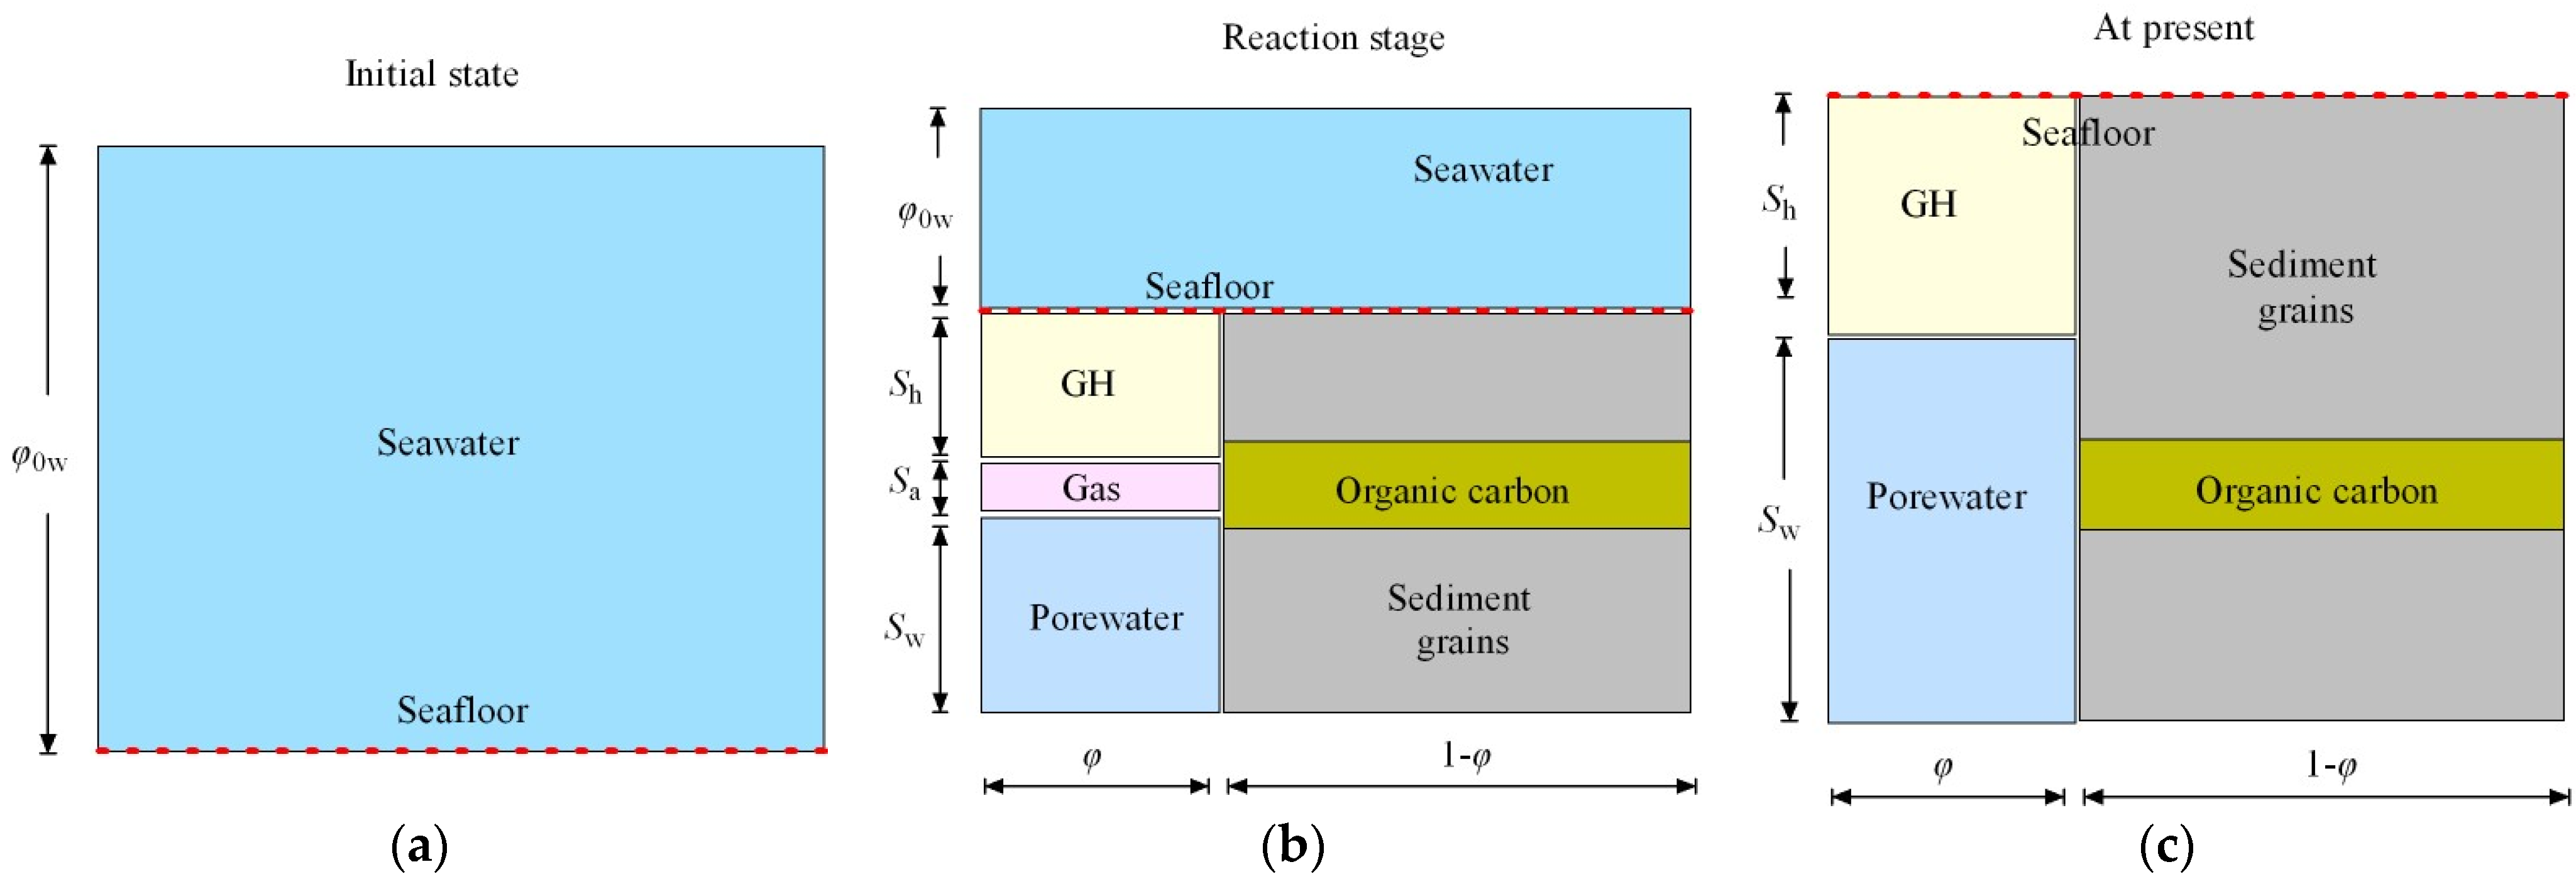
2.2. Simplified Deposition Model

Until now, analysis of the vast seismic reflection data of the Dongsha continental slope area has demonstrated that the main diffusive-type hydrate layer in this region is located above the lower boundary of the Late Miocene. In the GMGS2 scientific expedition, the maximum drilling depth was about 214 mbsf. Combining the obtained lithological test results together with the research findings of calcareous ultra-microfossils and foraminifer biostratigraphy in this area, it is inferred that the oldest strata at this depth are from the Middle Pleistocene at about 0.44 Ma. The oldest sequence is tens of meters below it, reaching about 0.78 Ma at the bottom of the Middle Pleistocene. The survey wells in GMGS2 were mainly located in a high-speed accumulation area of the upper continental slope with a water depth of 650–1150 msbl. In the southeastern part of Dongsha Island, a lower slope area with a water depth of over 2000 mbsl has developed the highest sedimentary rate accumulation debris known so far in the SCS [36,45,46]. BSR evidence through exploration in these areas has been found to indicate the existence of GHs, and it also hints that the evolution history of GHs here may be deeper and earlier. With these inferences, we established a corresponding hydrate-related geological historical evolution model (Figure 3). According to the maximum time since the Pleistocene (1.8 Ma), the regional sediment accumulation thickness is 504 m. In order to better fit the local seabed topography, a first steep section with a seafloor height difference of 900 m and a second gentle section with a seafloor height difference of 800 m were designed using a middle slope seafloor positioned at 1400 mbsl.

3. Gauging Geological Process

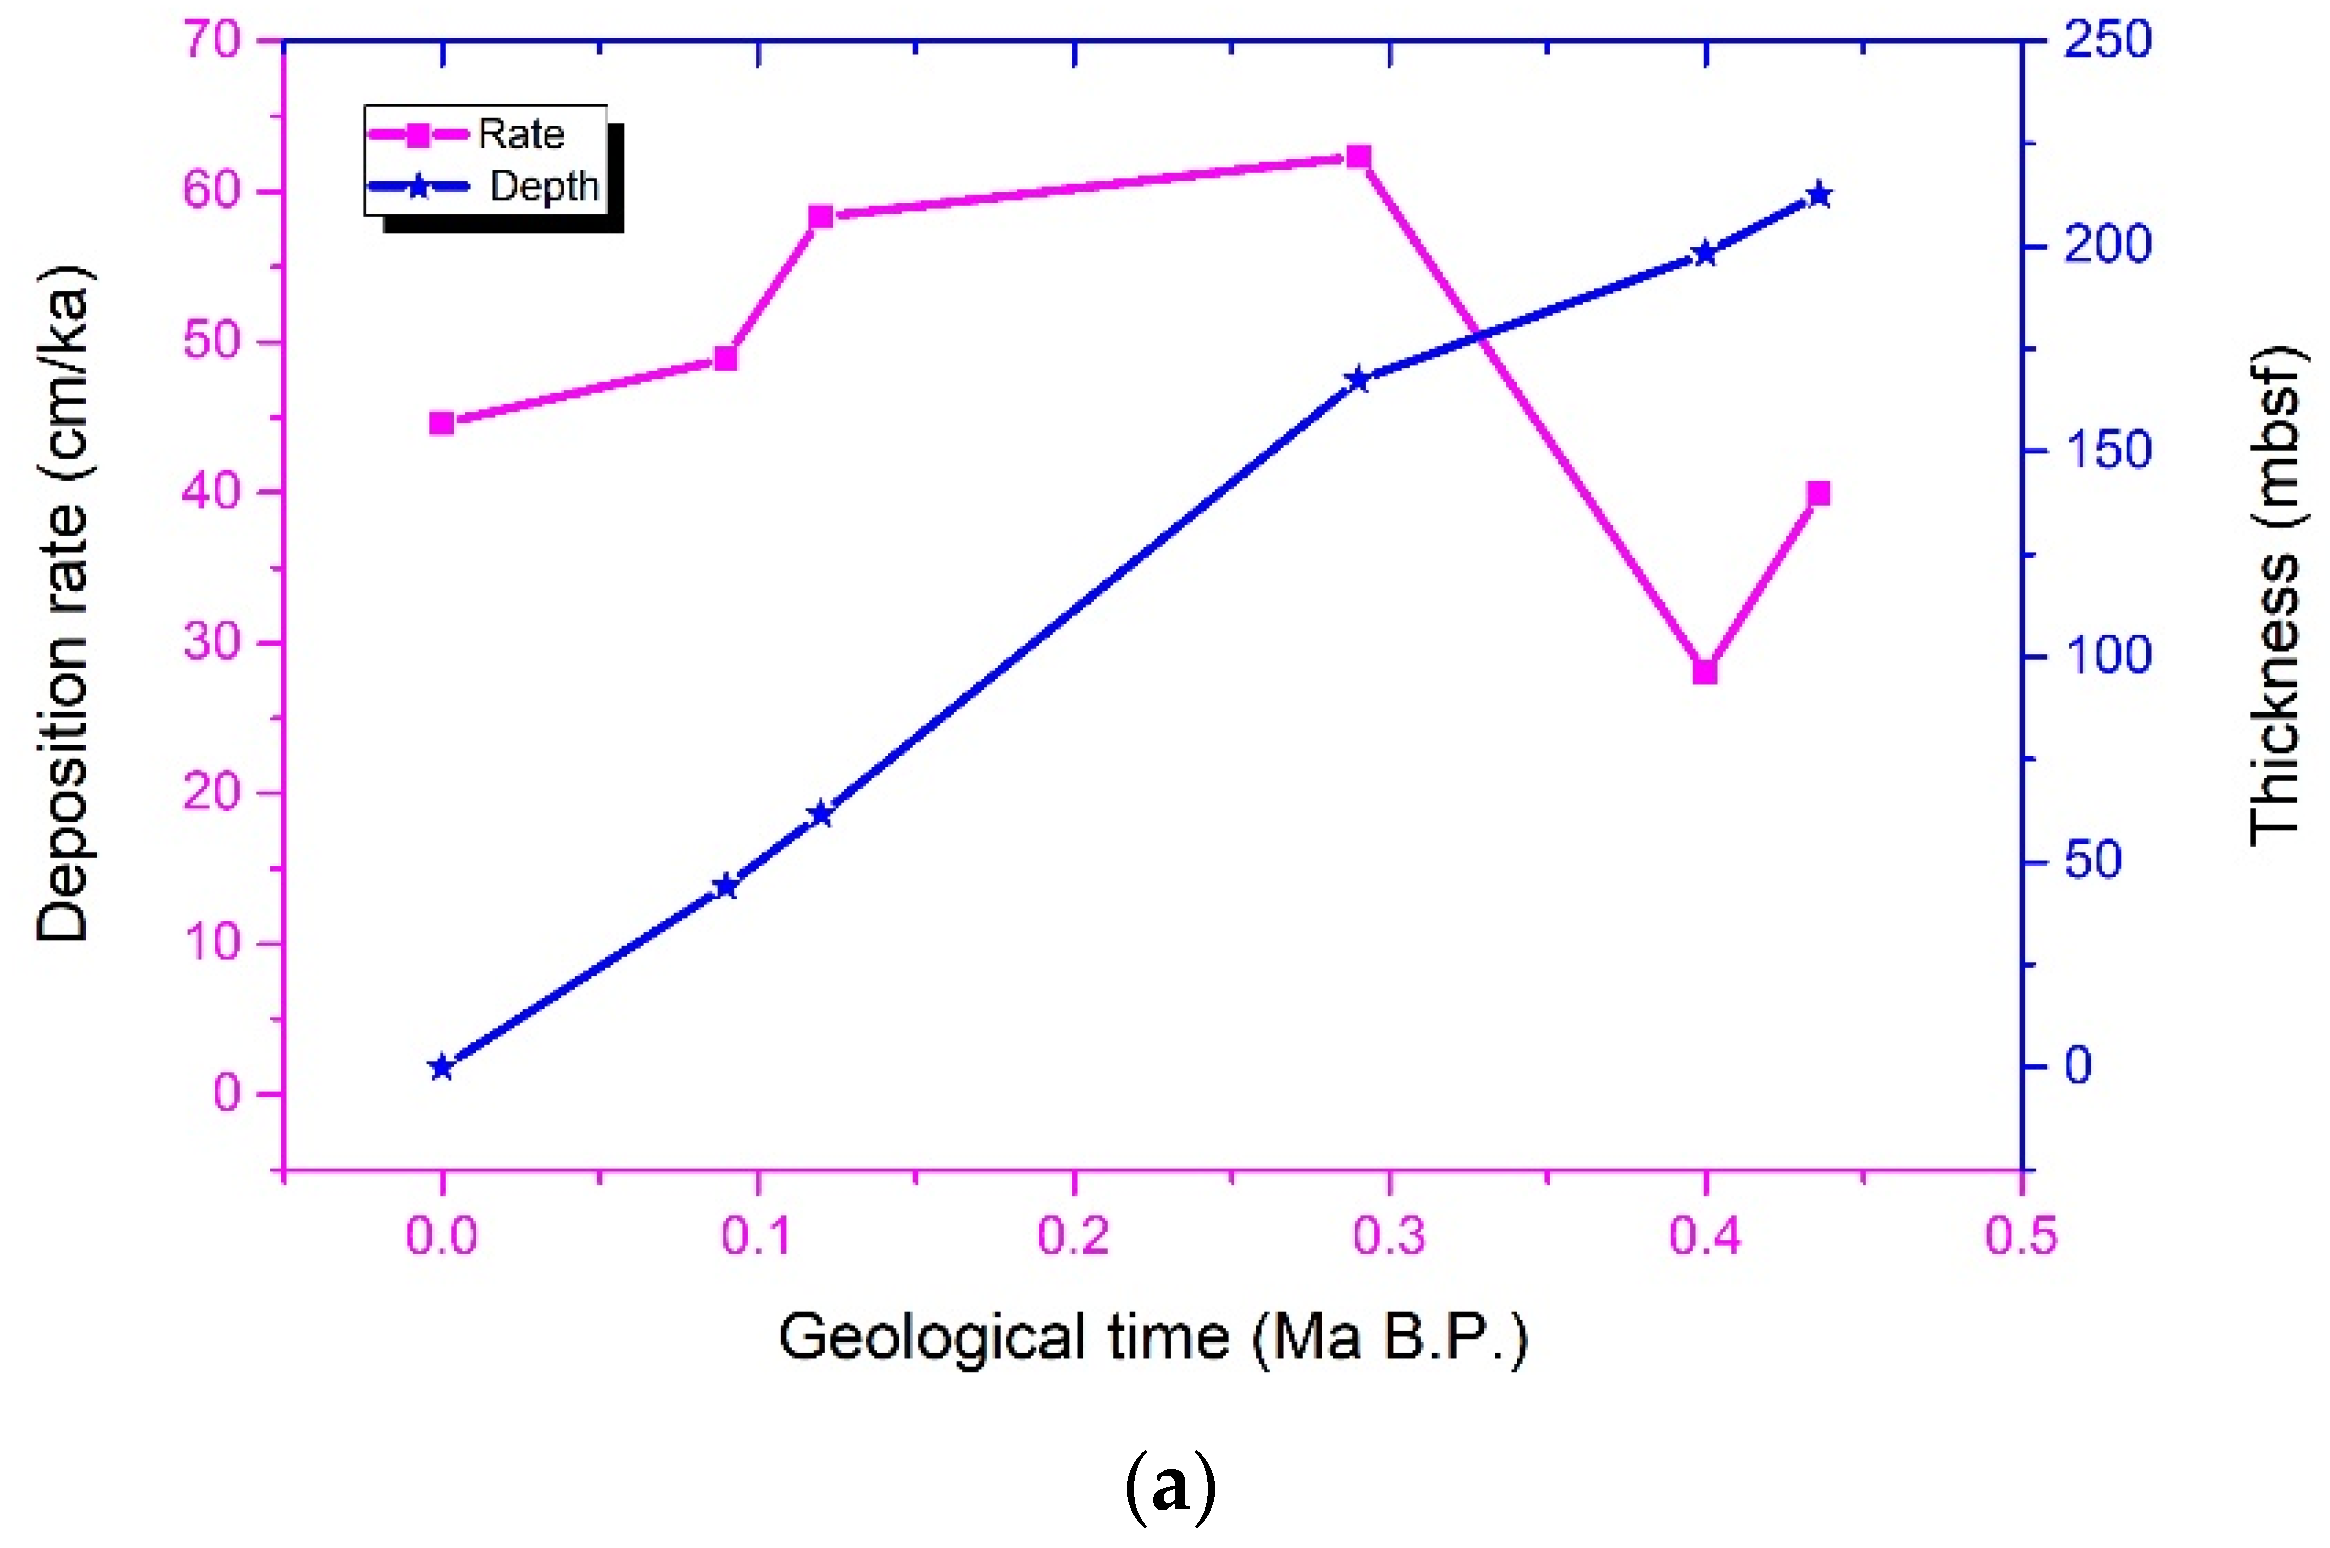
3.1. Total Deposition and Microbial Production

The deposition rate reflects the amount of sediment and the turbulence or calmness of the seabed environment. It is one of the main controlling factors affecting the occurrence of stratigraphic-diffusive GHs. The average deposition rate in the Dongsha area since 440 ka has reached 47.4 cm/ka. Since 0.12 Ma, this rate has been between 46.9 and 73.3 cm/ka, with the peak being 97 cm/ka (Figure 4a). The rapid deposition process causes terrigenous materials mixed with gravel-level authigenic carbonates, bivalves, and other biological derbies to be buried and stored along the slope surface seabed [47]. The bacterial oxidation process produces large amounts of methane gas within the local seabed. The maximum organic carbon concentration (TOC) in the 973 surveys reached 2.5%, and the organic carbon content in GMGS2 was between 0.5% and 1.49% [33]. Their average value was 0.81%, which provided an available source of microbial gas (Figure 4b). In addition, the formation of a geological environment with high sedimentary accumulation in a shallow surface layer of the continental slope is very conducive to the occurrence of stratigraphic-diffusive hydrates. In this simulation, we only considered pure methane in the gas composition, so we discuss methane hydrate (MH) in the following text.

3.2. Sedimentary Properties

Based on the overall concept of the evolution time t (ka) and accumulation thickness Ls (m) of a sedimentary layer in the simplified multi-scale geological deposition model, in this lateral and vertical two-dimensional slope model, we did not need to take into account some loosely connected factors, for example, the local tectonic subsidence and sedimentary lateral slipping. We ignored other sorts of sedimentation styles and focused on the dominant particle suspended-load model occurring along the slope surface [42,48]. Under this assumption, a referential deposition rate vsr (cm/ka) can be roughly metrological expressed as follows:
v sr 2 = 4 ( ρ s ρ w ) d s g 3 C d ρ w
where g is 9.8 N/kg.
As shown in Figure 1, one of the effects of continuous sinking deposition displaces the initial seawater or pore water out of its living space. We considered Ls as a simplified relationship between the practical deposition rate vs (cm/ka) and the t. The Ls and pore water drainage, qw (kg·m−2·ka−1), at the upward-moving seafloor interface and compelled by compaction activity, can be approximately reckoned as follows (Figure 5):
L s = v s × t
and
q w = ( 1 ϕ 0 ¯ ) ρ w v s
For the non-diagenetic slope seabed layers, we adopted the following exponential fitting Formula (4) as well as Formula (5) to connect the vertical porosity with and without MH in the sediments, respectively:
ϕ 0 , z = ϕ 0 , + ( ϕ 0 , 0 ϕ 0 , ) exp ( β z )
and
ϕ h , z = ϕ 0 , z ( 1 S h , z )
The connection in the soil mechanics of the pore volume content θi and saturation Si was applied in our simulation, as follows:
θ i = ϕ 0 S i
and
θ i = ϕ 0
where subscript i represents the phase states.
The consolidation stress σc (MPa) shows a power–law relationship with the current porosity accompanying the compaction effect by the precipitation on the slope surface. In this work, σc can be seen as triaxial effective compaction stress and gauged by vertical pressure P (MPa) [49,50,51], calculated as follows:
σ c σ c 0 = κ ( ϕ ϕ 0 ) 1 / ω
σ c = 1 + 2 η p 3 P
P = ρ w g L w + [ ϕ 0 ρ w g + ( 1 ϕ 0 ) ρ s g ] v s t
and
ln ( r s ¯ ) = 15.4215 21.9773 x c + 11.5670 x c 2 + 0.2 exp ( 0.0278 σ c )
where ηp is 0.8.
The Kozeny–Carman method was used to measure the conduction capacity of the porous seabeds [52,53]. The intrinsic hydraulic conductivity can be expressed as follows:
k s 0 = γ μ 1 C K-C 1 S sp 2 e 3 1 + e
k s 0 , x = χ k s 0 , z
and
k sh = k s 0 ( 1 S h ) 2
where CK-C is 5.2, γ/μ is 105 cm−1·s−1, and χ is 0.1.

3.3. Flow Properties

The soil and water characteristic curve (SWCC) is eligible to describe the general flow qualities of soft muds and fractured rocks in the slope surface. The relating water content Θ and relative hydraulic conductivity kri are expressed as follows [54,55]:
Θ = θ w θ wr θ ar θ ws θ wr θ ar = [ 1 1 + ( α u sc ) ϖ ] m
u sc = u a u w = 1 α ( 1 Θ 1 / m 1 ) 1 / ϖ
k rw = k s 0 Θ 1 / 2 [ 1 ( 1 Θ 1 / m ) m ] 2
and
k ra = k s 0 ( 1 Θ ) 1 / 2 ( 1 Θ 1 / m ) 2 m

3.4. Geothermal Field

According to the actual geological conditions, we did not give much consideration to the influence of geothermal flow on the existence of MHs, but simply adopted the seafloor temperature Tsb (°C) and geothermal gradient Td (°C/m) to show the local geothermal field Tse (°C), as follows:
T sb = exp { [ 2.0339 ln ( L w / 1000 ) ] / 1.3361 }
and
T se = T sb + L se × T d

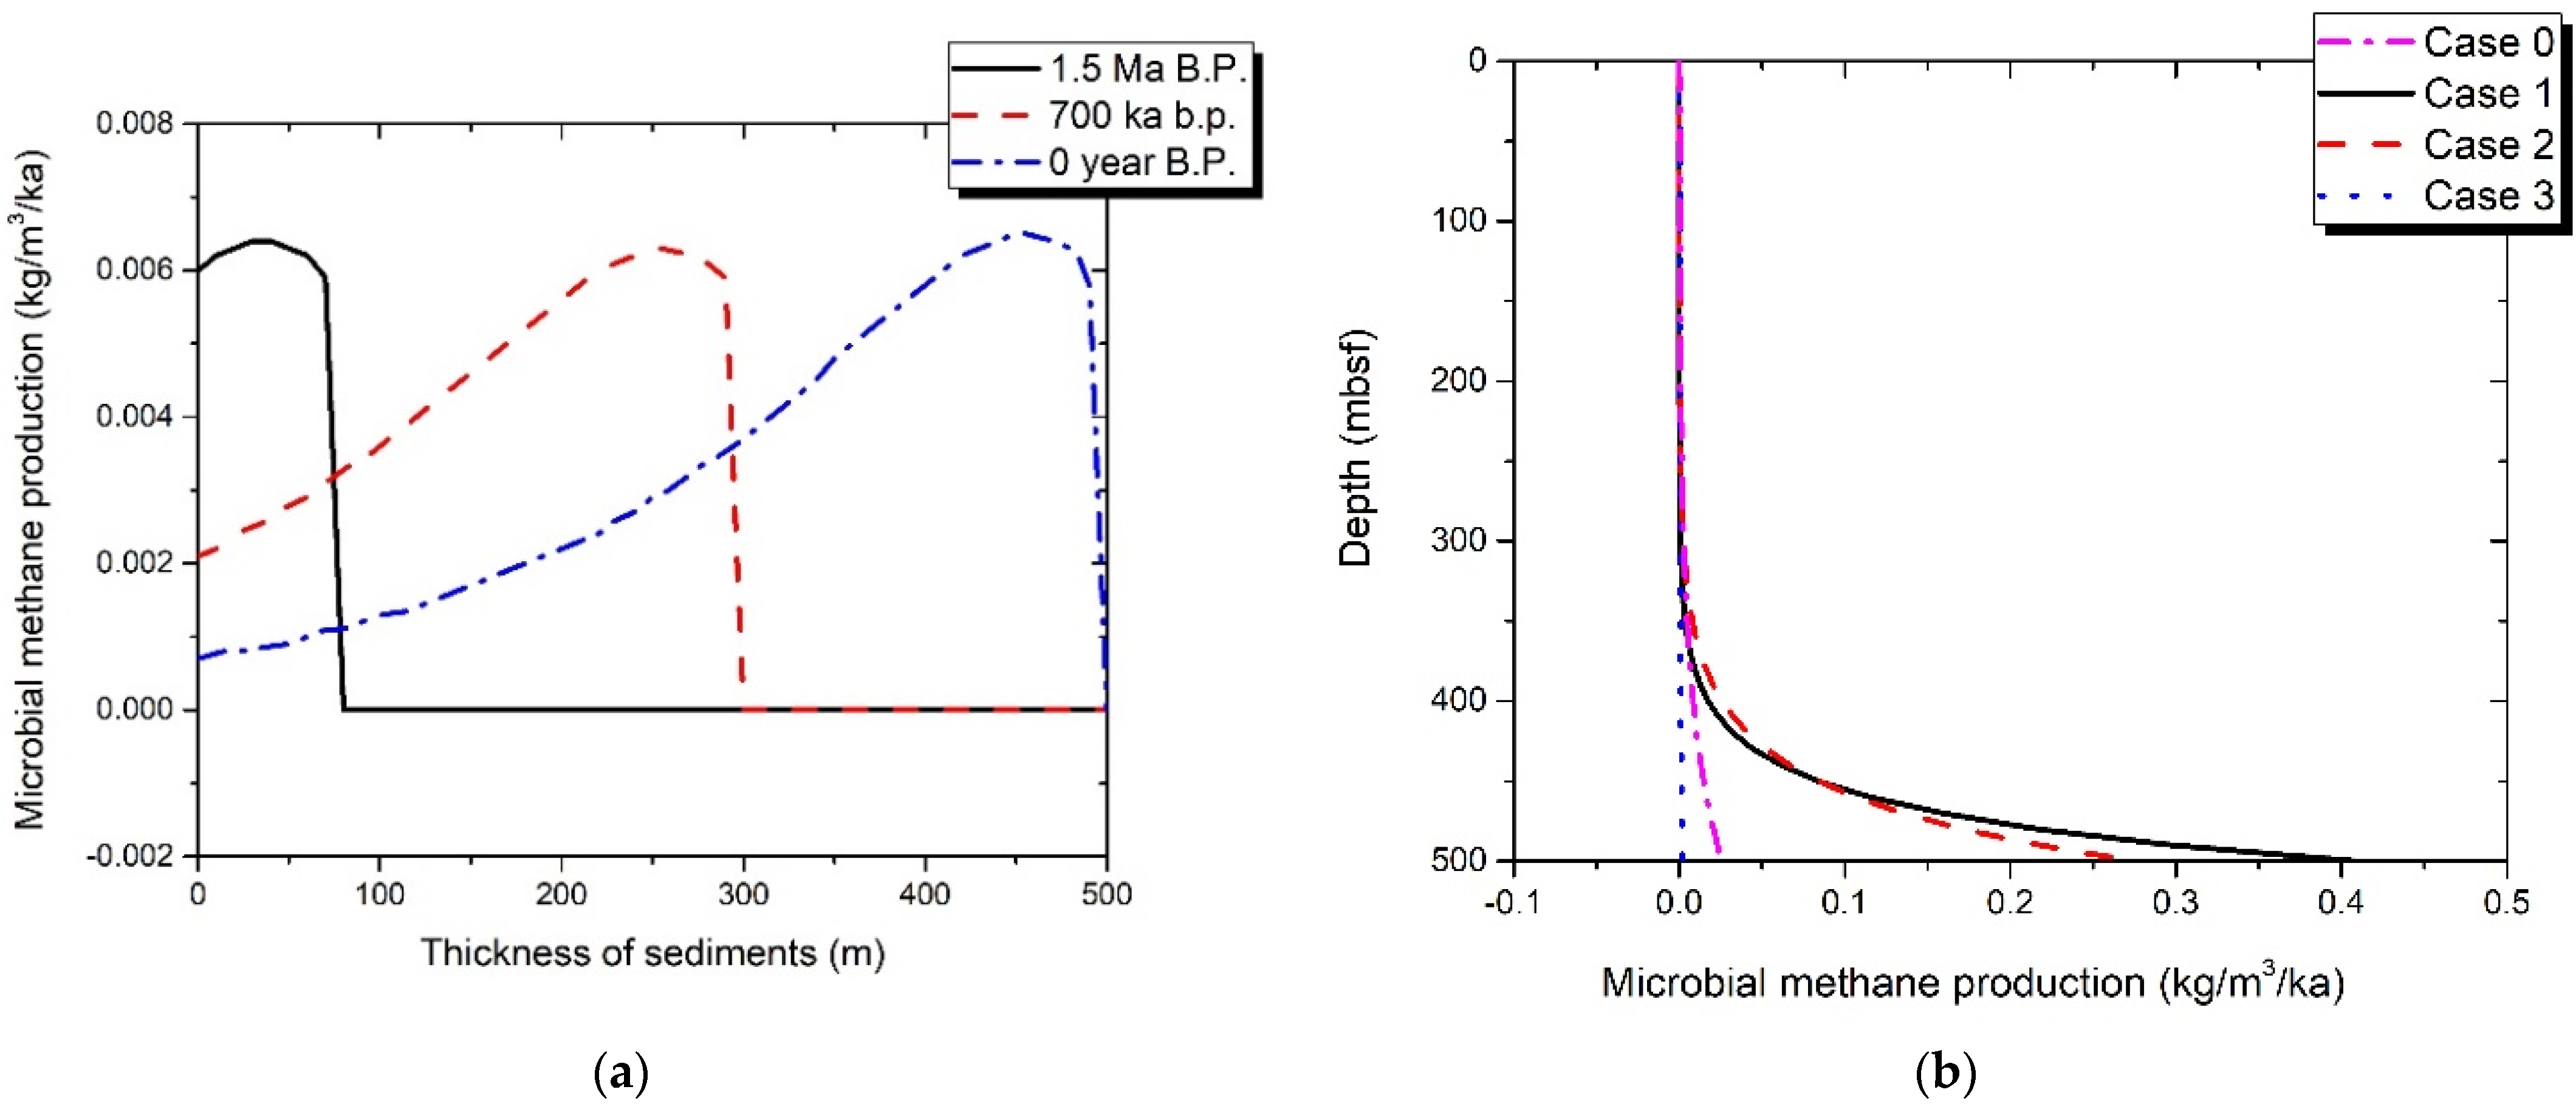
3.5. Microbial Gas Generation

Sedimentary microbial methane is generally produced by a small fraction of local particulate organic carbon. The sulfate-reducing zone (SRZ), where organic matter is oxidized by pore water sulfate ions, is believed to be involved in this complex process, and anaerobic methane is produced rapidly just below the bottom of the SRZ. The metering idea put forward by Malinverno, 2010 [56] consists of the deposition influence, seabed grains, lithology conditions, kinetics of microbial methanogenesis, and the layer sequence, which can be expressed as follows:
q ao = 2 3 ρ s ( 1 ϕ 0 ) λ α BSRZ exp [ λ v s ( z z BSRZ ) ]
where qao (kg·m−3·ka−1) is the in situ microbial methane generation rate; λ (s−1) is the reaction rate constant of the microbial methanogenesis; αBSRZ (dry weight%) is the metabolizable organic carbon at the base of the SRZ; and zBSRZ (m) is the depth to the base of the SRZ.
The microbial methane production capacity in different geological environments varies greatly. We designed four different geological scenarios, which are presented in Table 1, in order to exhibit these differences. The first example, Case 0, represents the current average combination of various factors in the Dongsha continental slope area, which can roughly show the differentiated capacity since the Late Miocene. Case 1 represents the geological environment where the deposition rate and gas production reaction are the fastest, the content of organic carbon particles is high, and the SRZ is the shallowest. Case 2 indicates a fast deposition rate and gas production reaction, high content of organic carbon particles, and the SRZ is a bit deep. Case 3 represents a slower deposition rate, the slowest gas production reaction, very low content of organic carbon particles, and the deepest occurrence of the SRZ. We first used Case 0 to show the evolution relationship between microbial methane production and the sedimentary layer thickness in three different geological periods (Figure 6a). It can be seen that the maximum methane production under this environment is basically the same. Then, after comparing the distribution over depth of these four different gas production scenarios, it was found that the gas production and deposition rate are positively correlated (Figure 6b).

3.6. Pore Salinity

The pore salinity, X w s , is limited by the pore water content, and its precipitation events were ignored in this study. It can be expressed as follows:
X w s = X w 0 s 1 S h

3.7. MH Reaction

MH formation ordinarily has the restrictive condition that the local gas content in the pores reaches solubility first. This means that free gas may appear in certain periods, and methane in both the liquid and gas phases can participate in the MH reaction. In line with the definition of stratigraphic-diffusive MHs, the free gas will eventually disappear due to insufficient supply as the reaction continues. Referring to some previous related research work [57,58,59,60,61,62], the expressions of kinetic reaction are as follows:
r a = ς 0 exp [ Δ E a R ( 1 T se 1 T eq ) ] ϕ 0 ( f f eq )
r h = r a
and
r w = 5.86 × r a
where ΔEa/R is 9752.73 K.

3.8. Physical Stoichiometric Model

The classic Richards’ equation is widely applicable for dealing with the aspects of unsaturated flow in unconsolidated or semi-consolidated porous sediments [63,64,65,66,67]. In this work, we assumed that Richards’ equation was also appropriate to describe the phenomena of drainage and imbibition events in the non-diagenetic loose shallow sediments in the seabed. Thus, the equations are as follows:
ρ h θ h t = r h
θ w t = x [ D w ( Θ ) θ w x k rwx ( Θ ) ] + z [ D w ( Θ ) θ w z k rwz ( Θ ) ] 1 ρ w ( q w + M w r w )
and
θ a t = x [ D a ( Θ ) θ a x k rax ( Θ ) ] + z [ D a ( ( Θ ) θ a z k raz ( Θ ) ] + 1 ρ a ( q a + q ao M a r a q w a )
We used the item, qwa (kg·m−2·ka−1) to count the dissolved methane, and its expression is as follows:
q w a = θ w ρ a D a ( Θ ) C w a
Here, the initial θa is nearly 0 [68].

4. Results

The two-dimensional occurrence and distribution evolution process of stratigraphic-diffusive MH-bearing sediments in the slope surface seabed of the Dongsha area have been demonstrated theoretically in this work. Little thermogenic gas is produced in deep immature or low-mature gas rock sources and it just enters the hydrocarbon generation threshold and migrates upward into the bottom of the HSZ via fault conduits. The dominant microbial gas migrates laterally within the favorable slope of the HSZ, forming discontinuous visible or invisible thin-bedded MH layers. Only in the regions where some active and periodic thermogenic gas flows into the bottom of the HSZ can massive, thick-layered MH reservoirs be produced with morphological plaque characteristics.
The details of different types of gas sources and supply origins from the local shallow or deep marine carbonate sequence were ignored in this study, and we only investigated the production of in situ microbial gas within the research target strata in the basic geologic Case 0. Therefore, although the gas phase may have appeared at a certain stage during the evolution process, it will eventually die out due to dissolution or reaction. Furthermore, molecular diffusion is the main process for forming MHs. Table 2 shows all the specific shape and size of this research zone, and according parameter values when simulating the basic geologic scenario in our model.

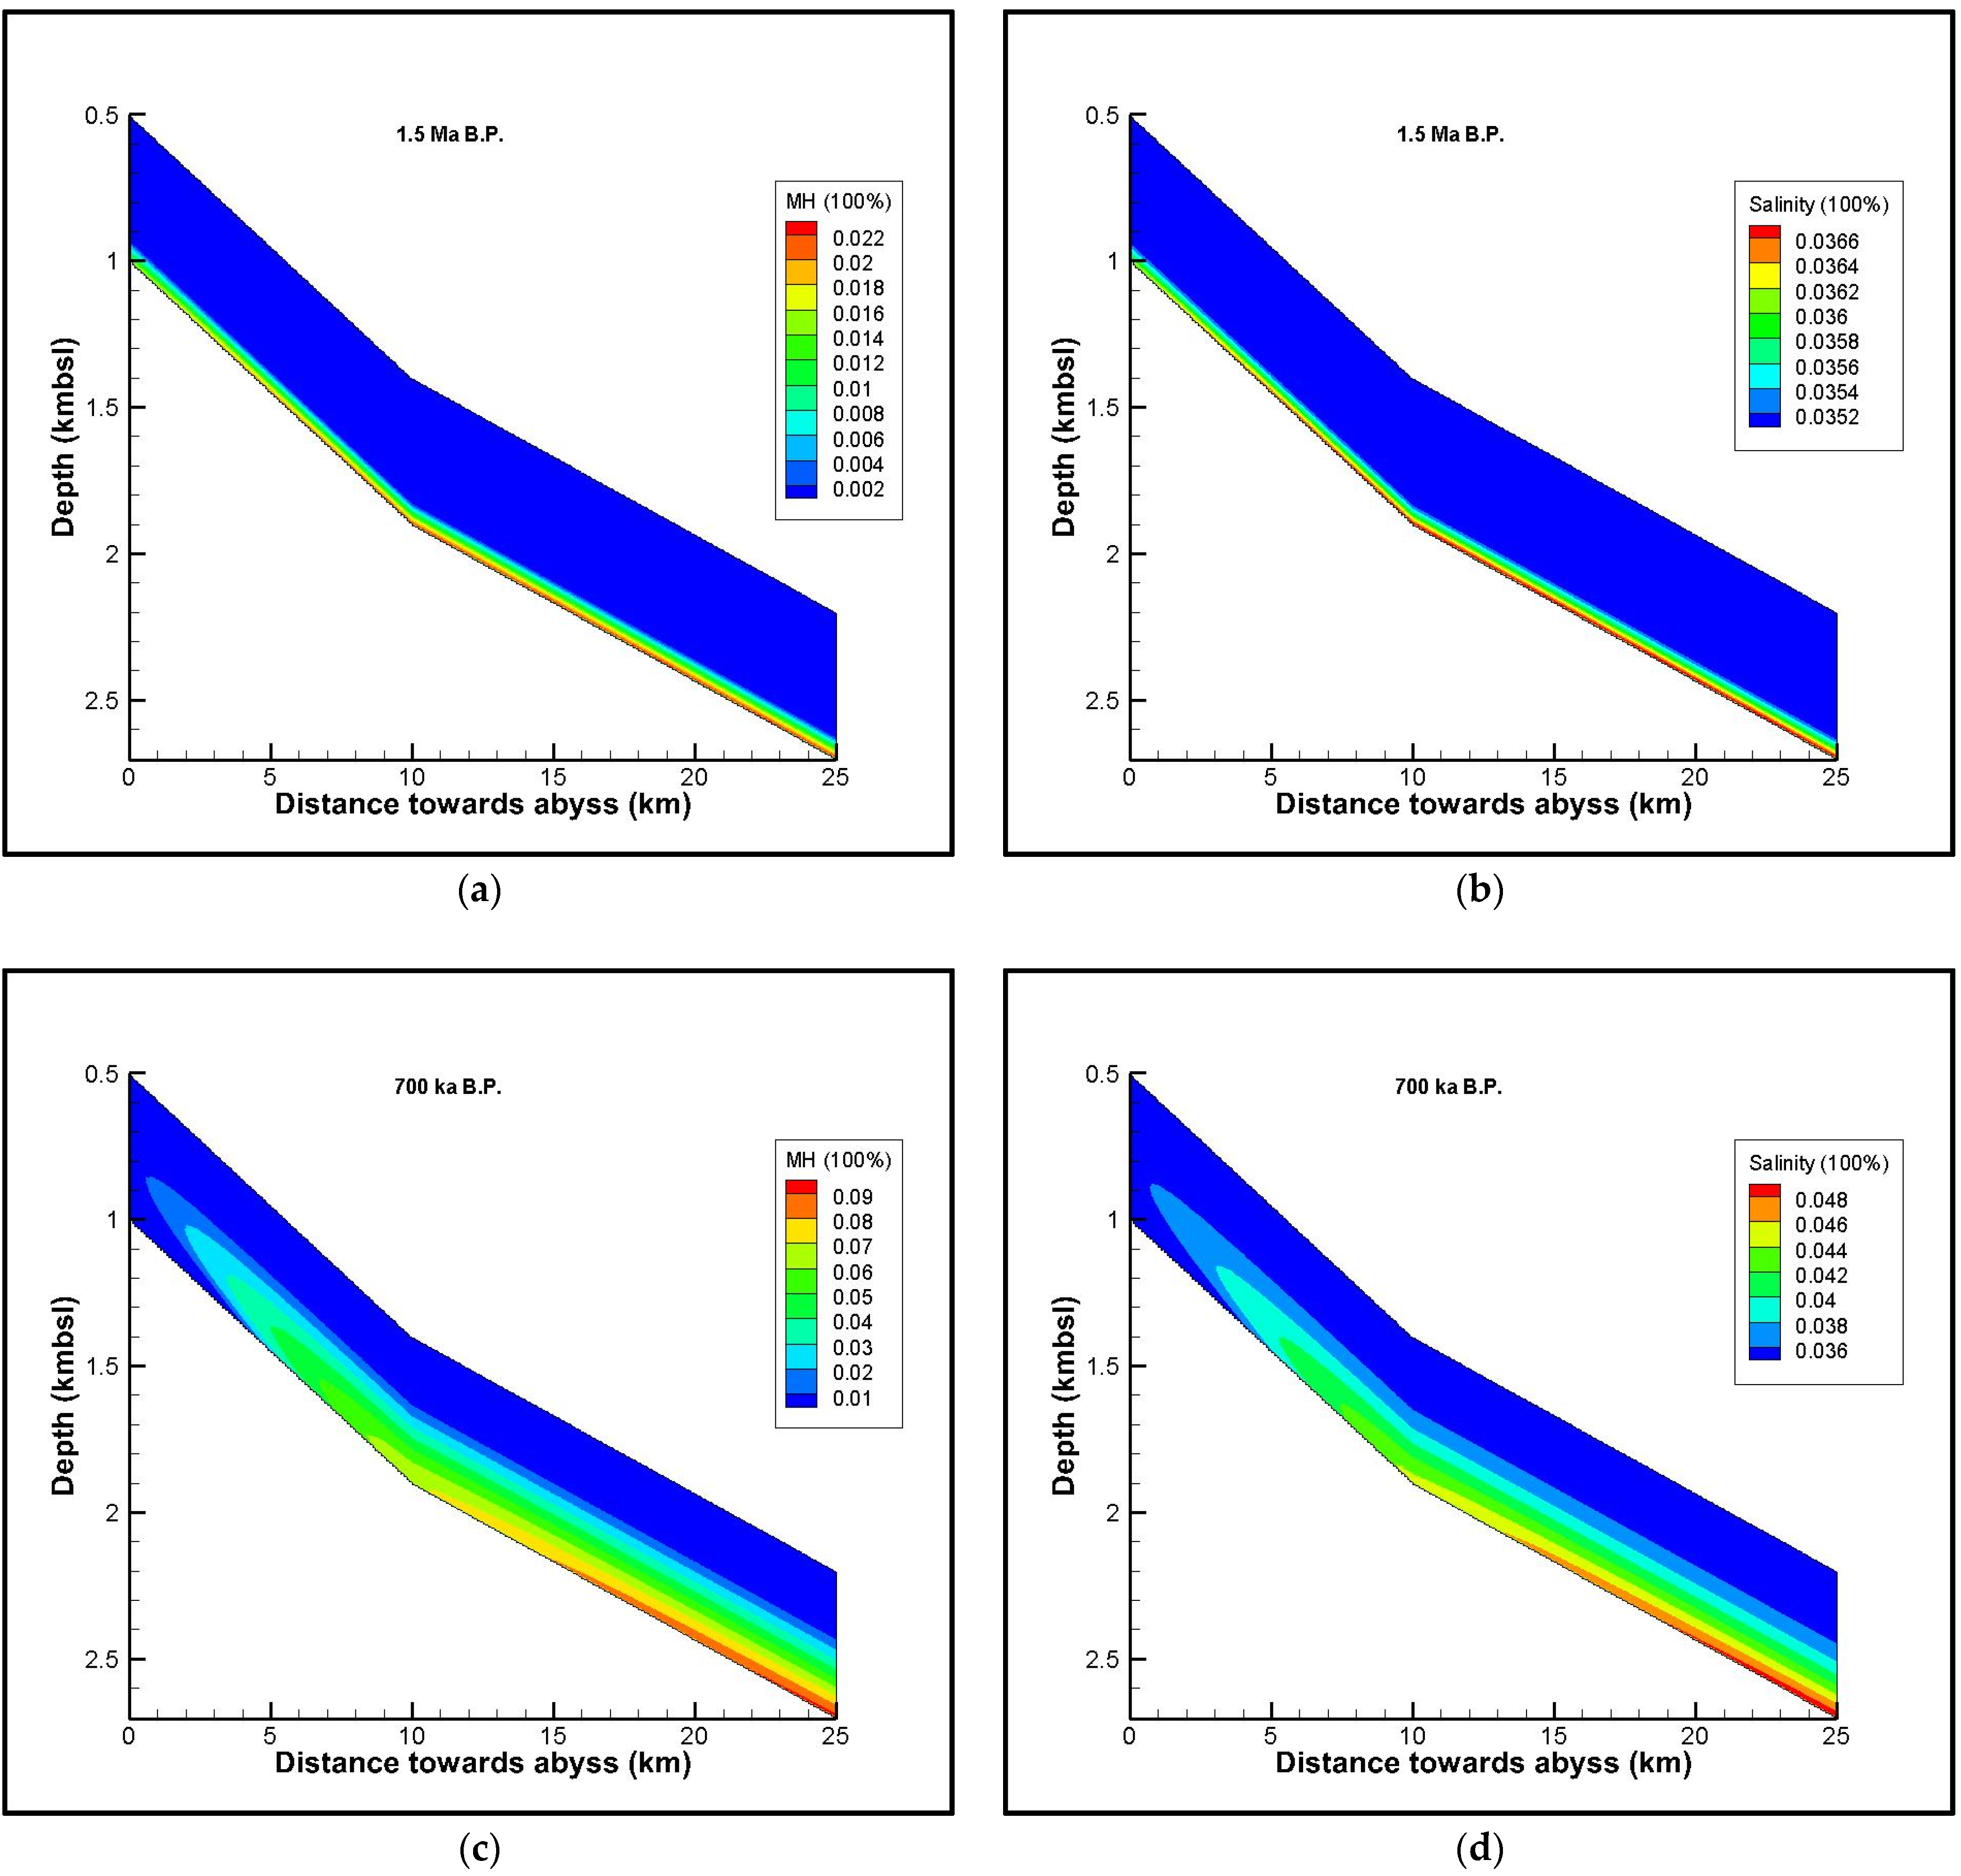
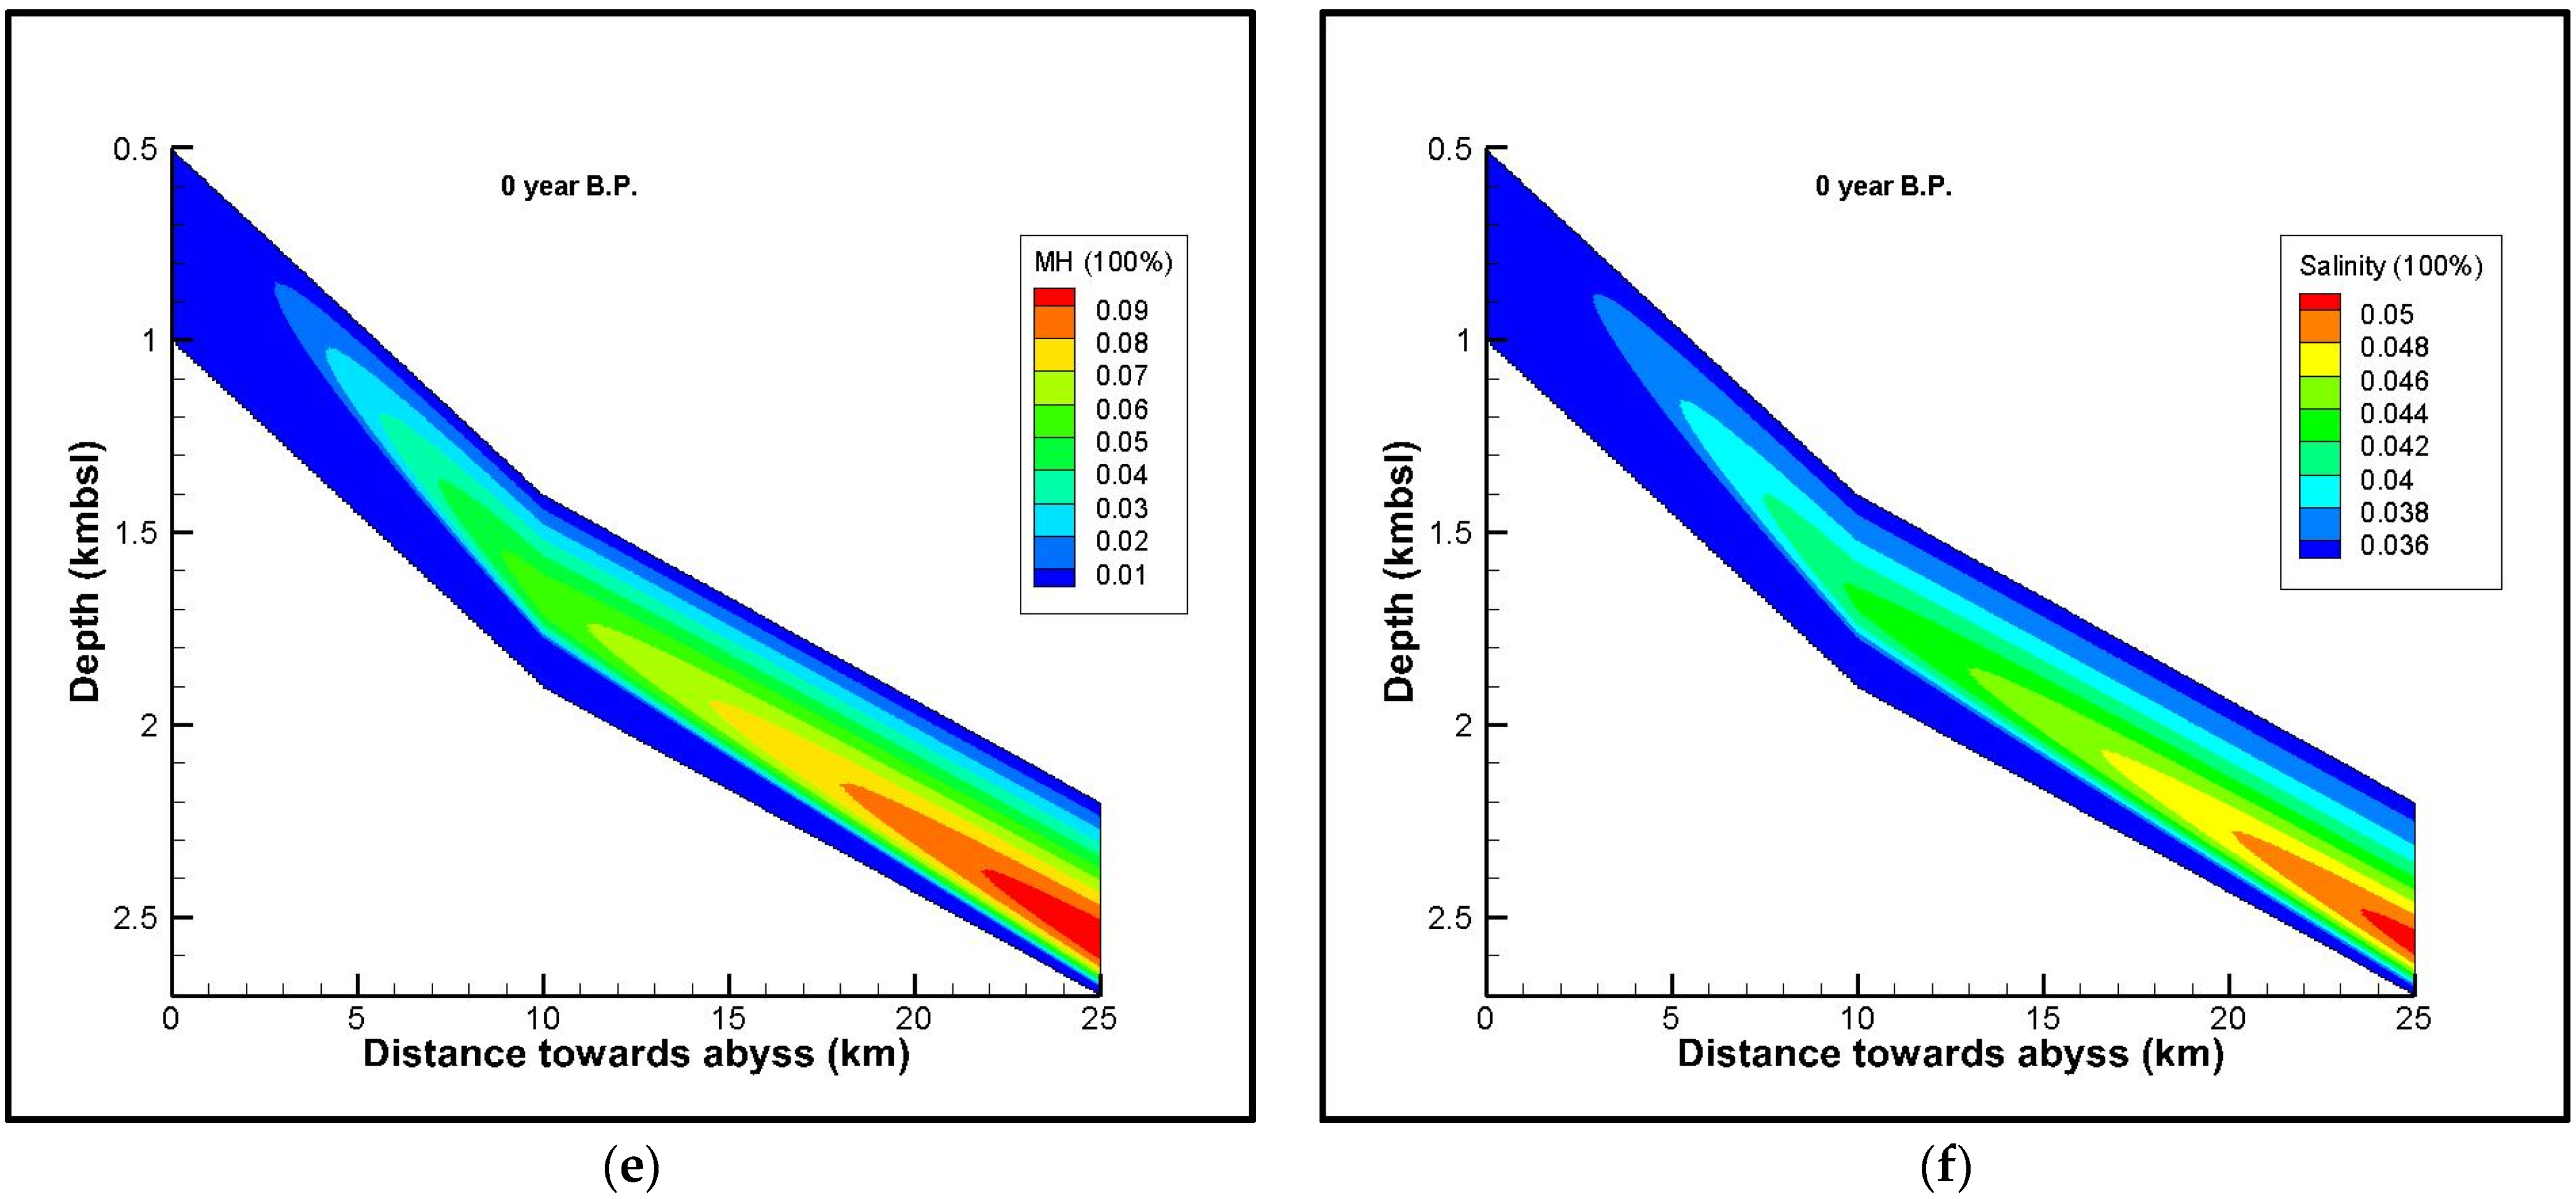
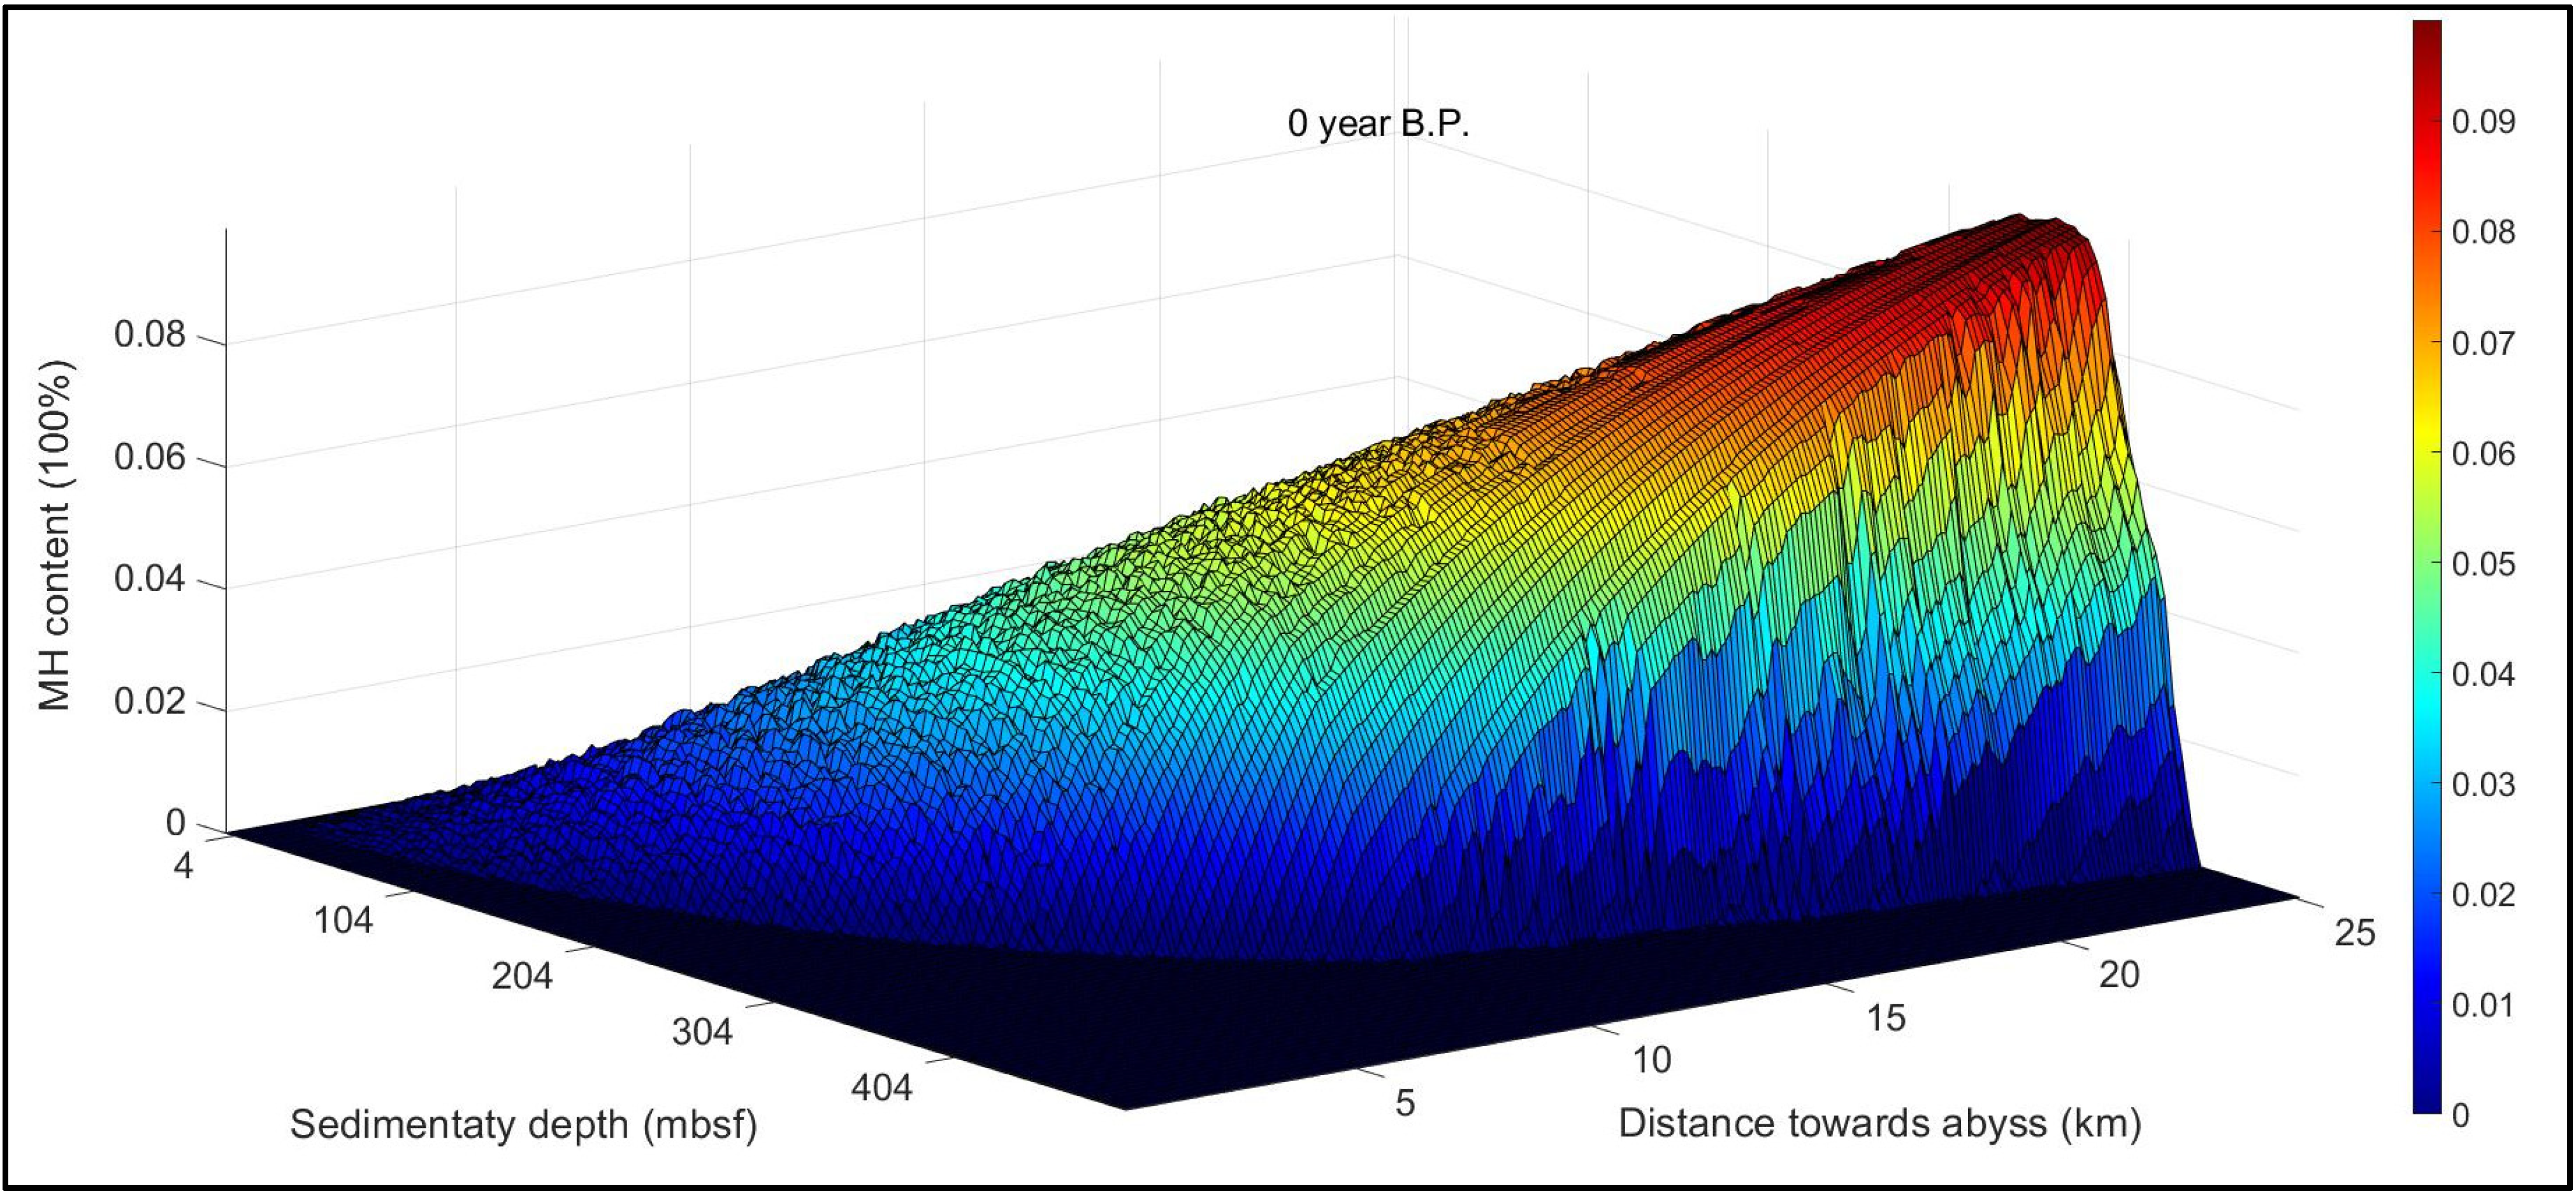
4.1. MH Performance during Deposition

The dynamic evolution process of the stratigraphic-diffusive MH system was revealed through three selected representative times, 1.5 Ma B.P. (or 300 ka from the beginning), 700 ka B.P. (or 1.1 Ma), and at present (or 1.8 Ma).
First, we wanted to clarify the change history of the shallow sedimentary layers along the slope surface that hosts MHs. The underlying control parameters that most characterize this change are the porosity and temperature. According to the model settings, the slope surface seabed was filled by the deposition of suspended particles. With the continuous accumulation of various shapes of particulate matter, the seawater above the determined baseline of the originally studied slope area was gradually pushed aside and replaced with fossil-rich clayey silt and/or silty clay mud containing fine sand layers. Figure 7 shows how this process evolved over time from the Pleistocene (1.8 Ma). When the timescale reached 300 ka, the accumulation thickness was only about 84 m. At this time, the porosity (Figure 7a) and temperature (Figure 7b) of the seabed were partly altered following the formation of the layer. When the geological time passed 1.1 Ma (or 1.5 Ma ago) and reached the early Middle Pleistocene (0.7 Ma), this deep-water continental slope area received huge amounts of deposits. The debris depth reached 308 m, which means that more than half of the studied layers turned into sedimentary seabed. The part that still maintained the state of the seawater remained in its initial condition, but the deposition porosity (Figure 7c) and temperature (Figure 7d) changed according to the model settings. Finally, when it evolved to the present, the thickness of the target layer was 504 m. The porosity (Figure 7e) and temperature (Figure 7f) changed to coincide with the current surroundings.
After learning the relevant information of the local porosity and temperature, we were able to further acquire the changes of two other indicators in this type of geological system—the sedimentary pressure and gas solubility, which followed the changes of the two aforementioned factors. Within the process of particle deposition, the original seawater pressure in the superficial slope transformed into various stress environments in the strata, including hydrostatic, pore, and overburden pressures. Aspects such as the mud content in the strata, particle size, grain contact style, geological structure, and the difference between the gas concentration and salinity made the surface layers exhibit a variety of anisotropic characteristics, which in turn, led to the irregular distribution of sedimentary effective stress, and the local appearance of overburden pressure in some strata fragments. In this model, for stratigraphic-diffusive MH systems that show more isotropic inclinations, we did not consider this diversity for the time being. Instead, pore pressure was used to characterize the formation of MH in this work. Based on our experience, we set the pore pressure coefficient to be 0.101 MPa/m. It can be seen that the maximum pore pressure at the slope baseline changed from the initial 27.3 MPa to the current 29.2 Ma, with an increase of about 7% (Figure 8a,c,e). According to our settings, only when the gas content reached its solubility could hydrates be generated from the reaction by gas and/or dissolved phases. The gas solubility was affected by the local temperature, pressure, and salinity. From the results, the corresponding solubility in the volume content at the same baseline position changed from the original 0.63% to 0.35% now (Figure 8b,d,f). It was reduced by approximately half, which also indicates that the reaction of MH in sediments is faster than that in pure seawater.
Finally, we were able to investigate the conversion of this diffusive MH reservoir and the chloridion or salinity in the pore water—which are generally adopted as indicators of this system—along the slope surface seabed during the deposition process. In Figure 9a, when the sedimentation activity passed 300 ka since the beginning of the Pleistocene, MHs are produced in fresh thin sediments across the hypothetical baseline. At this moment, the slope foot had a maximum MH of about 0.022, where the salinity was about 0.0366 (Figure 9b). When this process continued to evolve to 700 ka B.P., the MH peak reached 0.09 (Figure 9c), where the salinity was 0.048 (Figure 9d). In contrast with these two scenarios, when the time reached the present, the distribution of the MHs was closer to the current seafloor (Figure 9e). It is very clear that the previous MH-bearing layers disappeared, while a group of MH-bearing layers appeared close to the foot area of the slope. The maximum MH concentration within these sediments was about 0.097, with its location being 310 mbsf. The increasing salinity at this position reached its maximum, about 0.051 (Figure 9f). In this investigation, the accumulation conditions of the MH reservoir looked better than before, as the MH became more and more abundant, concentrated, and was more widely distributed.
Note that although we did not take into account in the model settings the huge diversity of the seabed lithology, slope sedimentary structure, fluid migration, and many other aspects of actual complex conditions, our simulation results still show the irregular distribution of MHs, which is the cause of some influencing factors, such as the slope topography and local thermodynamic constraints. Different from the two-dimensional smooth surface in Figure 9, when the results were converted into a three-dimensional frame, the appearance of MH content in the sediments of different slope positions shows obvious terraced unevenness. The MH content peak has especially obvious discontinuities and deep potholes within the local slope of the HSZ (Figure 10). This peculiar discovery has strong guiding significance for the exploration and identification of resource sweet spots of the stratigraphic-diffusive MH and the consequential layout of production wells.

4.2. Simultaneous Decomposition and Formation

As shown in Figure 9c,e, due to the continuous uplift of the bottom boundary of the HSZ caused by the accumulation of suspended substances, the old MHs adjacent to the slope baseline will gradually decompose and disappear, compared to the new MH-bearing layer formation in the middle-depth part of the continental slope sediment. This interesting situation, in which the lower MH decomposes simultaneously with the upper MH generation, preserves the local carbon source, in a sense, and prevents most of the carbon gas from overflowing out of the seabed. We used the reaction driving force term, rh/ζ0 (1/MPa), to analyze the hidden intrinsic mechanism. The vertical changes in the rh/ζ0 from a middle slope location with a current seafloor depth of 1560 mbsl at the same time points are shown in Figure 11. From 1.5 to 0.7 Ma B.P., the increased rh/ζ0 agrees with the MH accumulation (Figure 11a,b). The peak of the rh/ζ0 within this stage is a little variable and steadily close to about 0.6 1/MPa. However, the rh/ζ0 obviously turns from 0 to a negative value in Figure 11c, which verifies the MH dissociation event.
Compared to the above vertical variation case, six different locations within the slope surface seabed were used to demonstrate the change in the MH distribution from a lateral perspective so that we could better understand this coexistence phenomenon. Figure 12 shows the value change of the rh/ζ0 in the current location coordinates—a (664 mbsl + 470 mbsf), b (878 mbsl + 394 mbsf), c (1130 mbsl + 314 mbsf), d (1400 mbsl + 224 mbsf), e (1720 mbsl + 134 mbsf), and f (2040 mbsl + 54 mbsf) (Figure 12a−f). The first distance of these coordinates is the seafloor depth along the continental slope, and the latter represents the depth of this location in the layer. This combination should be able to characterize the entire deposition from shallow to deep. The observed MH reaction changes in these six locations and the spatiotemporal evolutionary morphology of the slope stratigraphic-diffusive system since the Pleistocene are quantitatively displayed and are qualitatively helpful for understanding its basic principles.

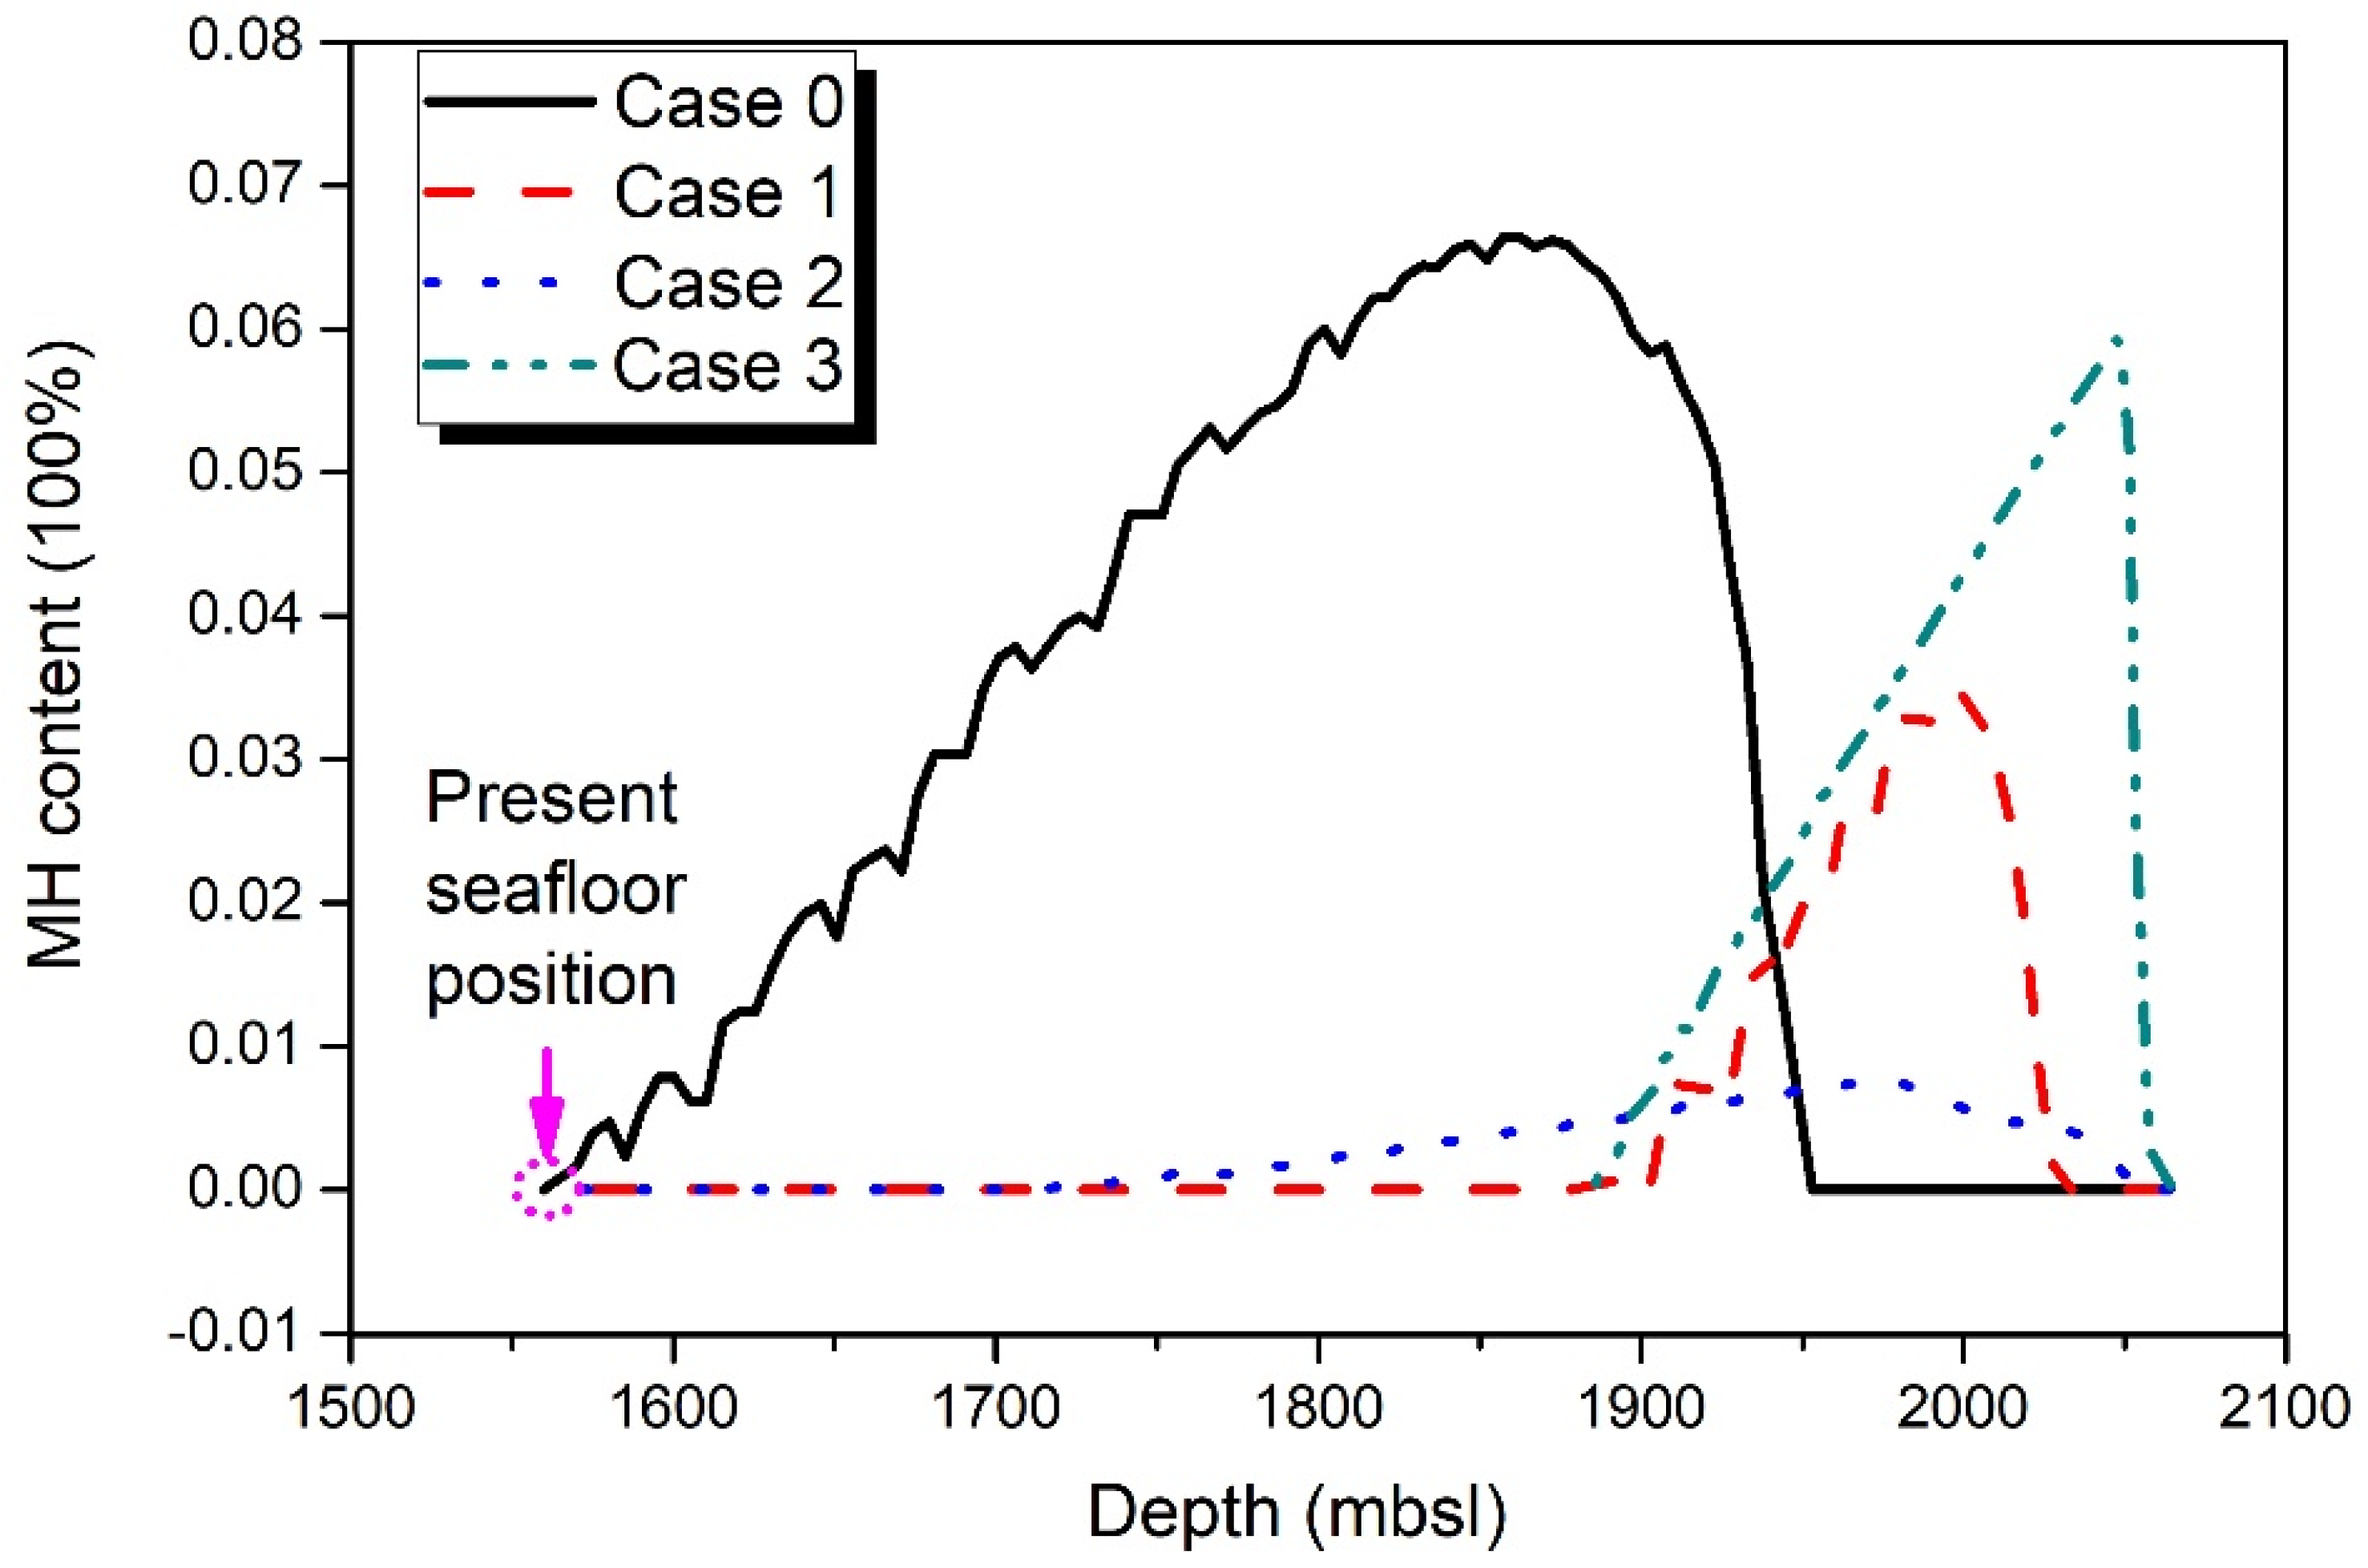
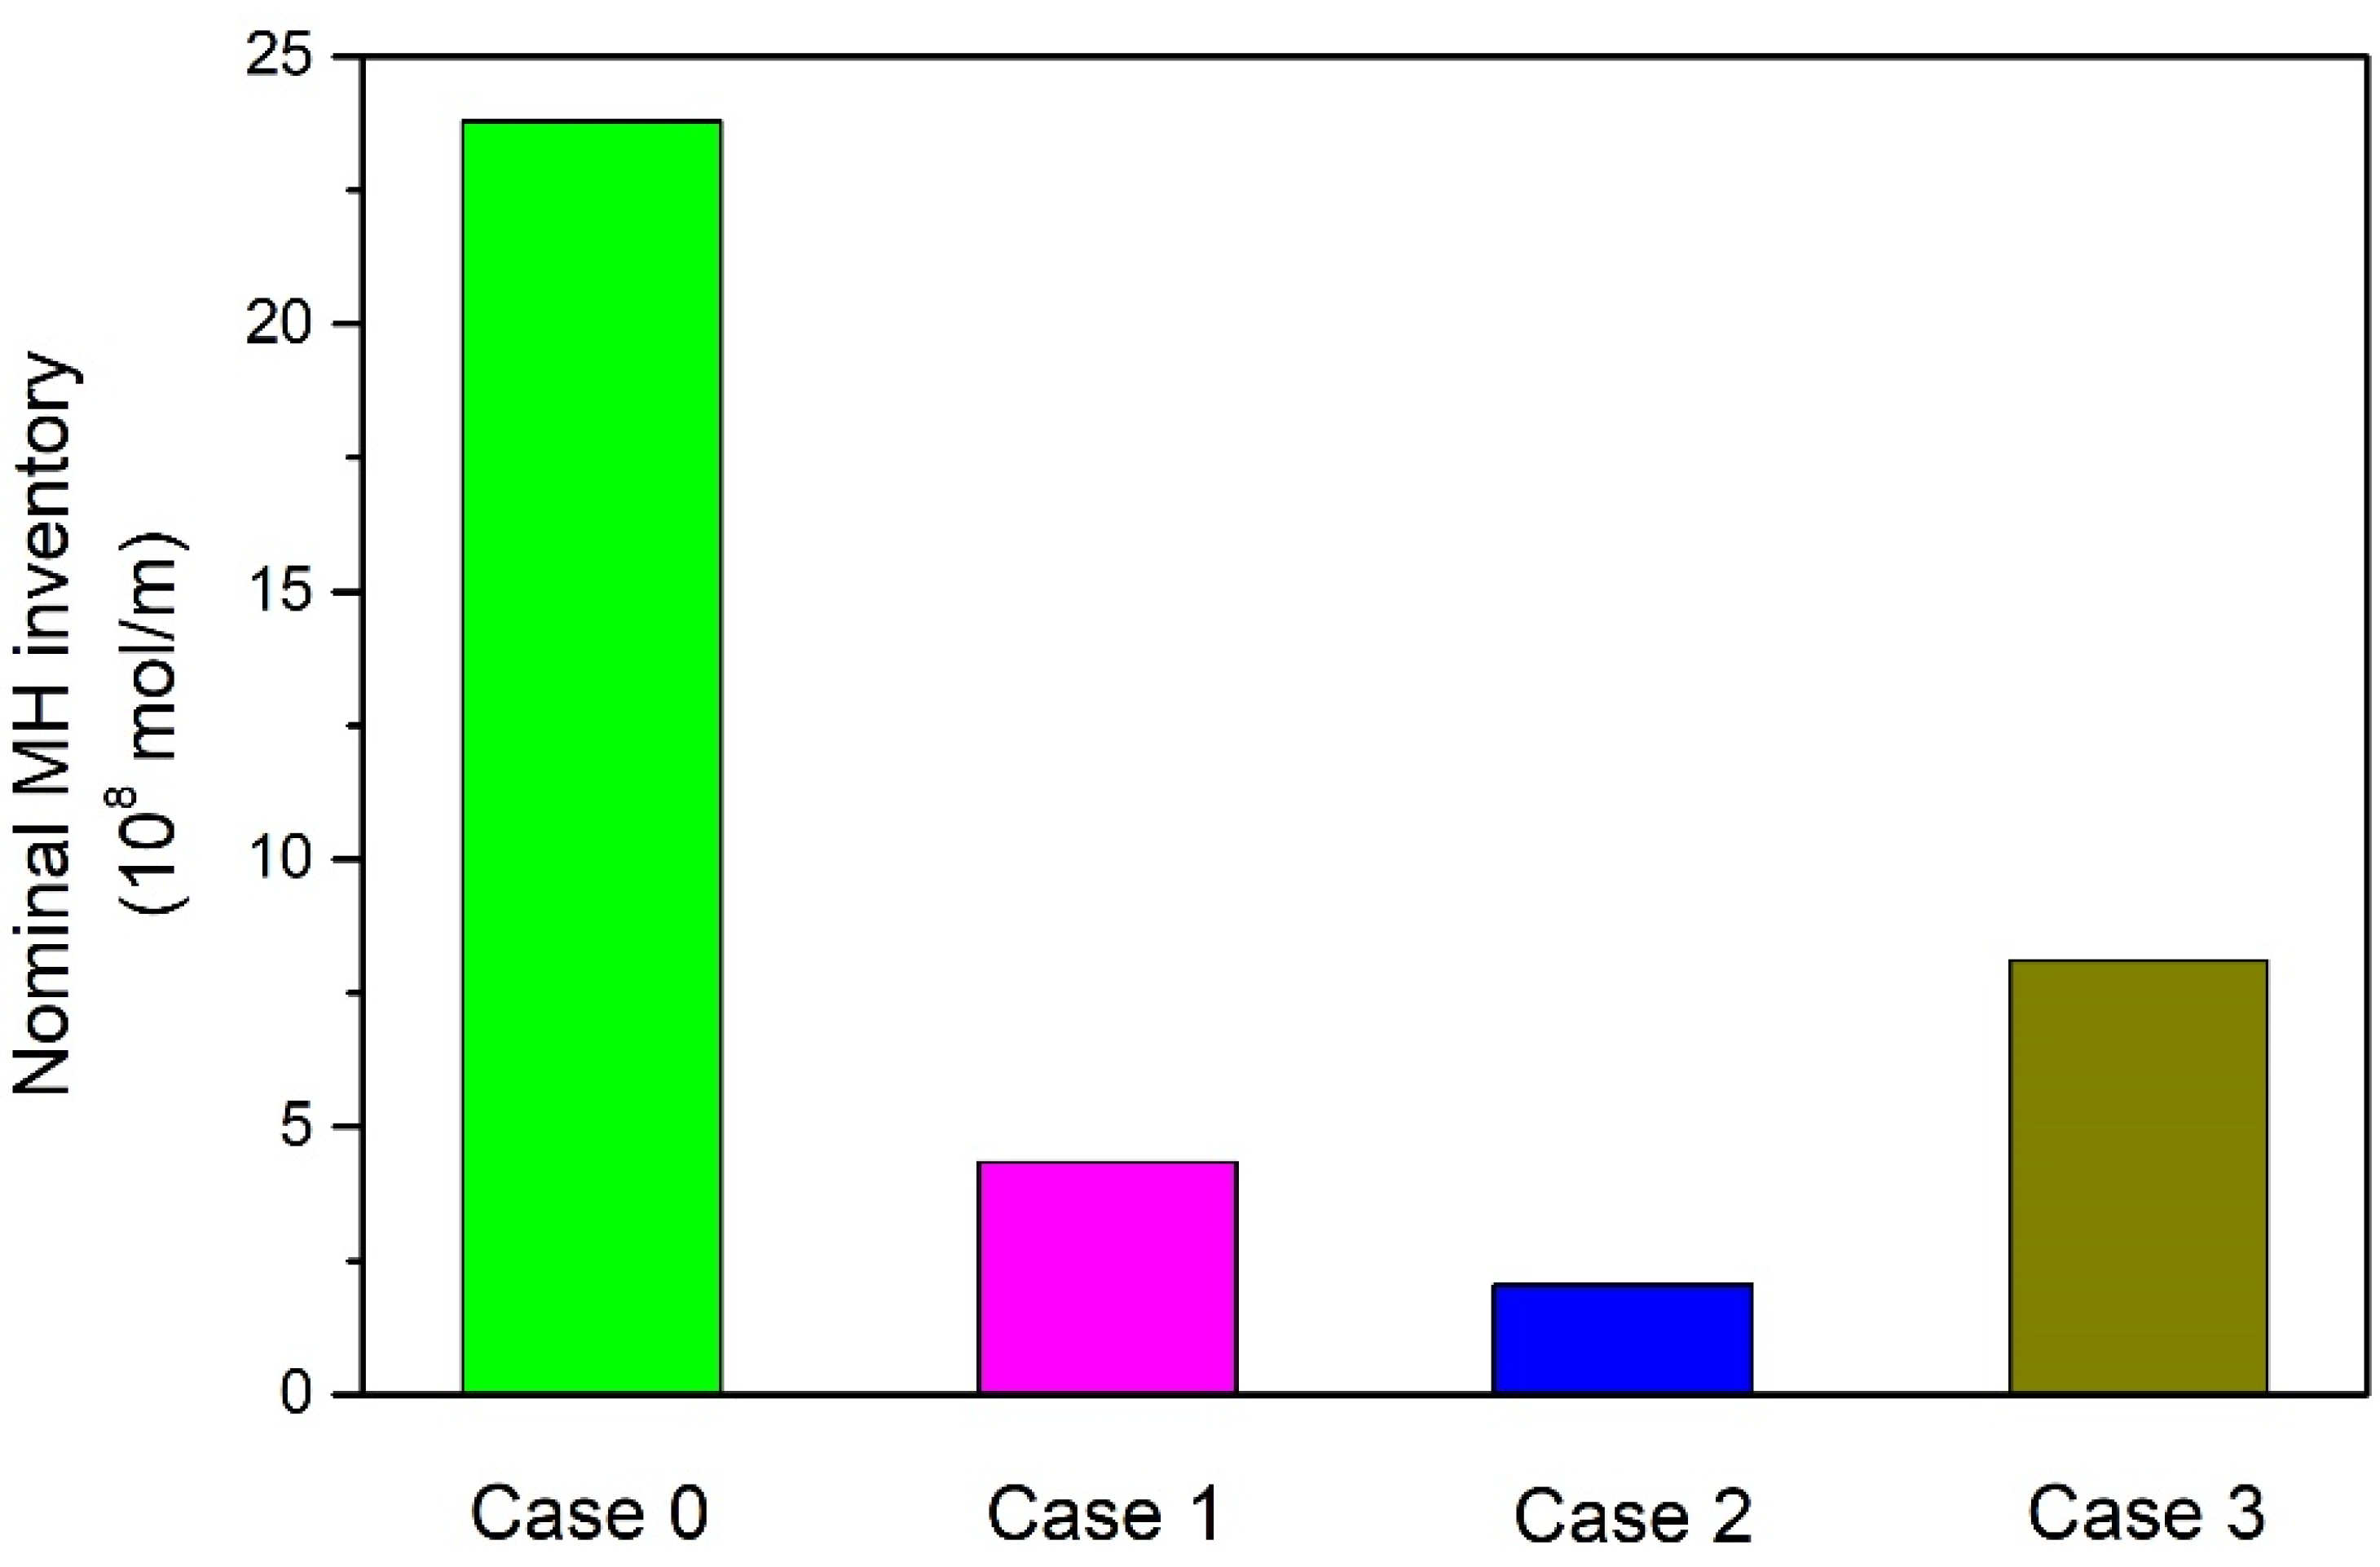
4.3. Comparison of Different Geological Cases

According to GMGS2, the MH-bearing layer in the Dongsha slope surface is mostly unconsolidated or weakly consolidated muddy silty clay. According to C1/C2 ratio analysis, the MH is mainly generated by local microbial gas, and occasionally by deep thermogenic gas. In analyzing the hydrate-bearing logging profile data and combining the information of the stratigraphic sequence, structure distribution, microbial fossil identification, and biological events, we can speculate that the gas will diffuse upward within pore fluids along coarse-grained open fault structures and undergo a short-range migration into the overlying fine-grained seabed with argillaceous particles, thus forming diffusive MHs. We established four different combinations of the six principal system indicators, including the sedimentation rate, gas generation rate, organic carbon content, SRZ thickness, MH reaction kinetic coefficient, and the geothermal gradient, to quantitatively represent the complex strata in the actual wide continental slope area (Table 1). The conditions and reaction capabilities of these geologic cases show the differences in the evolution of MH reservoirs.
Case 0 shows a general hydrocarbon-generating geological environment obtained from the current field investigation of the shallow surface layer of the continental slope in the Dongsha area, which was used in the aforementioned MH reservoir evolution analysis. Case 1 presents a stratum environment with a high deposition rate and rapid hydrocarbon generation, including a rich TOC concentration, shallow SRZ, rapid MH reaction, and a high geothermal field. Case 2 includes a high deposition rate and hydrocarbon generation rate, slow MH reaction, very high TOC concentration, deep SRZ, and a low geothermal field. Case 3 corresponds to Case 1, showing a low deposition rate, slower hydrocarbon generation rate, moderate MH reaction, low TOC concentration, very shallow SRZ, and an appropriate geothermal field. We still used the location of 1560 mbsl on the continental slope as an example. According to the results in Figure 13 below, the vertical distribution of MHs is the most widely distributed in Case 0, which is also the most consistent with the current survey reported by GMGS2. The MHs in Cases 1 and 3 are more likely to be stored in deeper sedimentary layers, while the MH content of Case 2 is too low. This shows that the diffusive MHs in the Dongsha area may have been raised within moderate geological conditions.
The previous preliminary assessment showed that the MH resource in this area is about 1250 × 108 m3 (under conditions of 50% probability), so it can be considered another promising exploration target area. In this study, we applied the method of the nominal resource, Q h (mol/m), to compare the estimation difference, and the equation is as follows:
Q h = ρ h M h S area θ h , z
where Sarea (m2) represents the area of the study slope area, and θ h , z is average hydrate content weighted by sediments. We used it to run the four geological cases above. Due to the differences in the deposition rate, we stopped the calculation when either the sedimentary layer thickness was 504 m or the length of time was 1.8 Ma. In Case 2, the timescale was only calculated until 1.26 Ma, and in Case 3, the thickness was only 180 m. As shown in Figure 14, the largest nominal resource amount in Case 0 can reach 23.78 × 10⁸ mol/m which is 11.6 times that of the smallest amount of 2.044 × 10⁸ mol/m in Case 2. This confirms that this area is a potential MH resource.

5. Discussion

Unlike the study of structural-seepage MHs, where it is necessary to account for more complicated influencing factors, such as gas invasion, fault trend, and others, stratigraphic-diffusive MH reservoirs still follow the basic laws of the formation of the traditional petroleum system, which generally converts hydrocarbon from the source to trap and accumulation. That is, it also includes a corresponding source, sink, and aggregation process, and connects intervenient migration and storage conduction modes. Thus, there are still several key issues in the aforementioned results on the temporal and spatial evolution of MH in the Dongsha continental slope area that need further clarification.

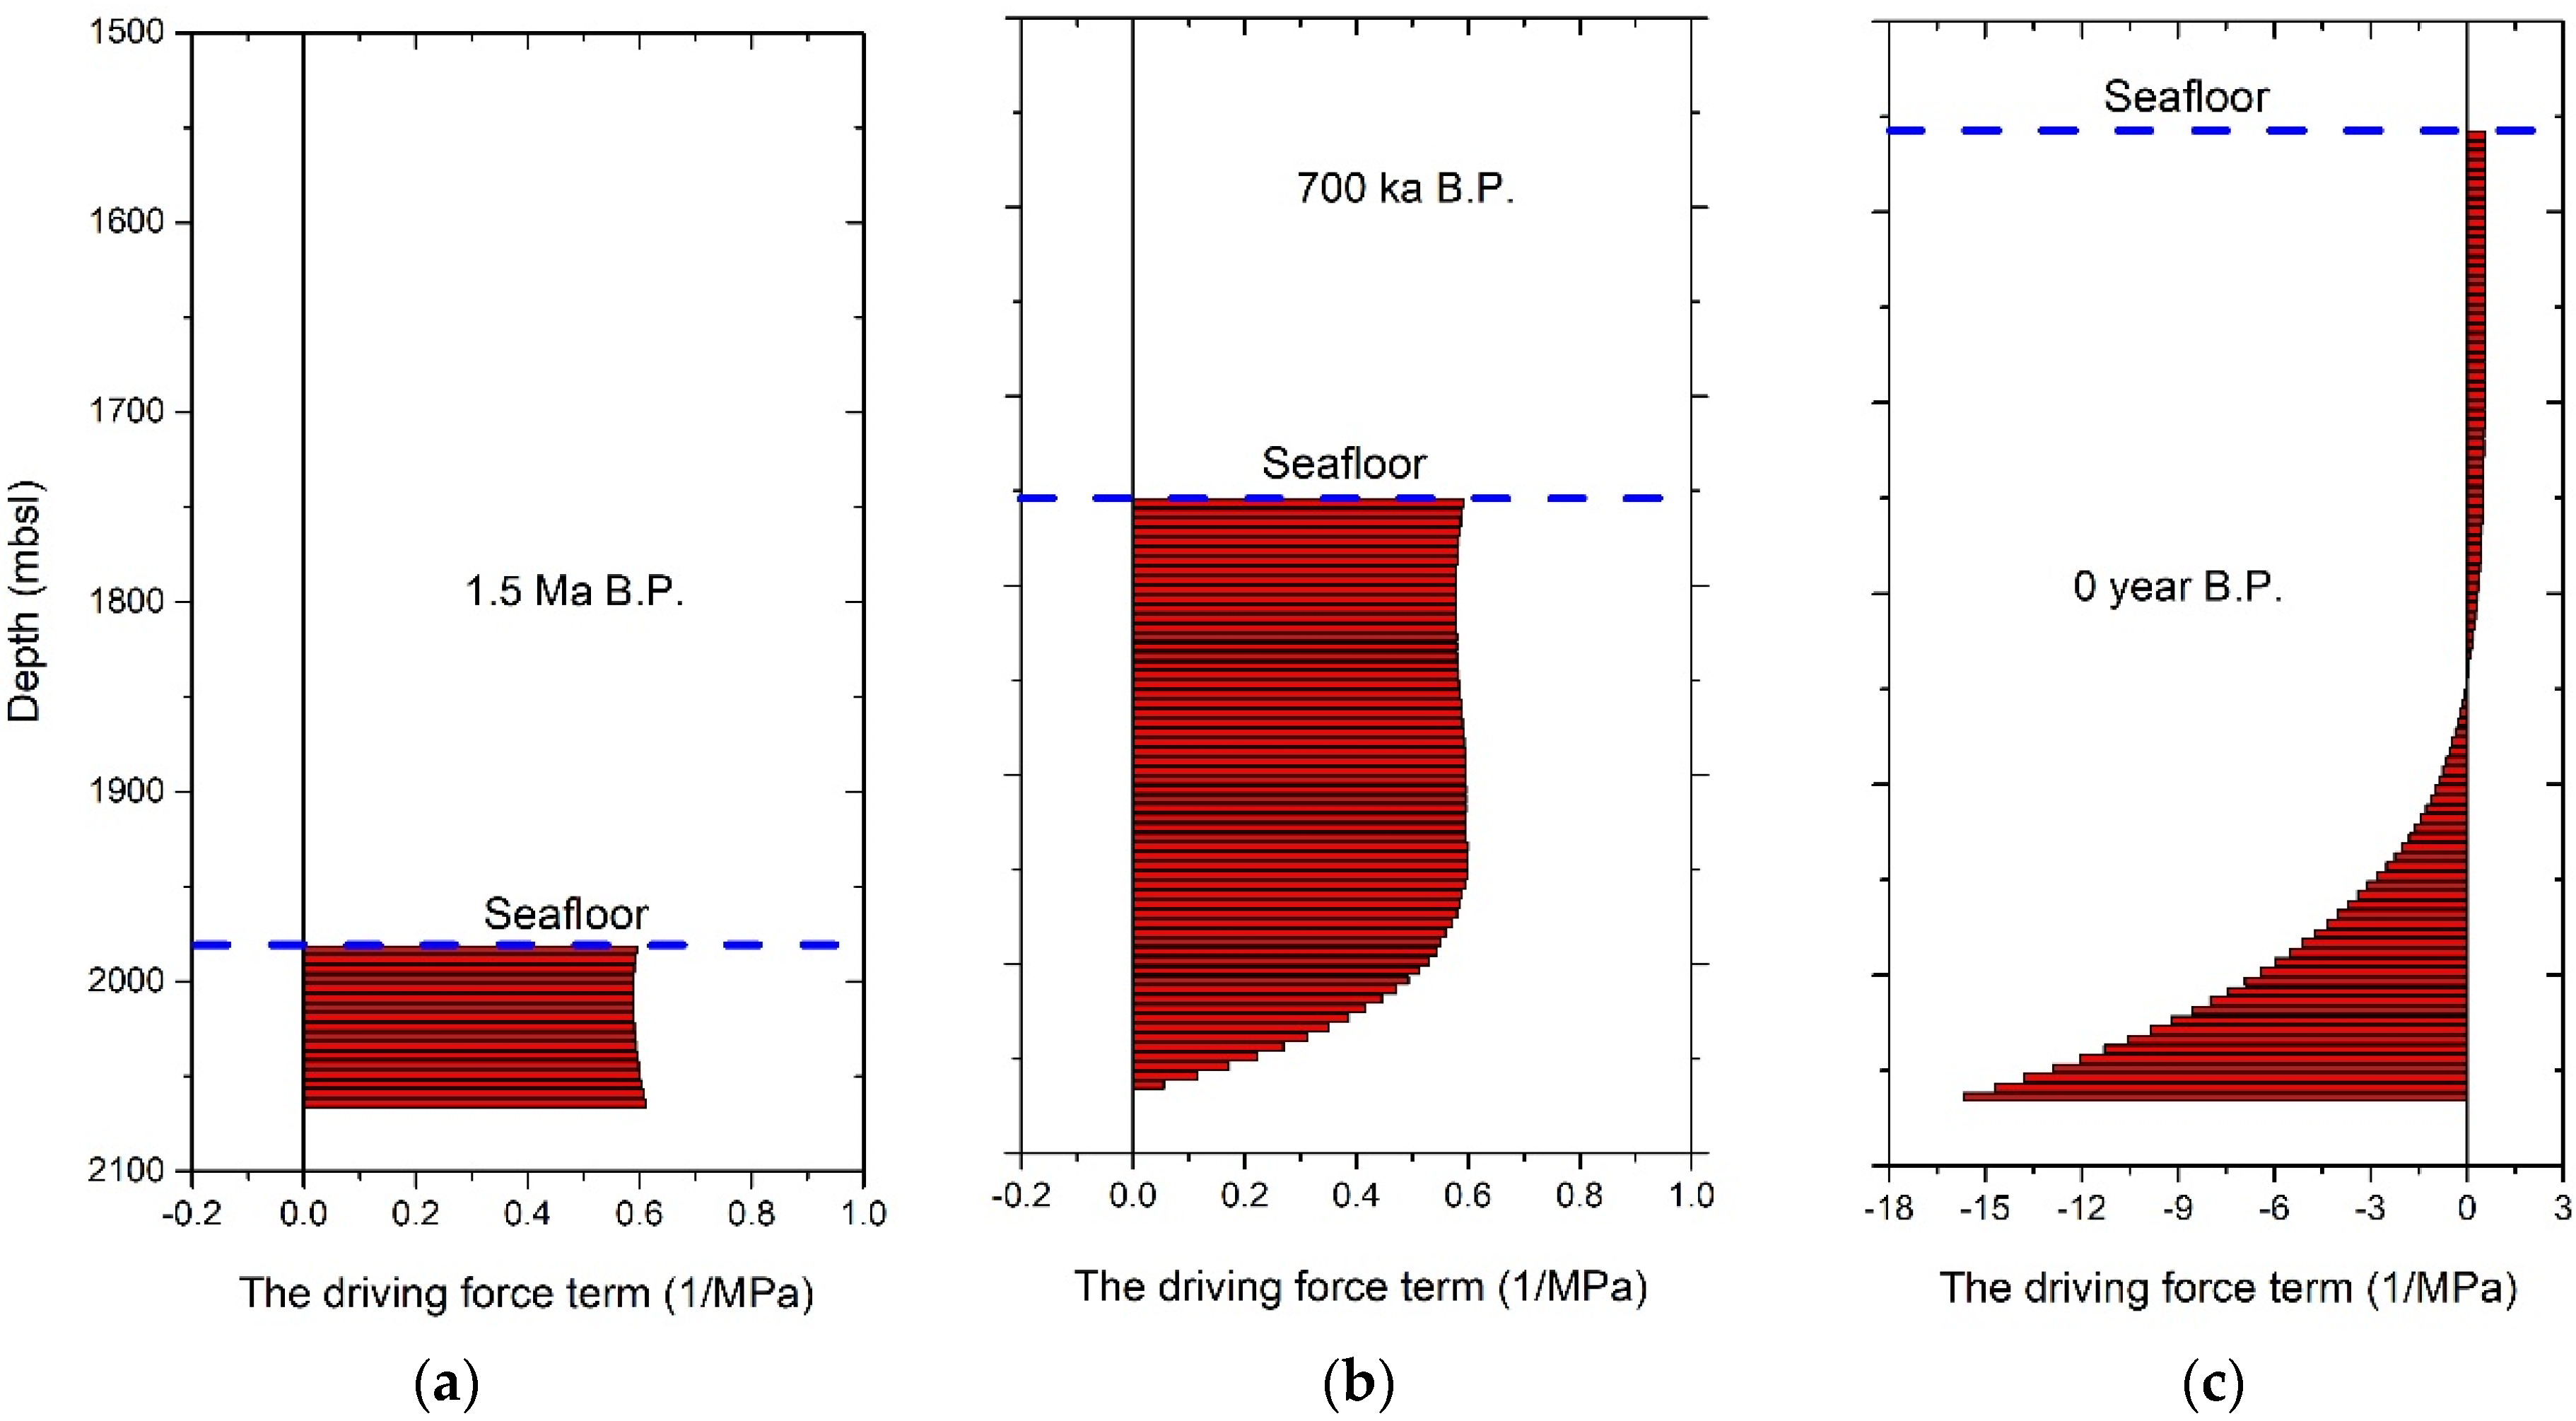
5.1. Different Accumulation Geological Timescale

As mentioned above, the deepest part of the hydrate-bearing layer is found within the Middle Pleistocene sequence from site GMGS2-16. Based on this fact, it is inferred that the MH formation age at this position may have begun 0.44 Ma ago. All of the MH that exists in the Dongsha shallow slope surface seabed is completely located in the deposition debris caused by a high sedimentation rate. This indicates that the evolution history of these layers in this area is probably younger than the time since the Late Pleistocene that we discussed earlier. We set another five different starting reaction times from the long-term to the short-term, including 1 Ma, 500 ka, 100 ka, 50 ka, 20 ka B.P., to compare the MH evolution status of different geological cycles (Figure 15a−e). According to the results, there are two obvious differences. The first is the difference in the MH content. As the reaction geological cycle became shorter and shorter, MH content decreased gradually, and the peak value dropped from 8% of 1 Ma to 0.2% of 20 ka (Figure 15a,e). The second is that the older the geological age, the more the MH accumulation area tended to be in the middle and lower parts of the slope layers, and the younger the geological age, the closer the MH was to the shallow layers in the seabed. For example, when the starting time was 1 Ma, the HSZ bottom boundary was very close to the designed baseline of this study area, where the HSZ upper boundary nearly coincides with the slope seafloor interface at 20 ka.
We used the ratio of the nominal MH resource to the total production of microbial gas to reflect the carbon sequestration capacity of the sedimentary layer in this region. This ratio was calculated using the five different geological timescales and the previous timescale of 1.8 Ma. A comparison of these results indicates that the longer the time runs, the worse the carbon sequestration capacity is. When the starting time is 1.8 Ma B.P., the minimum value among them is 0.8485 × 10⁻⁵. The adaptable timescale that shows the optimal carbon sequestration capacity is at 100−50 ka. At the time of 100 ka, the ratio is 1.3755 × 10⁻⁵, approximately 1.62 times that of the former (Figure 15f).

5.2. Seawater Depth Restriction

Considering the current investigation progress, the scope of the seawater depth in the Dongsha area where hydrate-bearing sediments have been detected can be divided into two discontinuous sections. One part is a shallow water depth range of 650−1150 mbsl, and the other part is a deep water area with a range of 1600−1900 mbsl. We substituted this seawater depth limit into the previously mentioned two-dimensional slope dynamic model, and obtained a very interesting occurrence of the corresponding discontinuous MH distribution, as shown in Figure 16 below. Compared to the continuous extension of MH occurrence in Figure 9, under the limits of the water depth, the maximum MH content in the lower accumulation part is slightly reduced, reaching 8%, and the corresponding pore salinity is about 4.7% at the maximum.

5.3. Gas Source Influence

In the above simulation, we discussed the MH reservoir evolution process from microbial gas sources. With increases in the field survey materials, there is an increasingly comprehensive understanding of GH and the relevant petroleum system in this area. It is now generally recognized that gas of thermogenic origin under deep crust probably migrates upward to the slope shallow surface via channels such as faults, and participates in the enrichment of local MH layers. To better explain this geological phenomenon and compare the corresponding processes of the dynamic formation of MH by thermogenic and microbial gas sources, respectively, we set up five different thermogenic methane fluxes along the deigned baseline from large to small, including 100, 50, 5, 0.5, and 0 kg·m−2·ka−1, where 0 means there is no contribution from thermogenic gas. In this investigation, we still used the slope seafloor position of 1560 mbsl as an example to demonstrate the related change process.
We superimposed different methane fluxes of thermogenic origins to obtain the vertical distribution of the free gas state and MH content at this slope site (Figure 17). When there was no bottom gas flux (=0), there was no free gas accumulation at the bottom of the study area. As this flux increased, the methane content in the bottom pores increased as well. When it was 100 kg·m−2·ka−1, the maximum value of gas content reached 2.13%. These thermogenic gases moving upward continuously accumulate in a range of about 100 m above and below HSZ bottom. At the lower part of the bottom, the methane content increased gradually with a decreasing depth, and the maximum flux triggered the maximum methane content of about 4.11%. Above this bottom boundary is the MH occurrence area, and the gas content decreased gradually as depth decreased. It can be seen that the methane content became nearly 0 from about 1812 mbsl to near the seafloor. From the perspective of MH distribution, the hydrate content reached the highest value of 6.4% at about 1842 mbsf. This thermogenic flux has little effect on MH content change. The reason for this might be that we did not distinguish the MH kinetic reaction constant between the two-phase and three-phase states. It is worth noting that at point A on the seafloor, the methane content already reached 7.69%, which indicates that the unreacted methane in the middle section of the local HSZ was transported to the seabed interface with fluid flow. Obviously, it overflows to the seafloor straight away.

6. Conclusions

The thermal evolution degree of the Dongsha submarine source rock in the Yuehai Formation, Wanshan Formation, and Quaternary strata is relatively low. The organic matter is roughly at the immature or low-mature stage and has not entered the hydrocarbon generation threshold. A large amount of microbial methane produced here flows upward to favorable parts of the shallow slope surface with fluid through open-type faults that extend towards the seafloor and other channels. Under suitable thermodynamic and strata conditions, they will react to construct laminated stratigraphic-diffusive MH reservoirs with widespread distribution. In this dynamic evolution process, weakly consolidated sedimentary muds in the surface seabed are provided by sedimentation, gas generation is catalyzed by organic carbon particles, and gas transportation is determined by fluid migration. We can combine other geohistorical events and tectonic activities to display and verify the evolutionary experience of this diffusive MH system along the shallow surface sediments since the Pleistocene that corresponds with a spatiotemporal perspective.
Through analysis of the simulation results and subsequent discussions, we reproduced the coexisting geological activity of the decomposition of hydrates in the lower part of seabed sediments and the formation of hydrates in the upper part. It was revealed that diffusive MH reservoirs in this area are likely to be produced in comprehensive environments where related factors, including the deposition rate, microbial methane production, TOC content, and SRZ, are all relatively moderate. We further state that the most powerful carbon fixation ability of this diffusion hydrate system is the time range of 100−50 ka B.P. In addition, residual methane is produced that cannot be depleted in the reaction in the middle of the HSZ. It will converge near the seafloor interface and eventually overflow out of the seabed and escape into the seawater. Admittedly, our geological model has some limitations. Although our results show an uneven distribution of MHs within the slope sediments, we did not touch on the typical geomorphic features, for example, slope fans, steep ridges, sediment waves, and landslides on the slope seabed surface. The heterogeneity of the pores and frameworks of the seabed sedimentary layer has not yet been discussed in depth. These shortcomings make it impossible for us to present specific occurrence states and aggregation forms of hydrate-bearing layers, such as the diversity of layered, veined, blocky, or invisible morphologies. This is future work that needs to done in the next stage.

Author Contributions

Conceptualization, S.F. and D.L.; data curation, J.G., Y.L., S.W. and W.Z.; formal analysis, L.W.; funding acquisition, D.L.; methodology, J.G., S.F. and W.Z.; project administration, D.L.; resources, P.S.; software, J.G.; writing—original draft, J.G.; writing—review & editing, J.G. All authors have read and agreed to the published version of the manuscript.

Funding

This work was jointly supported by the Natural Science Foundation of Guangdong Province, China (No. 2020A1515011120, No. 2021A1515011515, and No. 2021A1515010578), Guangdong Province Marine Economic Development (Six Major Marine Industries) Special Fund Project (Guangdong Natural Assets Cooperation [2021] No. 58), and the National Natural Science Foundation of China (No. 52106002, No. 51876211).

Institutional Review Board Statement

Not applicable.

Informed Consent Statement

Not applicable.

Data Availability Statement

Datasets related to this article can be found at: https://data.mendeley.com/datasets/mvx32shsnw/3 (14 February 2022), an open-source online data repository. The codes in this article are permitted for noncommercial or academic use, sharing, adaptation, distribution, and reproduction, and credit to the original authors is appreciated.

Acknowledgments

Due to his helpful suggestions, thanks are extended to David E. Archer (Department of Geophysics, University of Chicago, Chicago, USA, [email protected]).

Conflicts of Interest

The authors declare no conflict of interest.

List of Notations

Cdintegrated drag coefficient
CK-Cfactor
Cwamethane concentration
Da(Θ) methane diffusion coefficient, m2/s
Dw(Θ) water diffusivity in sediment, m2/s
dsparticle diameter, m
evoid ratio = φ/(1 − φ)
filocal fugacity, subscript i = eq (equilibrium state), MPa
ggravity = 9.8 N/kg
krirelative hydraulic conductivity, subscript i = w (water), and a (gas), and has lateral (x), and vertical (z) two directions
ks0,iintrinsic hydraulic conductivity, subscript i = x (lateral), and z (vertical), m/s; when no i, it represents whole conductivity
kshintrinsic hydraulic conductivity with hydrate existence, m/s
Lsaccumulation thickness, m
Lselayer depth, m
Lwseawater depth, m
Mimolar mass, subscript i = a (methane), and w (water), kg/mol
mparameter related to SWCC curve = 1 − 1/ϖ
Pvertical pressure, MPa
Q h nominal resource, mol/m
qatotal other methane input source, kg·m−2·ka−1
qaoin situ microbial methane generation rate, kg·m−3·ka−1
qwpore water drainage, kg·m−2·ka−1
qwadissolved methane, kg·m−2·ka−1
rireaction rate, subscript i = a (methane), h (hydrate) and w (water), mol·m−3·ka−1
r s ¯ pore size of porous media (in angstroms)
Siphase saturation, subscript i = a (gas), h (hydrate), and w (water)
Sareaarea of study slope, m2
Sspspecific surface = 6/ds = 3/rs, m−1
Tdgeothermal gradient, °C/m
Teqequilibrium temperature, °C
Tsitemperature, subscript i = b (seafloor), and e (sediment), °C
ttime, ka
uipressure, subscript i = a (gas), and w (water), kPa
uscmatric potential, kPa
vspractical deposition rate, cm/ka
vsrreferential deposition rate, cm/ka
Xwispore salinity, subscript i = 0 (initial state)
xcfraction of clay particle volume
zvertical position, m
zBSRZdepth to base of SRZ, m
αparameter related to gas inlet pressure, kPa−1
αBSRZmetabolizable organic carbon at SRZ base, dry weight%
βattenuation coefficient
ζ0kinetic coefficient, mol·m−3·MPa−1·ka−1
ηpcoefficient = 0.8
Θrelating water content
θireal-time volume content, subscript i = h (hydrate), a (air), and w (water)
θirresidual content, subscript i = a (air), and w (water)
θwssaturated water content
ƙparticle compressibility modulus
λreaction rate constant of microbial methanogenesis, s−1
ϖparameter related to pore size distribution of sediment
ρidensity, subscript i = w (water), h (hydrate), and s (grain), kg/m3
σcstatic consolidation stress, MPa
σc0static preconsolidation stress associated with a reference porosity, MPa
ϕ 0 ¯ average porosity without presence of hydrates
ϕ0,iporosity, subscript i = 0 (seafloor), z (depth) and ∞ (infinite); when no i, it represents initial state
ϕh,zporosity at depth z in presence of hydrates
ωsedimentary factor

References

  1. Qin, X.; Lu, J.; Lu, H.; Qiu, H.; Liang, J.; Kang, D.; Zhan, L.; Lu, H.; Kuang, Z. Coexistence of natural gas hydrate, free gas and water in the gas hydrate system in the Shenhu Area, South China Sea. China Geol. 2020, 2, 210–220. [Google Scholar]
  2. Ye, J.; Qin, X.; Xie, W.; Lu, H.; Ma, B.; Qiu, H.; Liang, J.; Lu, J.; Kuang, Z.; Lu, C.; et al. The second natural hydrate production test in the South China Sea. China Geol. 2020, 2, 197–209. [Google Scholar]
  3. Archer, D.E.; Buffett, B.A. A two-dimensional model for the methane cycle in a sedimentary accretionary wedge. Biogeosciences 2012, 9, 3323–3336. [Google Scholar] [CrossRef] [Green Version]
  4. Collett, T.; Bahk, J.; Baker, R.; Boswell, R.; Divins, D.; Frye, M.; Goldberg, D.; Husebo, J.; Koh, C.; Malone, M.; et al. Methane hydrates in nature-current knowledge and challenges. J. Chem. Eng. Data 2015, 60, 319–329. [Google Scholar] [CrossRef]
  5. Koh, C.A.; Sum, A.K.; Sloan, E.D. State of the art: Natural gas hydrates as a natural resource. J. Nat. Gas Sci. Eng. 2012, 8, 132–138. [Google Scholar] [CrossRef]
  6. Boswell, R.; Collett, T.S. Current perspectives on gas hydrate resources. Energy Environ. Sci. 2011, 4, 1206–1215. [Google Scholar] [CrossRef]
  7. Pang, X.; Chen, Z.; Jia, C.; Wang, E.; Shi, H.; Wu, Z.; Hu, T.; Liu, K.; Zhao, Z.; Pang, B.; et al. Evaluation and re-understanding of the global natural gas hydrate resources. Pet. Sci. 2021, 18, 323–338. [Google Scholar] [CrossRef]
  8. Archer, D.; Buffett, B.; Brovkin, V. Ocean methane hydrates as a slow tipping point in the global carbon cycle. Proc. Natl. Acad. Sci. USA 2009, 106, 20596–20601. [Google Scholar] [CrossRef] [Green Version]
  9. Berndt, C.; Feseker, T.; Treude, T.; Krastel, S.; Lirbetrau, V.; Niemann, H.; Bertics, V.J.; Dumke, I.; Dünnbier, K.; Ferrré, B.; et al. Temporal constraints on hydrate-controlled methane seepage off Svalbard. Science 2014, 343, 284–287. [Google Scholar] [CrossRef] [Green Version]
  10. Dickens, G.R. Down the rabbit hole: Toward appropriate discussion of methane release from gas hydrate systems during the Paleocene-Eocene thermal maximum and other past hyperthermal events. Clim. Past 2011, 7, 831–846. [Google Scholar] [CrossRef] [Green Version]
  11. Ruppel, C.D.; Kessler, J.D. The interaction of climate change and methane hydrates. Rev. Geophys. 2017, 55, 126–168. [Google Scholar] [CrossRef]
  12. Bonan, G.B.; Doney, S.C. Climate, ecosystems, and planetary futures: The challenge to predict life in Earth system models. Science 2018, 359, 533. [Google Scholar] [CrossRef] [PubMed] [Green Version]
  13. Feng, D.; Qiu, J.; Hu, Y.; Peckmann, J.; Guan, H.; Tong, H.; Chen, C.; Chen, J.; Gong, S.; Li, N.; et al. Cold seep systems in the South China Sea: An overview. J. Asian Earth Sci. 2018, 168, 3–16. [Google Scholar] [CrossRef]
  14. Karstens, J.; Haflidason, H.; Becker, L.W.M.; Berndt, C.; Rüpke, L.; Planke, S.; Liebetrau, V.; Schmidt, M.; Mienert, J. Glacigenic sedimentation pulses triggered post-glacial gas hydrate dissociation. Nat. Commun. 2018, 9, 635. [Google Scholar] [CrossRef]
  15. Suess, E. Marine cold seeps and their manifestations: Geological control, biogeochemical criteria and environmental conditions. Int. J. Earth Sci. 2014, 103, 1889–1916. [Google Scholar] [CrossRef]
  16. Hu, G.; Bu, Q.; Lyu, W.; Wang, J.; Chen, J.; Li, Q.; Gong, J.; Sun, J.; We, N. A comparative study on natural gas hydrate accumulation models at active and passive continental margins. Nat. Gas Ind. B 2021, 8, 115–127. [Google Scholar] [CrossRef]
  17. Straume, E.O.; Gaina, C.; Medvedev, S.; Hochmuth, K.; Gohl, K.; Whittaker, J.M.; Fattah, R.A.; Doornenbal, J.C.; Hopper, J.R. GlobSed: Updated total sediment thickness in the world’s oceans. Geochem. Geophys. Geosyst. 2019, 20, 1756–1772. [Google Scholar] [CrossRef]
  18. Chatterjee, S.; Bhatnagar, G.; Dugan, B.; Dickens, G.R.; Chapman, W.G.; Hirasaki, G.J. The impact of lithologic heterogeneity and focused fluid flow upon gas hydrate distribution in marine sediment. J. Geophys. Res. Solid Earth 2014, 119, 6705–6732. [Google Scholar] [CrossRef] [Green Version]
  19. Cook, A.E.; Malinverno, A. Short migration of methane into a gas hydrate-bearing sand layer at Walker Ridge, Gulf of Mexico. Geochem. Geophys. Geosyst. 2013, 14, 283–291. [Google Scholar] [CrossRef]
  20. Wei, L.; Cook, A.; Daigle, H.; Malinverno, A.; Nole, M.; You, K. Factors controlling short-range methane migration of gas hydrate accumulations in thin coarse-grained layers. Geochem. Geophys. Geosyst. 2019, 20, 3985–4000. [Google Scholar] [CrossRef]
  21. You, K.; Flemings, P.B.; Malinverno, A.; Collett, T.S.; Darnell, K. Mechanisms of methane hydrate formation in geological systems. Rev. Geophys. 2019, 5, 1146–1196. [Google Scholar] [CrossRef]
  22. Yang, S.; Liang, J.; Lu, J.; Qu, C.; Liu, B. New understandings on characteristic and controlling factors of gas hydrate reservoirs in Shenhu area on northern slope of South China Sea. Earth Sci. Front. 2017, 24, 1–14. (In Chinese) [Google Scholar]
  23. Sun, M.; Ren, J.; Zhong, G.; Yi, H. Fold deformations of mesozoic strata and their genetic mechanism in Southwestern Dongsha waters of northern South China Sea. Geol. Rev. 2018, 64, 828–842. (In Chinese) [Google Scholar]
  24. Wang, X.; Cai, F.; Sun, Z.; Li, Q.; Li, A.; Yan, G.; Sun, Y.; Luo, D.; Dong, F. Sedimentary evolution and geological signification of the Dongsha submarine canyon in the northern South China Sea. Earth Sci. 2021, 46, 1023–1037. (In Chinese) [Google Scholar]
  25. Nole, M.; Daigle, H.; Cook, A.E.; Malinverno, A. Short-range, overpressure-driven methane migration in coarse-grained gas hydrate reservoirs. Geophys. Res. Lett. 2016, 43, 9500–9508. [Google Scholar] [CrossRef]
  26. Stolper, D.A.; Lawson, M.; Davis, C.L.; Ferreira, A.A.; Neto, E.V.S.; Ellis, G.S.; Lewan, M.D.; Martini, A.M.; Tang, Y.; Schoell, M.; et al. Formation temperatures of thermogenic and biogenic methane. Science 2014, 344, 1500–1503. [Google Scholar] [CrossRef]
  27. Tinna, J.; David, A. A stochastic, Lagrangian model of sinking biogenic aggregates in the ocean (SLAMS 1.0): Model formulation, validation and sensitivity. Geosci. Model Dev. 2016, 9, 1455–1476. [Google Scholar]
  28. Li, L.; Lei, X.; Zhang, X.; Sha, Z. Gas hydrate and associated free gas in the Dongsha Area of northern South China Sea. Mar. Pet. Geol. 2013, 39, 92–101. [Google Scholar] [CrossRef]
  29. Li, L.; Liu, H.; Zhang, X.; Lei, H.; Sha, Z. BSRs, estimated heat flow, hydrate-related gas volume and their implications for methane seepage and gas hydrate in the Dongsha region, northern South China Sea. Mar. Pet. Geol. 2015, 67, 785–794. [Google Scholar] [CrossRef] [Green Version]
  30. Jin, J.; Wang, X.; He, M.; Li, J.; Yan, C.; Li, Y.; Zhou, J.; Qian, J. Downward shift of gas hydrate stability zone due to seafloor erosion in the eastern Dongsha Island, South China Sea. J. Oceanol. Limnol. 2020, 38, 1188–1200. [Google Scholar] [CrossRef]
  31. Han, W.; Chen, L.; Liu, C. Distribution and characteristics of gas chimneys in the passive margin offshore SW Taiwan. Mar. Geophys. Res. 2021, 42, 25. [Google Scholar] [CrossRef]
  32. Li, J.; Li, L.; Bai, S.; Ta, K.; Xu, H.; Chen, S.; Pan, J.; Li, M.; Du, M.; Peng, X. New insight into the biogeochemical cycling of methane, S and Fe above the Sulfate-Methane Transition Zone in methane hydrate-bearing sediments: A case study in the Dongsha area, South China Sea. Deep-Sea Res. Part I 2019, 145, 97–108. [Google Scholar] [CrossRef]
  33. Zhang, B.; Pan, M.; Wu, D.; Wu, N. Distribution and isotopic composition of foraminifera at cold-seep Site 973-4 in the Dongsha area, northeastern South China Sea. J. Asian Earth Sci. 2018, 168, 145–154. [Google Scholar] [CrossRef]
  34. Bai, C.; Zhang, G.; Lu, J.; Liang, J.; Yang, Z.; Yan, W.; Zhu, D.; Tian, Y. Deep-water sediment waves as a special gas hydrate reservoirs in the Northeastern South China Sea. Mar. Pet. Geol. 2019, 101, 476–485. [Google Scholar] [CrossRef]
  35. Sha, Z.; Liang, J.; Zhang, G.; Yang, S.; Lu, J.; Zhang, Z.; McConnell, D.R.; Humphret, G. A seepage gas hydrate system in northern South China Sea: Seismic and well log interpretations. Mar. Geol. 2015, 366, 69–78. [Google Scholar] [CrossRef]
  36. Zhang, G.; Liang, J.; Lu, J.; Yang, S.; Zhang, M.; Holland, M.; Schultheiss, P.; Su, X.; Sha, Z.; Xu, H.; et al. Geological features, controlling factors and potential prospects of the gas hydrate occurrence in the east part of the Pearl River Mouth Basin, South China Sea. Mar. Pet. Geol. 2015, 67, 356–367. [Google Scholar] [CrossRef]
  37. Guan, J.; Cong, X.; Archer, D.; Wan, L.; Liang, D. Spatio-temporal evolution of stratigraphic-diffusive methane hydrate reservoirs since the Pliocene along Shenhu continental slope, northern South China Sea. Mar. Pet. Geol. 2021, 125, 104864. [Google Scholar] [CrossRef]
  38. Fu, C.; Yu, X.; Fan, X.; He, Y.; Liang, J.; Li, S. Classification of mass-transport complexes and distribution of gas hydrate-bearing sediments in the northeastern continental slope of the South China Sea. Front. Earth Sci. 2020, 14, 25–36. [Google Scholar] [CrossRef]
  39. Gong, C.; Wang, Y.; Xu, S.; Pickering, K.T.; Peng, X.; Li, W.; Yan, Q. The northeastern South China Sea margin created by the combined action of down-slope and along-slope processes: Processes, products and implications for exploration and paleoceanography. Mar. Pet. Geol. 2015, 64, 233–249. [Google Scholar] [CrossRef]
  40. Li, W.; Alves, T.M.; Wu, S.; Rebesco, M.; Zhao, F.; Mi, L.; Ma, B. A giant, submarine creep zone as a precursor of large-scale slope instability offshore the Dongsha Islands (South China Sea). Earth Planet. Sci. Lett. 2016, 451, 272–284. [Google Scholar] [CrossRef]
  41. Liu, B.; Chen, J.; Pinheiro, L.M.; Yang, L.; Liu, S.; Guan, Y.; Song, H.; Wu, N.; Xu, H.; Yang, R. An insight into shallow gas hydrates in the Dongsha area, South China Sea. Acta Oceanol. Sin. 2021, 40, 136–146. [Google Scholar] [CrossRef]
  42. Wang, J.; Wu, S.; Sun, J.; Feng, W.; Li, Q. Influence of seafloor topography on gas hydrate occurrence across a submarine canyon-incised continental slope in the northern margin of the South China Sea. Mar. Pet. Geol. 2021, 133, 105279. [Google Scholar] [CrossRef]
  43. Chuang, P.; Yang, T.F.; Wallmann, K.; Matsumuto, R.; Hu, C.; Chen, H.; Lin, S.; Sun, C.; Li, H.; Wang, Y.; et al. Carbon isotope exchange during anaerobic oxidation of methane (AOM) in sediments of the northeastern South China Sea. Geochim. Cosmochim. Acta 2019, 246, 138–155. [Google Scholar] [CrossRef]
  44. Ye, H.; Yang, T.; Zhu, G.; Jiang, S.; Wu, L. Pore water geochemistry in shallow sediments from the northeastern continental slope of the South China Sea. Mar. Pet. Geol. 2016, 75, 68–82. [Google Scholar] [CrossRef]
  45. Zhong, G.; Liang, J.; Guo, Y.; Kuang, Z.; Su, P.; Lin, L. Integrated core-log facies analysis and depositional model of the gas hydrate-bearing sediments in the northeastern continental slope, South China Sea. Mar. Pet. Geol. 2017, 86, 1159–1172. [Google Scholar] [CrossRef]
  46. Cui, H.; Su, X.; Liang, J.; Chen, F.; Holland, M.; Yang, S.; Zhang, G.; Su, P.; Dong, H. Microbial diversity in fracture and pore filling gas hydrate-bearing sediments at Site GMGS2-16 in the Pearl River Mouth Basin, the South China Sea. Mar. Geol. 2020, 427, 106264. [Google Scholar] [CrossRef]
  47. Wang, B.; Lei, H.; Huang, F.; Kong, Y.; Pan, F.; Cheng, W.; Chen, Y.; Guo, L. Effect of sea-level change on deep-sea sedimentary records in the northeastern South China Sea over the past 42 kyr. Geofluids 2020, 2020, 814545. [Google Scholar] [CrossRef]
  48. Li, W.; Alves, T.M.; Wu, S.; Volker, D.; Zhao, F.; Mi, L.; Kopf, A. Recurrent slope failure and submarine channel incision as key factors controlling reservoir potential in the South China Sea (Qiongdongnan Basin, South Hainan Island). Mar. Pet. Geol. 2015, 64, 17–30. [Google Scholar] [CrossRef]
  49. Klauda, J.B.; Sandler, S.I. Global distribution of methane hydrate in ocean sediment. Energy Fuels 2005, 19, 459–470. [Google Scholar] [CrossRef]
  50. Nikolinakou, M.A.; Heidari, M.; Flemings, P.B.; Hudec, M.R. Geomechanical modeling of pore pressure in evolving salt systems. Mar. Pet. Geol. 2018, 93, 272–286. [Google Scholar] [CrossRef]
  51. Waal, H.D.; Smits, R.M.M. Prediction of reservoir compaction and surface subsidence: Field application of a new model. SPE Form. Eval. 1988, 3, 347–356. [Google Scholar] [CrossRef]
  52. Elhakim, A.F. Estimation of soil permeability. Alex. Eng. J. 2016, 55, 2631–2638. [Google Scholar] [CrossRef] [Green Version]
  53. Steiakakis, E.; Gamvroudis, C.; Alevizos, G. Kozeny-Carman equation and hydraulic conductivity of compacted clayey soils. Geomaterials 2012, 2, 37–41. [Google Scholar] [CrossRef] [Green Version]
  54. Cassiani, G.; Brovelli, A.; Hueckel, T. A strain-rate-dependent modified Cam-Clay model for the simulation of soil/rock compaction. Geomech. Energy Environ. 2017, 11, 42–51. [Google Scholar] [CrossRef]
  55. Fredlund, D.G.; Xing, A.; Huang, S. Predicting the permeability function for unsaturated soils using the soil-water characteristic curve. Can. Geotech. J. 1994, 31, 533–546. [Google Scholar] [CrossRef]
  56. Malinverno, A. Marine gas hydrates in thin sand layers that soak up microbial methane. Earth Planet. Sci. Lett. 2010, 292, 399–408. [Google Scholar] [CrossRef]
  57. Archer, D.E.; Buffett, B.A.; McGuire, P.C. A two-dimensional model of the passive coastal margin deep sedimentary carbon and methane cycles. Biogeosciences 2012, 9, 2859–2878. [Google Scholar] [CrossRef] [Green Version]
  58. Burwicz, E.B.; Rupke, L.H.; Wallmann, K. Estimation of the global amount of submarine gas hydrates formed via microbial methane formation based on numerical reaction-transport modeling and a novel parameterization of Holocene sedimentation. Geochim. Cosmochim. Acta 2011, 75, 4562–4576. [Google Scholar] [CrossRef] [Green Version]
  59. Colin, F.; Ker, S.; Riboulot, V.; Sultan, N. Irregular BSR: Evidence of an ongoing reequilibrium of a gas hydrate system. Geophys. Res. Lett. 2020, 47, e2020GL089906. [Google Scholar] [CrossRef]
  60. Eymold, W.K.; Frederick, J.M.; Nole, M.; Phrampus, B.J.; Wood, W.T. Prediction of gas hydrate formation at Blake Ridge using machine learning and probabilistic reservoir simulation. Geochem. Geophys. Geosyst. 2021, 22, e2020GC009574. [Google Scholar] [CrossRef]
  61. Guan, J.; Wan, L.; Liang, D. Gauging formation dynamics of structural-seepage methane hydrate reservoirs in Shenhu area of northern South China Sea: Impact of seafloor sedimentation and assessment of controlling factors. Mar. Pet. Geol. 2019, 107, 185–197. [Google Scholar] [CrossRef]
  62. Zheng, Z.; Cao, Y.; Xu, W.; Chen, D. A numerical model to estimate the effects of variable sedimentation rates on methane hydrate formation-Application to the ODP Site 997 on Blake ridge, southeastern North American continental margin. J. Geophys. Res. Solid Earth 2020, 125, e2019JB018851. [Google Scholar] [CrossRef]
  63. Farthing, M.; Ogden, F.L. Numerical solution of Richard’s equation: A review of advances and challenges. Soil Sci. Soc. Am. J. 2017, 81, 1257–1269. [Google Scholar] [CrossRef] [Green Version]
  64. Freeze, R.A. Three-dimensional, transient, saturated-unsaturated flow in a groundwater basin. Water Resour. Res. 1971, 7, 347–366. [Google Scholar] [CrossRef] [Green Version]
  65. Hopmans, J.W.; Schukking, H.; Torfs, P.J.J.F. Two-dimensional steady state unsaturated water flow in heterogeneous soils with autocorrelated soil hydraulic properties. Water Resour. Res. 1988, 24, 200–2017. [Google Scholar] [CrossRef]
  66. Murphy, Z.W.; DiCarlo, D.A.; Flemings, P.B.; Daigle, H. Hydrate is a nonwetting phase in porous media. Geophys. Res. Lett. 2020, 47, e2020GL089289. [Google Scholar] [CrossRef]
  67. Nielsen, D.R.; Genuchten, M.T.; Biggar, J.W. Water flow and solute transport processes in the unsaturated zone. Water Resour. Res. 1986, 22, 89S–108S. [Google Scholar] [CrossRef]
  68. Liang, Q.; Zhao, J.; Xia, Z.; Yang, S.; Kang, J.; Lin, J.; Lei, Z.; Deng, Y.; Teng, D. Distribution characteristics and influential factors of dissolved methane in the sea water above gas hydrate area at the northern slope of South China Sea. Earth Sci. Front. 2017, 24, 89–101. (In Chinese) [Google Scholar] [CrossRef]
Figure 1. Schematic illustration showing how stratigraphic-diffusive GHs are generated during the deposition process within the slope surface seabed. At the start, the research area above the designated slope baseline is fully occupied by seawater, and there are no sediments, which means the initial porosity ϕ0w is 100%. In this work, ϕ0w was specifically set as 0 in order to create a strong contrast effect with the status when the sediments were accumulating (a). With constant deposition, sinking debris piles up to form seafloor sediments. It is composed of sediment grains (1 − ϕ), and pore space (ϕ), which ordinarily contains different saturated pore waters (Sw, including dissolved gas), GH (Sh) produced by organic carbons, and free gas (Sa) (b). In the end, the initial seawater is replaced by sediments. Gas in the pores is depleted and GH accumulates to create reservoirs (c).
Jmse 10 00434 g001
Figure 2. Seabed topography and landforms of research area towards abyss in this work. (a) The location of Dongsha area in northeastern SCS where GMGS2 and 973 field investigations have been carried out; (b) local bathymetric contour.
Jmse 10 00434 g002aJmse 10 00434 g002b
Figure 3. Comprehensive geological information in our model. (a) Composite columnar of the Dongsha area, including the tectonic sequence classification scheme since the Late Miocene. (b) Three latest sequences corresponding to the above chart (a). Red arrow line in Figure 2a within part of shallow slope surface identified through seismic profile, which generally produces GH layers, is shown on left side; right side is calculated slope angle variation.
Jmse 10 00434 g003
Figure 4. The geological environment in Dongsha area for MH existence. (a) Deposition rate in corresponding geological time, and (b,c) tested TOC concentrations in this area.
Jmse 10 00434 g004aJmse 10 00434 g004b
Figure 5. The slope crest and foot position over time since 1.8 Ma (a), and corresponding drainage flux (b).
Jmse 10 00434 g005
Figure 6. Local microbial methane generation. (a) Microbial methane production accompanying deposition in Case 0. (b) The final vertical distribution of microbial methane production rate in four designed geological scenarios.
Jmse 10 00434 g006
Figure 7. Changes in local porosity in the three typical scenarios of 1.5 Ma B.P. (a), 700 ka B.P. (c), and present (e), and corresponding temperature changes (b,d,f).
Jmse 10 00434 g007aJmse 10 00434 g007b
Figure 8. Changes in local pore pressure in the three selected scenarios of 1.5 Ma B.P. (a), 700 ka B.P. (c), and present (e), and corresponding gas solubility changes (b,d,f).
Jmse 10 00434 g008aJmse 10 00434 g008b
Figure 9. Evolution of MH reservoir in the three typical scenarios of 1.5 Ma B.P. (a), 700 ka B.P. (c), and present (e), and corresponding pore salinity changes (b,d,f).
Jmse 10 00434 g009aJmse 10 00434 g009b
Figure 10. Peak irregularity of MH content distribution along Dongsha continental slope area.
Jmse 10 00434 g010
Figure 11. MH reaction term, rh0, appears at current slope location 1560 mbsl at the time points 1.5 Ma (a), 700 ka B.P. (b), and present (c), separately.
Jmse 10 00434 g011
Figure 12. The reaction term, rh/ζ0, evolves over time at six selected slope locations.
Jmse 10 00434 g012
Figure 13. MH existence in four representative geological scenarios.
Jmse 10 00434 g013
Figure 14. Nominal MH resource comparison among the four geological cases.
Jmse 10 00434 g014
Figure 15. Current occurrence of MH sediments along Dongsha slope surface from different starting times, including 1 Ma (a), 500 (b), 100 (c), 50 (d), 20 (e) and ka B.P. (f), and corresponding carbon ratios (f).
Jmse 10 00434 g015aJmse 10 00434 g015b
Figure 16. Appearance of MH (a) and salinity (b) from simulations by seafloor depth limits.
Jmse 10 00434 g016
Figure 17. Vertical distribution of the gas and MH content caused by five different thermogenic gas fluxes.
Jmse 10 00434 g017
Table 1. Four designed geological scenarios for microbial methane generation that may occur in Dongsha area.
Slope Geological CaseSedimentary Rate (cm/ka)Rate Constant of Microbial Gas (1/s)Concentration of Total Labile Organic Carbon (Dry Weight %)Depth of SRZ Bottom
(mbsf)
Coefficient of MH Reaction
(mol·m−3·MPa−1·ka−1)
Geothermal Gradient
(°C/km)
Case 02810−130.610155
Case 18010−121.16170
Case 2400.5 × 10−121.8120.140
Case 3100.2 × 10−120.2300.550
Table 2. Parameters used for deducing the basic scenario of stratigraphic-diffusive MH in Dongsha slope area.
ParametersValues
Slope horizontal distance: total, first, second25, 10, 15 (km)
Slope seafloor position: crest, middle, foot500, 1400, 2200 (mbsl)
Slope deposition thickness504 (m)
Total evolution time1.8 (Ma)
Density (kg/m3): ρs, ρw, ρa0, ρh,2650, 1025, 0.7 (STP), 912
Porosity: ϕ0,0, ϕ0,∞0.68, 0.31
Attenuation coefficient: β0.12
Fraction of clay particle volume: xc0.3
Volumetric content: θws, θwr, θar1, 0.08, 0
SWCC coefficients: α, ϖ1/6.11 (1/MPa), 1.332
Molar mass: Mw, Mm, Mh18, 16, 124 (g/mol)
Initial salinity: X w s 0.035
Diffusivity: Dw(Θ), Da(Θ)3.3 × 10⁻⁷, 2.2 × 10⁻⁹ (m2/s)
Publisher’s Note: MDPI stays neutral with regard to jurisdictional claims in published maps and institutional affiliations.

