
Precipitation and Temperature Trends and Cycles Derived from Historical 1890–2019 Weather Data for the City of Ottawa, Ontario, Canada

Abstract
1. Introduction
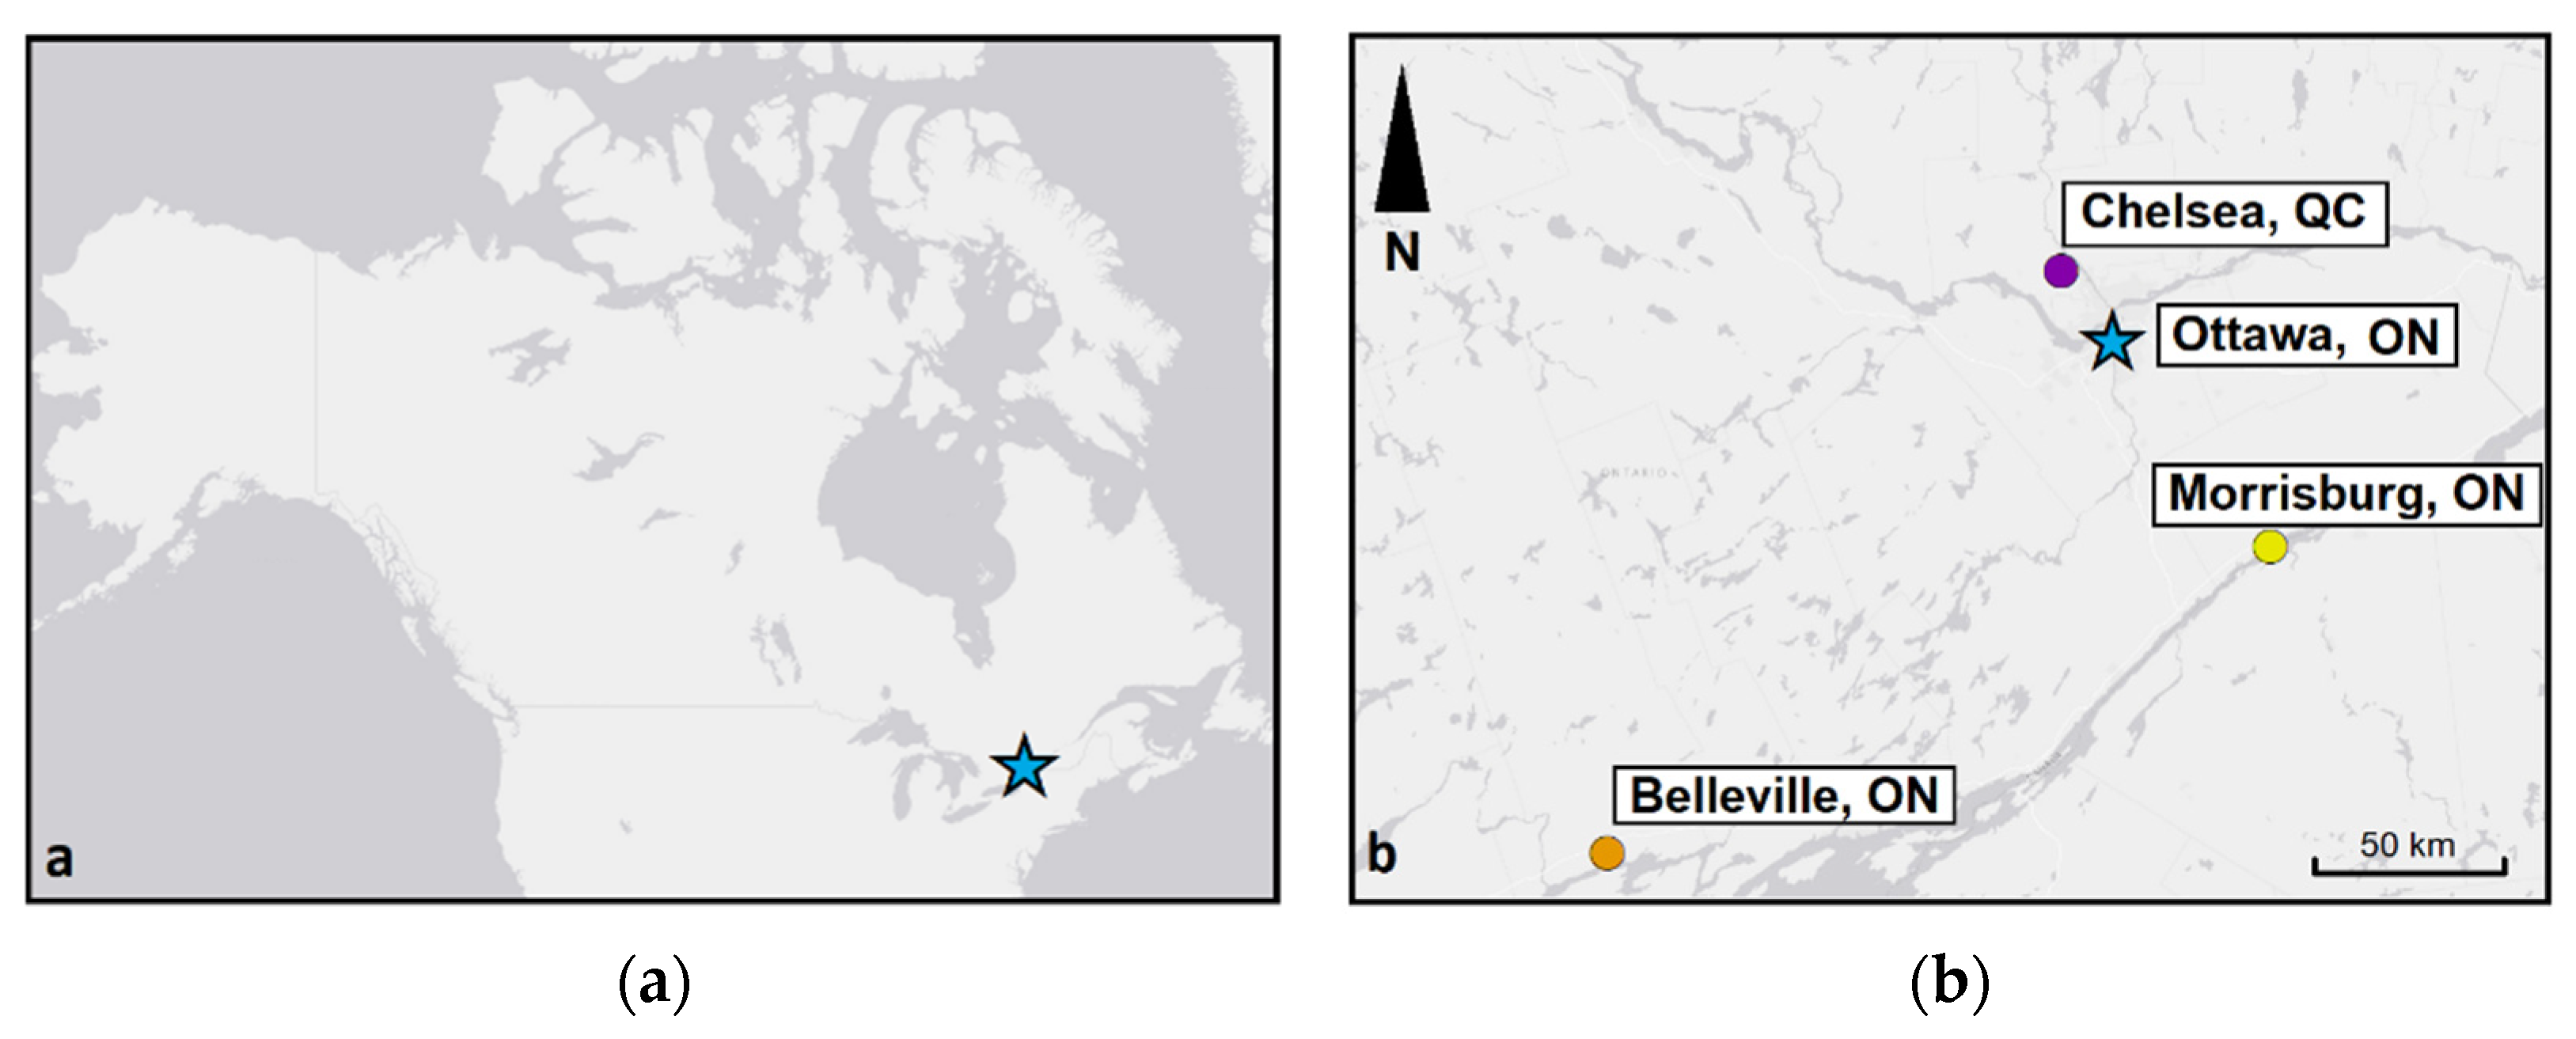
2. Climatic Setting
3. Methods
4. Results
4.1. Long-Term Climate Changes
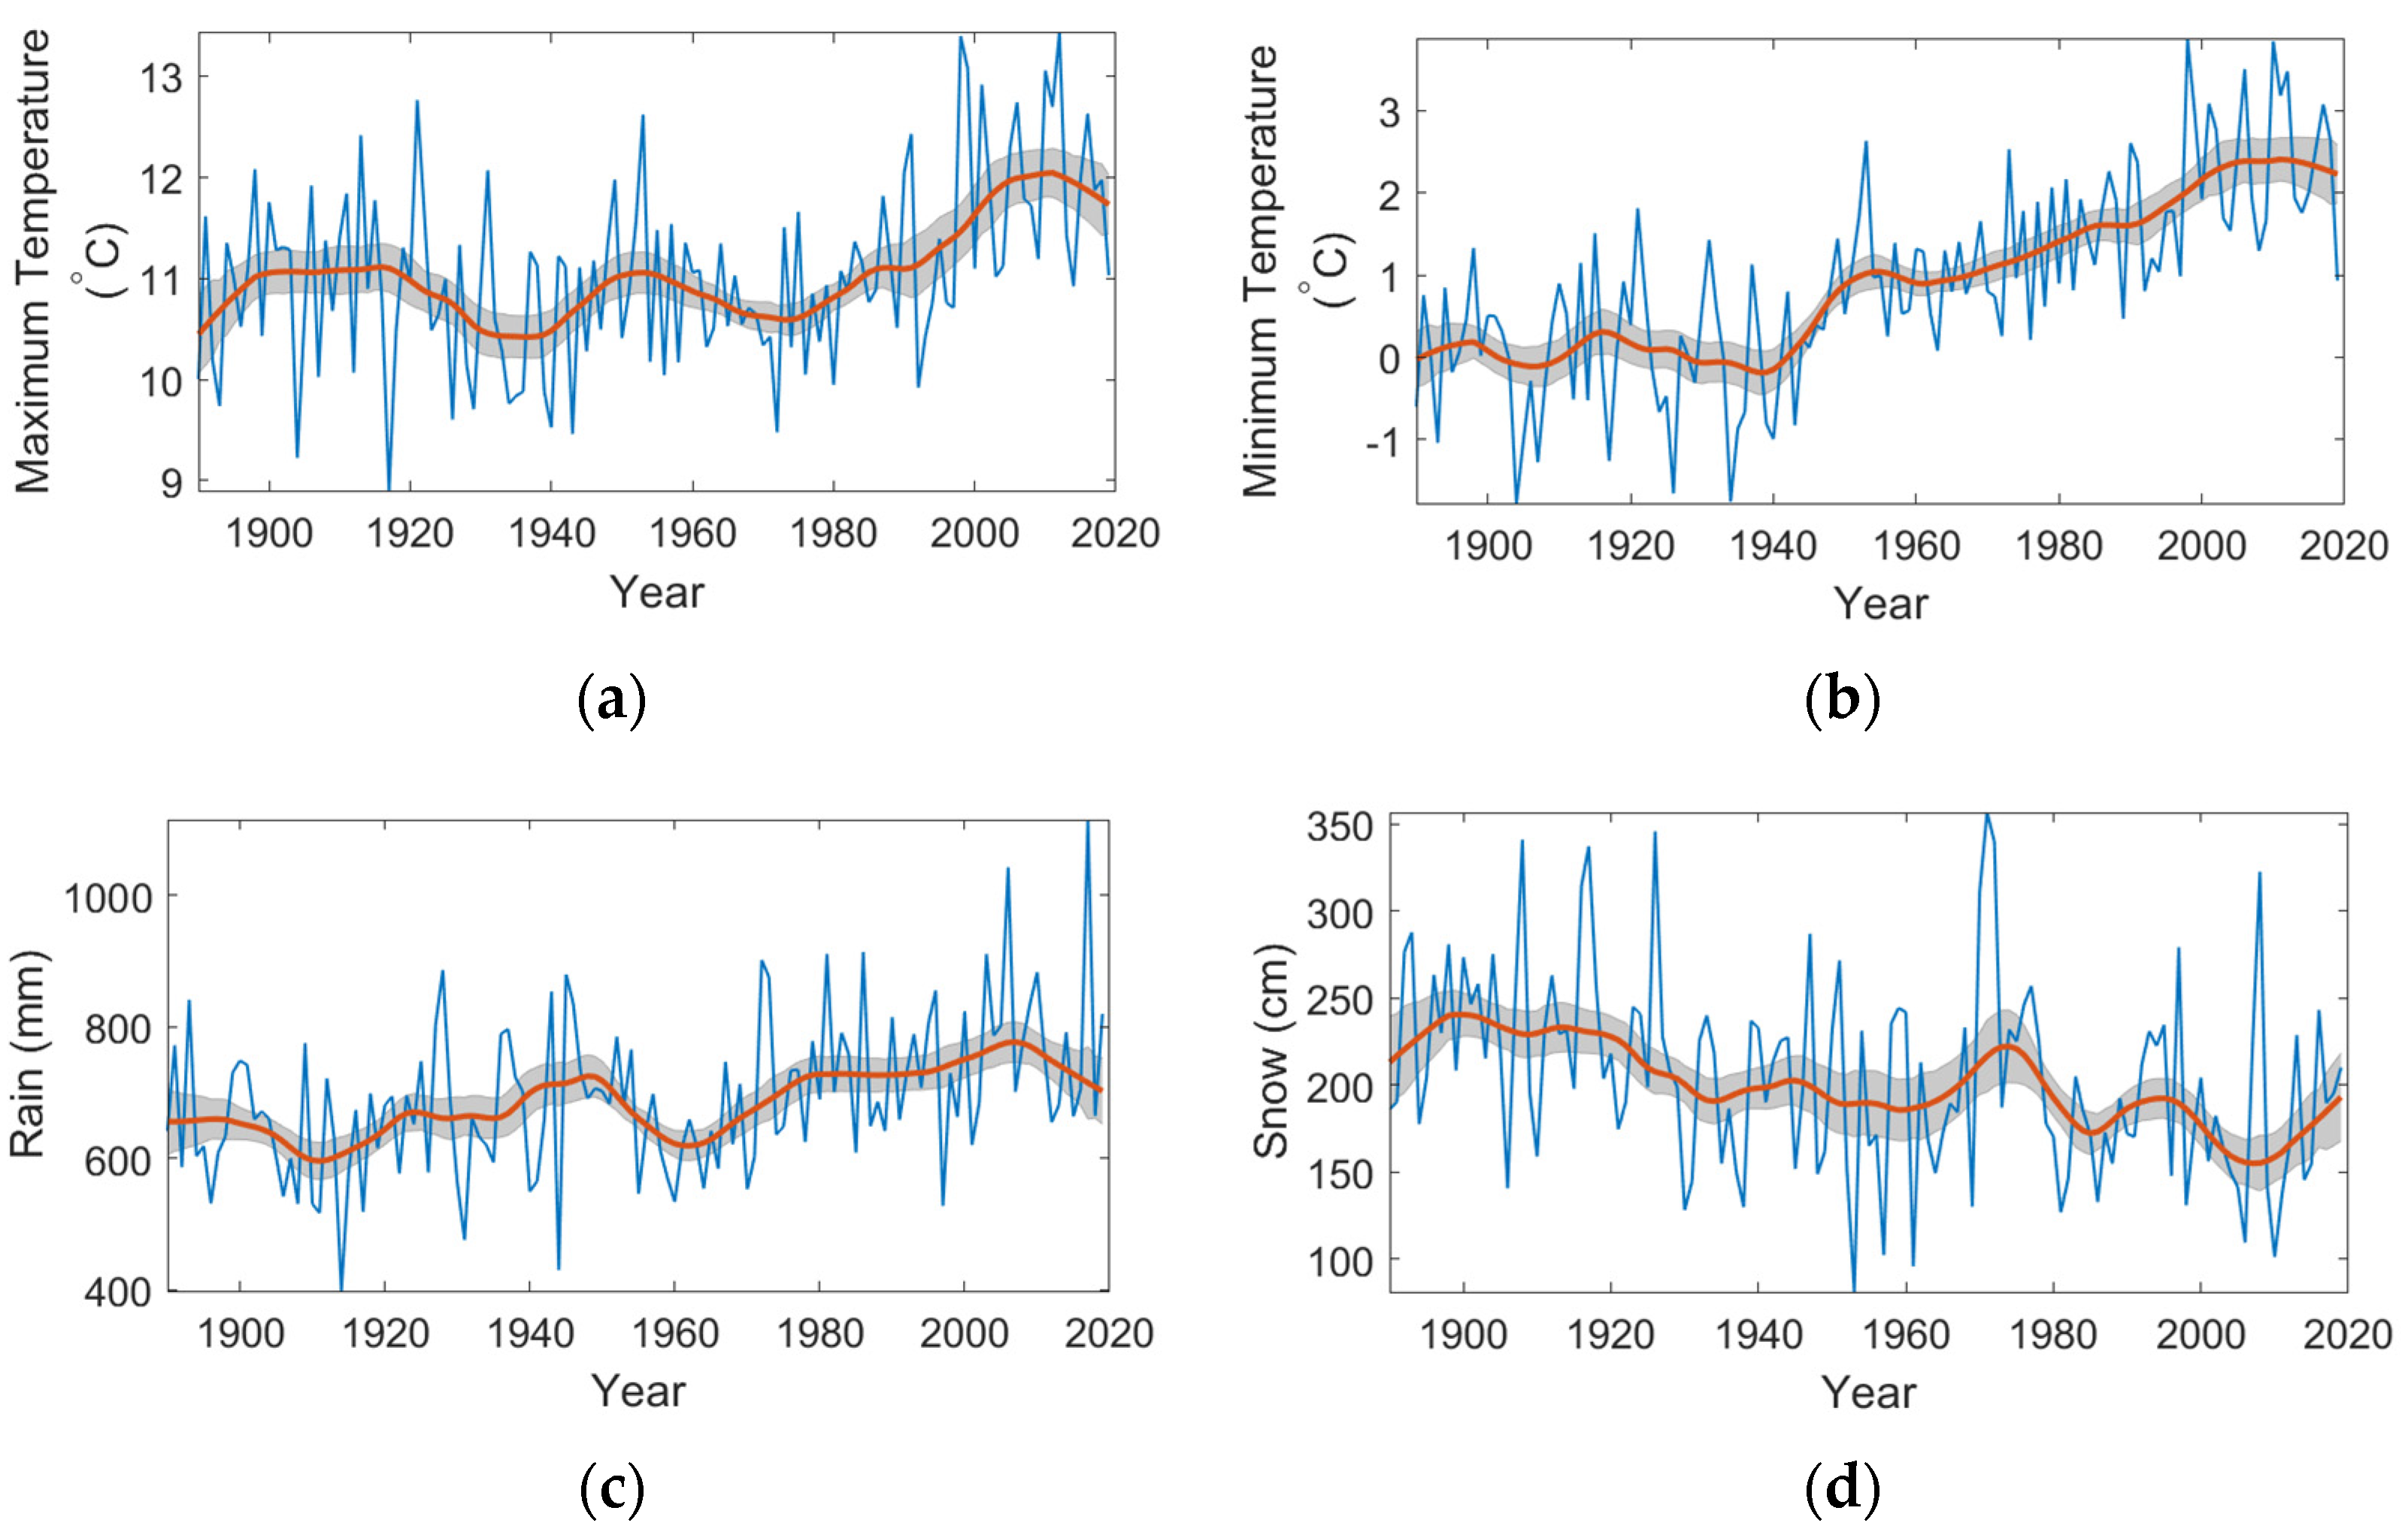
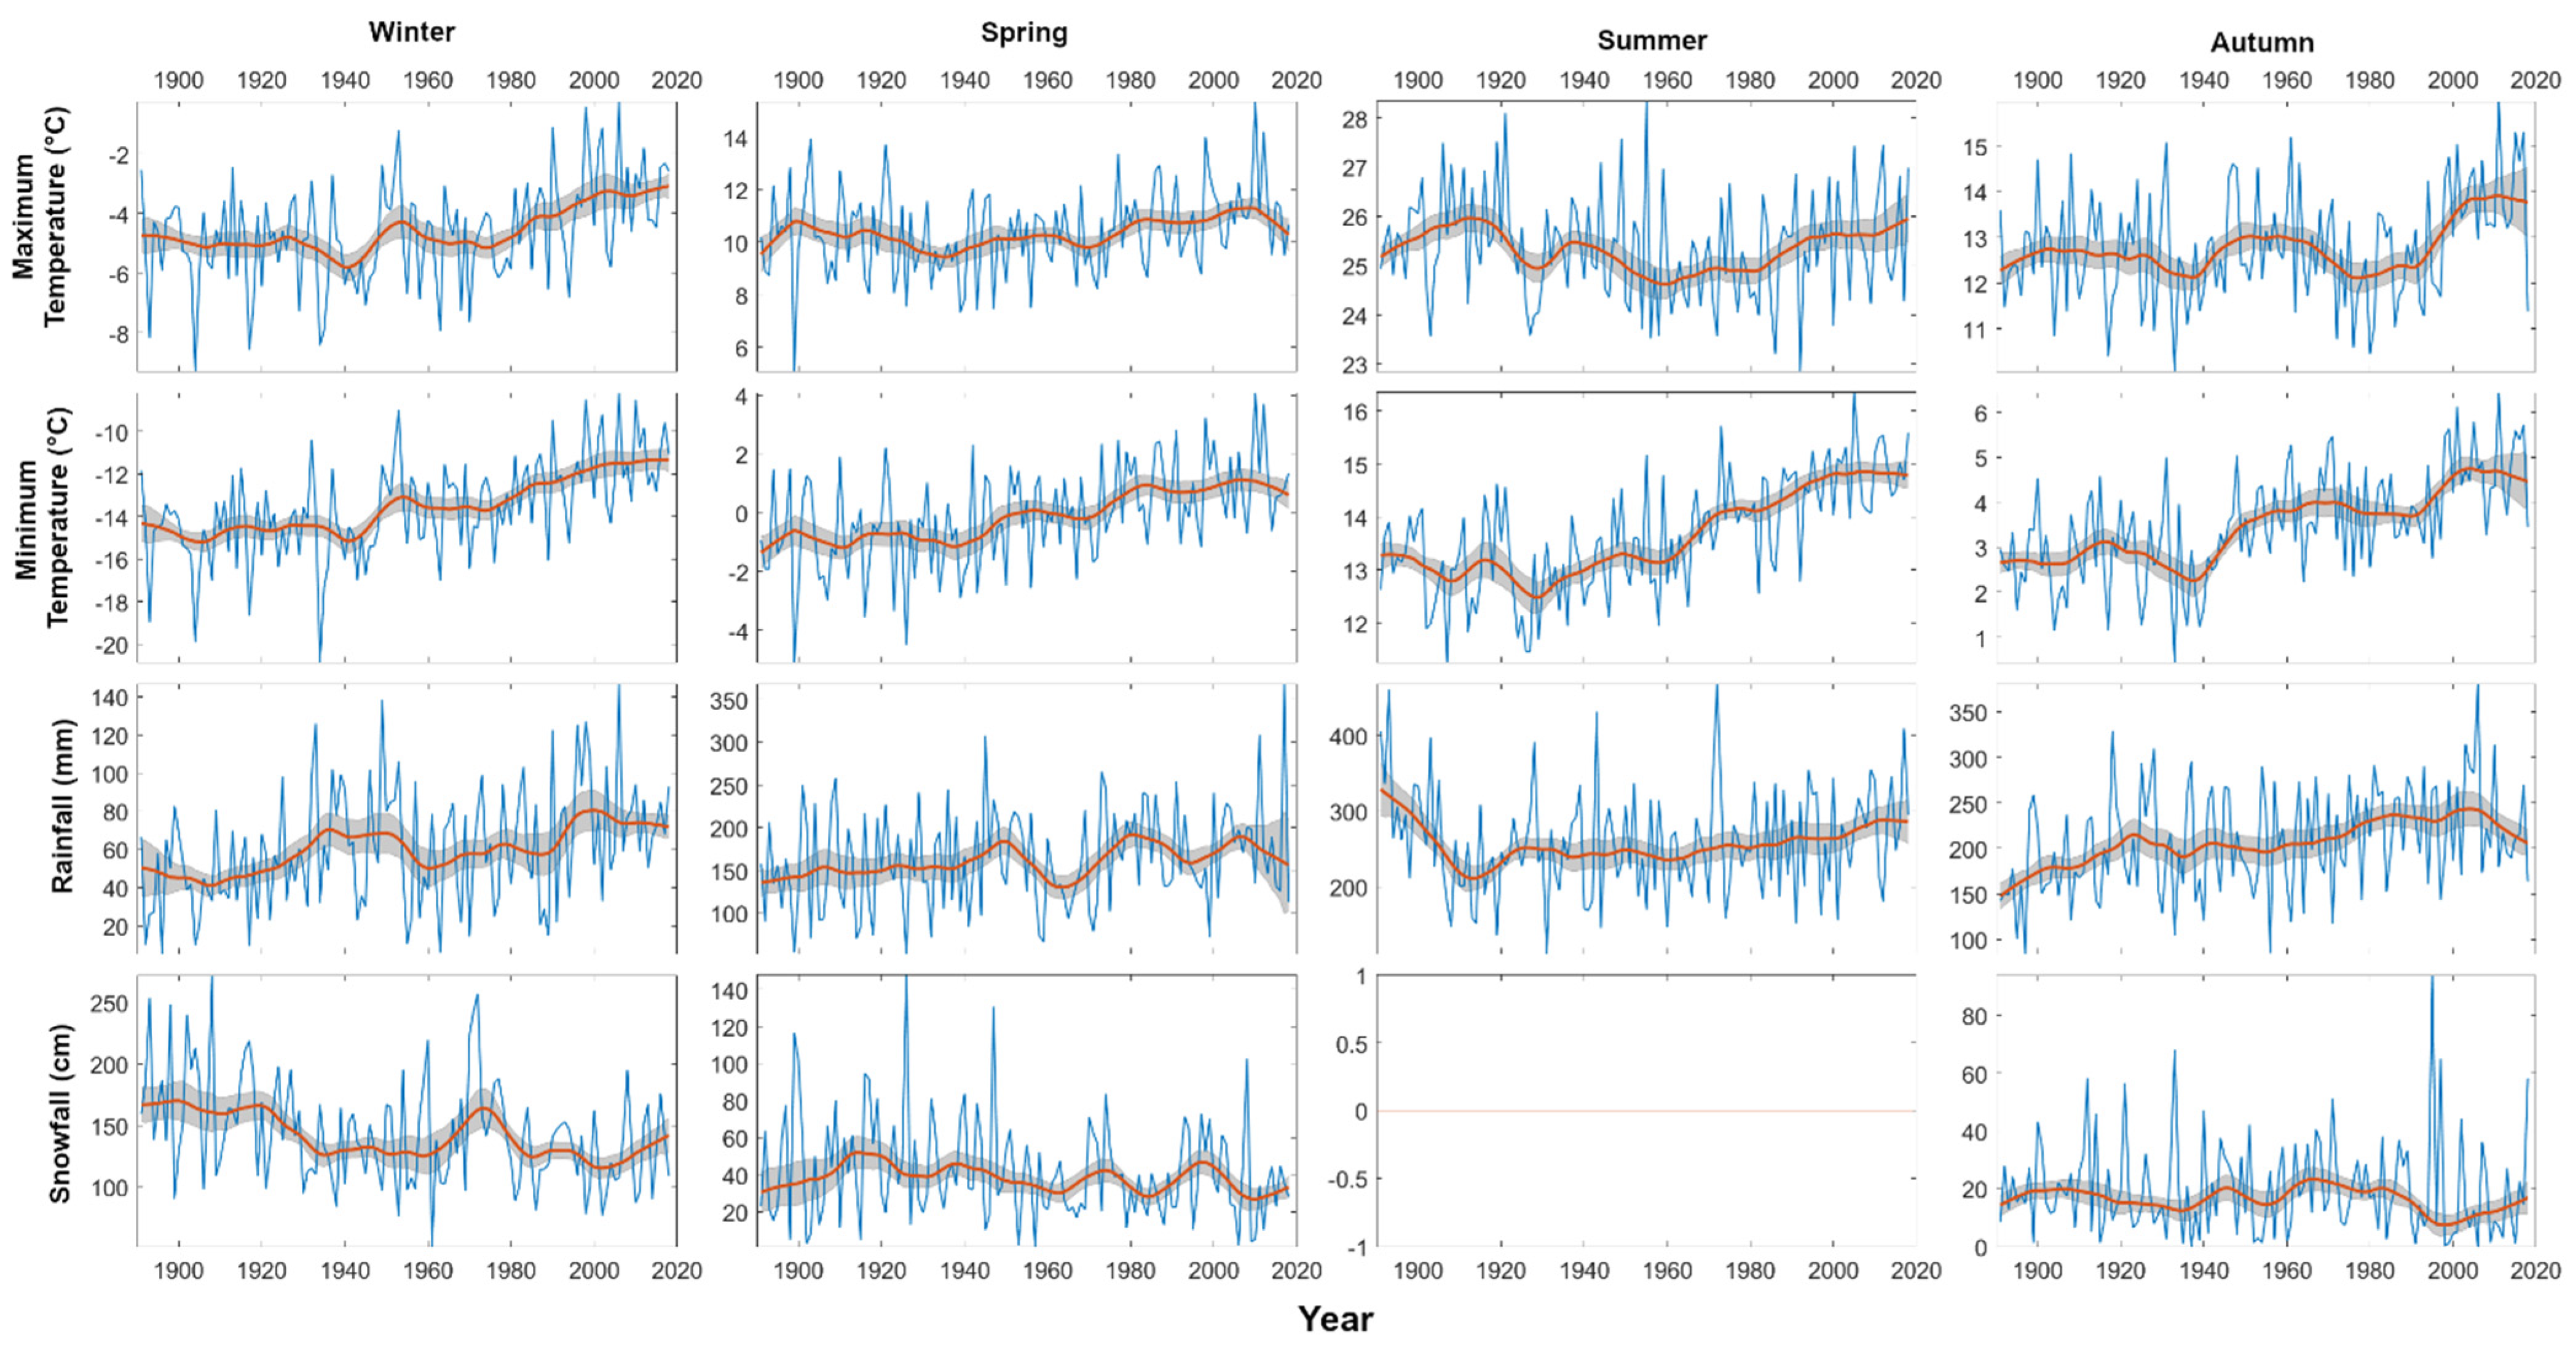
4.1.1. Temperature and Precipitation
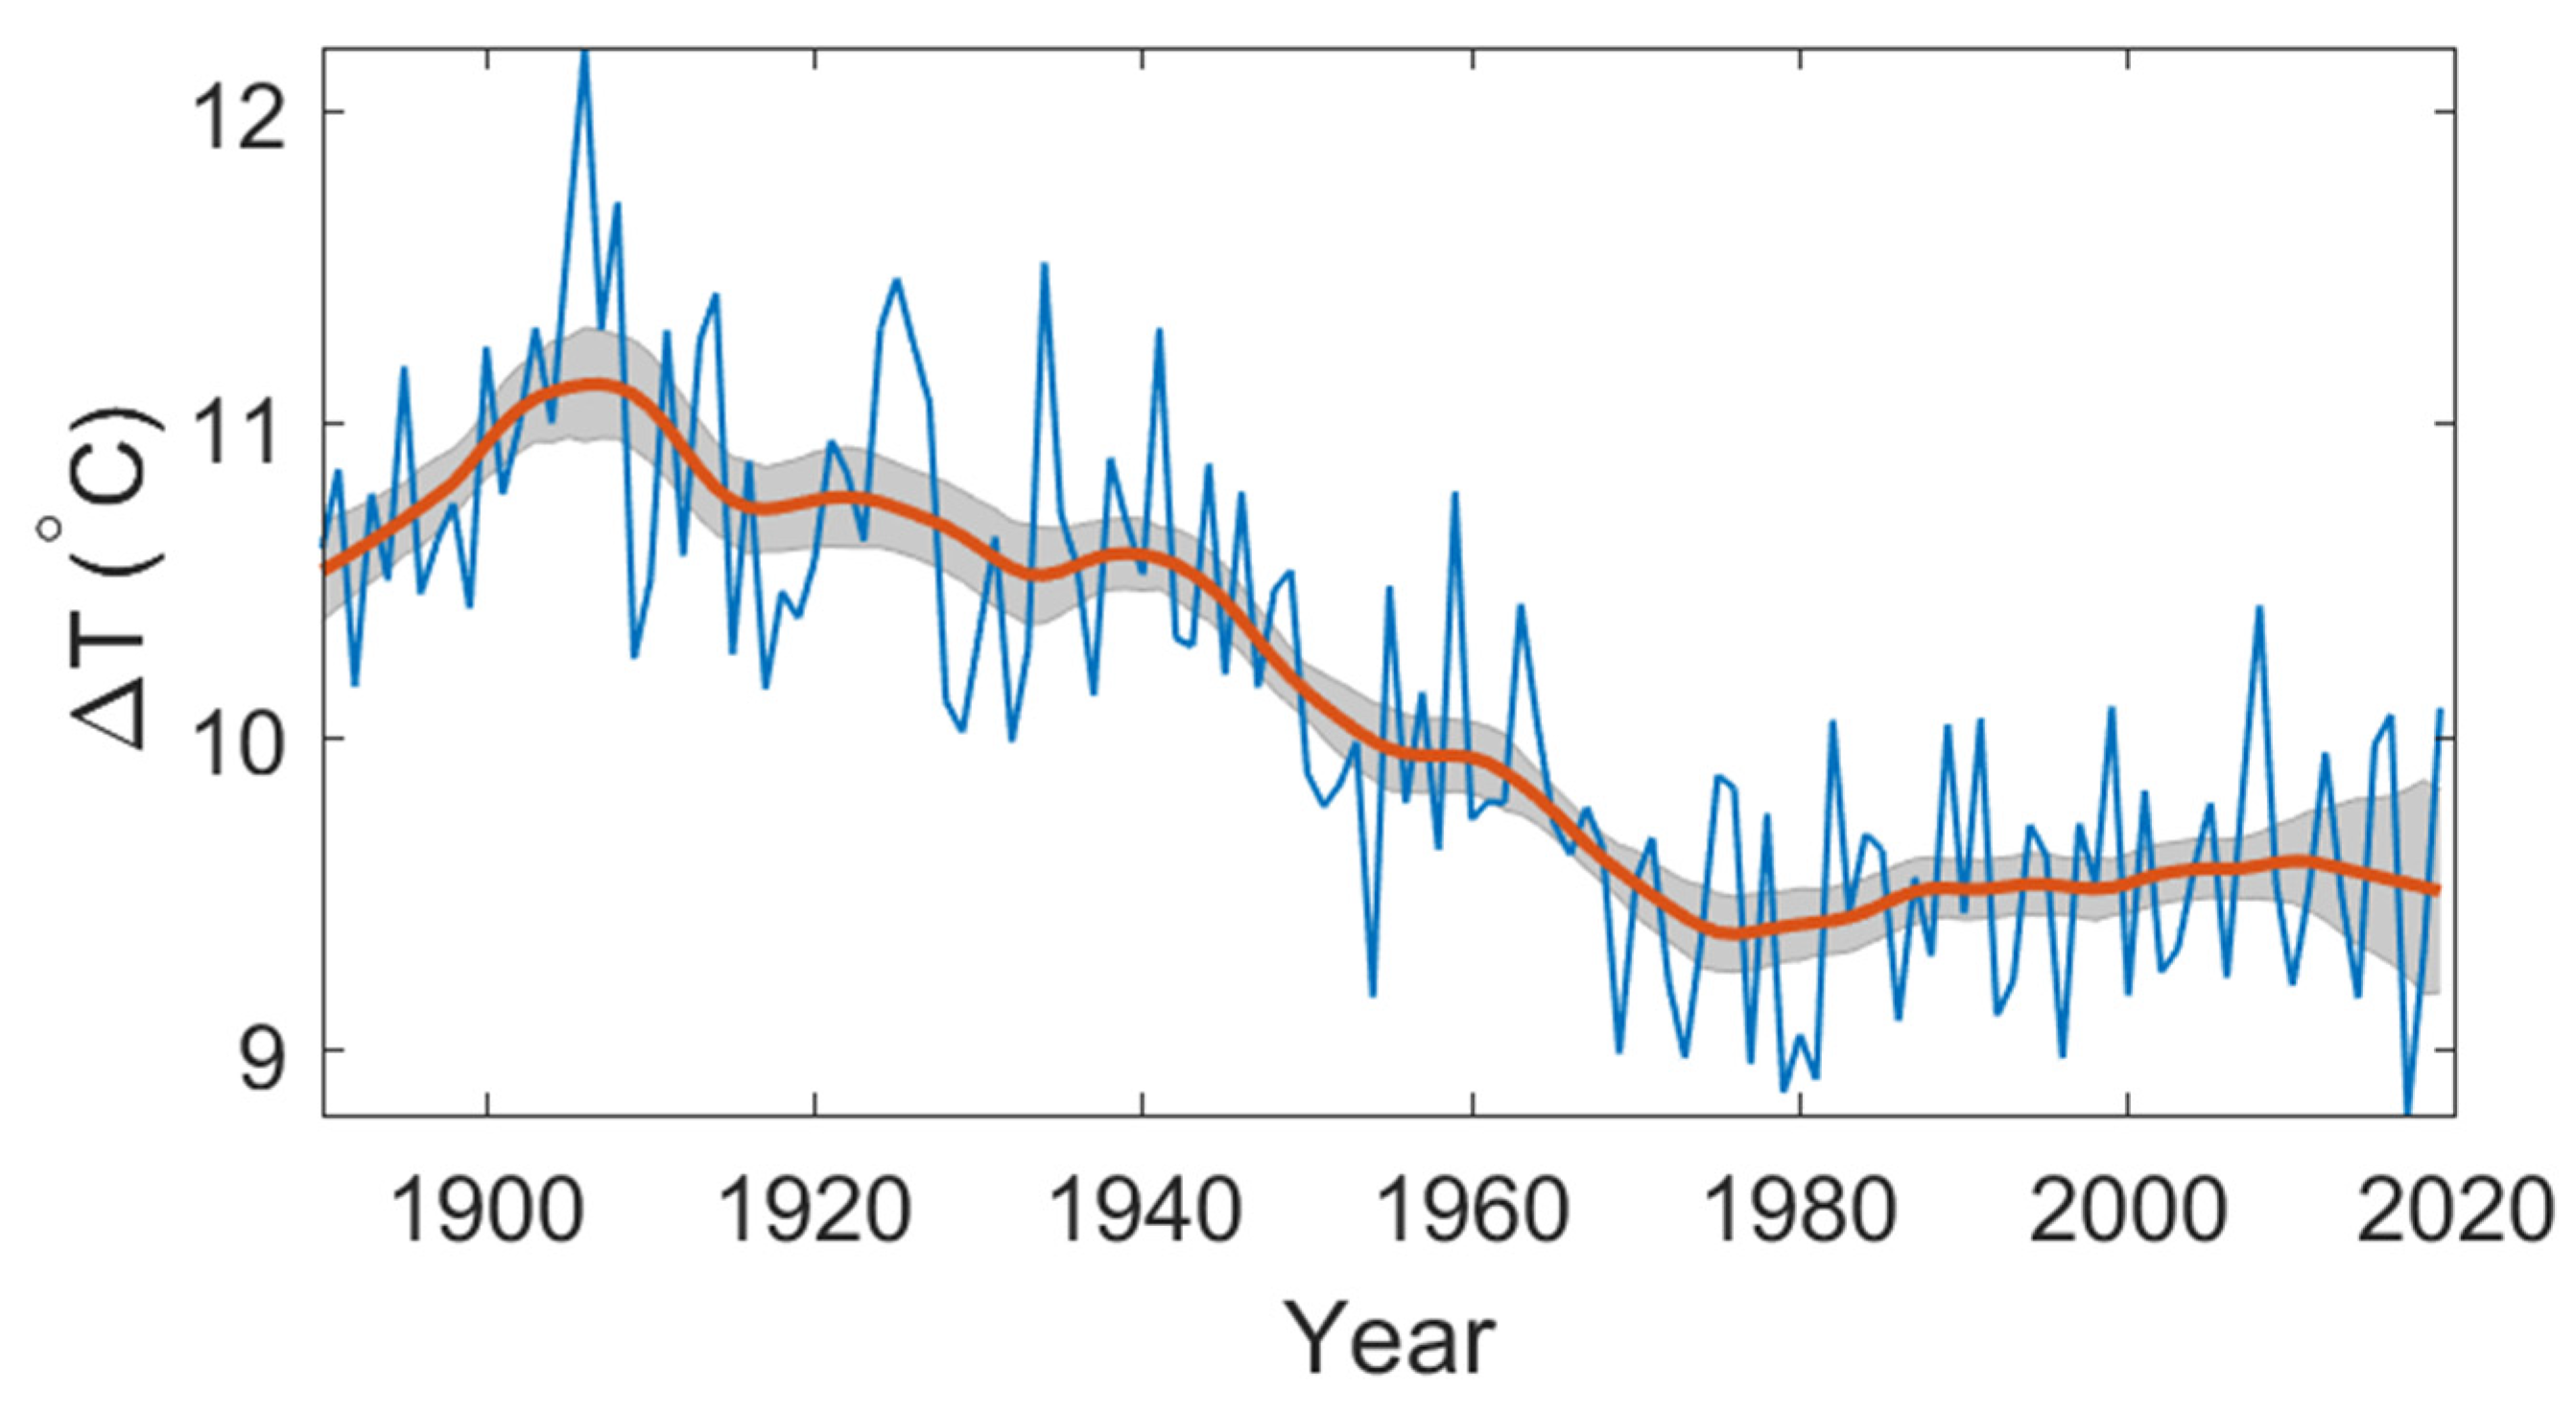
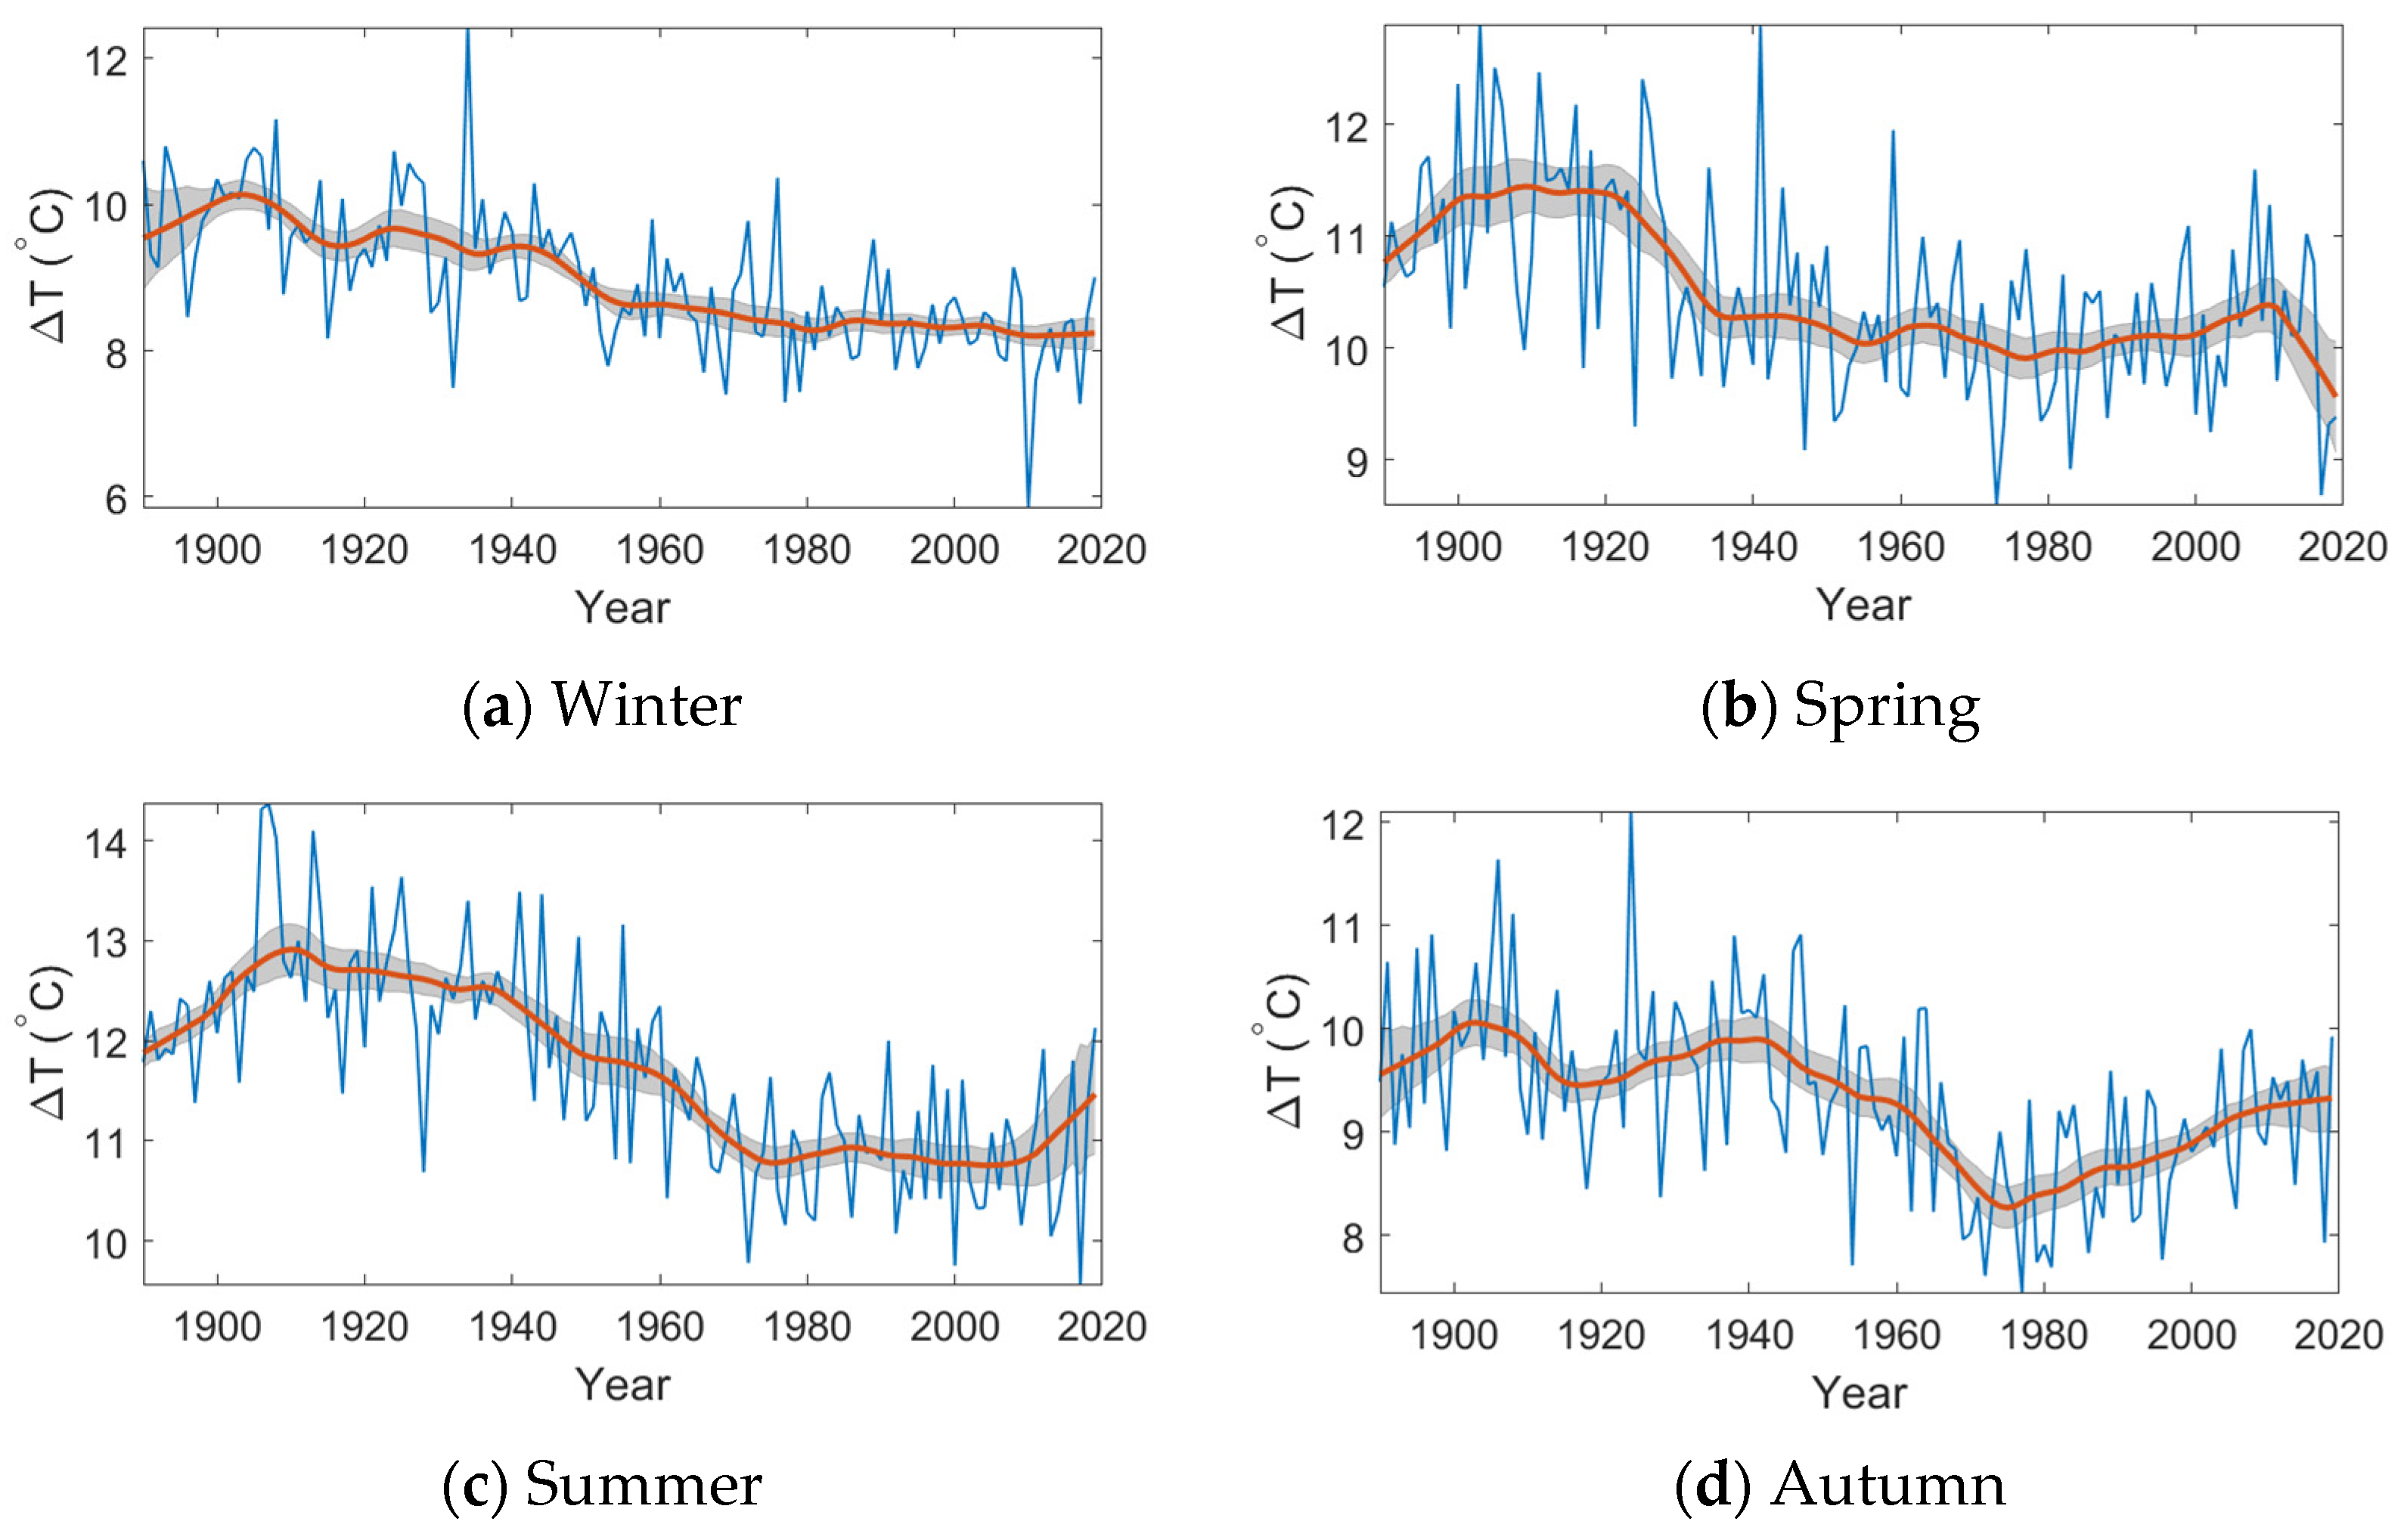
4.1.2. Diurnal Temperature Range (DTR)
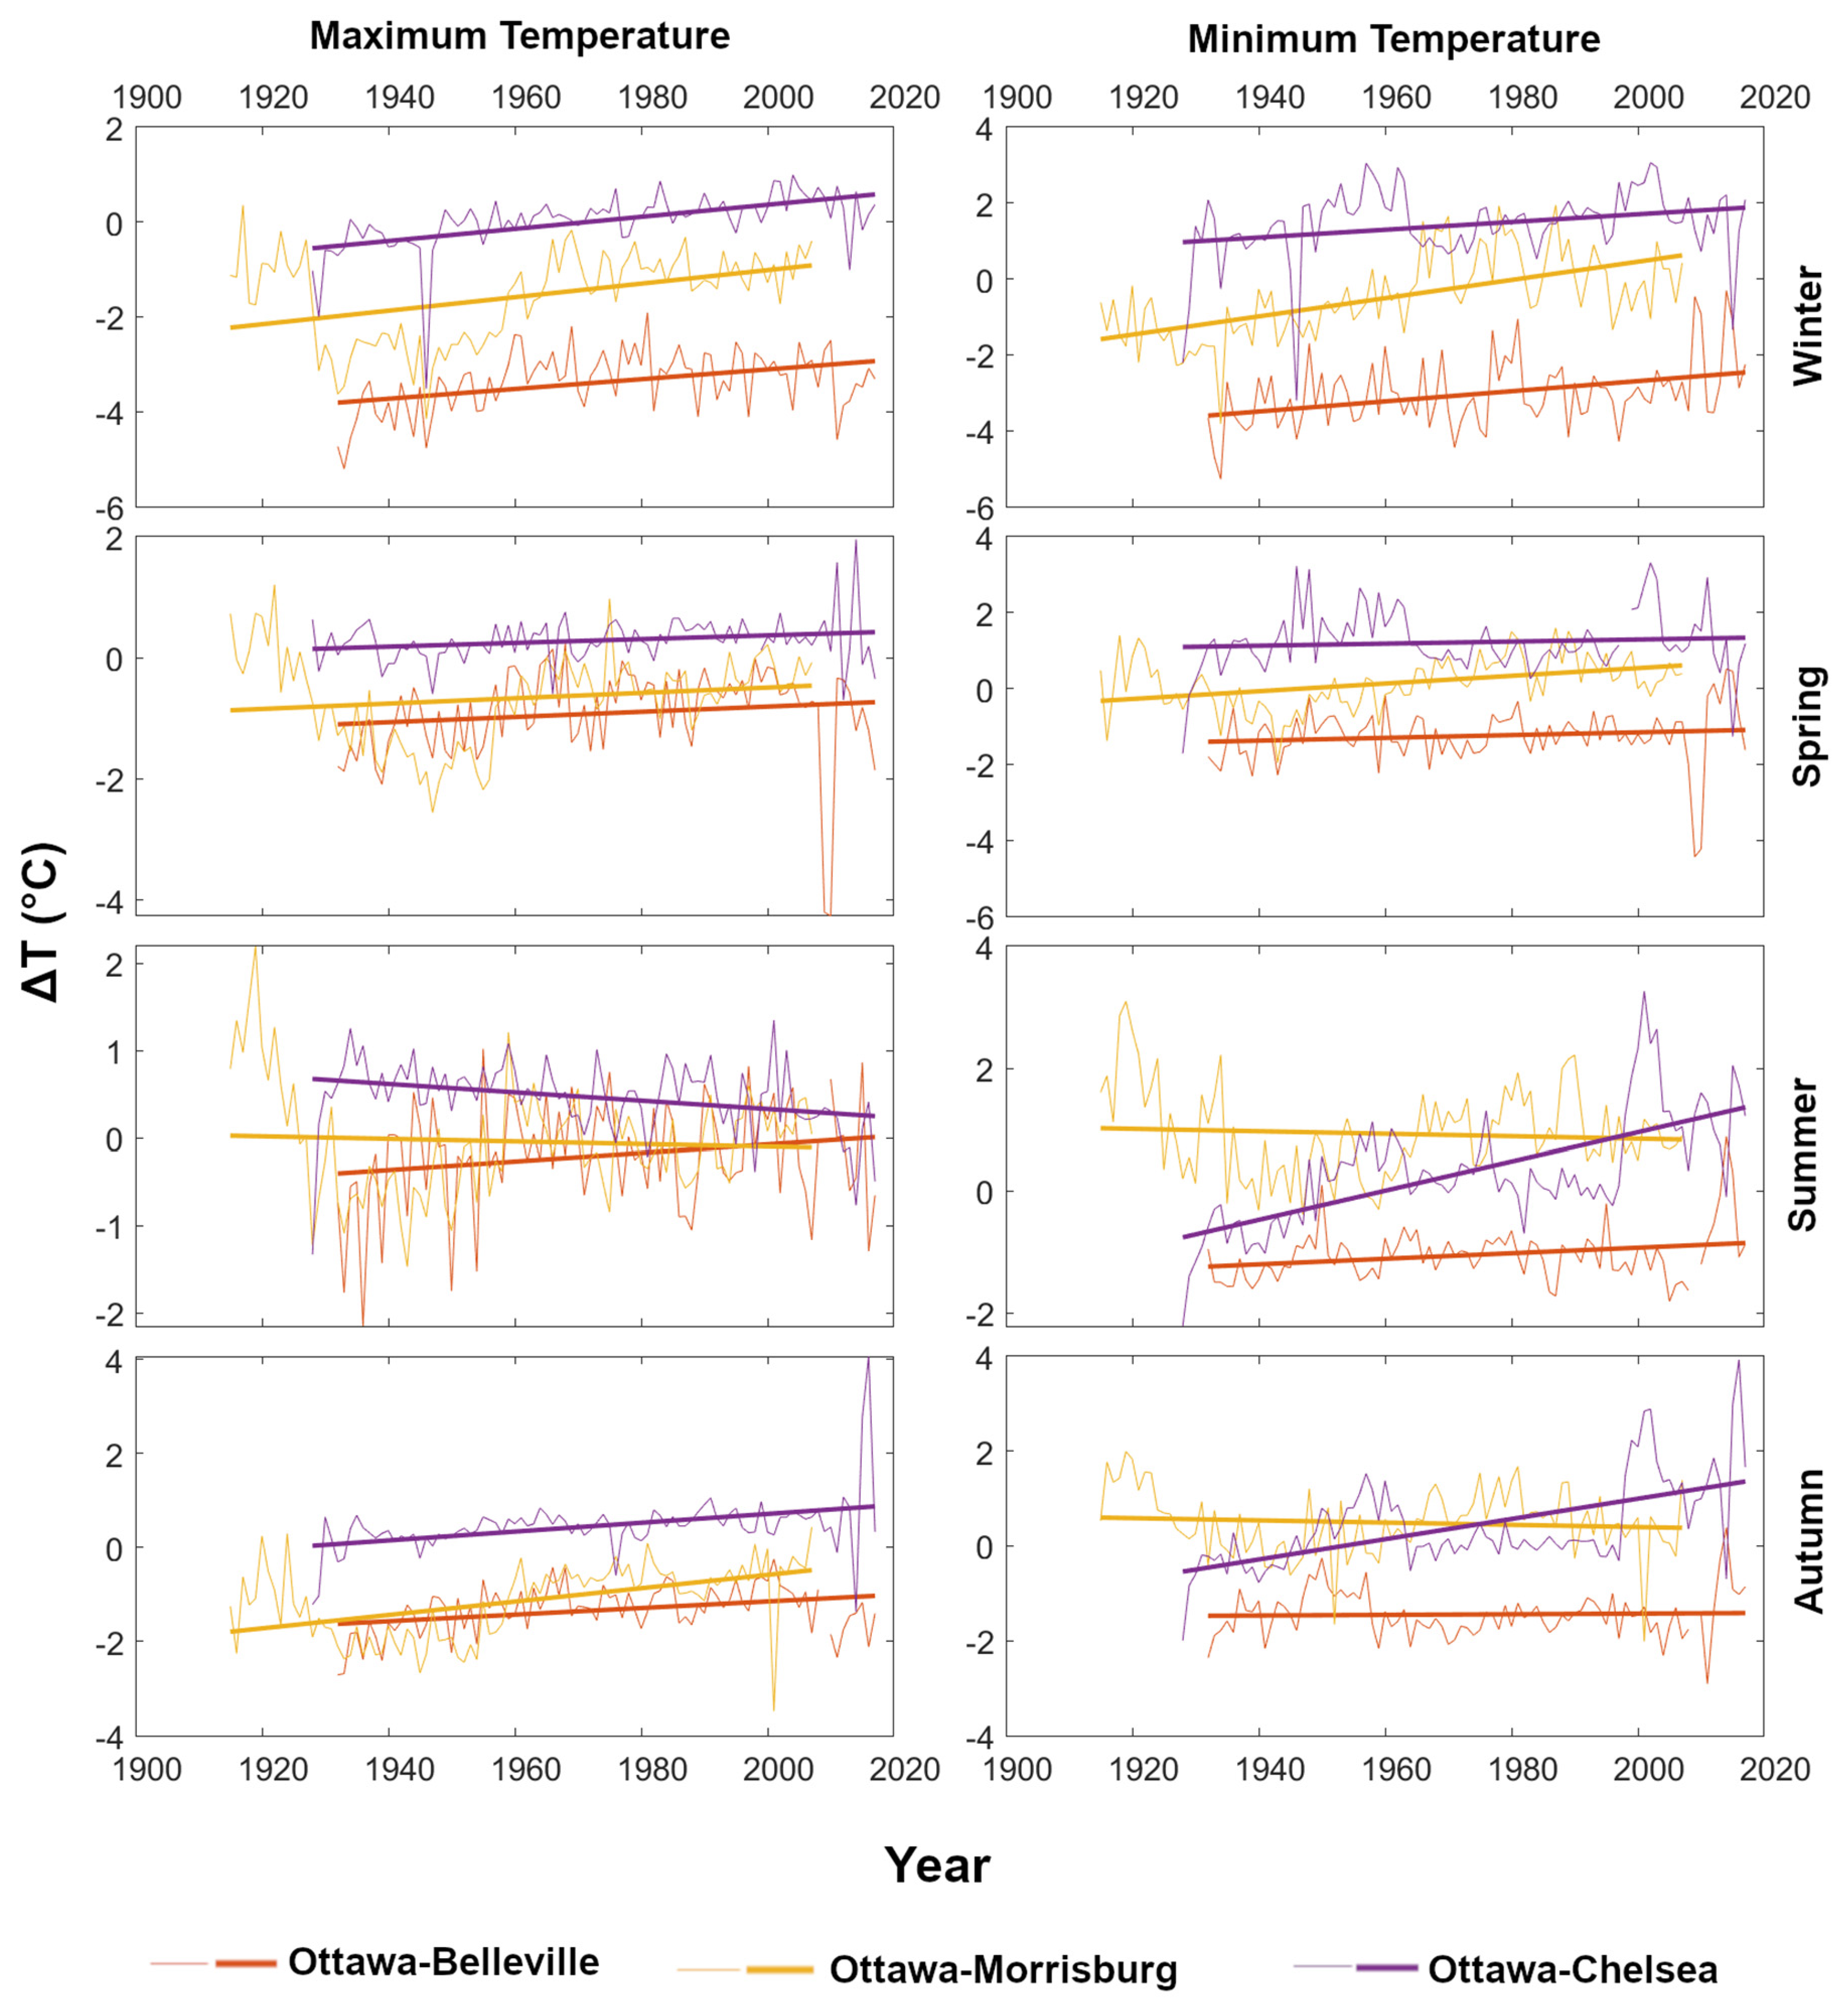
4.1.3. Comparing Ottawa Temperature Trends to Lesser or Non-Urban Areas
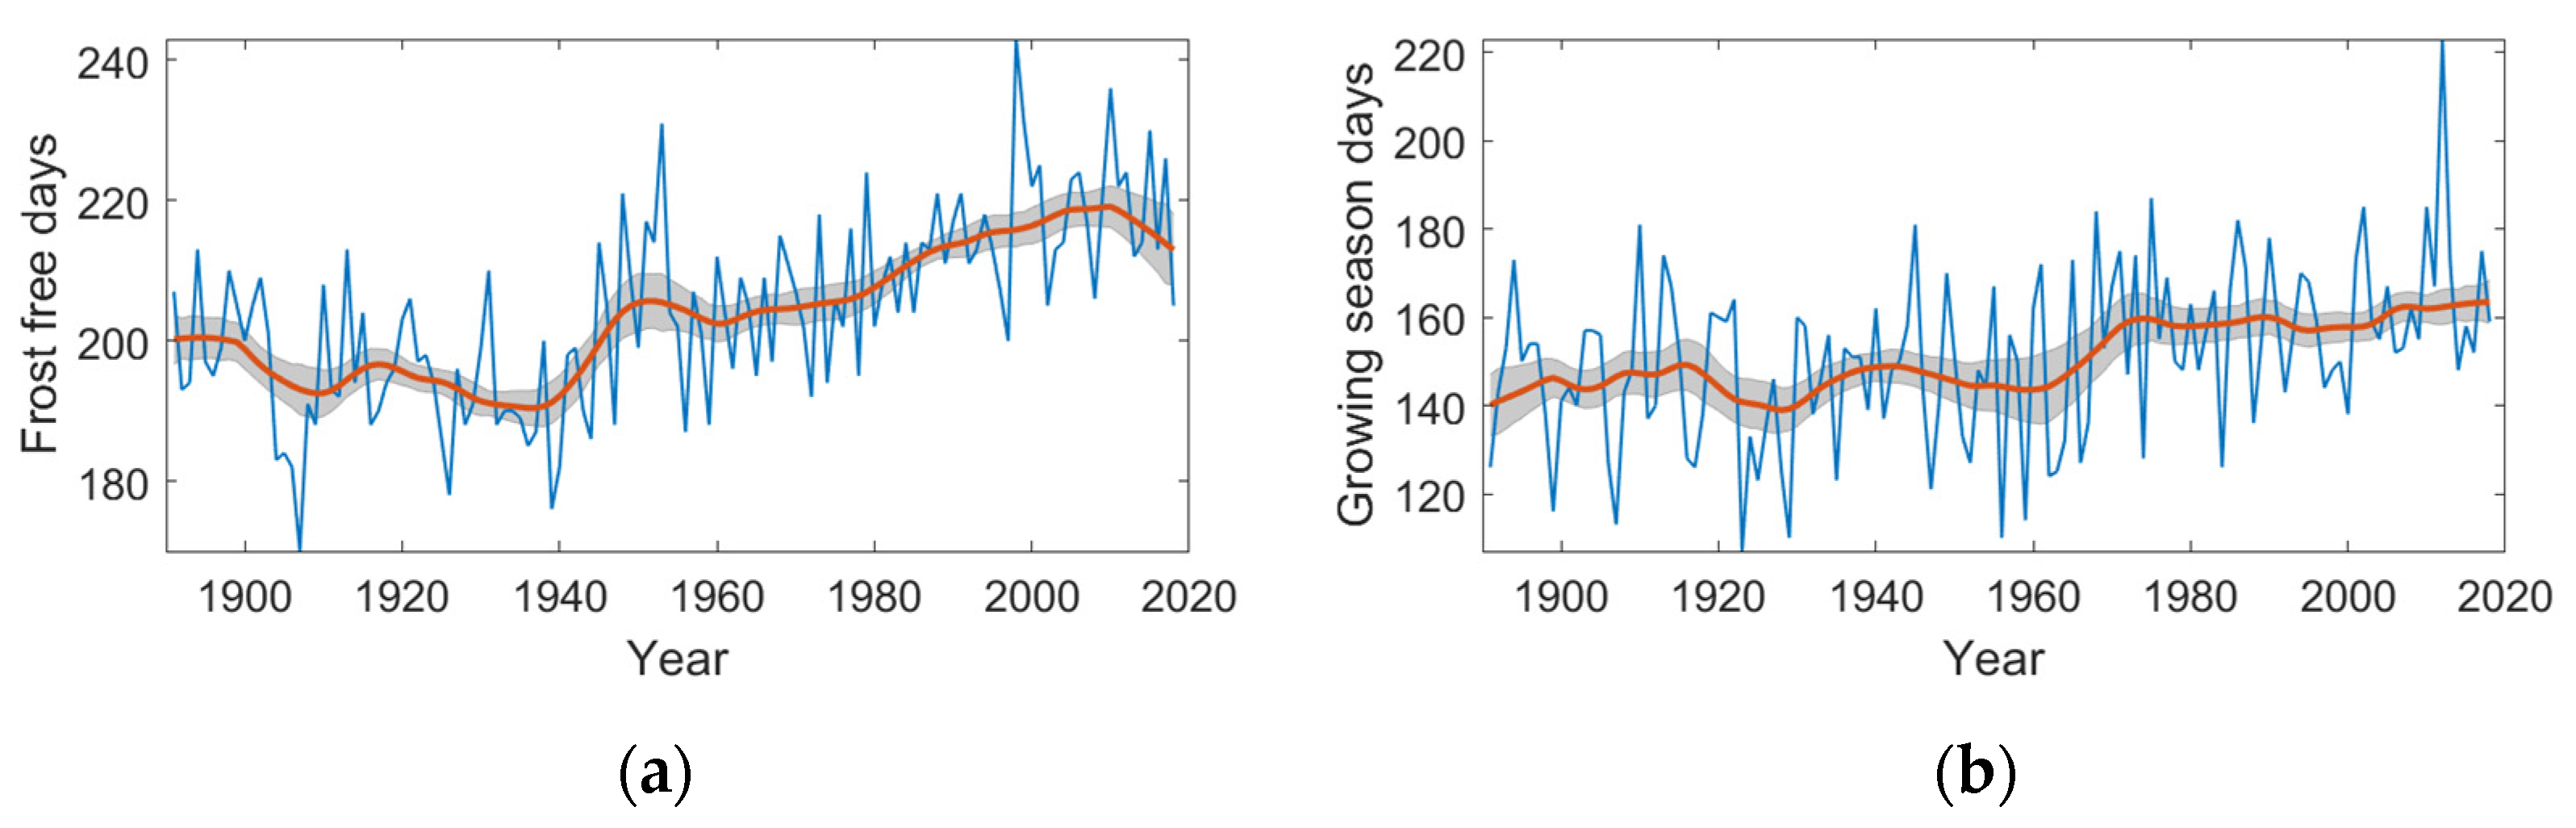
4.1.4. Changes in Environmental Responses
4.1.5. Changes in River Discharge
4.1.6. Extreme Weather
4.2. Periodic Patterns in Ottawa Climate
4.2.1. Periodicity in Annual and Seasonal Weather
4.2.2. Periodicity in Extreme Weather
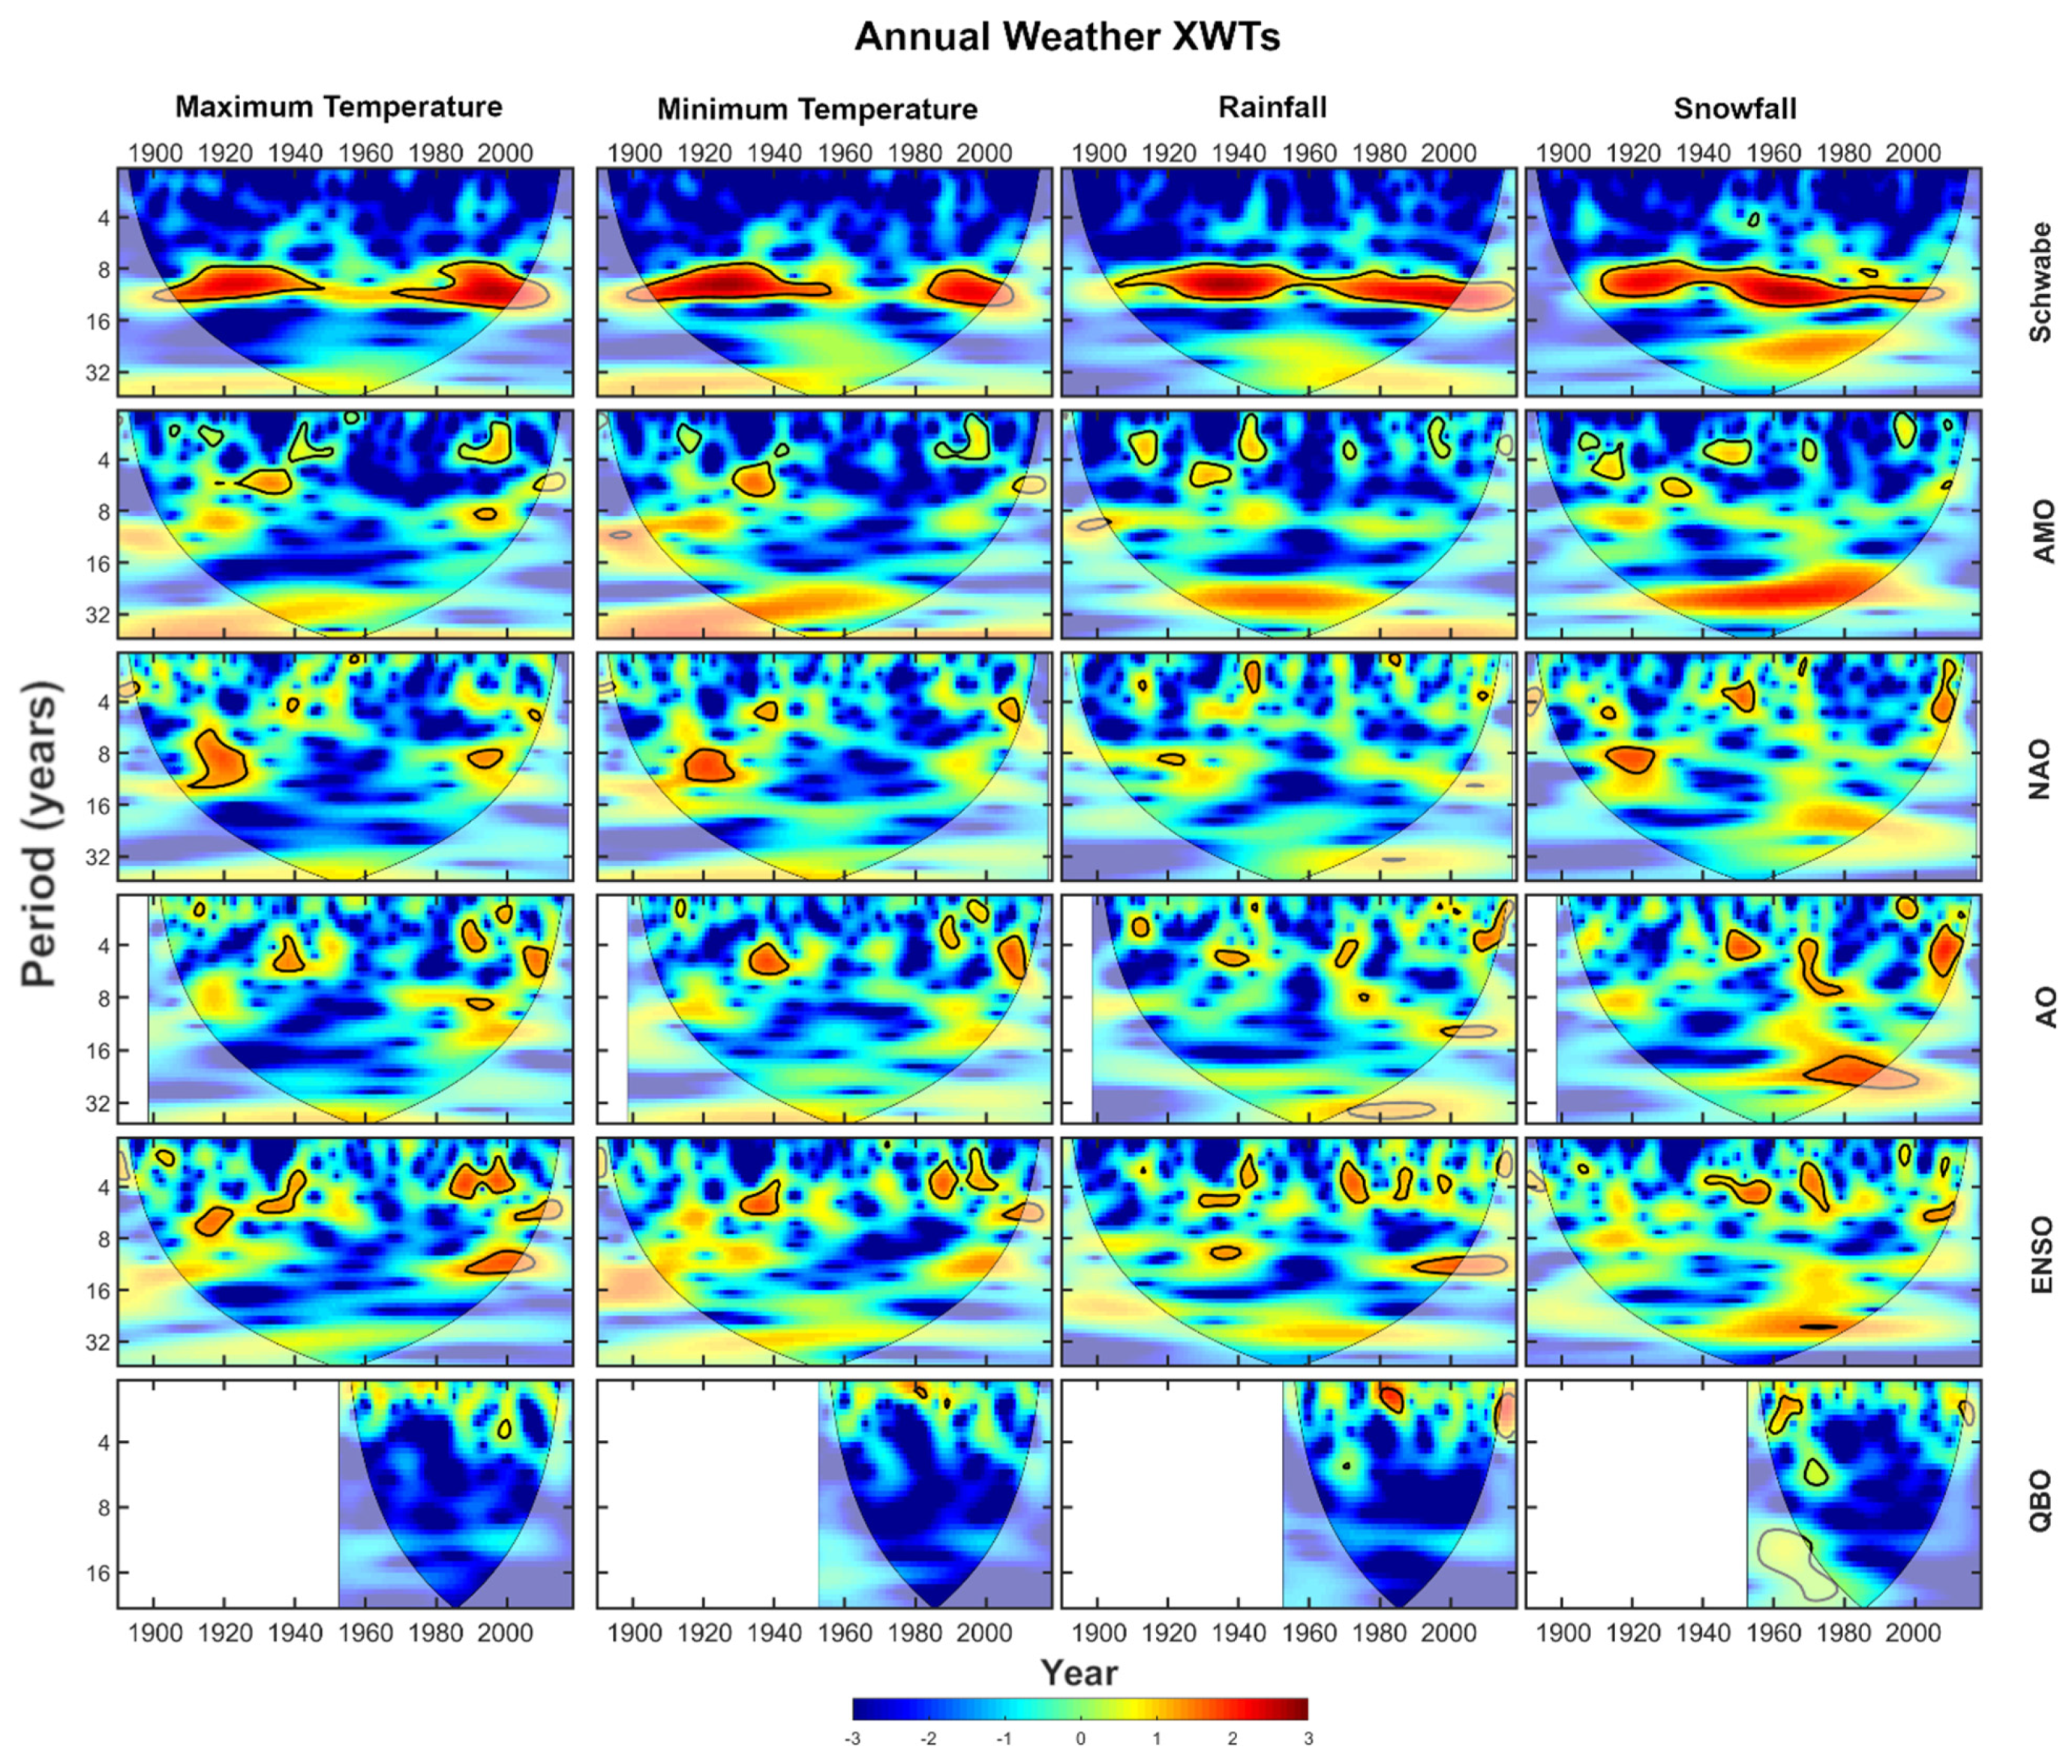
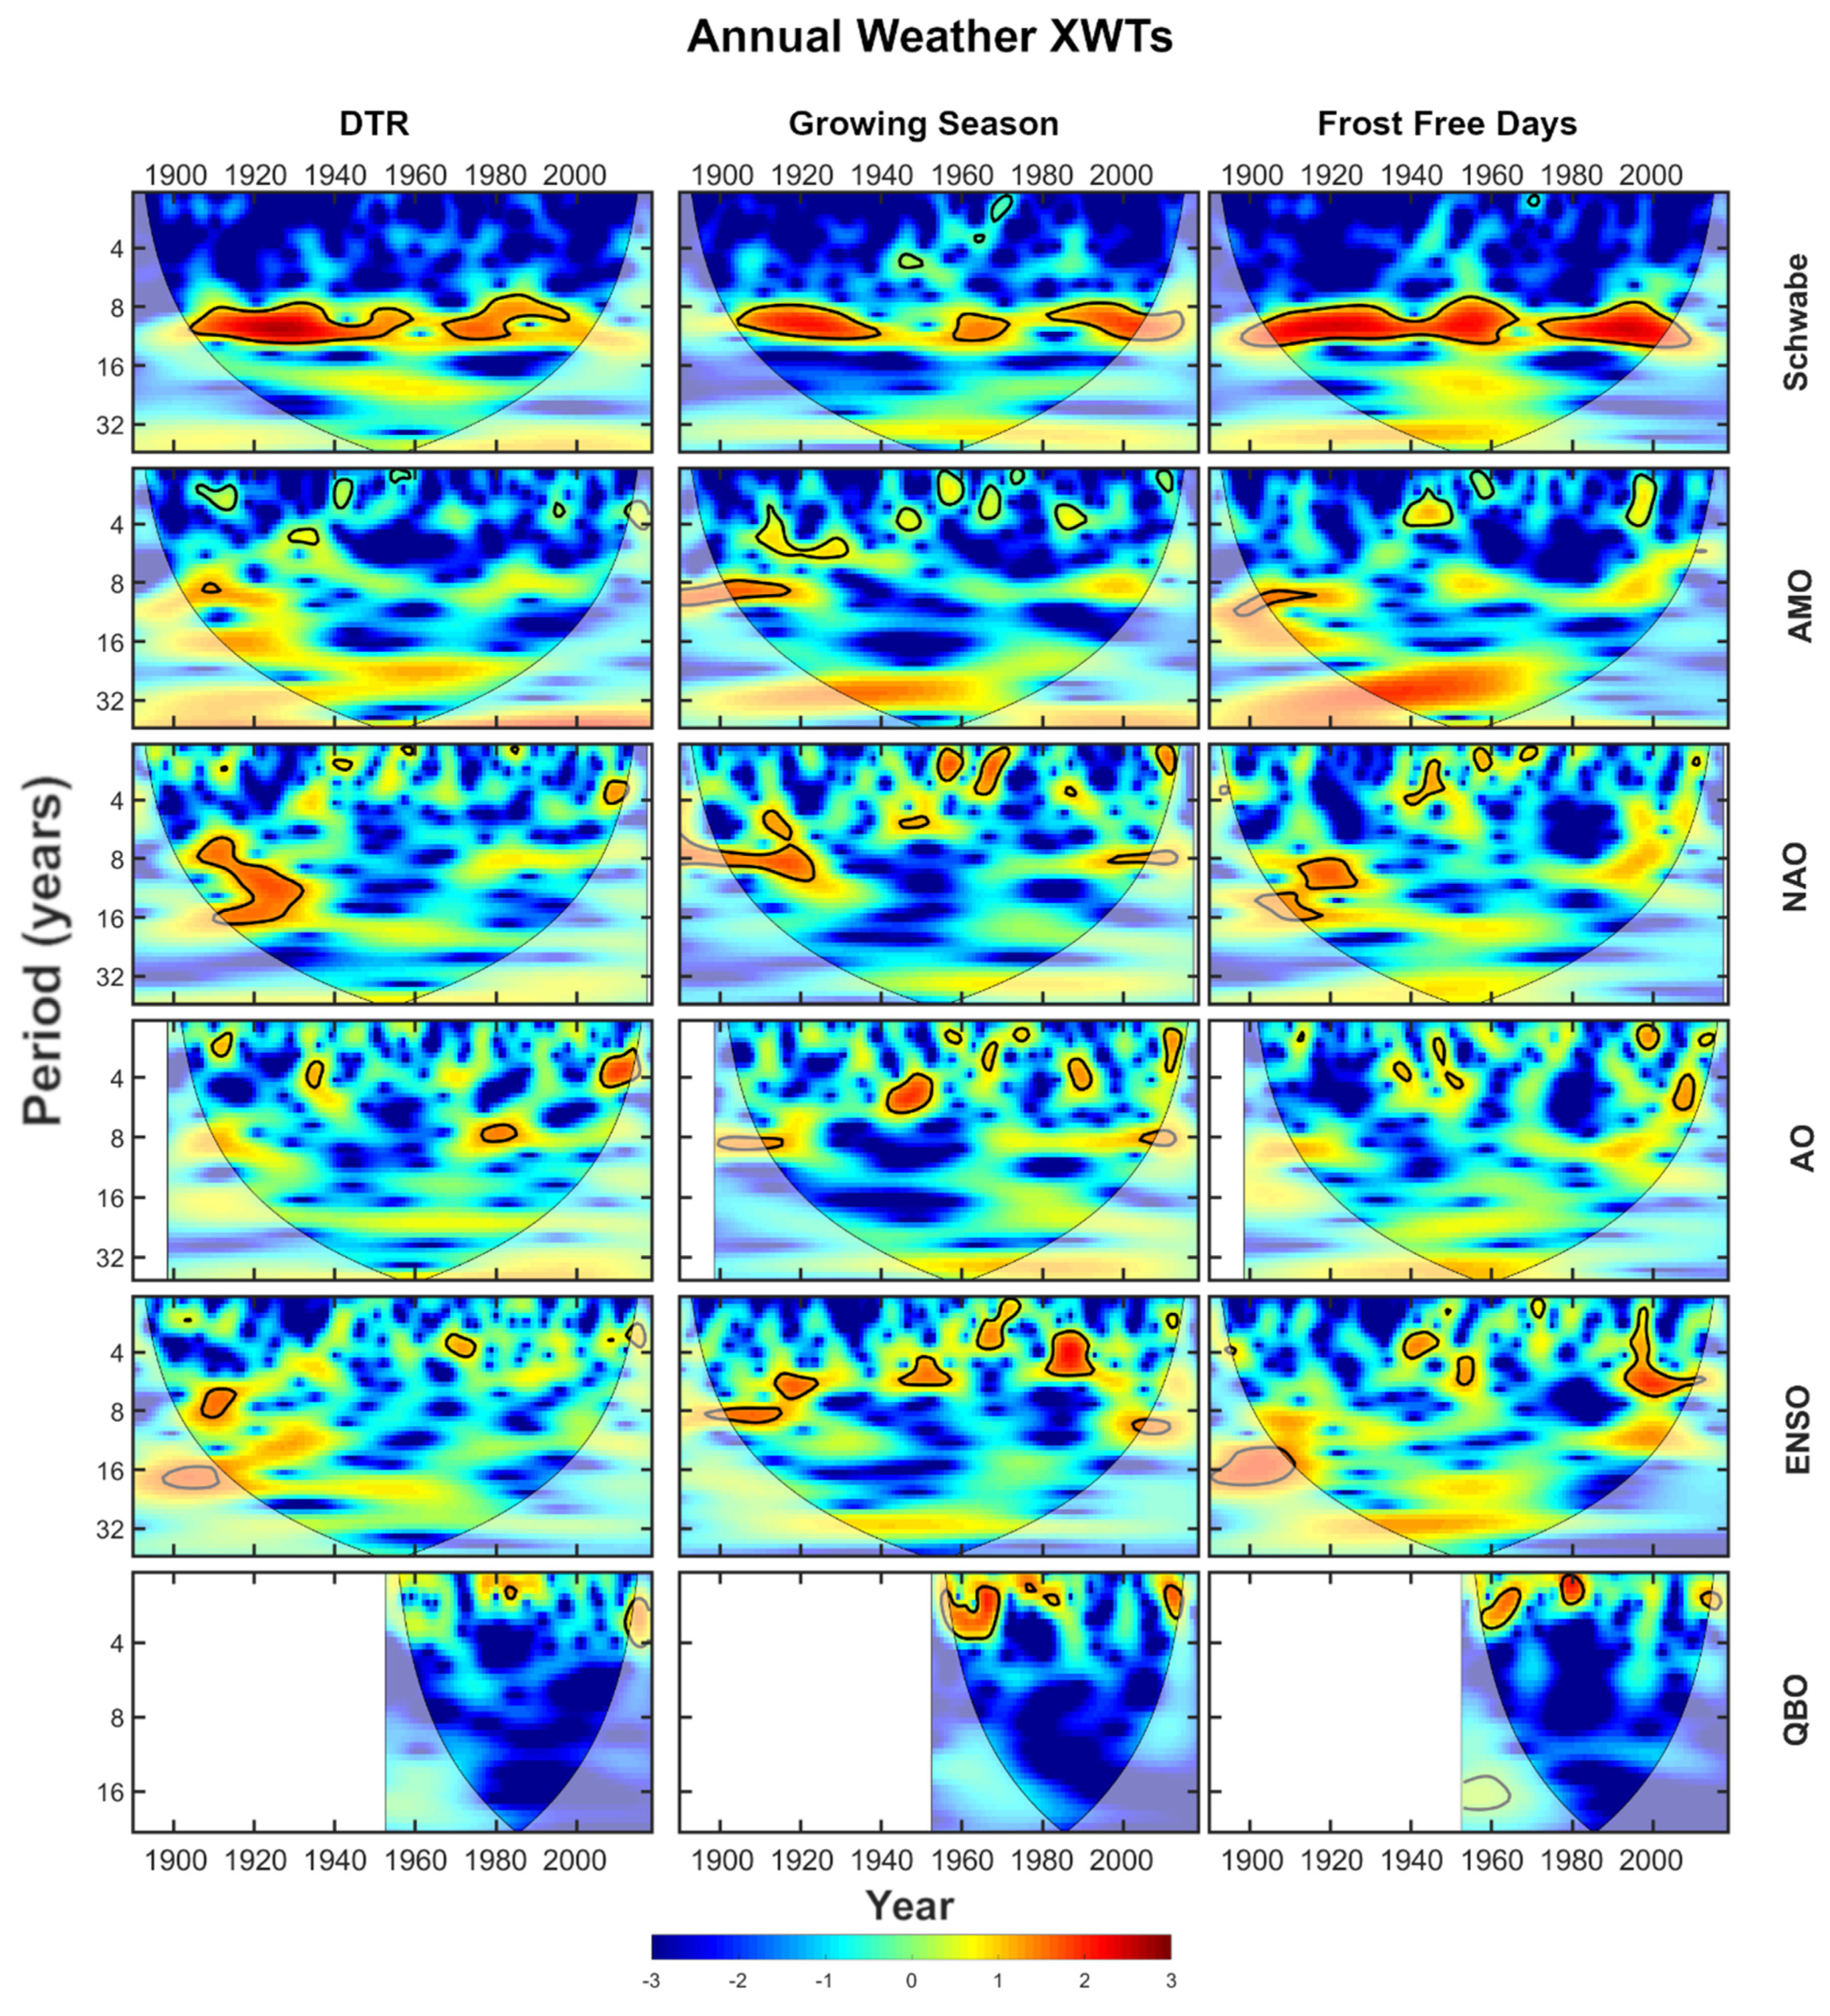
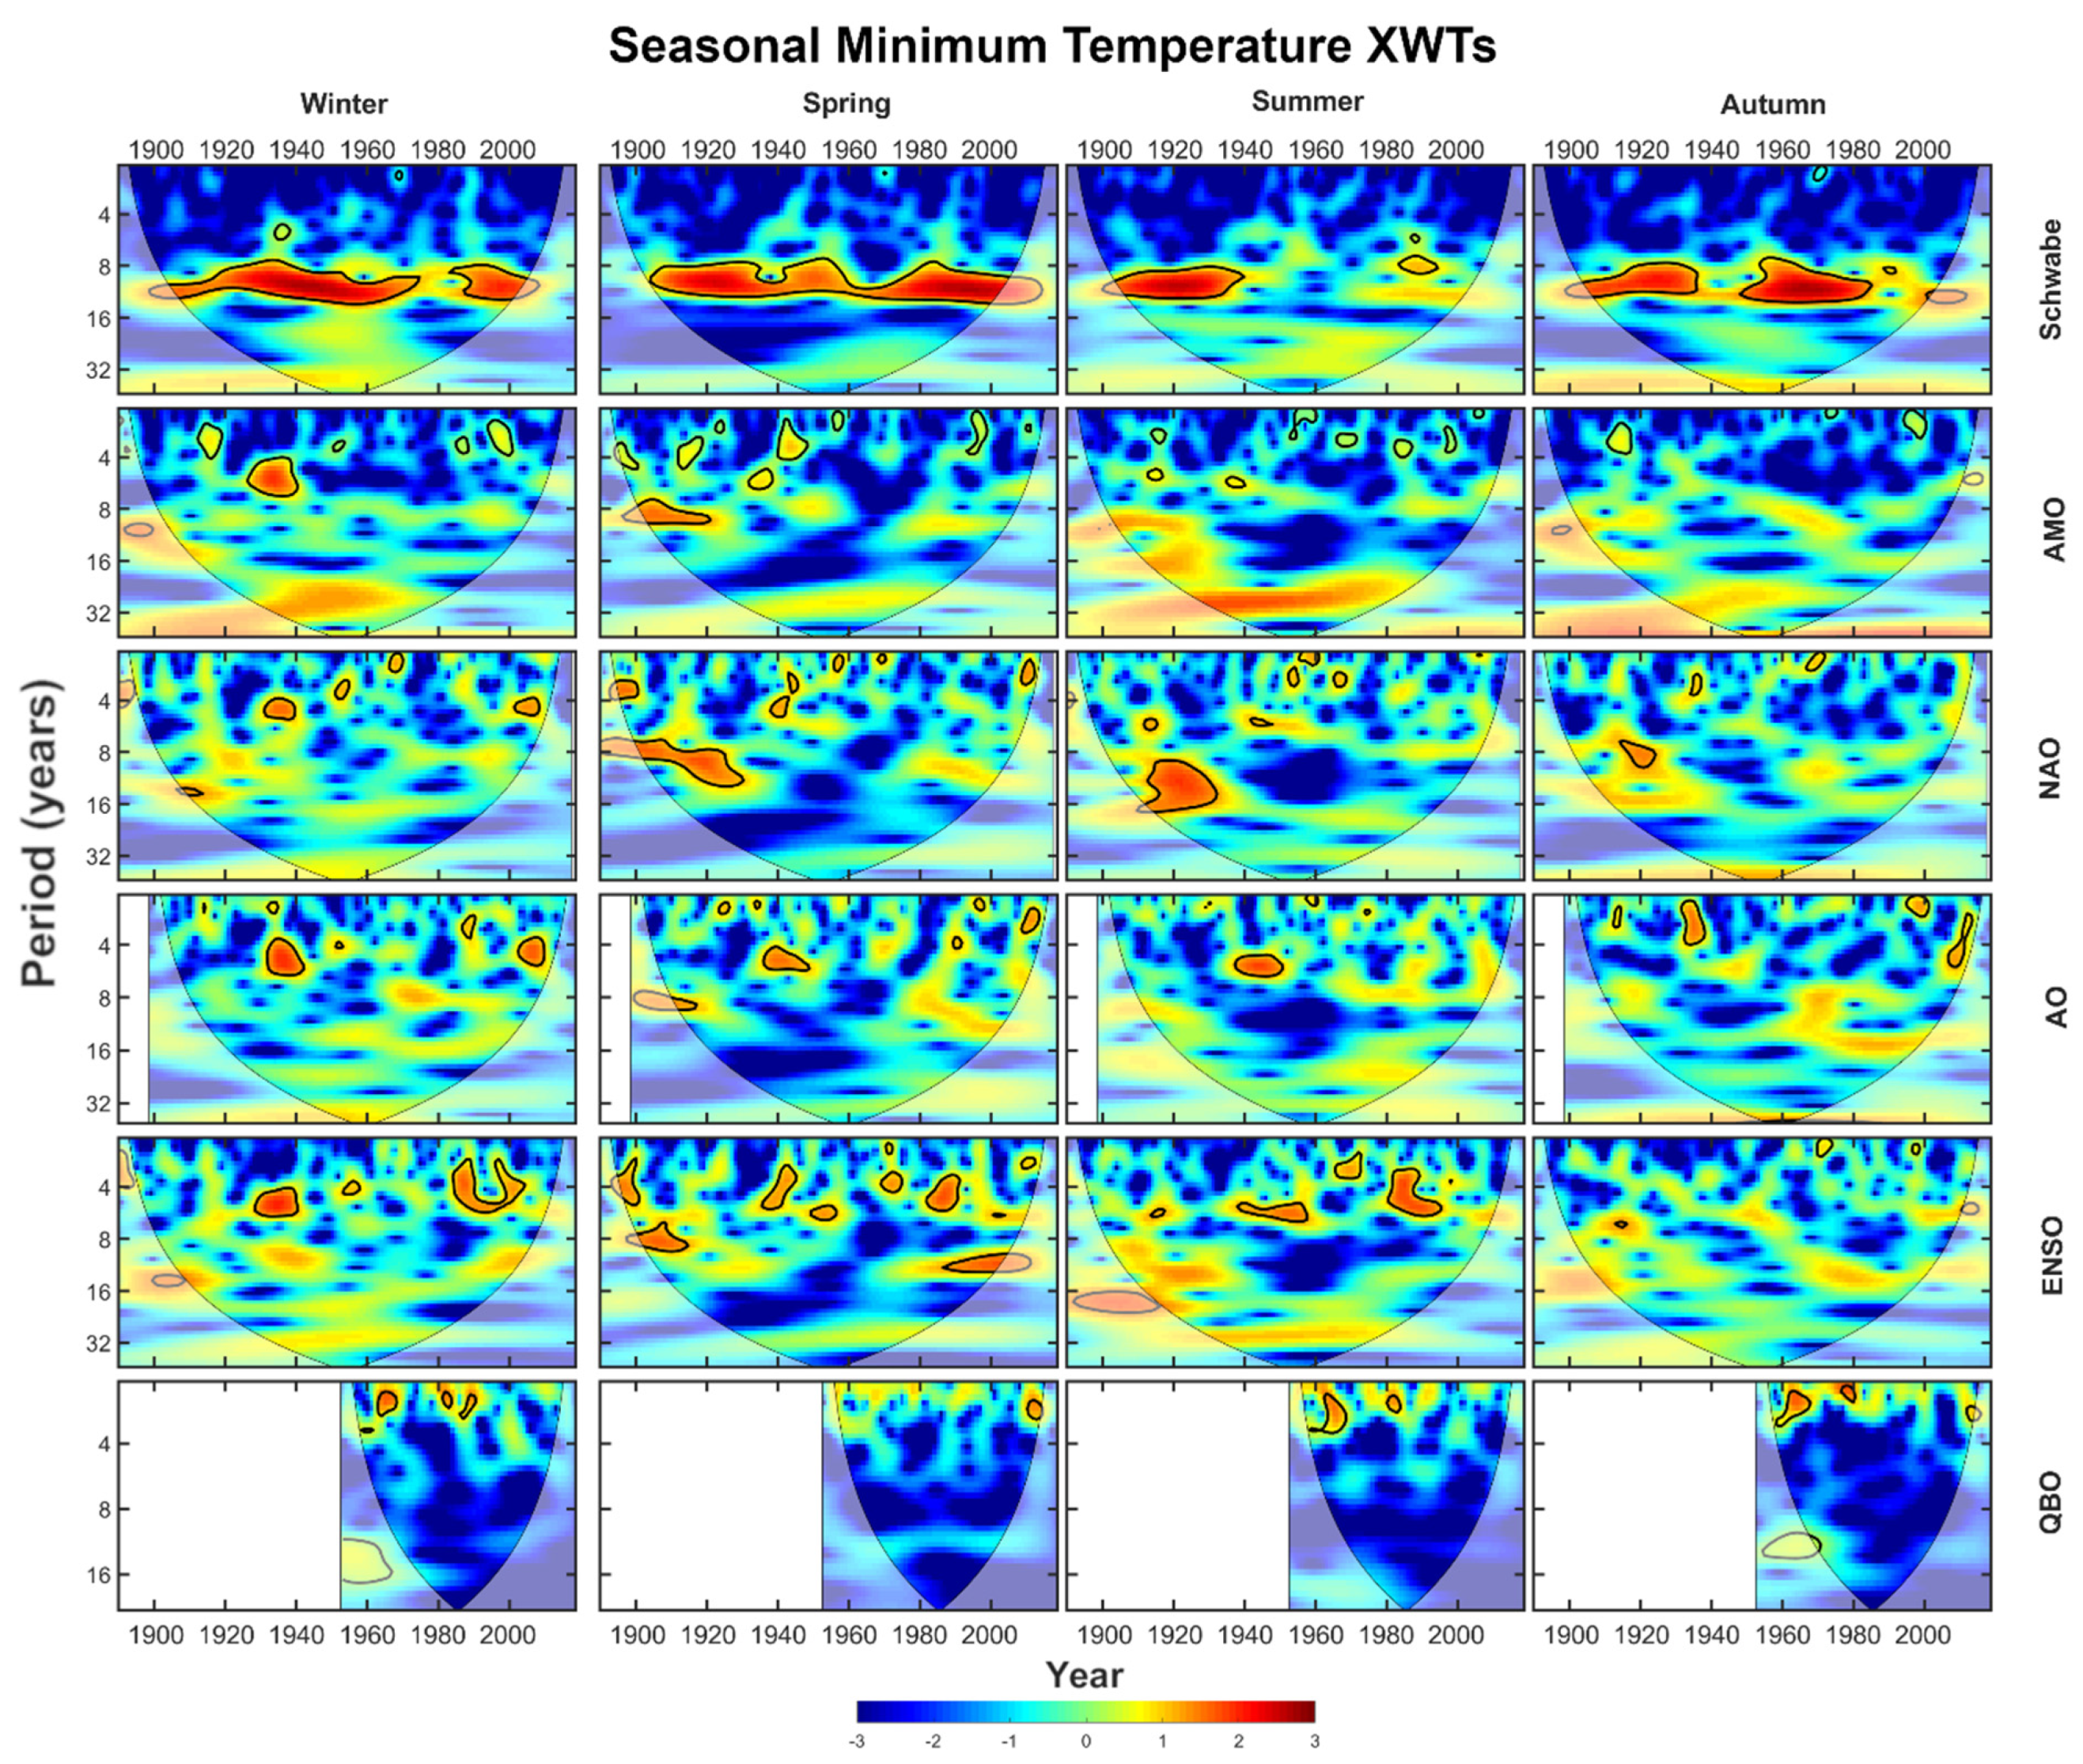
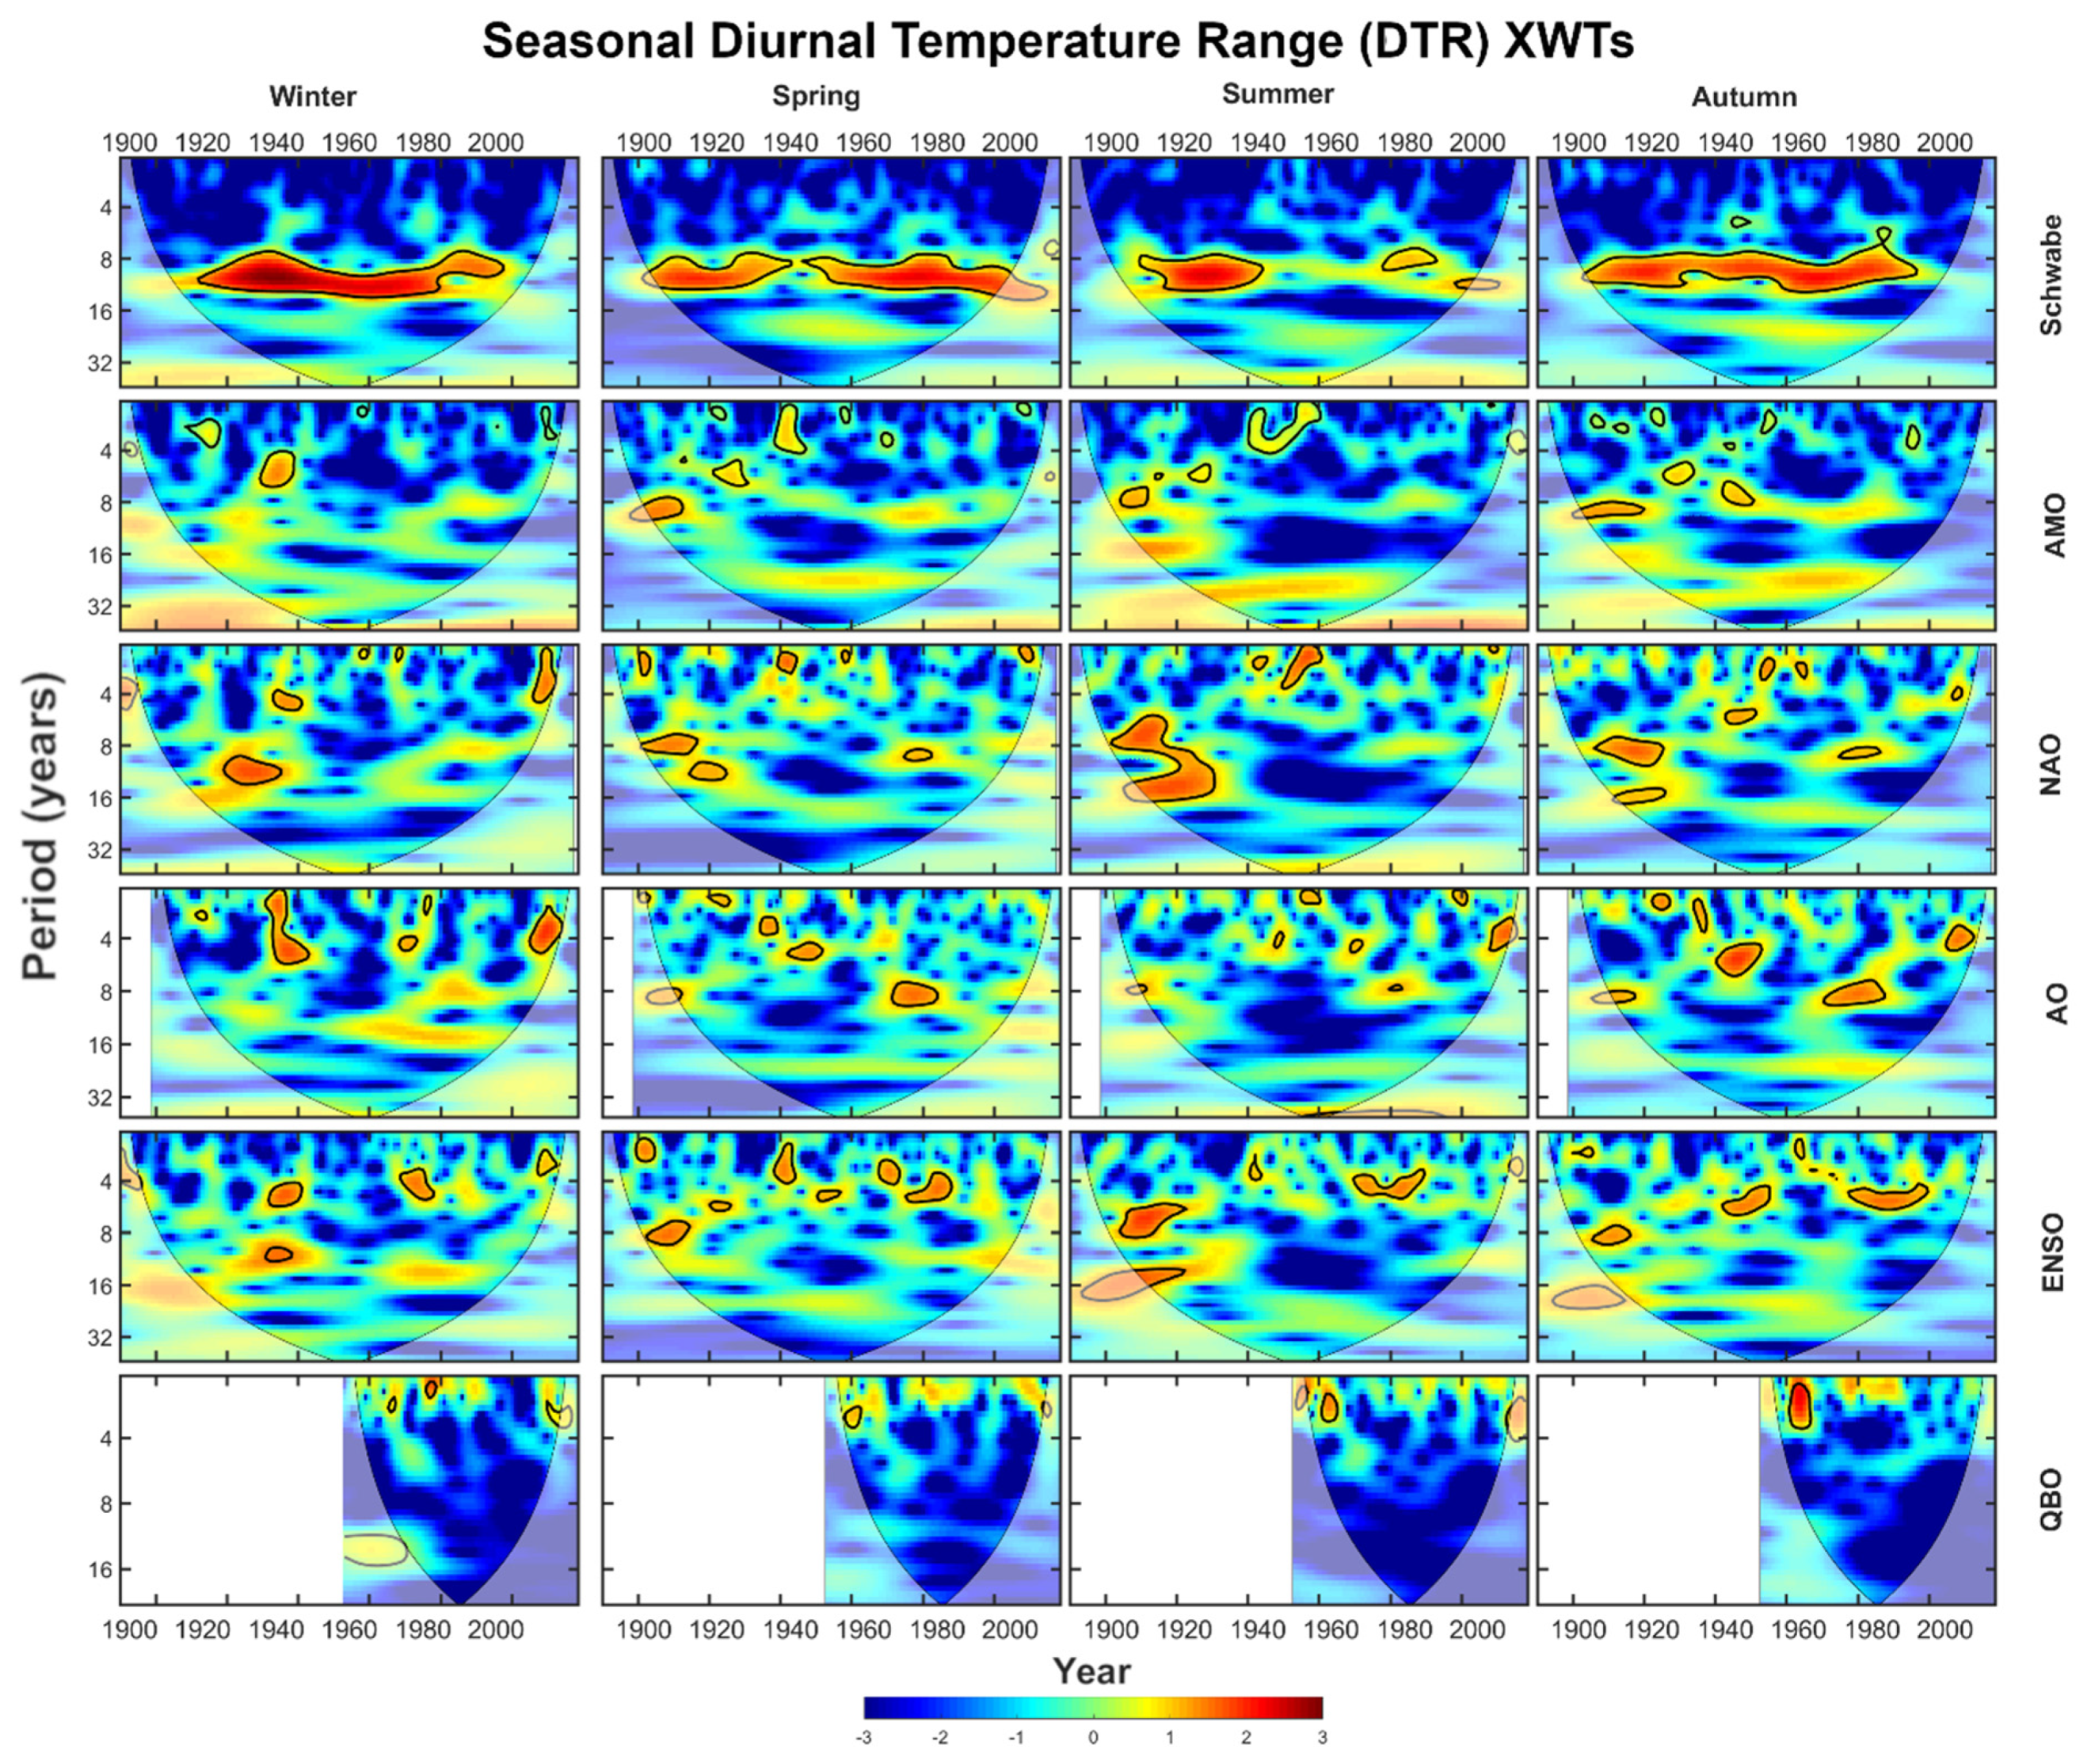
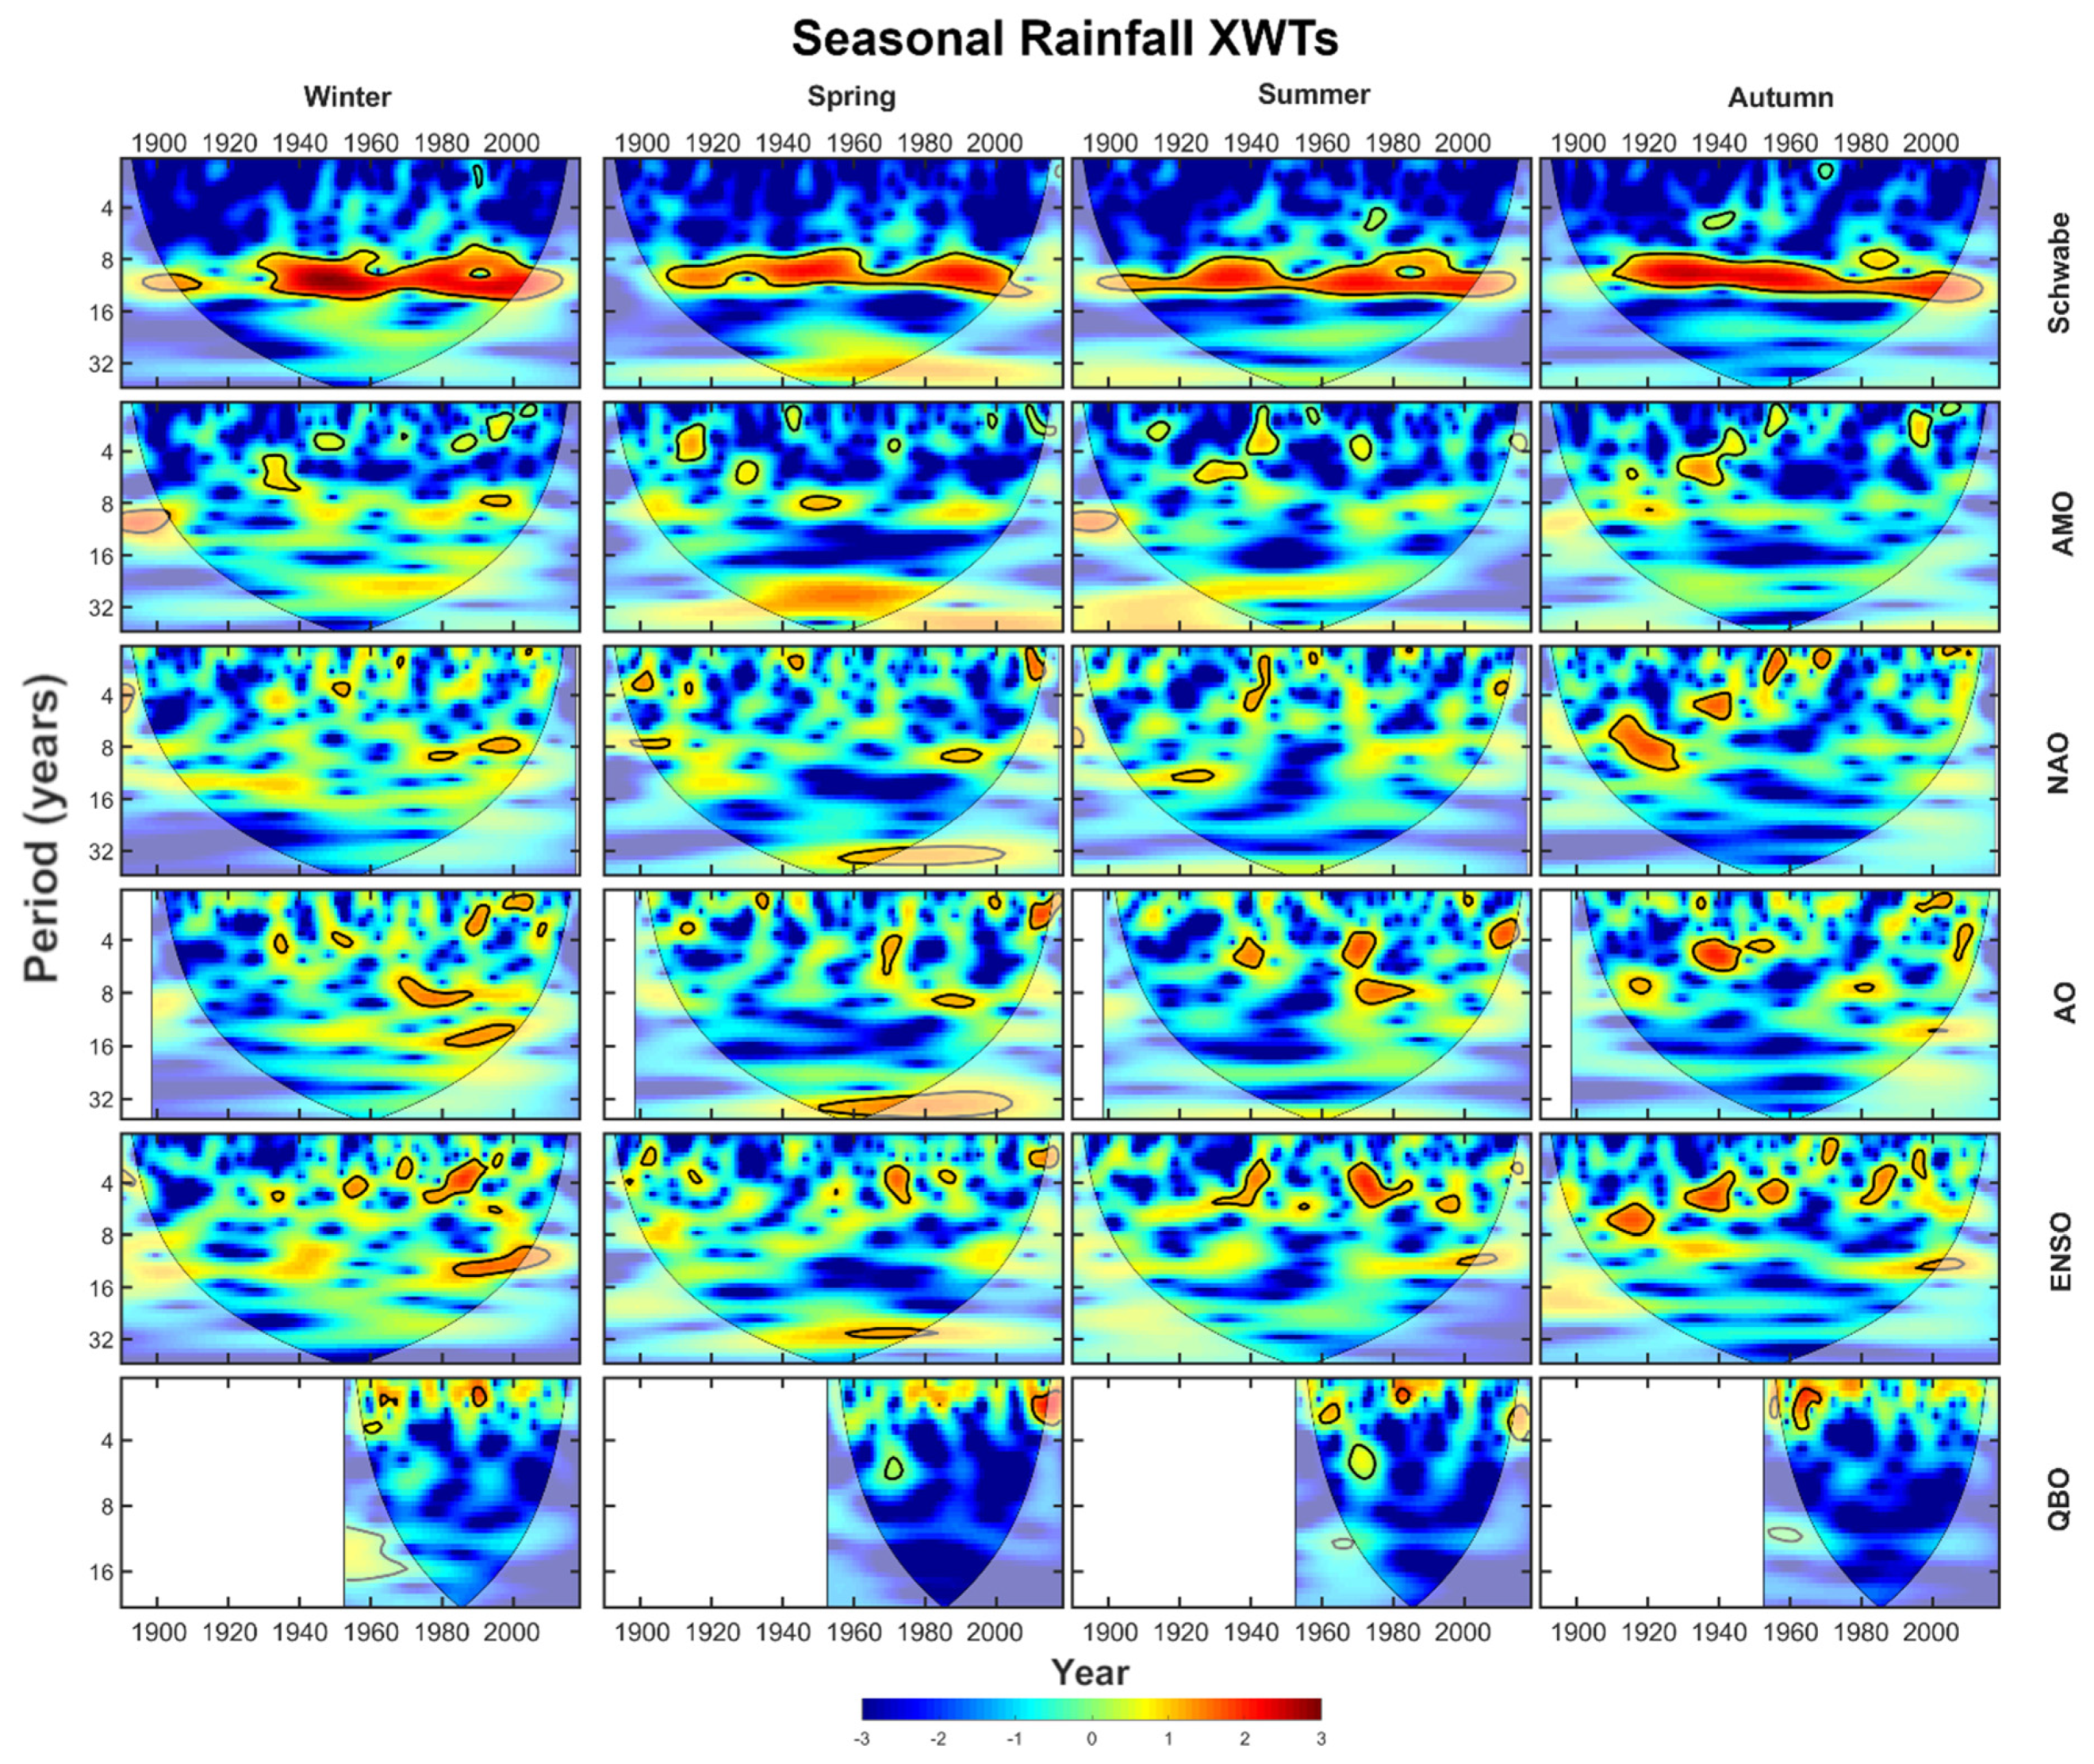
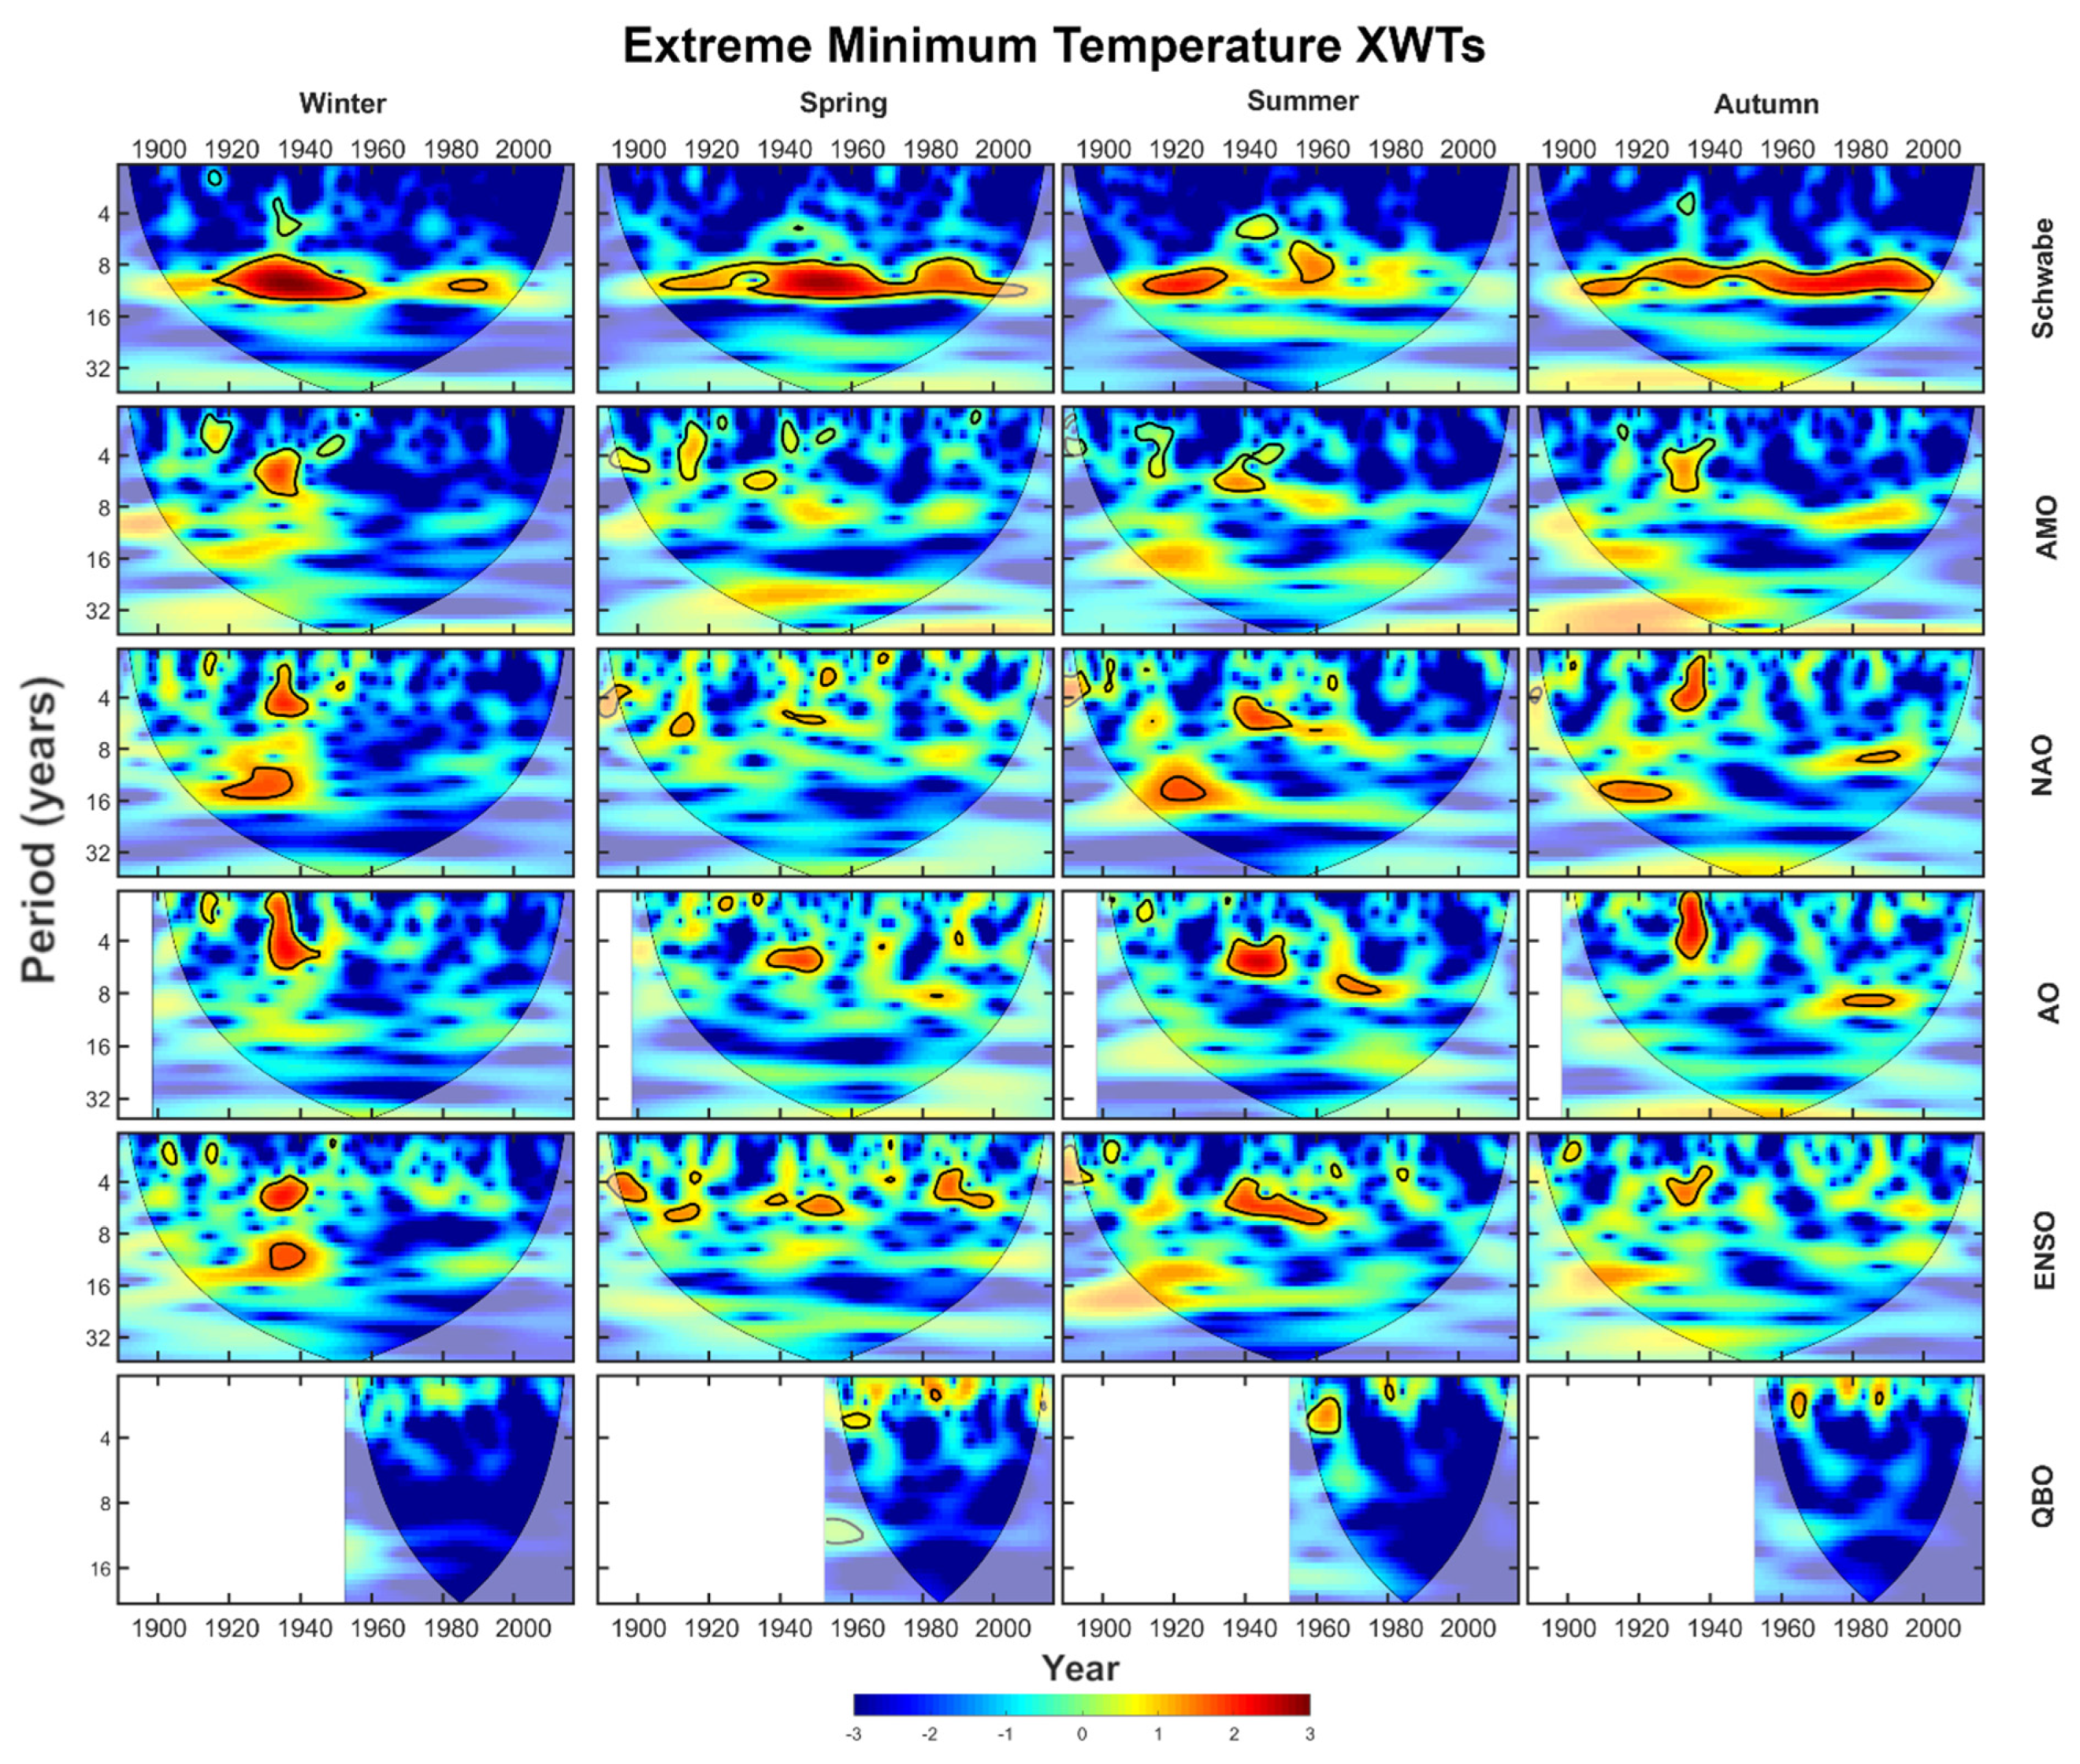
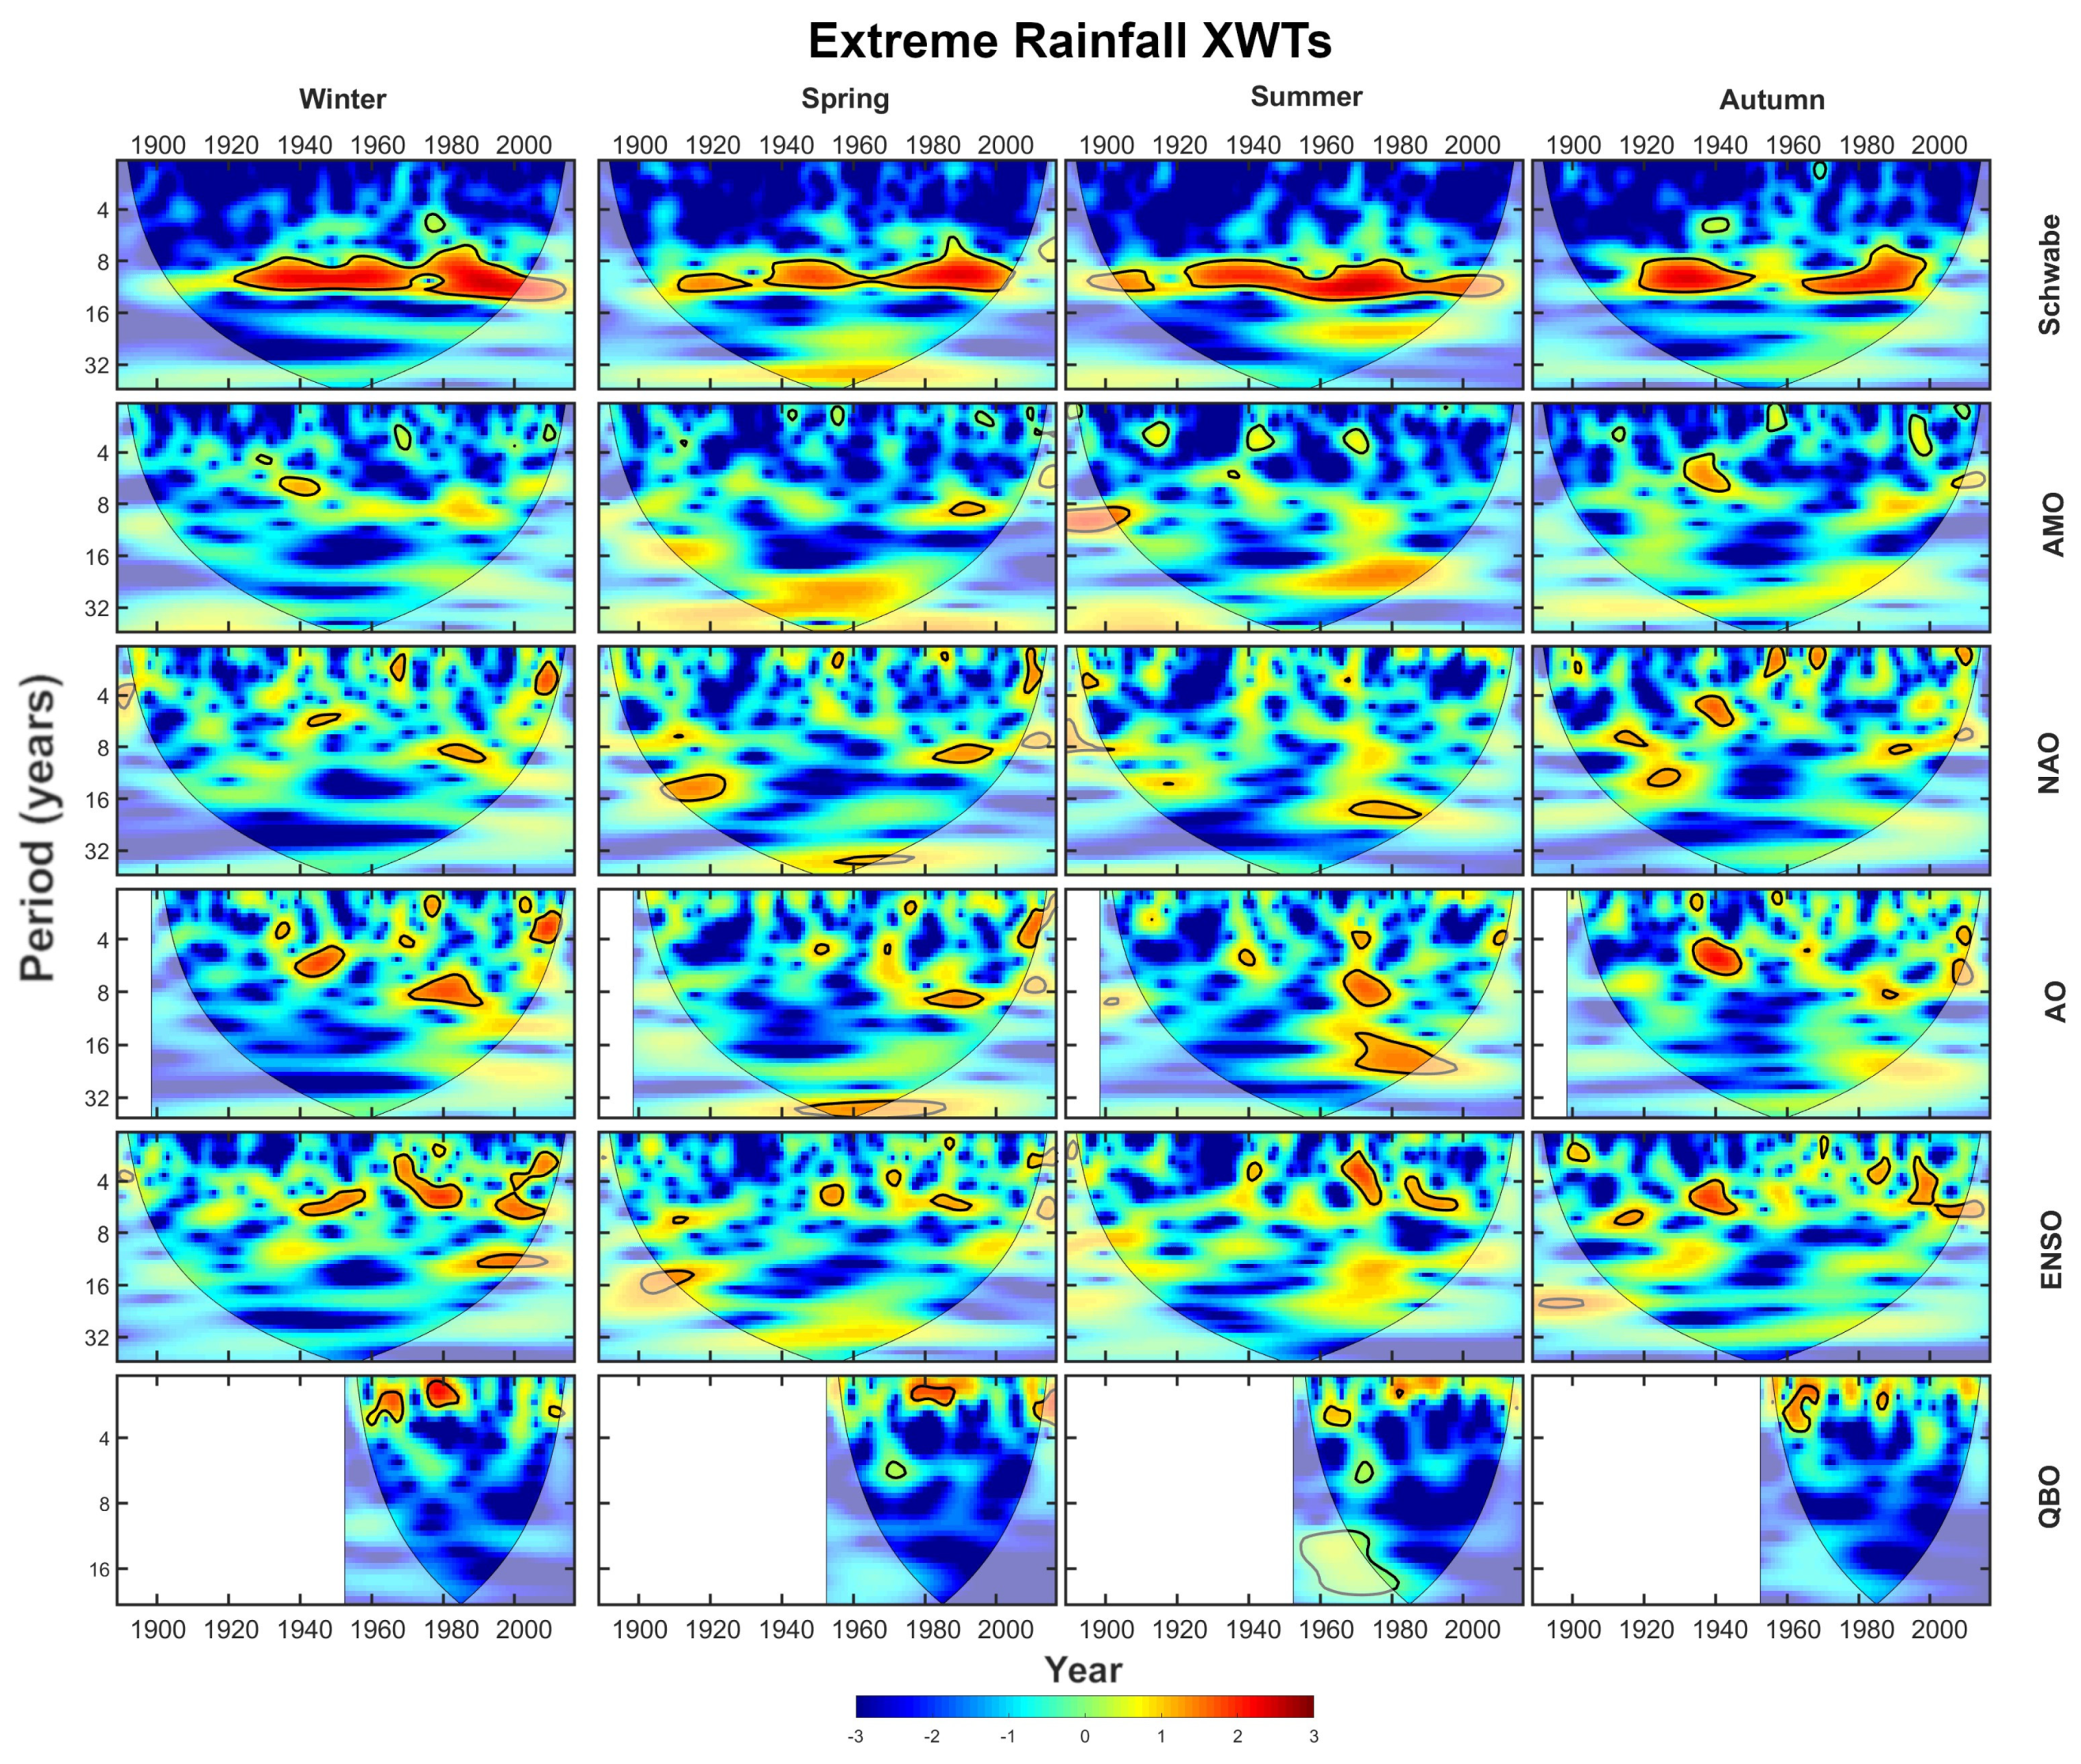
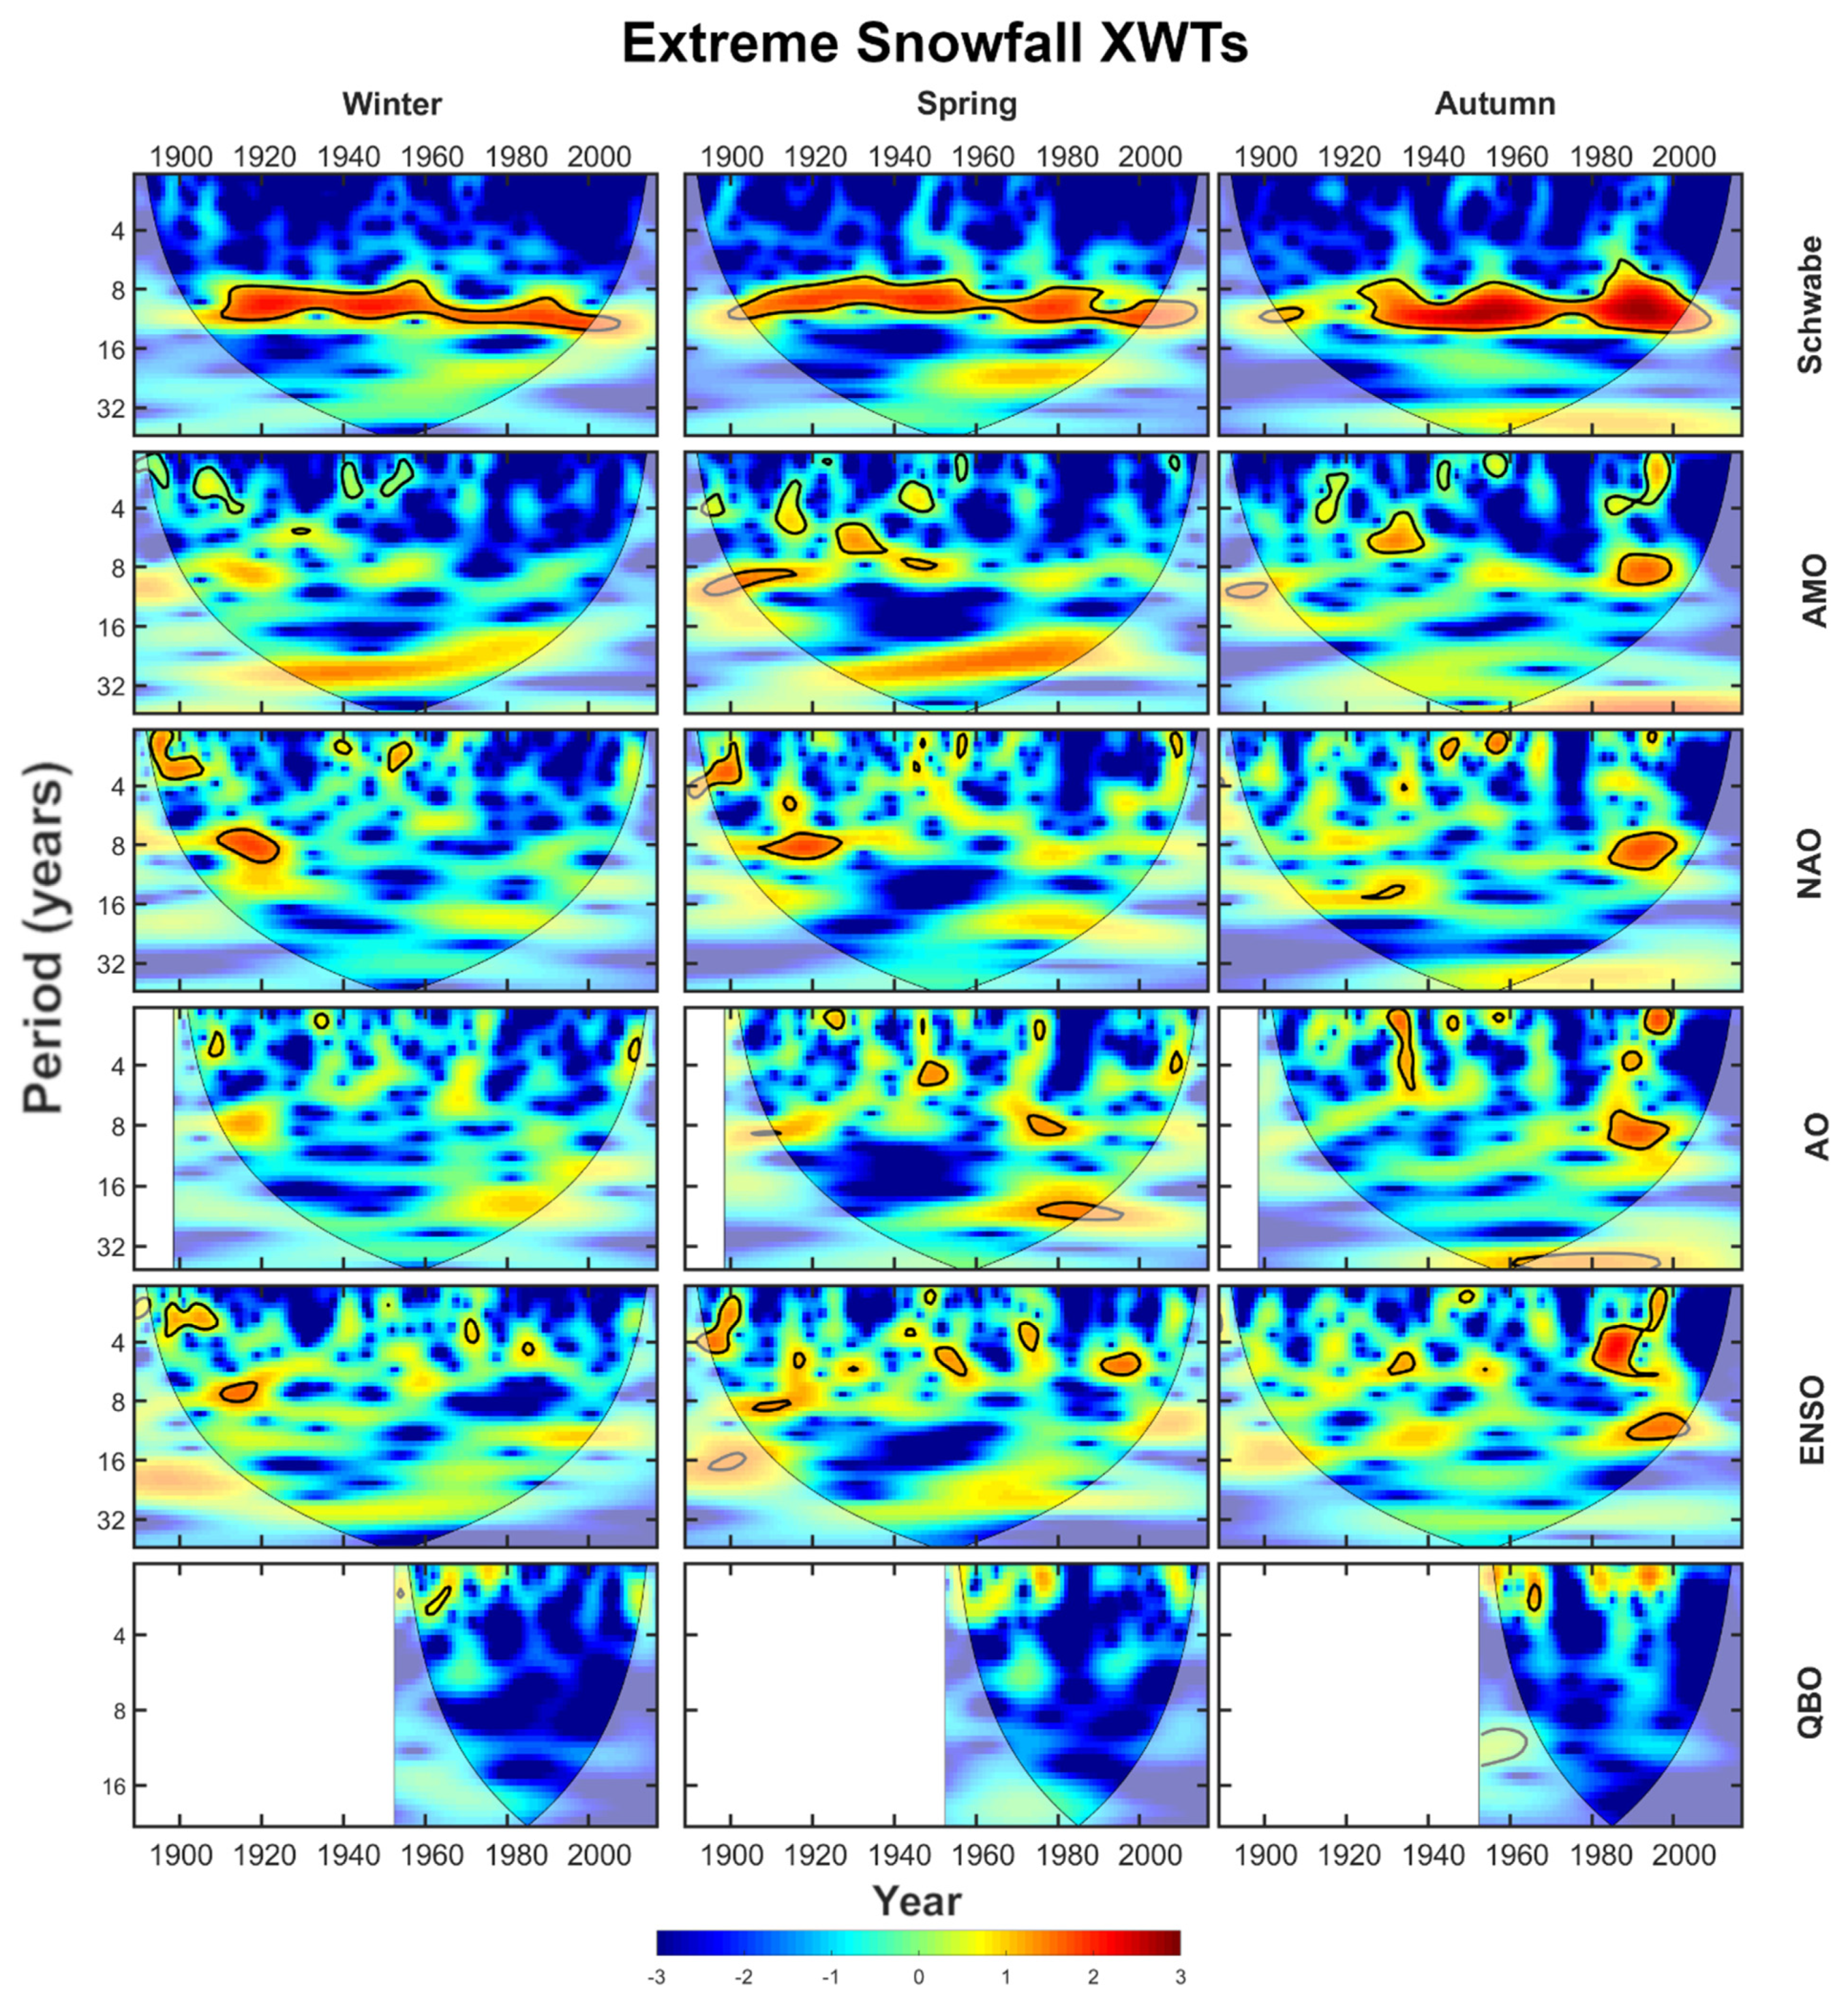
4.2.3. Cross Wavelet Transforms
5. Discussion
5.1. A Warmer, Wetter Climate
- A decrease in extreme minimum temperature events across all seasons.
- An increase in extreme maximum temperature events in the winter.
- A decrease of extreme maximum temperature events in the summer.
- A decrease in extreme snowfall events in the winter.
5.2. Periodic Trends Highly Influenced by Regional Climate Cycles
6. Conclusions
Supplementary Materials
Author Contributions
Funding
Data Availability Statement
Acknowledgments
Conflicts of Interest
Abbreviations
| SSC | Schwabe Solar Cycle |
| AMO | Atlantic Multidecadal Oscillation |
| NAO | North Atlantic Oscillation |
| AO | Arctic Oscillation |
| ENSO El | Niño Southern Oscillation |
| QBO | Quasi-Biennial Oscillation |
| DTR | Diurnal temperature range |
| UHIE | Urban heat island effect |
References
- Fitzgerald, J. The Intergovernmental Panel on Climate Change: Taking the first steps towards a global response. South. Ill. Univ. Law J. 1989, 14, 231. [Google Scholar]
- Smith, H.A. Political parties and Canadian climate change policy. Int. J. 2009, 64, 47–66. [Google Scholar] [CrossRef]
- Boyd, B. Working together on climate change: Policy transfer and convergence in four Canadian provinces. Publius J. Fed. 2017, 47, 546–571. [Google Scholar] [CrossRef]
- Zhang, X.; Vincent, L.A.; Hogg, W.; Niitsoo, A. Temperature and precipitation trends in Canada during the 20th century. Atmos. Ocean. 2000, 38, 395–429. [Google Scholar] [CrossRef]
- Zhang, X.; Hogg, W.; Mekis, É. Spatial and temporal characteristics of heavy precipitation events over Canada. J. Clim. 2001, 14, 1923–1936. [Google Scholar] [CrossRef]
- Bonsal, B.; Zhang, X.; Vincent, L.; Hogg, W. Characteristics of daily and extreme temperatures over Canada. J. Clim. 2001, 14, 1959–1976. [Google Scholar] [CrossRef]
- Bonsal, B.R.; Prowse, T.D.; Duguay, C.R.; Lacroix, M.P. Impacts of large-scale teleconnections on freshwater-ice break/freeze-up dates over Canada. J. Hydrol. 2006, 330, 340–353. [Google Scholar] [CrossRef]
- Coulibaly, P. Spatial and temporal variability of Canadian seasonal precipitation (1900–2000). Adv. Water Resour. 2006, 29, 1846–1865. [Google Scholar] [CrossRef]
- Shephard, M.W.; Mekis, E.; Morris, R.J.; Feng, Y.; Zhang, X.; Kilcup, K.; Fleetwood, R. Trends in Canadian short-duration extreme rainfall: Including an intensity–duration–frequency perspective. Atmos. Ocean. 2014, 52, 398–417. [Google Scholar] [CrossRef]
- Ning, L.; Bradley, R.S. Winter climate extremes over the northeastern United States and southeastern Canada and teleconnections with large-scale modes of climate variability. J. Clim. 2015, 28, 2475–2493. [Google Scholar] [CrossRef]
- Vincent, L.; Zhang, X.; Mekis, É.; Wan, H.; Bush, E. Changes in Canada’s climate: Trends in indices based on daily temperature and precipitation data. Atmos. Ocean. 2018, 56, 332–349. [Google Scholar] [CrossRef]
- Christensen, J.H.; Kanikicharla, K.K.; Aldrian, E.; An, S.I.; Cavalcanti, I.F.A.; de Castro, M.; Dong, W.; Goswami, P.; Hall, A.; Kanyanga, J.K.; et al. Climate phenomena and their relevance for future regional climate change. In Climate Change 2013 the Physical Science Basis: Working Group I Contribution to the Fifth Assessment Report of the Intergovernmental Panel on Climate Change; Cambridge University Press: Cambridge, UK, 2013; pp. 1217–1308. [Google Scholar]
- Lennard, C.; Nikulin, G.; Dosio, A.; Moufouma-Okia, W. On the need for regional climate information over Africa under varying levels of global warming. Environ. Res. Lett. 2018, 13, 060401. [Google Scholar] [CrossRef]
- Bootsma, A. Long term (100 yr) climatic trends for agriculture at selected locations in Canada. Clim. Change 1994, 26, 65–88. [Google Scholar] [CrossRef]
- Prokoph, A.; Patterson, R.T. Application of wavelet and regression analysis in assessing temporal and geographic climate variability: Eastern Ontario, Canada as a case study. Atmos. Ocean. 2004, 42, 201–212. [Google Scholar] [CrossRef]
- Adamowski, J.; Prokoph, A. Assessing the impacts of the urban heat island effect on streamflow patterns in Ottawa, Canada. J. Hydrol. 2013, 496, 225–237. [Google Scholar] [CrossRef]
- Ahmed, S.I.; Rudra, R.; Dickinson, T.; Ahmed, M. Trend and periodicity of temperature time series in Ontario. Am. J. Clim. Change 2014, 3, 272. [Google Scholar] [CrossRef]
- Catling, P.M. Climate Warming as an Explanation for the Recent Northward Range Extension of Two Dragonflies, Pachydiplax longipennis and Perithemis tenera, into the Ottawa Valley, Eastern Ontario. Can. Field Nat. 2016, 130, 122–132. [Google Scholar] [CrossRef]
- Spears, T. An Inconvenient Ottawa? What Will Climate Change Actually Mean for the Nation’s Capital? 2017. Available online: https://ottawacitizen.com/news/local-news/an-inconvenient-ottawa-what-will-climate-change-actually-mean-for-the-nations-capital (accessed on 25 February 2022).
- Osman, L. Ottawa’s Wild Weather ‘The Tip of the Iceberg’, Some Experts Say|CBC News. 2019. Available online: https://www.cbc.ca/news/canada/ottawa/tornado-climatologist-june-3-1.5159862 (accessed on 25 February 2022).
- City of Ottawa. Climate Change Master Plan. Technical Report, A Report by Ottawa’s Planning, Development, and Construction Division. 2020. Available online: https://documents.ottawa.ca/sites/documents/files/climate_change_mplan_en.pdf (accessed on 25 February 2022).
- Kwon, H.H.; Lall, U.; Moon, Y.I.; Khalil, A.F.; Ahn, H. Episodic interannual climate oscillations and their influence on seasonal rainfall in the Everglades National Park. Water Resour. Res. 2006, 42. [Google Scholar] [CrossRef]
- Ogurtsov, M.G.; Raspopov, O.M.; Helama, S.; Oinonen, M.; Lindholm, M.; Jungner, H.; Meriläinen, J. Climatic variability along a north–south transect of Finland over the last 500 years: Signature of solar influence or internal climate oscillations? Geogr. Ann. Ser. A Phys. Geogr. 2008, 90, 141–150. [Google Scholar] [CrossRef]
- Bonsal, B.; Shabbar, A. Large-Scale Climate Oscillations Influencing Canada, 1900–2008; Canadian Councils of Resource Ministers: Montreal, QC, Canada, 2011. [Google Scholar]
- Chandran, A.; Basha, G.; Ouarda, T. Influence of climate oscillations on temperature and precipitation over the United Arab Emirates. Int. J. Climatol. 2016, 36, 225–235. [Google Scholar] [CrossRef]
- Thiombiano, A.N.; El Adlouni, S.; St-Hilaire, A.; Ouarda, T.B.; El-Jabi, N. Nonstationary frequency analysis of extreme daily precipitation amounts in Southeastern Canada using a peaks-over-threshold approach. Theor. Appl. Climatol. 2017, 129, 413–426. [Google Scholar] [CrossRef]
- Yang, Y.; Gan, T.Y.; Tan, X. Spatiotemporal changes in precipitation extremes over Canada and their teleconnections to large-scale climate patterns. J. Hydrometeorol. 2019, 20, 275–296. [Google Scholar] [CrossRef]
- Lassen, K.; Friis-Christensen, E. Variability of the solar cycle length during the past five centuries and the apparent association with terrestrial climate. J. Atmos. Terr. Phys. 1995, 57, 835–845. [Google Scholar] [CrossRef]
- Rind, D.; Lean, J.; Lerner, J.; Lonergan, P.; Leboissitier, A. Exploring the stratospheric/tropospheric response to solar forcing. J. Geophys. Res. Atmos. 2008, 113. [Google Scholar] [CrossRef]
- Lockwood, M. Solar influence on global and regional climates. Surv. Geophys. 2012, 33, 503–534. [Google Scholar] [CrossRef]
- Hathaway, D.H. The Solar Cycle. Living Rev. Sol. Phys. 2015, 12, 4. [Google Scholar] [CrossRef]
- Schlesinger, M.E.; Ramankutty, N. An oscillation in the global climate system of period 65–70 years. Nature 1994, 367, 723–726. [Google Scholar] [CrossRef]
- Enfield, D.B.; Mestas-Nuñez, A.M.; Trimble, P.J. The Atlantic multidecadal oscillation and its relation to rainfall and river flows in the continental US. Geophys. Res. Lett. 2001, 28, 2077–2080. [Google Scholar] [CrossRef]
- Knight, J.R.; Folland, C.K.; Scaife, A.A. Climate impacts of the Atlantic multidecadal oscillation. Geophys. Res. Lett. 2006, 33. [Google Scholar] [CrossRef]
- Dima, M.; Lohmann, G. A hemispheric mechanism for the Atlantic Multidecadal Oscillation. J. Clim. 2007, 20, 2706–2719. [Google Scholar] [CrossRef]
- Feng, S.; Hu, Q.; Oglesby, R.J. Influence of Atlantic sea surface temperatures on persistent drought in North America. Clim. Dyn. 2011, 37, 569–586. [Google Scholar] [CrossRef]
- Knudsen, M.F.; Seidenkrantz, M.S.; Jacobsen, B.H.; Kuijpers, A. Tracking the Atlantic Multidecadal Oscillation through the last 8000 years. Nat. Commun. 2011, 2, 1–8. [Google Scholar] [CrossRef] [PubMed]
- Ruiz-Barradas, A.; Nigam, S.; Kavvada, A. The Atlantic Multidecadal Oscillation in twentieth century climate simulations: Uneven progress from CMIP3 to CMIP5. Clim. Dyn. 2013, 41, 3301–3315. [Google Scholar] [CrossRef]
- Alexander, M.A.; Kilbourne, K.H.; Nye, J.A. Climate variability during warm and cold phases of the Atlantic Multidecadal. Oscillation (AMO) 1871–2008. J. Mar. Syst. 2014, 133, 14–26. [Google Scholar] [CrossRef]
- Hurrell, J.W. Decadal trends in the North Atlantic Oscillation: Regional temperatures and precipitation. Science 1995, 269, 676–679. [Google Scholar] [CrossRef]
- Hurrell, J.W.; Kushnir, Y.; Visbeck, M. The North Atlantic Oscillation. Science 2001, 291, 603–605. [Google Scholar] [CrossRef]
- Hurrell, J.W.; Kushnir, Y.; Ottersen, G.; Visbeck, M. An overview of the North Atlantic oscillation. Geophys. Monogr. Am. Geophys. Union 2003, 134, 1–36. [Google Scholar]
- Olsen, J.; Anderson, N.J.; Knudsen, M.F. Variability of the North Atlantic Oscillation over the past 5200 years. Nat. Geosci. 2012, 5, 808–812. [Google Scholar] [CrossRef]
- Deser, C. On the teleconnectivity of the Arctic Oscillation. Geophys. Res. Lett. 2000, 27, 779–782. [Google Scholar] [CrossRef]
- Ambaum, M.H.; Hoskins, B.J.; Stephenson, D.B. Arctic oscillation or North Atlantic oscillation? J. Clim. 2001, 14, 3495–3507. [Google Scholar] [CrossRef]
- Rogers, J.; McHugh, M. On the separability of the North Atlantic oscillation and Arctic oscillation. Clim. Dyn. 2002, 19, 599–608. [Google Scholar]
- Li, Z.; Manson, A.H.; Li, Y.; Meek, C. Circulation characteristics of persistent cold spells in central–eastern North America. J. Meteorol. Res. 2017, 31, 250–260. [Google Scholar] [CrossRef]
- Philander, S.G.H. El Nino southern oscillation phenomena. Nature 1983, 302, 295. [Google Scholar] [CrossRef]
- Ropelewski, C.F.; Halpert, M.S. North American precipitation and temperature patterns associated with the El Niño/Southern. Oscillation (ENSO). Mon. Weather. Rev. 1986, 114, 2352–2362. [Google Scholar] [CrossRef]
- Philander, S.G. El Niño, La Niña, and the Southern Oscillation; Academic Press: Cambridge, MA, USA, 1989. [Google Scholar]
- Moy, C.M.; Seltzer, G.O.; Rodbell, D.T.; Anderson, D.M. Variability of El Niño/Southern Oscillation activity at millennial timescales during the Holocene epoch. Nature 2002, 420, 162. [Google Scholar] [CrossRef] [PubMed]
- Hu, Q.; Feng, S. AMO-and ENSO-driven summertime circulation and precipitation variations in North America. J. Clim. 2012, 25, 6477–6495. [Google Scholar] [CrossRef]
- Lindzen, R.S.; Holton, J.R. A theory of the quasi-biennial oscillation. J. Atmos. Sci. 1968, 25, 1095–1107. [Google Scholar] [CrossRef]
- Dunkerton, T.J. The role of gravity waves in the quasi-biennial oscillation. J. Geophys. Res. Atmos. 1997, 102, 26053–26076. [Google Scholar] [CrossRef]
- Baldwin, M.; Gray, L.; Dunkerton, T.; Hamilton, K.; Haynes, P.; Randel, W.; Holton, J.; Alexander, M.; Hirota, I.; Horinouchi, T.; et al. The quasi-biennial oscillation. Rev. Geophys. 2001, 39, 179–229. [Google Scholar] [CrossRef]
- Chattopadhyay, J.; Bhatla, R. Possible influence of QBO on teleconnections relating Indian summer monsoon rainfall and sea-surface temperature anomalies across the equatorial pacific. Int. J. Climatol. A J. R. Meteorol. Soc. 2002, 22, 121–127. [Google Scholar] [CrossRef]
- Sharma, S.; Magnuson, J.J. Oscillatory dynamics do not mask linear trends in the timing of ice breakup for Northern Hemisphere lakes from 1855 to 2004. Clim. Change 2014, 124, 835–847. [Google Scholar] [CrossRef]
- Patterson, R.T.; Swindles, G.T. Influence of ocean–atmospheric oscillations on lake ice phenology in eastern North America. Clim. Dyn. 2015, 45, 2293–2308. [Google Scholar] [CrossRef]
- Gray, L.J.; Anstey, J.A.; Kawatani, Y.; Lu, H.; Osprey, S.; Schenzinger, V. Surface impacts of the quasi biennial oscillation. Atmos. Chem. Phys. 2018, 18, 8227–8247. [Google Scholar] [CrossRef]
- United Nations. Climate Trends and Variations Bulletin for Canada; Government of Canada: Ottawa, ON, Canada, 1998.
- Oke, T.R.; Maxwell, G.B. Urban heat island dynamics in Montreal and Vancouver. Atmos. Environ. 1975, 9, 191–200. [Google Scholar] [CrossRef]
- Akbari, H.; Konopacki, S. Energy effects of heat-island reduction strategies in Toronto, Canada. Energy 2004, 29, 191–210. [Google Scholar] [CrossRef]
- Touchaei, A.; Wang, Y. Characterizing urban heat island in Montreal (Canada)—Effect of urban morphology. Sustain. Cities Soc. 2015, 19, 395–402. [Google Scholar] [CrossRef]
- Environment and Climate Change Canada. Historical Data. Available online: https://climate.weather.gc.ca/historical_data/search_historic_data_e.html (accessed on 20 January 2020).
- Cleveland, W.S. Robust locally weighted regression and smoothing scatterplots. J. Am. Stat. Assoc. 1979, 74, 829–836. [Google Scholar] [CrossRef]
- Cleveland, W.S. LOWESS: A program for smoothing scatterplots by robust locally weighted regression. Am. Stat. 1981, 35, 54. [Google Scholar] [CrossRef]
- Statistics Canada. Census Profile, 2016 Census Chelsea, Municipalité [Census Subdivision], Quebec [Province]. Available online: https://www12.statcan.gc.ca/census-recensement/2016/dp-pd/prof/details/page.cfm?Lang=E&Geo1=CSD&Code1=2482025&Geo2=PR&Code2=24&Data=Count&SearchType=Begins&SearchPR=01&B1=All (accessed on 11 November 2020).
- Statistics Canada. Census Profile, 2016 Census Belleville [Population Centre], Ontario [Province]. Available online: http://www12.statcan.ca/census-recensement/2011/dp-pd/prof/details/page.cfm?Lang=E&Geo1=CMA&Code1=522&Geo2=PR&Code2=35&Data=Count&SearchText=Belleville&SearchType=Begins&SearchPR=01&B1=All&Custom=&TABID=1 (accessed on 11 November 2020).
- Statistics Canada. Census Profile, 2016 Census Morrisburg [Population centre], Ontario [Province]. Available online: https://www12.statcangc.ca/census-recensement/2016/dp-pd/prof/details/page.cfm?Lang=E&Geo1=POPC&Code1=0556&Geo2=PR&Code2=35&SearchText=Morrisburg&SearchType=Begins&SearchPR=01&B1=All&GeoLevel=PR&GeoCode=0556&TABID=1&type=0 (accessed on 11 November 2020).
- Environment Canada. World Population Prospects 2019, Online Edition. Rev. 1; Department of Economic and Social Affairs, Population Division, United Nations: New York, NY, USA, 2019.
- Andrade, J.; Estévez-Pérez, M. Statistical comparison of the slopes of two regression lines: A tutorial. Anal. Chim. Acta 2014, 838, 1–12. [Google Scholar] [CrossRef]
- Frich, P.; Alexander, L.V.; Della-Marta, P.; Gleason, B.; Haylock, M.; Tank, A.K.; Peterson, T. Observed coherent changes in climatic extremes during the second half of the twentieth century. Clim. Res. 2002, 19, 193–212. [Google Scholar] [CrossRef]
- Linderholm, H.W. Growing season changes in the last century. Agric. For. Meteorol. 2006, 137, 1–14. [Google Scholar] [CrossRef]
- Lin, X.; Harrington, J.; Ciampitti, I.; Gowda, P.; Brown, D.; Kisekka, I. Kansas trends and changes in temperature, precipitation, drought, and frost-free days from the 1890s to 2015. J. Contemp. Water Res. Educ. 2017, 162, 18–30. [Google Scholar] [CrossRef]
- Government of Canada. Water Level and Flow; Government of Canada: Ottawa, ON, Canada, 2020.
- Rahmstorf, S.; Coumou, D. Increase of extreme events in a warming world. Proc. Natl. Acad. Sci. USA 2011, 108, 17905–17909. [Google Scholar] [CrossRef] [PubMed]
- Frei, A.; Kunkel, K.E.; Matonse, A. The seasonal nature of extreme hydrological events in the northeastern United States. J. Hydrometeorol. 2015, 16, 2065–2085. [Google Scholar] [CrossRef]
- Yagouti, A.; Boulet, G.; Vincent, L.; Vescovi, L.; Mekis, E. Observed changes in daily temperature and precipitation indices for southern Québec, 1960–2005. Atmos. Ocean. 2008, 46, 243–256. [Google Scholar] [CrossRef]
- Tan, X.; Gan, T.Y. Non-stationary analysis of the frequency and intensity of heavy precipitation over Canada and their relations to large-scale climate patterns. Clim. Dyn. 2017, 48, 2983–3001. [Google Scholar] [CrossRef]
- Dorothée. Red Noise Confidence Levels. Available online: https://www.mathworks.com/matlabcentral/fileexchange/45539-rednoise_confidencelevels (accessed on 11 February 2020).
- Thomson, D.J. Spectrum estimation and harmonic analysis. Proc. IEEE 1982, 70, 1055–1096. [Google Scholar] [CrossRef]
- Schulz, M.; Mudelsee, M. REDFIT: Estimating red-noise spectra directly from unevenly spaced paleoclimatic time series. Comput. Geosci. 2002, 28, 421–426. [Google Scholar] [CrossRef]
- Grinsted, A.; Moore, J.C.; Jevrejeva, S. Application of the cross wavelet transform and wavelet coherence to geophysical time series. Nonlinear Processes Geophys. 2004, 11, 561–566. [Google Scholar] [CrossRef]
- Crosta, X.; Debret, M.; Denis, D.; Courty, M.; Ther, O. Holocene long-and short-term climate changes off Adélie Land, East Antarctica. Geochem. Geophys. Geosyst. 2007, 8. [Google Scholar] [CrossRef]
- Sunspot Index and Long Term Solar Observations. Total Sunspot Number. Royal Observatory of Belgium, Brussels, Belgium. Available online: http://www.sidc.be/silso (accessed on 25 February 2022).
- Trenberth, K.; Zhang, R.; National Center for Atmospheric Research Staff. The Climate Data Guide: Atlantic Multi-Decadal Oscillation (AMO). Available online: https://climatedataguide.ucar.edu/climate-data/atlantic-multi-decadal-oscillation-amo (accessed on 25 February 2022).
- Hurrell, J.; National Center for Atmospheric Research Staff. The Climate Data Guide: Hurrell North Atlantic Oscillation. (NAO) Index (Station-Based). Available online: https://climatedataguide.ucar.edu/climate-data/hurrell-north-atlantic-oscillation-nao-index-station-based (accessed on 25 February 2022).
- National Center for Atmospheric Research Staff. The Climate Data Guide: Hurrell Wintertime SLP-Based Northern Annular Mode (NAM) Index. Available online: https://climatedataguide.ucar.edu/climate-data/hurrell-wintertime-slp-based-northern-annular-mode-nam-index (accessed on 25 February 2022).
- Trenberth, K.; National Center for Atmospheric Research Staff. The Climate Data Guide: Nino SST Indices (Nino 1 + 2, 3, 3.4, 4; ONI and TNI). Available online: https://climatedataguide.ucar.edu/climate-data/nino-sst-indices-nino-12-3-34-4-oni-and-tni (accessed on 25 February 2022).
- National Center for Atmospheric Research Staff. The Climate Data Guide: QBO: Quasi-Biennial Oscillation). Available online: https://climatedataguide.ucar.edu/climate-data/qbo-quasi-biennial-oscillation (accessed on 25 February 2022).
- Groisman, P.Y.; Easterling, D.R. Variability and trends of total precipitation and snowfall over the United States and Canada. J. Clim. 1994, 7, 184–205. [Google Scholar] [CrossRef]
- Karoly, D.J.; Wu, Q. Detection of regional surface temperature trends. J. Clim. 2005, 18, 4337–4343. [Google Scholar] [CrossRef][Green Version]
- Millett, B.; Johnson, W.C.; Guntenspergen, G. Climate trends of the North American prairie pothole region 1906–2000. Clim. Change 2009, 93, 243–267. [Google Scholar] [CrossRef]
- Polley, H.W.; Briske, D.D.; Morgan, J.A.; Wolter, K.; Bailey, D.W.; Brown, J.R. Climate change and North American rangelands: Trends, projections, and implications. Rangel. Ecol. Manag. 2013, 66, 493–511. [Google Scholar] [CrossRef]
- Hegerl, G.C.; Brönnimann, S.; Schurer, A.; Cowan, T. The early 20th century warming: Anomalies, causes, and consequences. Wiley Interdiscip. Rev. Clim. Change 2018, 9, e522. [Google Scholar] [CrossRef]
- Biskaborn, B.K.; Smith, S.L.; Noetzli, J.; Matthes, H.; Vieira, G.; Streletskiy, D.A.; Schoeneich, P.; Romanovsky, V.E.; Lewkowicz, A.G.; Abramov, A.; et al. Permafrost is warming at a global scale. Nat. Commun. 2019, 10, 1–11. [Google Scholar] [CrossRef] [PubMed]
- Chen, Y.; She, Y. Long-term variations of river ice breakup timing across Canada and its response to climate change. Cold Reg. Sci. Technol. 2020, 176, 103091. [Google Scholar] [CrossRef]
- Nalley, D.; Adamowski, J.; Khalil, B.; Ozga-Zielinski, B. Trend detection in surface air temperature in Ontario and Quebec, Canada during 1967–2006 using the discrete wavelet transform. Atmos. Res. 2013, 132, 375–398. [Google Scholar] [CrossRef]
- Murfitt, J.; Brown, L.C. Lake ice and temperature trends for Ontario and Manitoba: 2001 to 2014. Hydrol. Processes 2017, 31, 3596–3609. [Google Scholar] [CrossRef]
- Karl, T.R.; Kukla, G.; Gavin, J. Relationship between decreased temperature range and precipitation trends in the United States and Canada, 1941–1980. J. Clim. Appl. Meteorol. 1986, 25, 1878–1886. [Google Scholar] [CrossRef]
- Gan, T.Y. Trends in air temperature and precipitation for Canada and north-eastern USA. Int. J. Climatol. 1995, 15, 1115–1134. [Google Scholar] [CrossRef]
- Easterling, D.R.; Wallis, T.W.; Lawrimore, J.H.; Heim, R.R., Jr. Effects of temperature and precipitation trends on US drought. Geophys. Res. Lett. 2007, 34. [Google Scholar] [CrossRef]
- Assani, A.; Landry, R.; Laurencelle, M. Comparison of interannual variability modes and trends of seasonal precipitation and streamflow in southern Quebec (Canada). River Res. Appl. 2012, 28, 1740–1752. [Google Scholar] [CrossRef]
- Nalley, D.; Adamowski, J.; Khalil, B. Using discrete wavelet transforms to analyze trends in streamflow and precipitation in Quebec and Ontario (1954–2008). J. Hydrol. 2012, 475, 204–228. [Google Scholar] [CrossRef]
- Mekis, É.; Vincent, L.A. An overview of the second generation adjusted daily precipitation dataset for trend analysis in Canada. Atmos. Ocean. 2011, 49, 163–177. [Google Scholar] [CrossRef]
- McNeil, D. An Independent Review of the 2019 Flood Events in Ontario. Technical report, A Report to the Hon. John Yakabuski, Ontario Minister of Natural Resources and Forestry. 2019. Available online: https://files.ontario.ca/mnrf-english-ontario-special-advisor-on-flooding-report-2019-11-25.pdf (accessed on 25 February 2022).
- Cunderlik, J.M.; Simonovic, S.P. Hydrological extremes in a southwestern Ontario river basin under future climate conditions/Extrêmes hydrologiques dans un basin versant du sud-ouest de l’Ontario sous conditions climatiques futures. Hydrol. Sci. J. 2005, 50. [Google Scholar] [CrossRef]
- Thistlethwaite, J.; Henstra, D. Municipal flood risk sharing in Canada: A policy instrument analysis. Can. Water Resources. J. Rev. Can. Des Ressour. Hydr. 2017, 42, 349–363. [Google Scholar] [CrossRef]
- City Of Ottawa. Growth Projections for the New Official Plan: Methods and Assumptions for Population, Housing and Employment 2018 to 2046; Technical Report; City of Ottawa: Ottawa, ON, Canada, 2019. [Google Scholar]
- Hansen, J.; Sato, M.; Ruedy, R. Long-term changes of the diurnal temperature cycle: Implications about mechanisms of global climate change. Atmos. Res. 1995, 37, 175–209. [Google Scholar] [CrossRef]
- Price, C.; Michaelides, S.; Pashiardis, S.; Alpert, P. Long term changes in diurnal temperature range in Cyprus. Atmos. Res. 1999, 51, 85–98. [Google Scholar] [CrossRef]
- Braganza, K.; Karoly, D.J.; Arblaster, J.M. Diurnal temperature range as an index of global climate change during the twentieth century. Geophys. Res. Lett. 2004, 31. [Google Scholar] [CrossRef]
- Vanos, J.; Cakmak, S. Changing air mass frequencies in Canada: Potential links and implications for human health. Int. J. Biometeorol. 2014, 58, 121–135. [Google Scholar] [CrossRef]
- Aguado, E.; Burt, J.E. Understanding Weather & Climate, 5th ed.; Pearson Prentice Hall: Upper Saddle River, NJ, USA, 2010. [Google Scholar]
- Allen, S.M.; Gough, W.A.; Mohsin, T. Changes in the frequency of extreme temperature records for Toronto, Ontario, Canada. Theor. Appl. Climatol. 2015, 119, 481–491. [Google Scholar] [CrossRef]
- Soulis, E.; Sarhadi, A.; Tinel, M.; Suthar, M. Extreme precipitation time trends in Ontario, 1960–2010. Hydrol. Processes 2016, 30, 4090–4100. [Google Scholar] [CrossRef]
- Ottawa Public Health. City of Ottawa Urban Heat Island Map [map]. Technical Report, City of Ottawa. 2019. Available online: https://www.ottawapublichealth.ca/en/public-health-topics/resources/Documents/Urban-Island-Heat-Map-1-City-Wide---EN.pdf (accessed on 25 February 2022).
- Zhao, H.; Higuchi, K.; Waller, J.; Auld, H.; Mote, T. The impacts of the PNA and NAO on annual maximum snowpack over southern Canada during 1979–2009. Int. J. Climatol. 2013, 33, 388–395. [Google Scholar] [CrossRef]
- Nalley, D.; Adamowski, J.; Khalil, B.; Biswas, A. Inter-annual to inter-decadal streamflow variability in Quebec and Ontario in relation to dominant large-scale climate indices. J. Hydrol. 2016, 536, 426–446. [Google Scholar] [CrossRef]
- Champagne, O.; Arain, M.A.; Coulibaly, P. Atmospheric circulation amplifies shift of winter streamflow in Southern Ontario. J. Hydrol. 2019, 578, 124051. [Google Scholar] [CrossRef]
- Champagne, O.; Leduc, M.; Coulibaly, P.; Arain, M.A. Winter hydrometeorological extreme events modulated by large-scale atmospheric circulation in southern Ontario. Earth Syst. Dyn. 2020, 11, 301–318. [Google Scholar] [CrossRef]
- Vines, R. Rainfall patterns in the eastern United States. Clim. Change 1984, 6, 79–98. [Google Scholar] [CrossRef]
- Currie, R.G. Luni-solar 18.6-and solar cycle 10–11-year signals in USA air temperature records. Int. J. Climatol. 1993, 13, 31–50. [Google Scholar] [CrossRef]
- Vines, R. Possible relationships between rainfall, crop yields and the Sunspot cycle. J. Aust. Inst. Agricutural Sci. 1977, 43, 3–13. [Google Scholar]
- Vines, R. Analyses of South African rainfall. South Afr. J. Sci. 1980, 76, 404–409. [Google Scholar]
- Vines, R. Rainfall patterns in India. J. Climatol. 1986, 6, 135–148. [Google Scholar] [CrossRef]
- Currie, R.G.; O’Brien, D.P. Periodic 18.6-year and cyclic 10 to 11 year signals in northeastern United States precipitation data. J. Climatol. 1988, 8, 255–281. [Google Scholar] [CrossRef]
- Currie, R.G.; Vines, R.G. Evidence for luni–solar and solar cycle signals in Australian rainfall data. Int. J. Climatol. 1996, 16, 1243–1265. [Google Scholar] [CrossRef]
- Van Loon, H.; Shea, D.J. A probable signal of the 11-year solar cycle in the troposphere of the Northern Hemisphere. Geophys. Res. Lett. 1999, 26, 2893–2896. [Google Scholar] [CrossRef]
- Maliniemi, V.; Asikainen, T.; Mursula, K. Spatial distribution of Northern Hemisphere winter temperatures during different phases of the solar cycle. J. Geophys. Res. Atmos. 2014, 119, 9752–9764. [Google Scholar] [CrossRef]
- Laurenz, L.; Lüdecke, H.J.; Lüning, S. Influence of solar activity changes on European rainfall. J. Atmos. Sol.-Terr. Phys. 2019, 185, 29–42. [Google Scholar] [CrossRef]
- McCabe, G.J.; Palecki, M.A.; Betancourt, J.L. Pacific and Atlantic Ocean influences on multidecadal drought frequency in the United States. Proc. Natl. Acad. Sci. USA 2004, 101, 4136–4141. [Google Scholar] [CrossRef]
- Shabbar, A.; Bonsal, B. Associations between low frequency variability modes and winter temperature extremes in Canada. Atmos. Ocean. 2004, 42, 127–140. [Google Scholar]
- Zhang, L.; Wang, C.; Wu, L. Low-frequency modulation of the Atlantic warm pool by the Atlantic Multidecadal Oscillation. Clim. Dyn. 2012, 39, 1661–1671. [Google Scholar] [CrossRef]
- Kang, I.S.; No, H.h.; Kucharski, F. ENSO amplitude modulation associated with the mean SST changes in the tropical central. Pacific induced by Atlantic Multidecadal Oscillation. J. Clim. 2014, 27, 7911–7920. [Google Scholar] [CrossRef]
- Zhang, W.; Mei, X.; Geng, X.; Turner, A.G.; Jin, F.F. A nonstationary ENSO–NAO relationship due to AMO modulation. J. Clim. 2019, 32, 33–43. [Google Scholar] [CrossRef]
- Li, F.; Wang, H.; Liu, J. The strengthening relationship between Arctic Oscillation and ENSO after the mid-1990s. Int. J. Climatol. 2014, 34, 2515–2521. [Google Scholar] [CrossRef]
- Anctil, F.; Coulibaly, P. Wavelet analysis of the interannual variability in southern Québec streamflow. J. Clim. 2004, 17, 163–173. [Google Scholar] [CrossRef]
- Griffiths, M.L.; Bradley, R.S. Variations of twentieth-century temperature and precipitation extreme indicators in the northeast United States. J. Clim. 2007, 20, 5401–5417. [Google Scholar] [CrossRef]
- Tan, X.; Gan, T.Y.; Shao, D. Wavelet analysis of precipitation extremes over Canadian ecoregions and teleconnections to large-scale climate anomalies. J. Geophys. Res. Atmos. 2016, 121, 14–469. [Google Scholar] [CrossRef]
- Nastos, P.; Zerefos, C. On extreme daily precipitation totals at Athens, Greece. Adv. Geosci. 2007, 10, 59–66. [Google Scholar] [CrossRef][Green Version]
- Becker, S.; Hartmann, H.; Coulibaly, M.; Zhang, Q.; Jiang, T. Quasi periodicities of extreme precipitation events in the Yangtze River basin, China. Theor. Appl. Climatol. 2008, 94, 139–152. [Google Scholar] [CrossRef]
- Han, T.; Li, S.; Hao, X.; Guo, X. A statistical prediction model for summer extreme precipitation days over the northern central China. Int. J. Climatol. 2020, 40, 4189–4202. [Google Scholar] [CrossRef]
- Lau, K.M.; Sheu, P. Annual cycle, Quasi-Biennial Oscillation, and Southern Oscillation in global precipitation. J. Geophys. Res. Atmos. 1988, 93, 10975–10988. [Google Scholar] [CrossRef]
- Quiroz, R.S. Period modulation of the stratospheric Quasi-Biennial Oscillation. Mon. Weather. Rev. 1981, 109, 665–674. [Google Scholar] [CrossRef][Green Version]
- Hamilton, K. On the quasi-decadal modulation of the stratospheric QBO period. J. Clim. 2002, 15, 2562–2565. [Google Scholar] [CrossRef]
- Fischer, P.; Tung, K. A reexamination of the QBO period modulation by the solar cycle. J. Geophys. Res. Atmos. 2008, 113. [Google Scholar] [CrossRef]


| Climatic Oscillation | Notation | Cycle Length (Years) | Description | Common Impact on Eastern North American Climate | Citations |
|---|---|---|---|---|---|
| Schwabe Solar Cycle | SSC | ~11, 8–17 | An oscillation in the annual number of sunspots occurring, relating to total solar irradiance. The increases in total solar irradiance and UV irradiance during sunspot maxima drive dynamic changes in global stratospheric and tropospheric temperatures. | Increases in temperature during sunspot maxima, decreases in temperature during sunspot minima. Various links to precipitation and precipitation-related parameters. | [28,29,30,31] |
| Atlantic Multidecadal Oscillation | AMO | ~64, 50–90, 16–24 subharmonics | An oscillation in the circulation pattern of warm and cool Atlantic Ocean surface waters. Warm (AMO+) phases occurred from ~1925– 1965 and ~1990-present, cool (AMO−) phases occurred from ~1900–1925 and ~1965–1990. | AMO+ is associated with increased temperatures, decreased precipitation, and greater drought probability. | [32,33,34,35,36,37,38,39] |
| North Atlantic Oscillation | NAO | poorly defined, typically subdecadal–interdecadal | A localized oscillation in the sea level pressure differential between the Azores High and the Icelandic Low in the northern Atlantic Ocean. | NAO+ phases are typically associated with more moderate temperatures and wetter conditions in eastern North America, and drier, more extreme temperatures during NAO phases. | [40,41,42,43] |
| Arctic Oscillation | AO | poorly defined, typically subdecadal–interdecadal | A broad oscillation in sea-level pressure in the Northern Hemisphere, occurring in an annular band around the northern midlatitudes. During its positive phase, the AO supports a low-amplitude jet stream; during an AO- phase the jet stream becomes a high amplitude waveform. The localized NAO is a constituent of the broad-scale AO. | Brings cool Arctic air to the mid-latitudes during AO+; cool Arctic airmasses travel further south into North America during AO-. | [44,45,46,47] |
| El Niño Southern Oscillation | ENSO | 2–10 | An oscillation characterized by the changes in sea surface temperatures in the tropical Pacific. Driven by the variation in strength of tropical trade winds—causing greater or weaker degrees in the upwelling of cool, deep ocean water during El Niño (ENSO+) and La Niña (ENSO-), respectively—this oscillation influences many regions of the world via various global interactions. | Warmer, drier conditions during El Niño; cooler, wetter conditions during La Niña. | [48,49,50,51,52] |
| Quasi- Biennial Oscillation | QBO | 2.1–2.4 | The oscillation between westerly and easterly winds in the equatorial stratosphere. Air masses then propagate downward to the troposphere and are subsequently propagated poleward via interactions with surface waves. | Cooler temperatures during the westerly (QBO+) phase, warmer temperatures during the easterly (QBO−) phase. | [53,54,55,56,57,58,59] |
Publisher’s Note: MDPI stays neutral with regard to jurisdictional claims in published maps and institutional affiliations. |
© 2022 by the authors. Licensee MDPI, Basel, Switzerland. This article is an open access article distributed under the terms and conditions of the Creative Commons Attribution (CC BY) license (https://creativecommons.org/licenses/by/4.0/).
Share and Cite
Walsh, C.R.; Patterson, R.T. Precipitation and Temperature Trends and Cycles Derived from Historical 1890–2019 Weather Data for the City of Ottawa, Ontario, Canada. Environments 2022, 9, 35. https://doi.org/10.3390/environments9030035
Walsh CR, Patterson RT. Precipitation and Temperature Trends and Cycles Derived from Historical 1890–2019 Weather Data for the City of Ottawa, Ontario, Canada. Environments. 2022; 9(3):35. https://doi.org/10.3390/environments9030035
Chicago/Turabian StyleWalsh, Carling Ruth, and R. Timothy Patterson. 2022. "Precipitation and Temperature Trends and Cycles Derived from Historical 1890–2019 Weather Data for the City of Ottawa, Ontario, Canada" Environments 9, no. 3: 35. https://doi.org/10.3390/environments9030035
APA StyleWalsh, C. R., & Patterson, R. T. (2022). Precipitation and Temperature Trends and Cycles Derived from Historical 1890–2019 Weather Data for the City of Ottawa, Ontario, Canada. Environments, 9(3), 35. https://doi.org/10.3390/environments9030035