
Evaluation of Children’s Thermal Environment in Nursery School: Through the Questionnaire and Measurement of Wearable Sensors Approach

Abstract
:1. Introduction
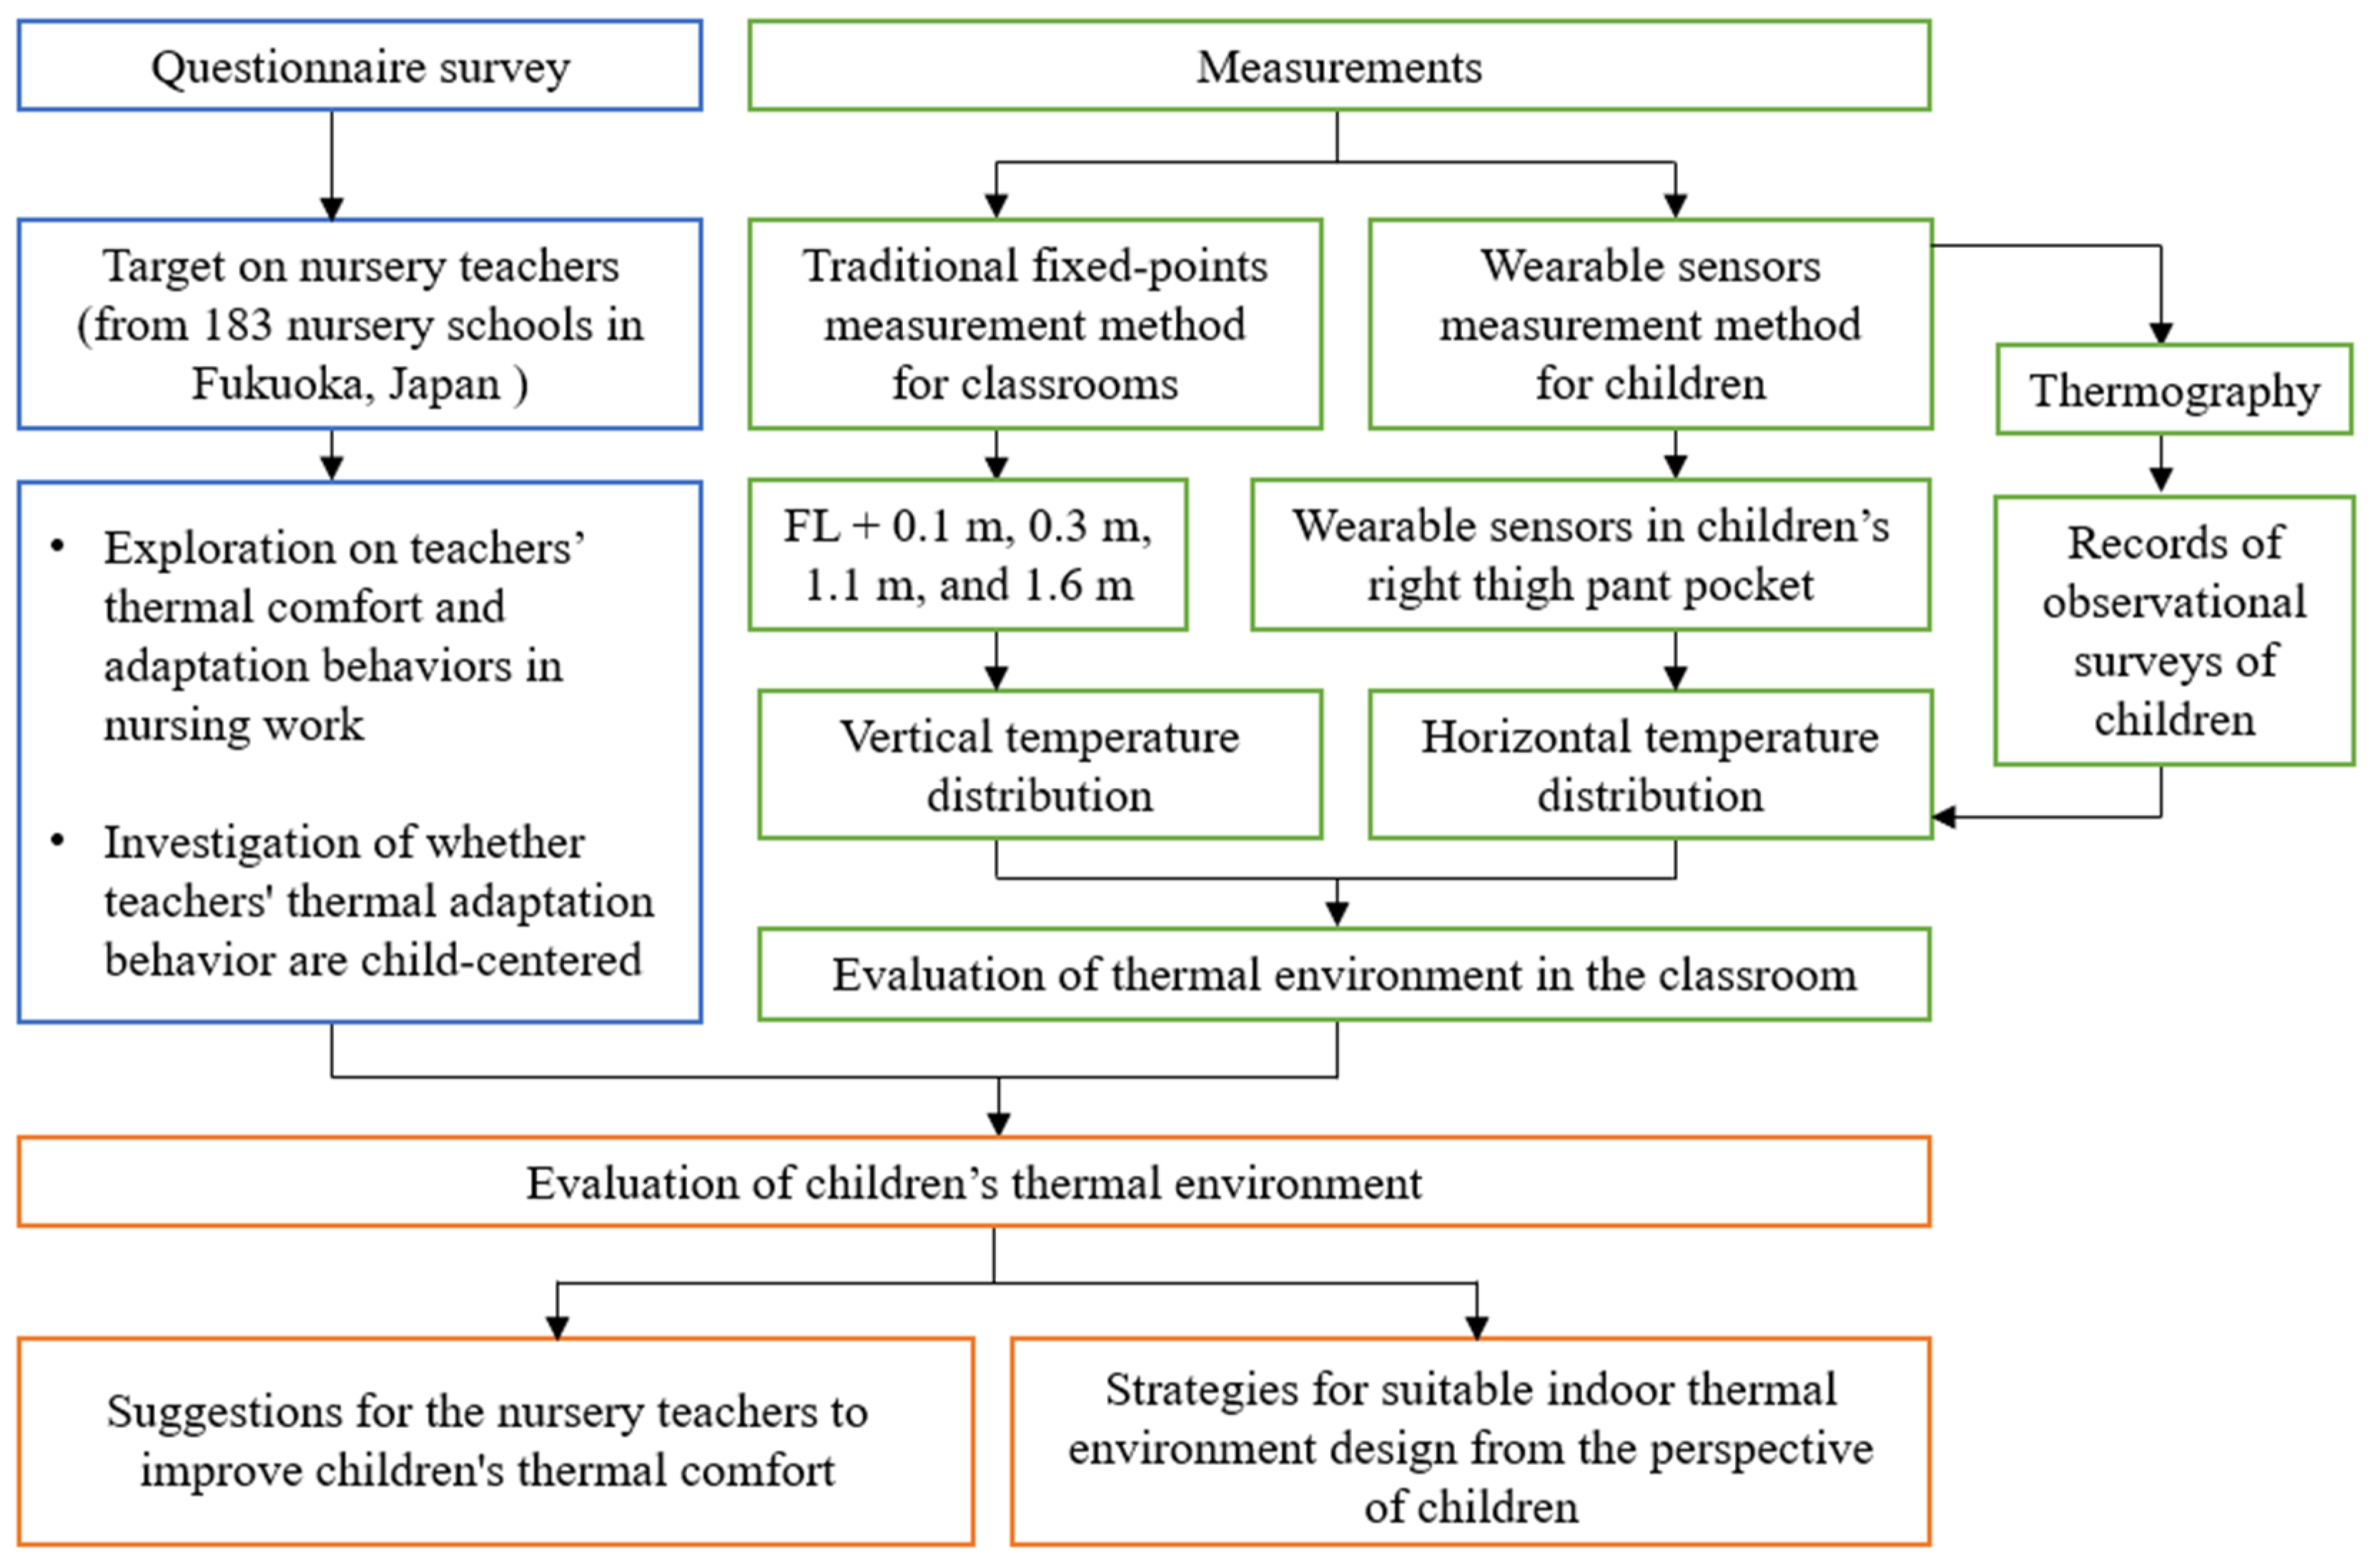
2. Methods
2.1. Questionnaire Survey
2.2. Measurements
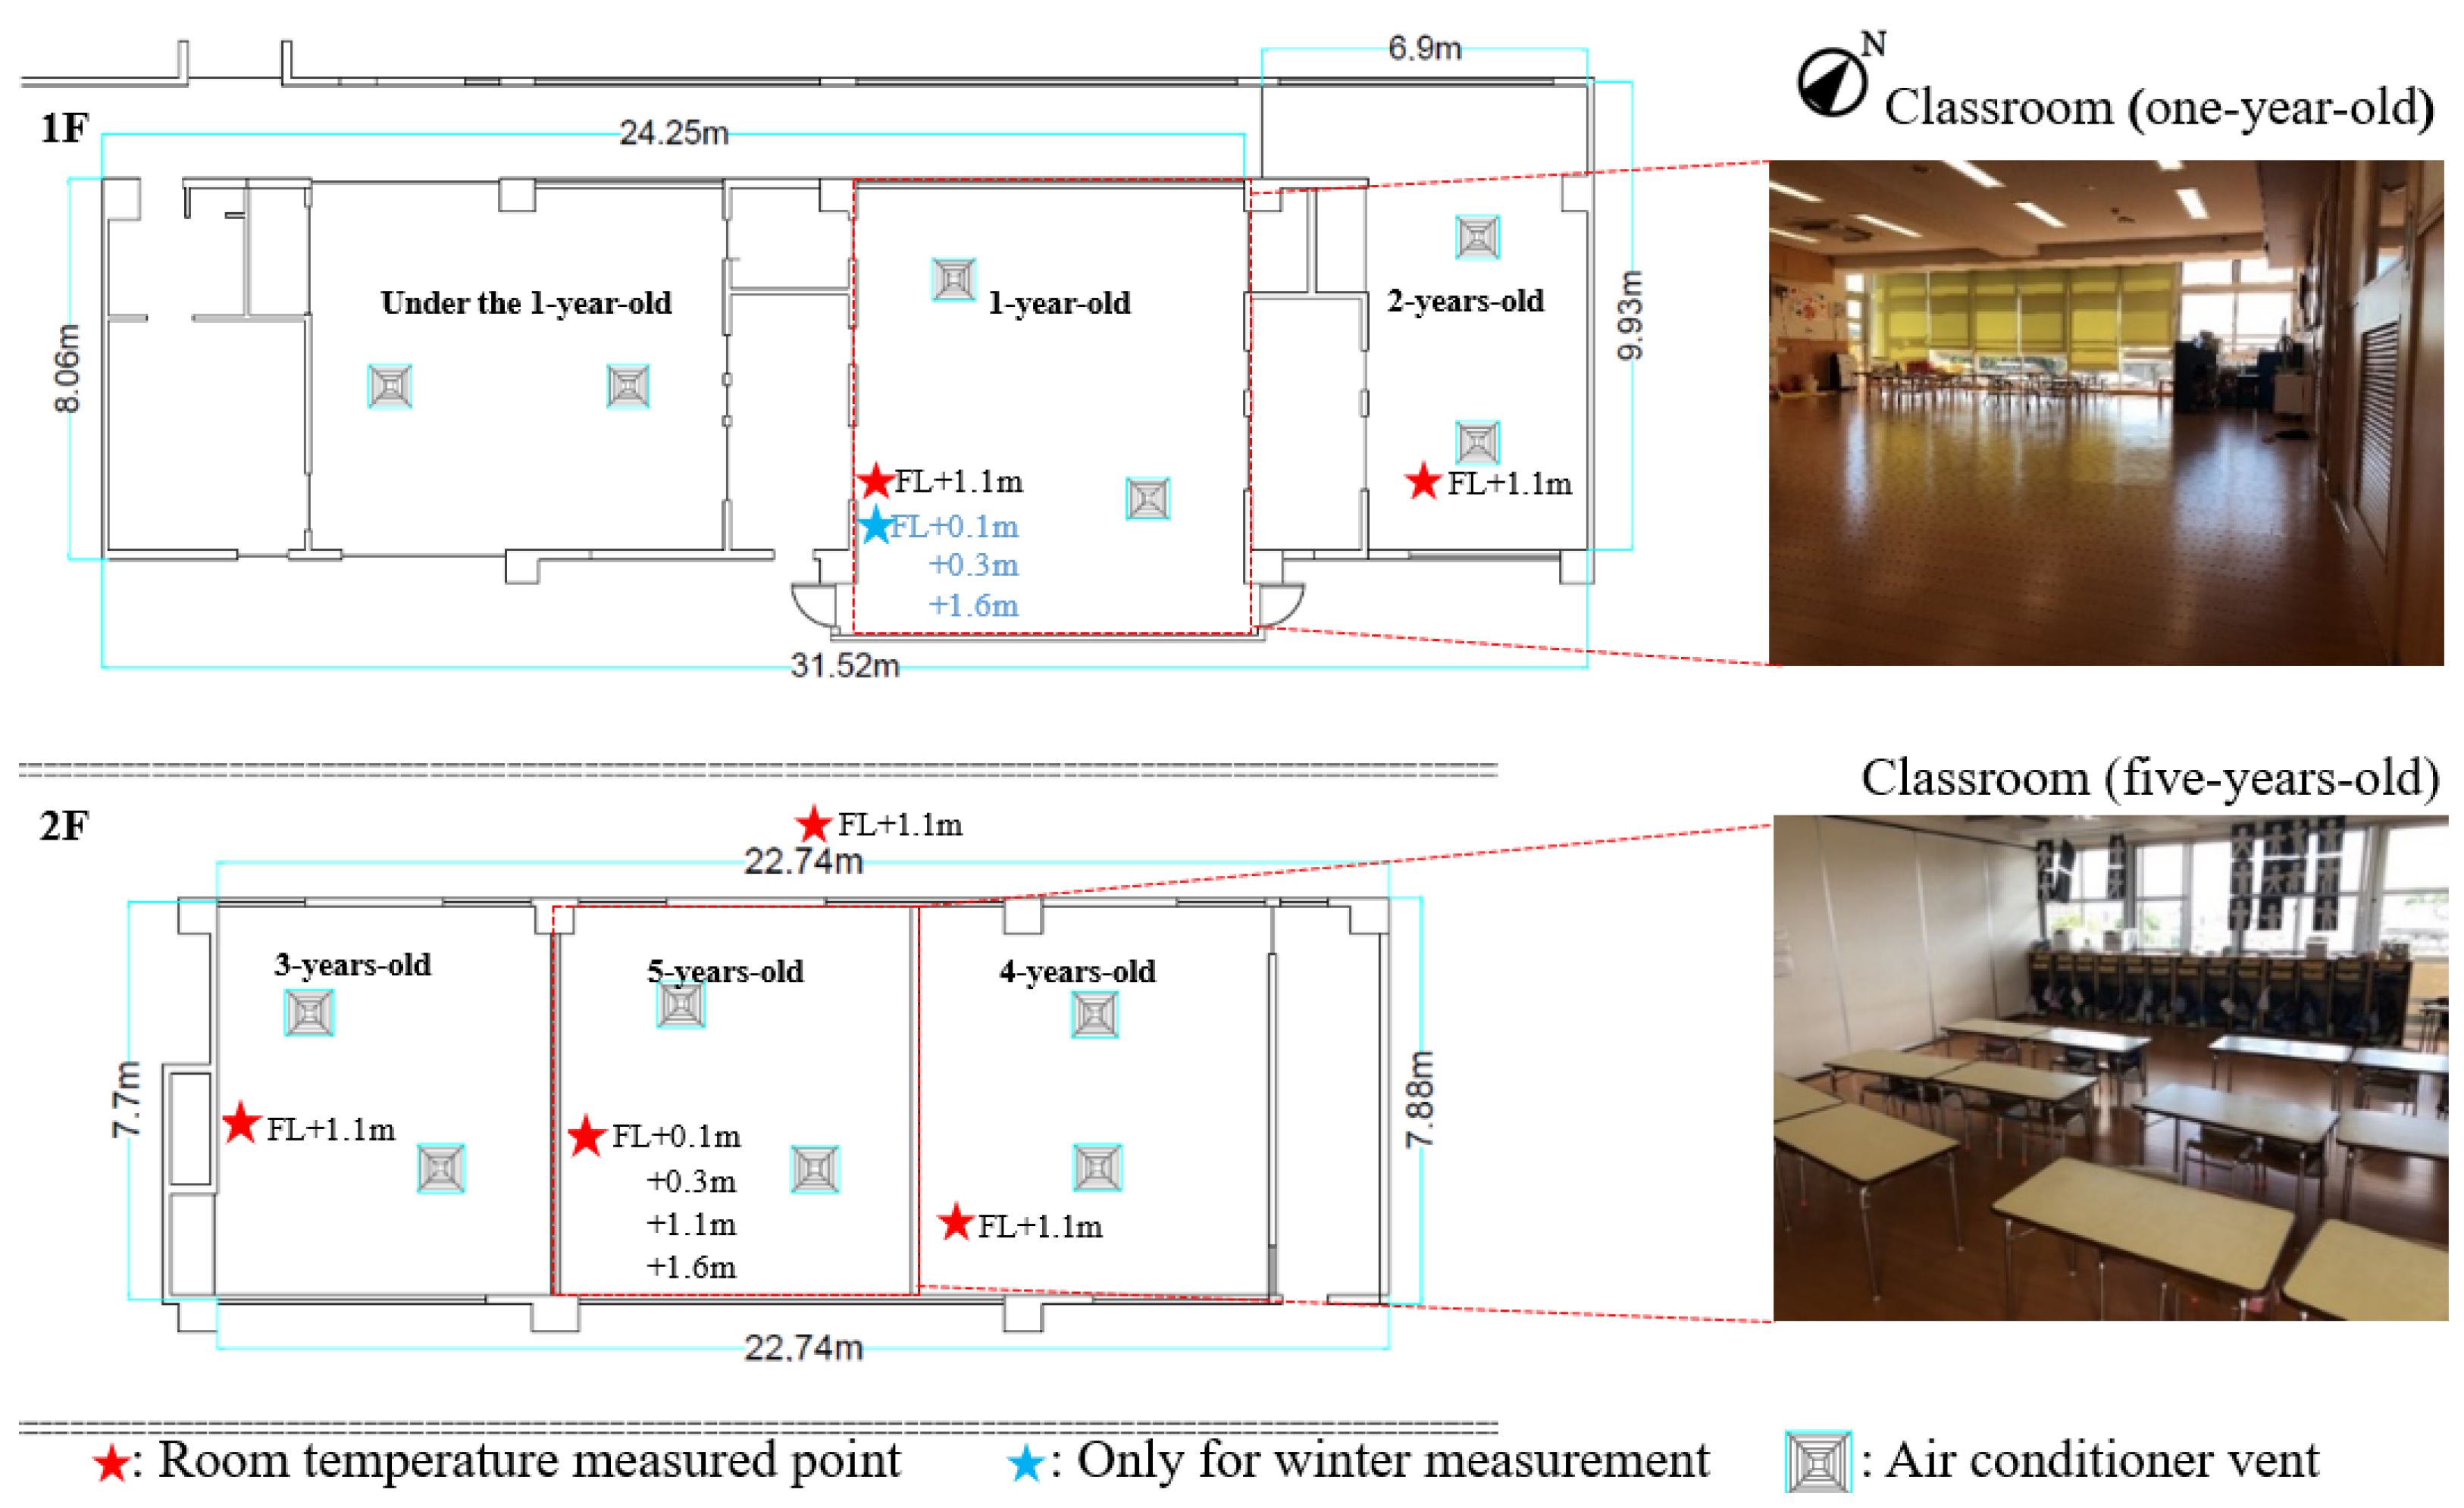
2.2.1. Case Study of a Nursery School
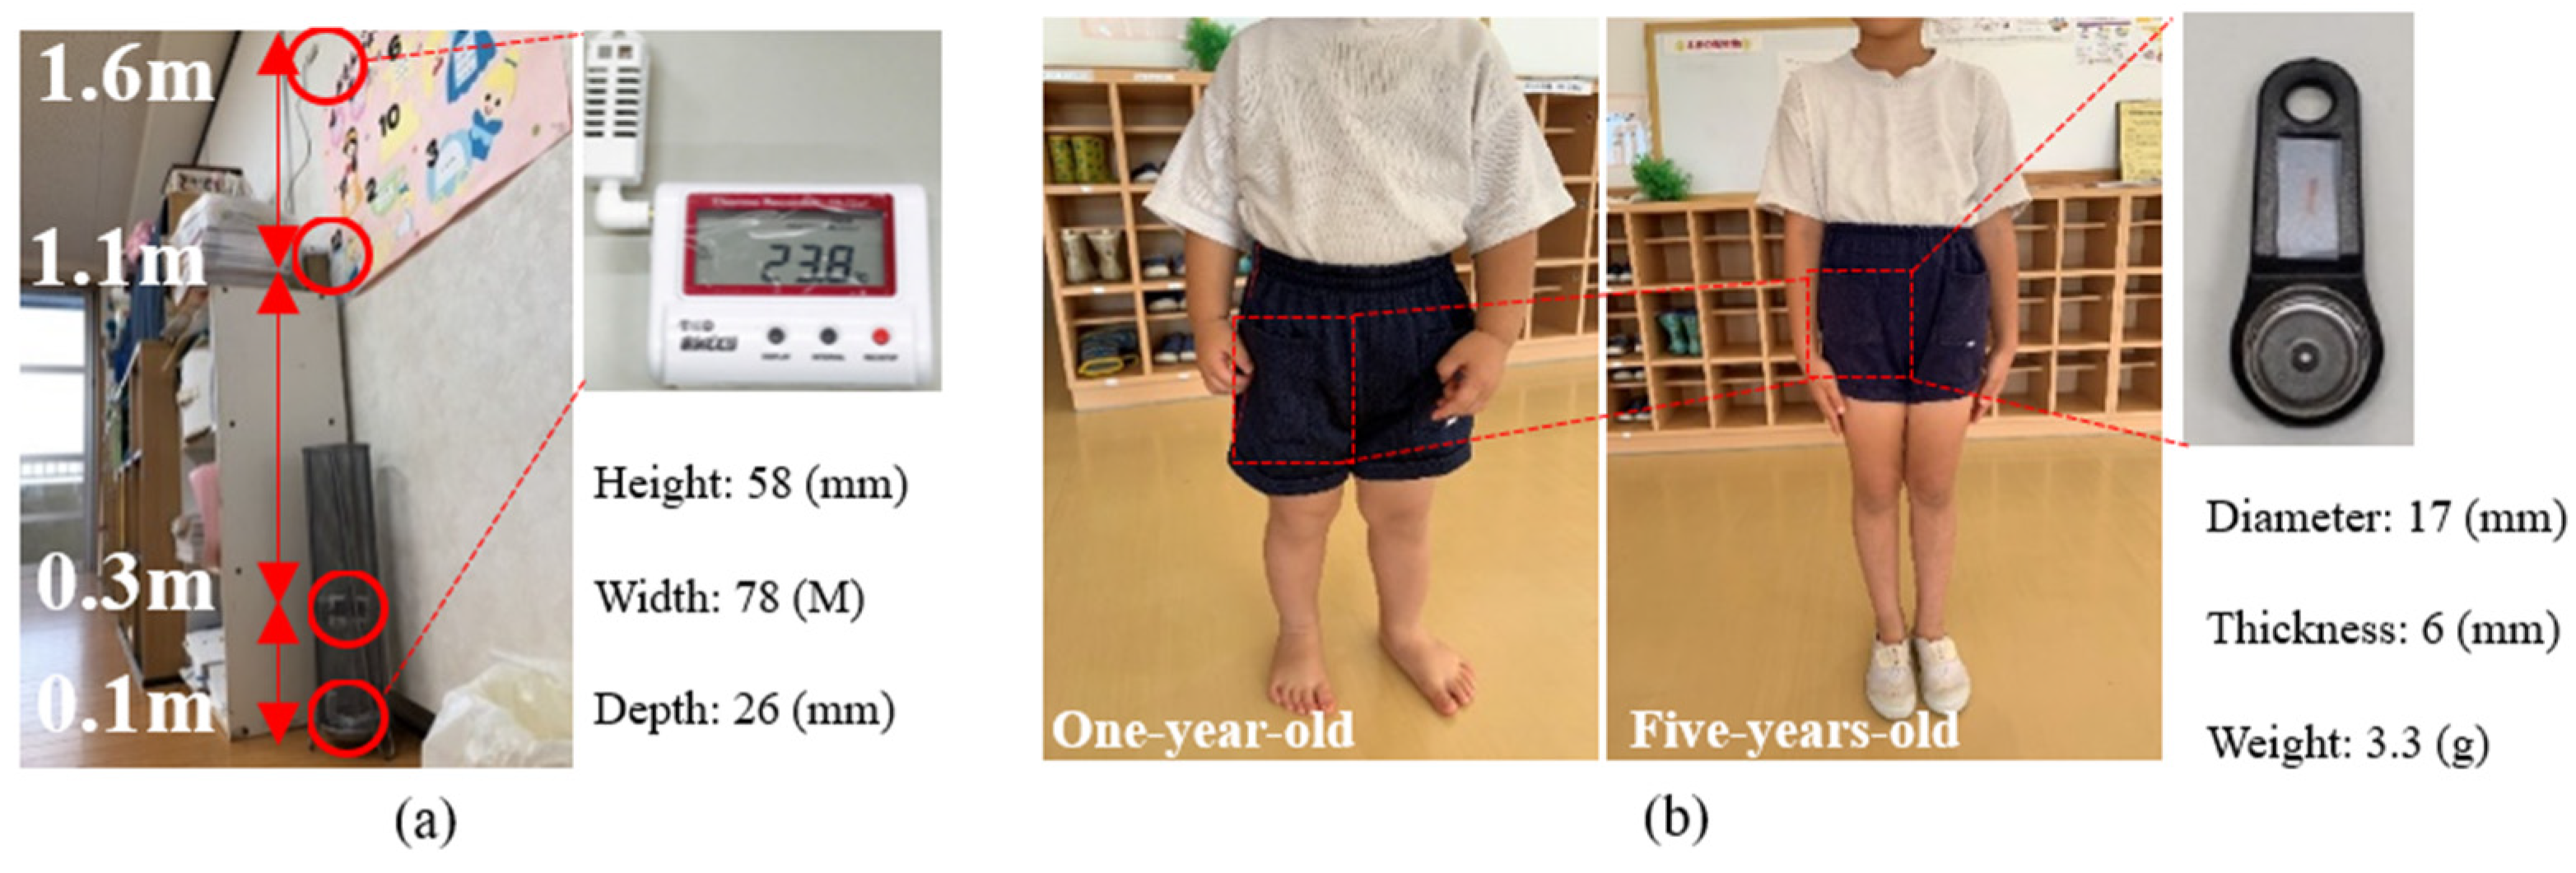
2.2.2. Measurement
3. Result and Discussion
3.1. Result of Questionnaire Survey
3.2. Results of Measurements
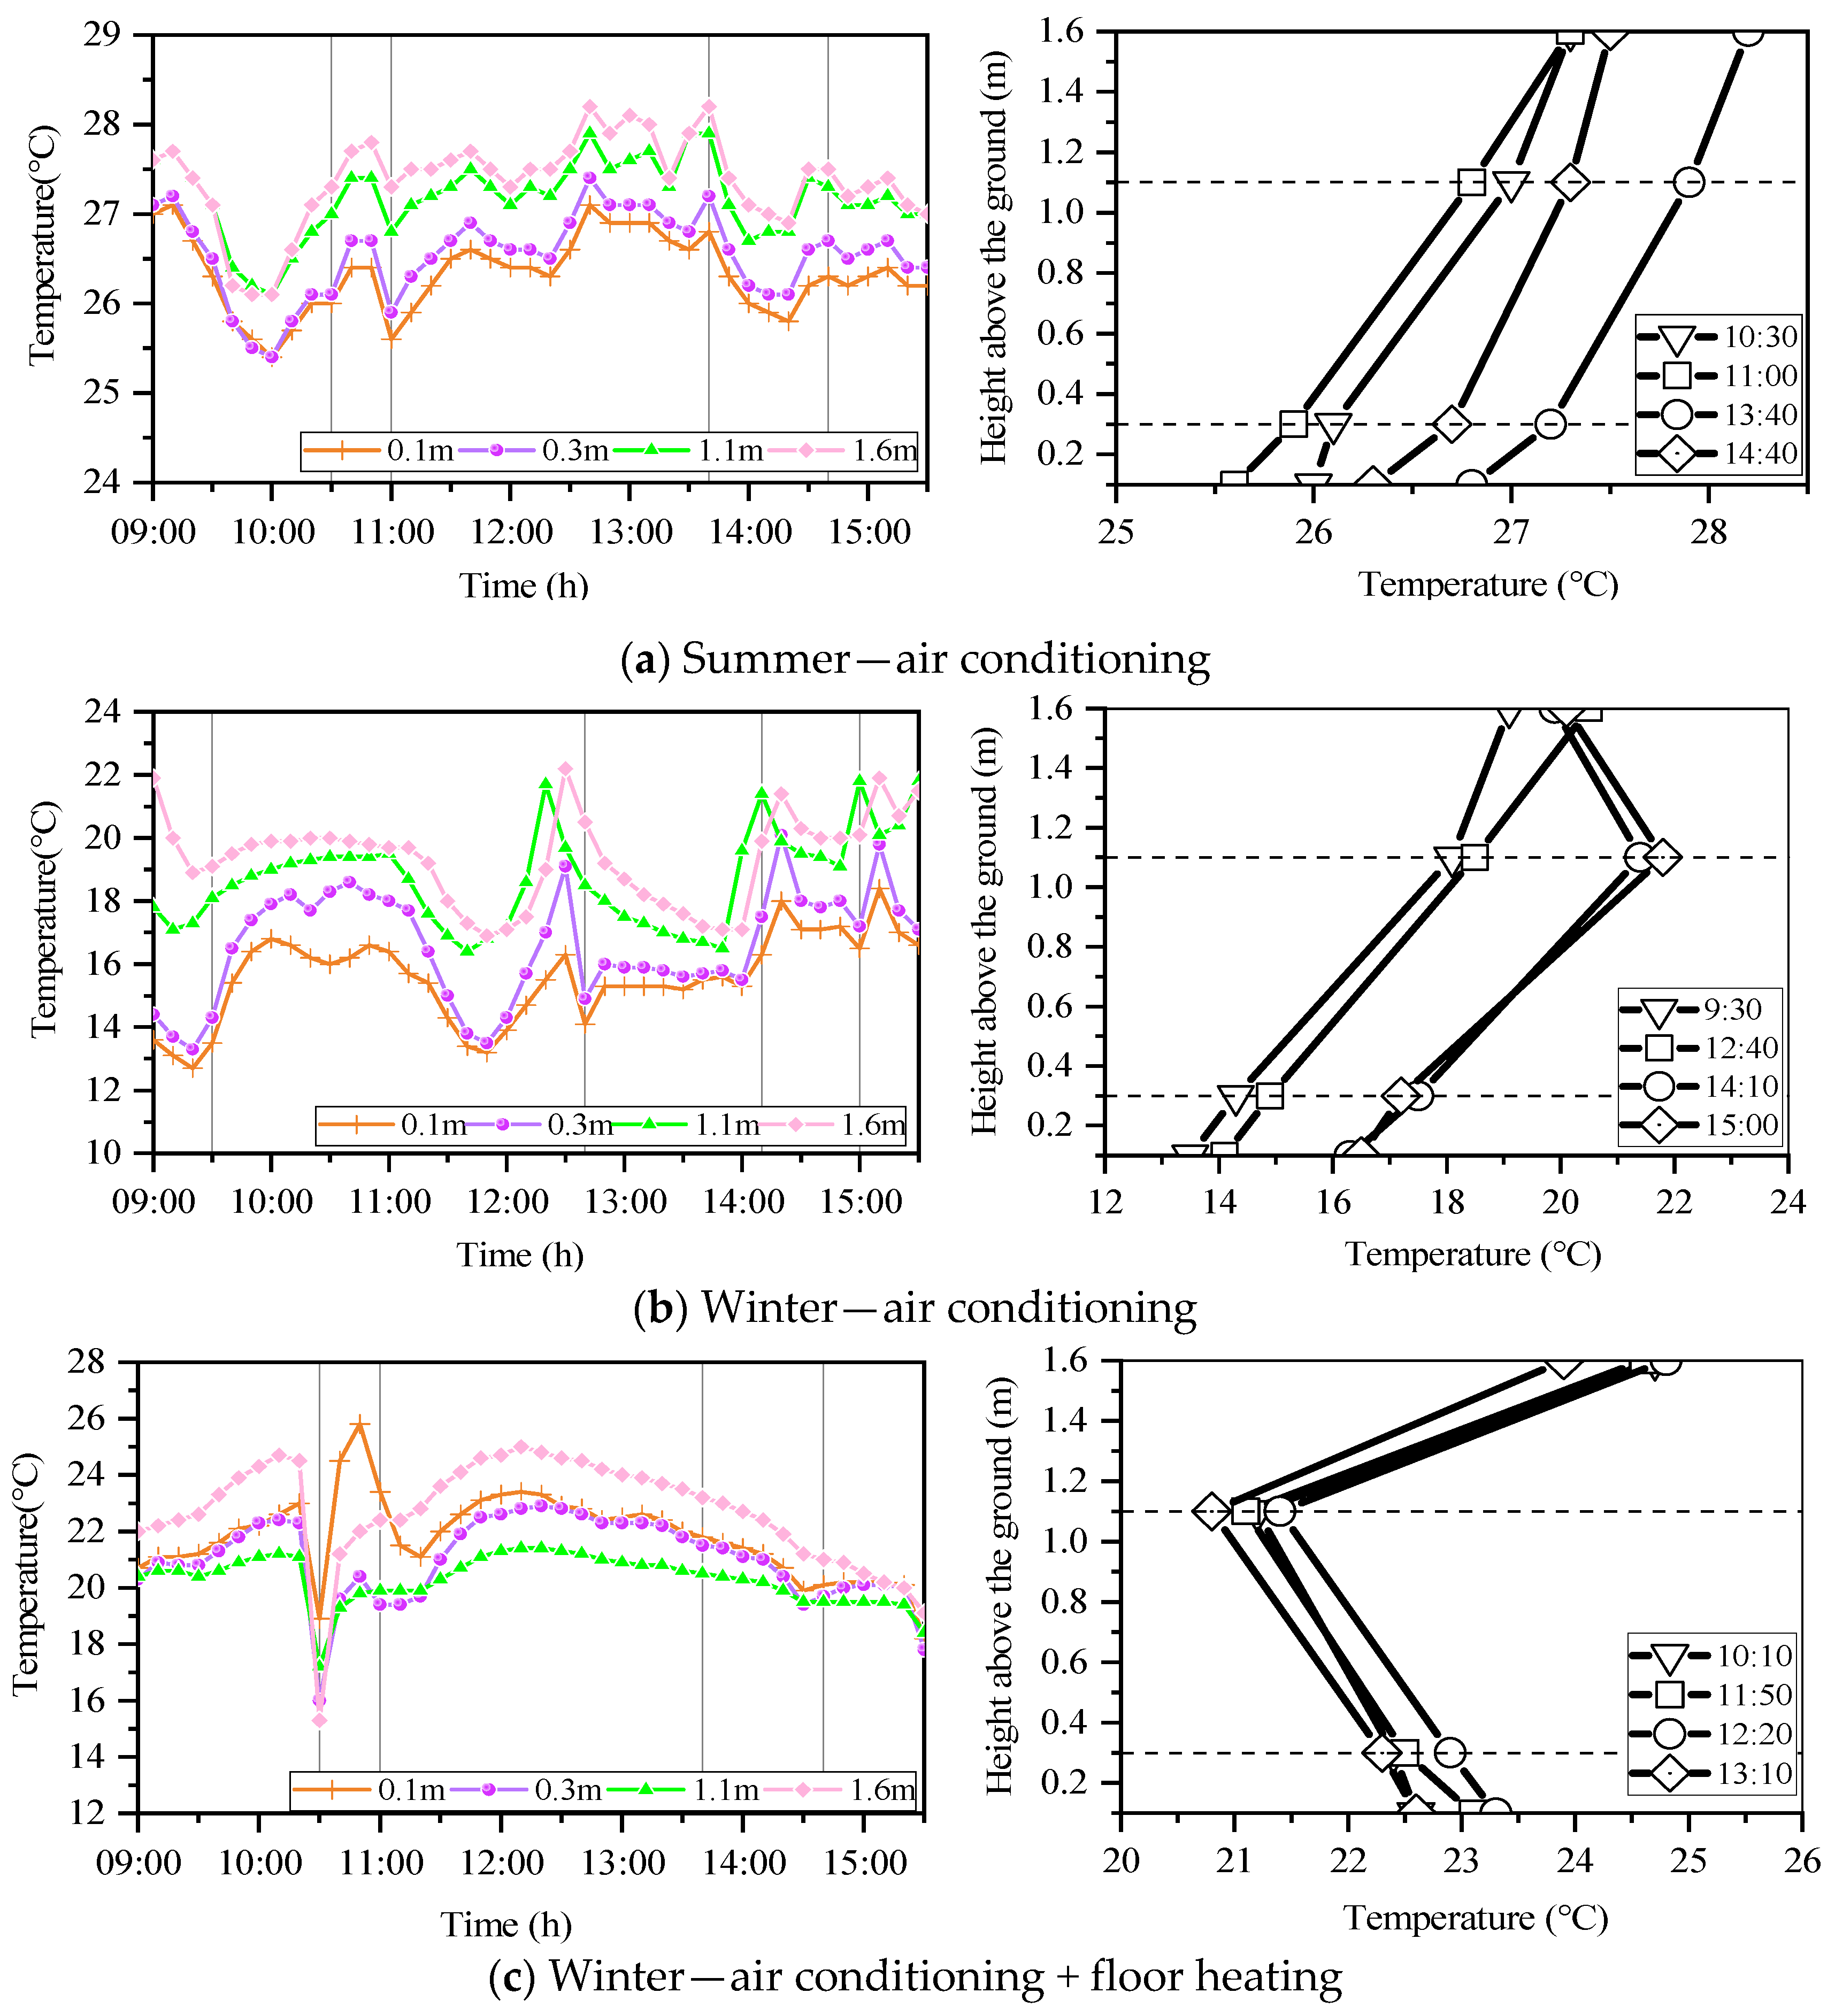
3.2.1. Distribution of Vertical Temperature
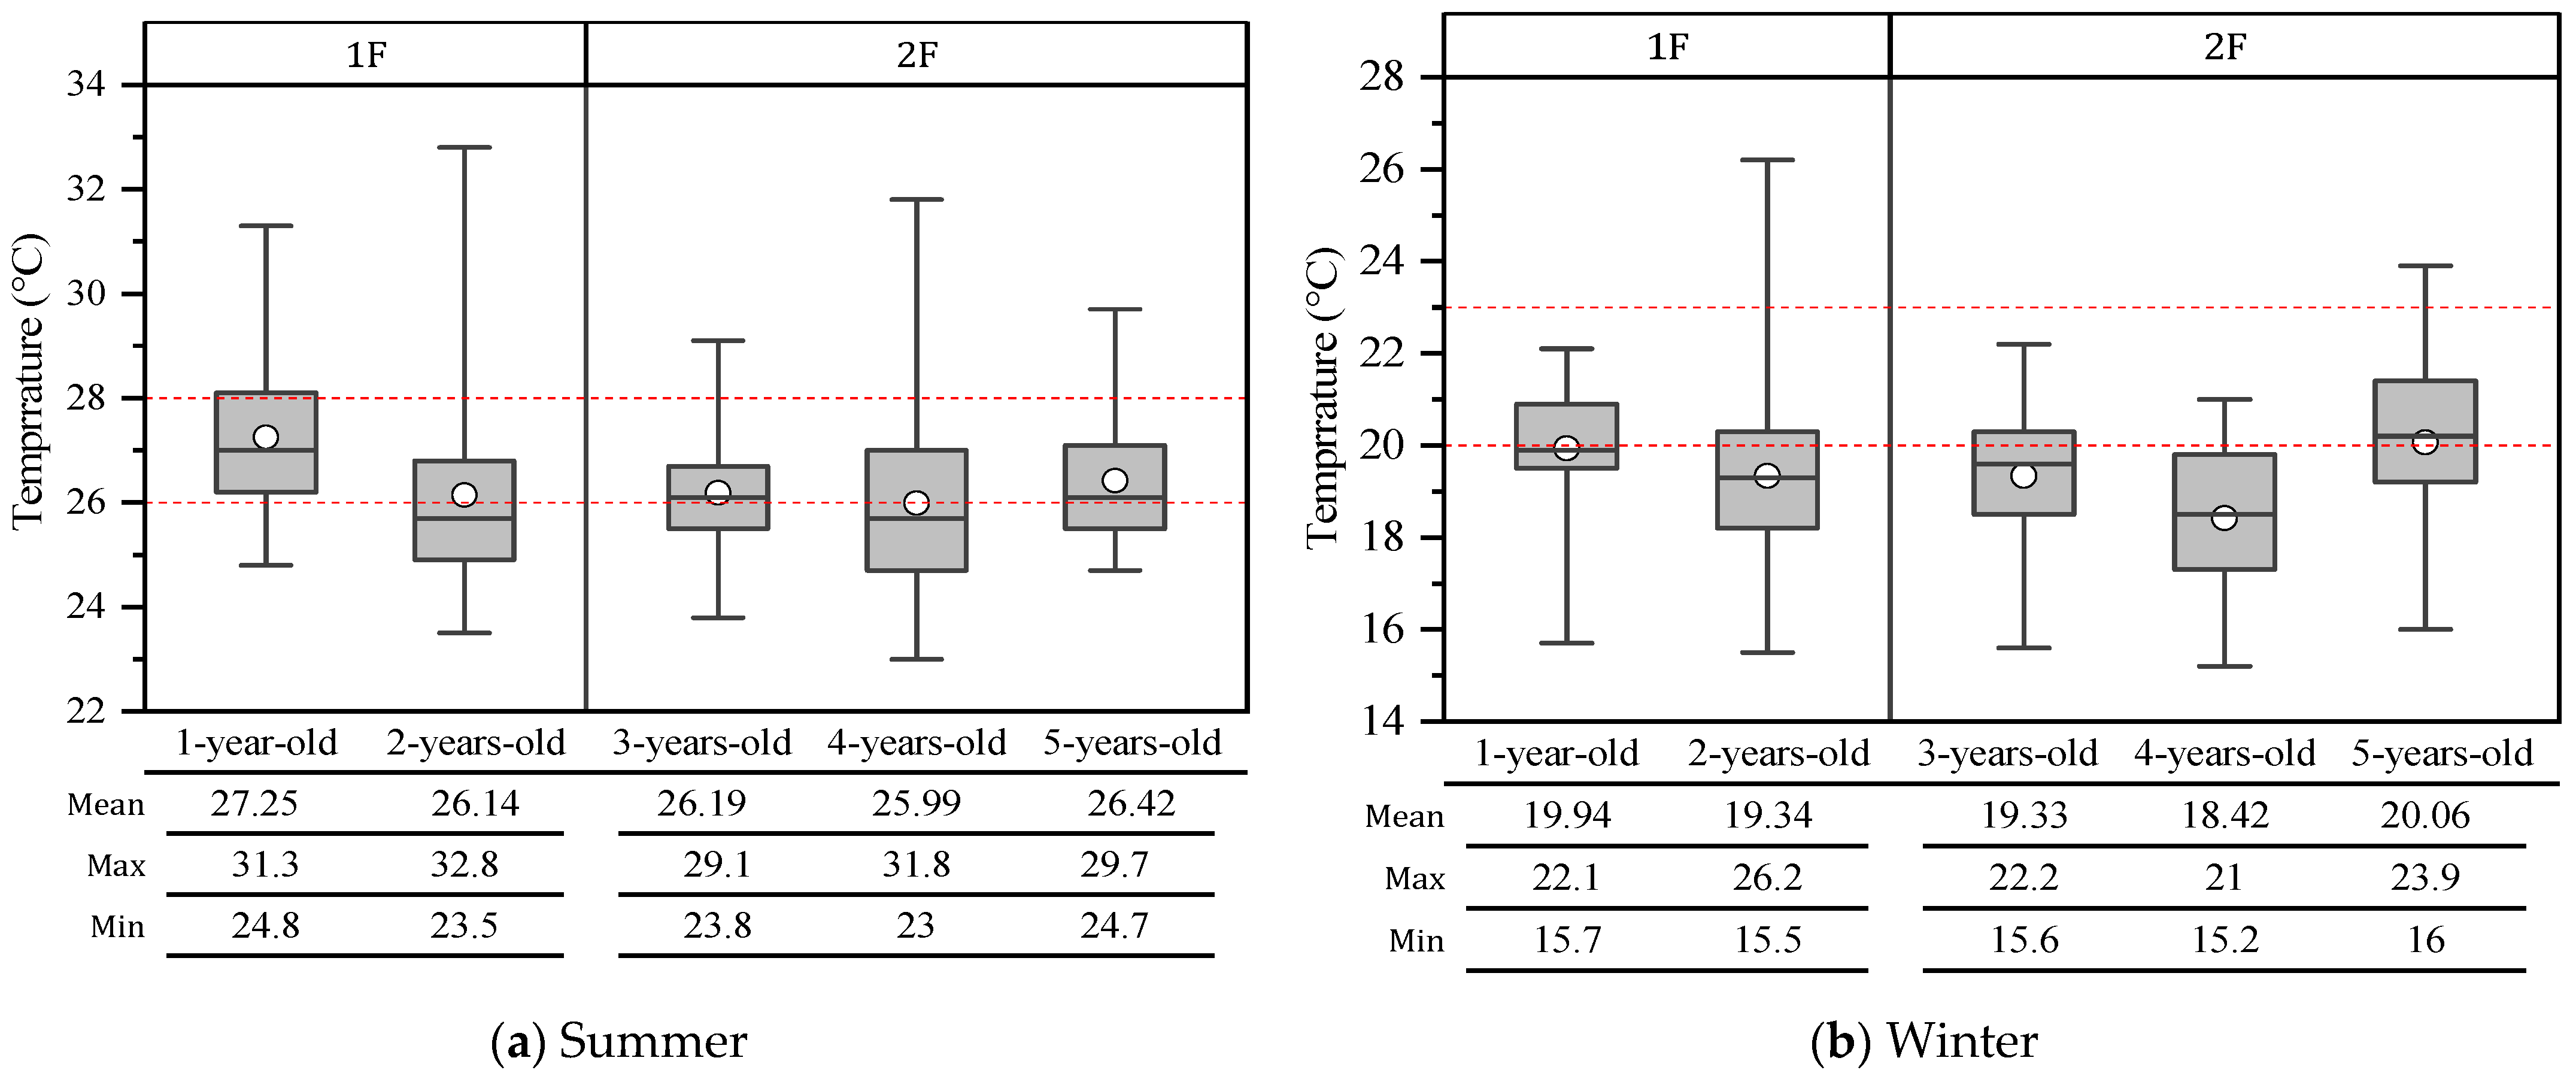
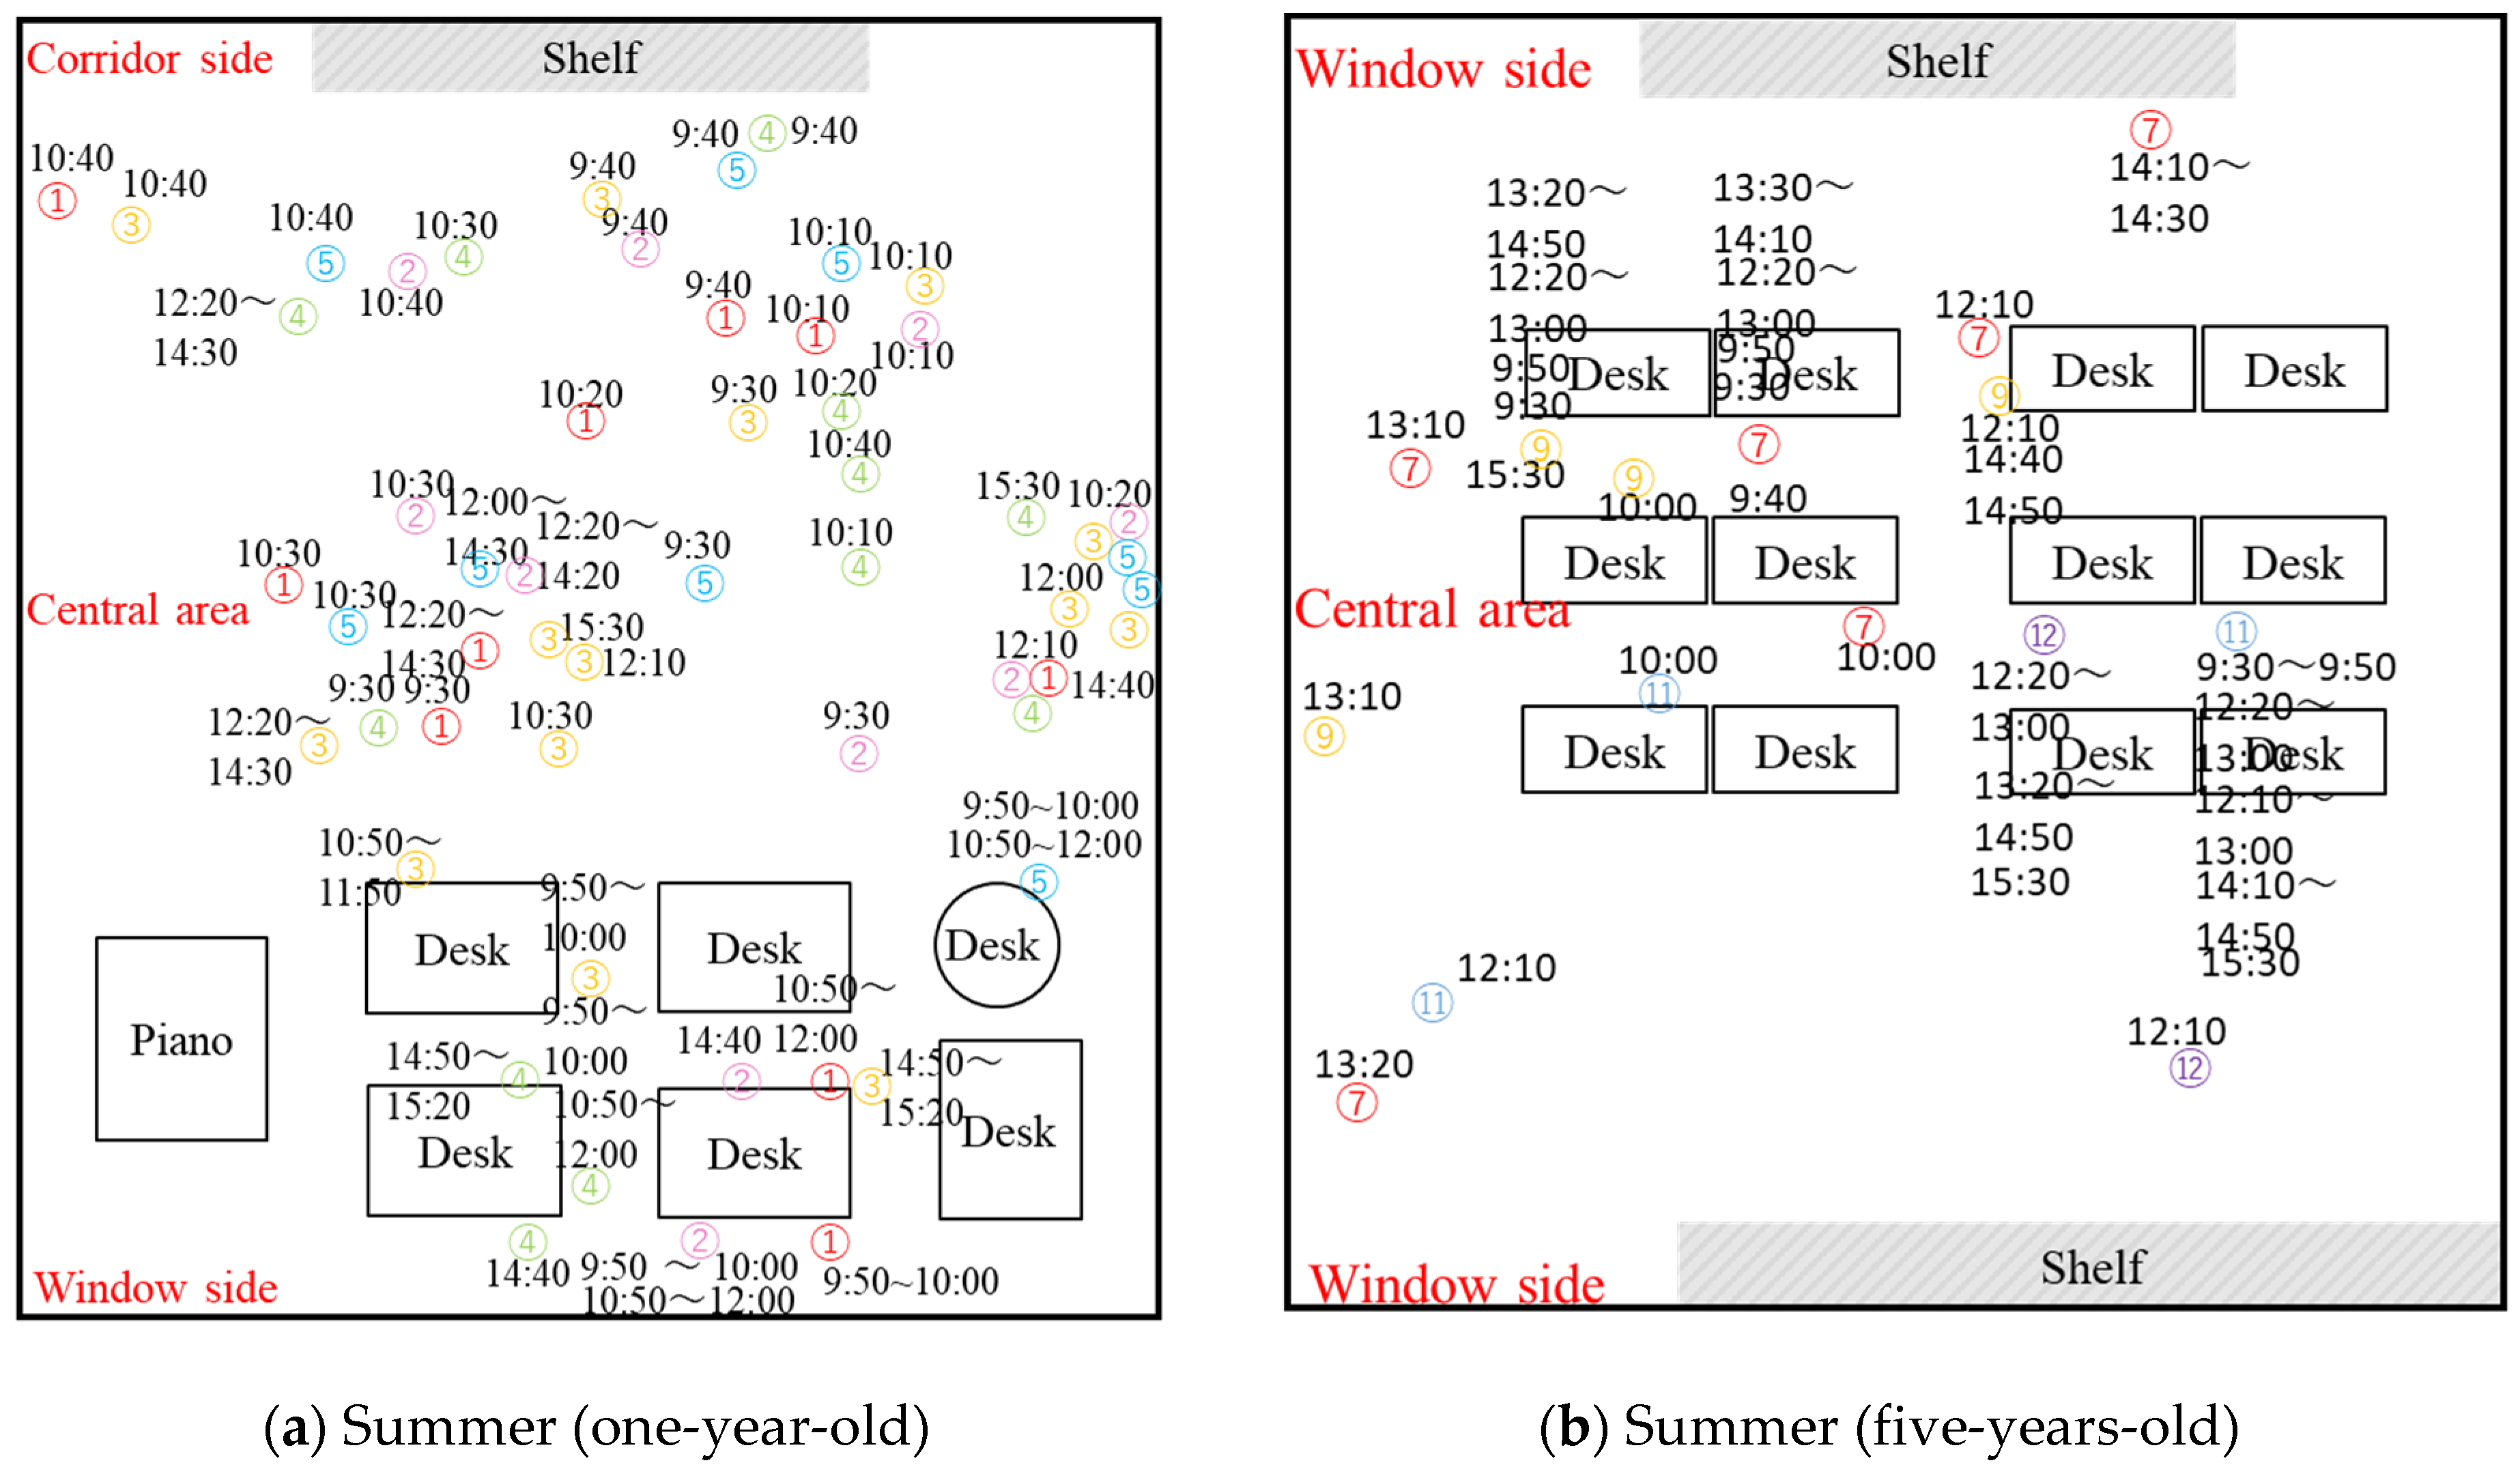
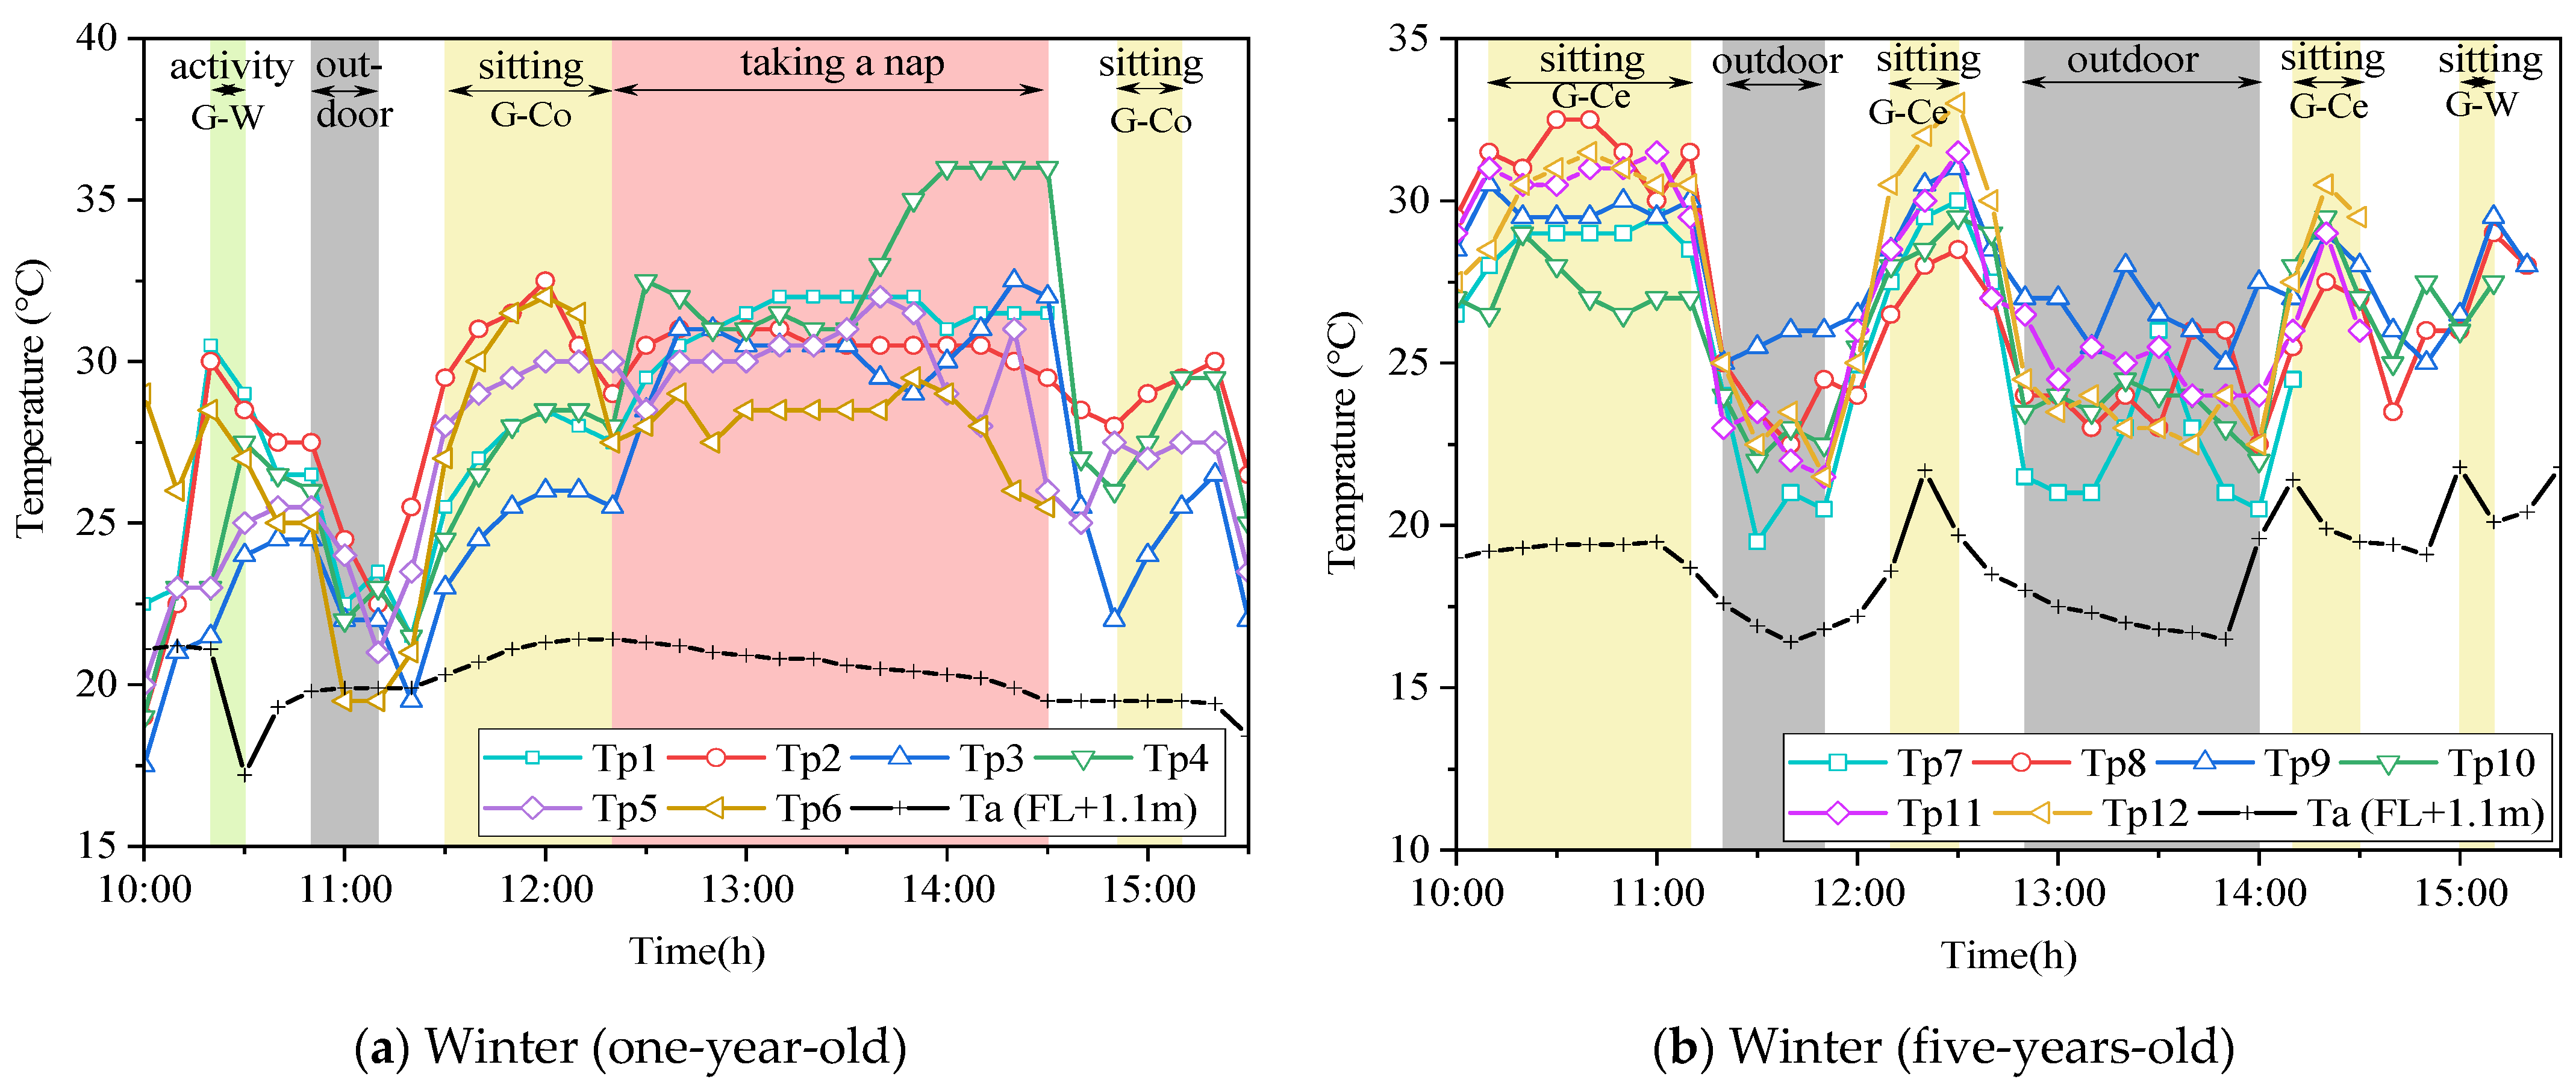
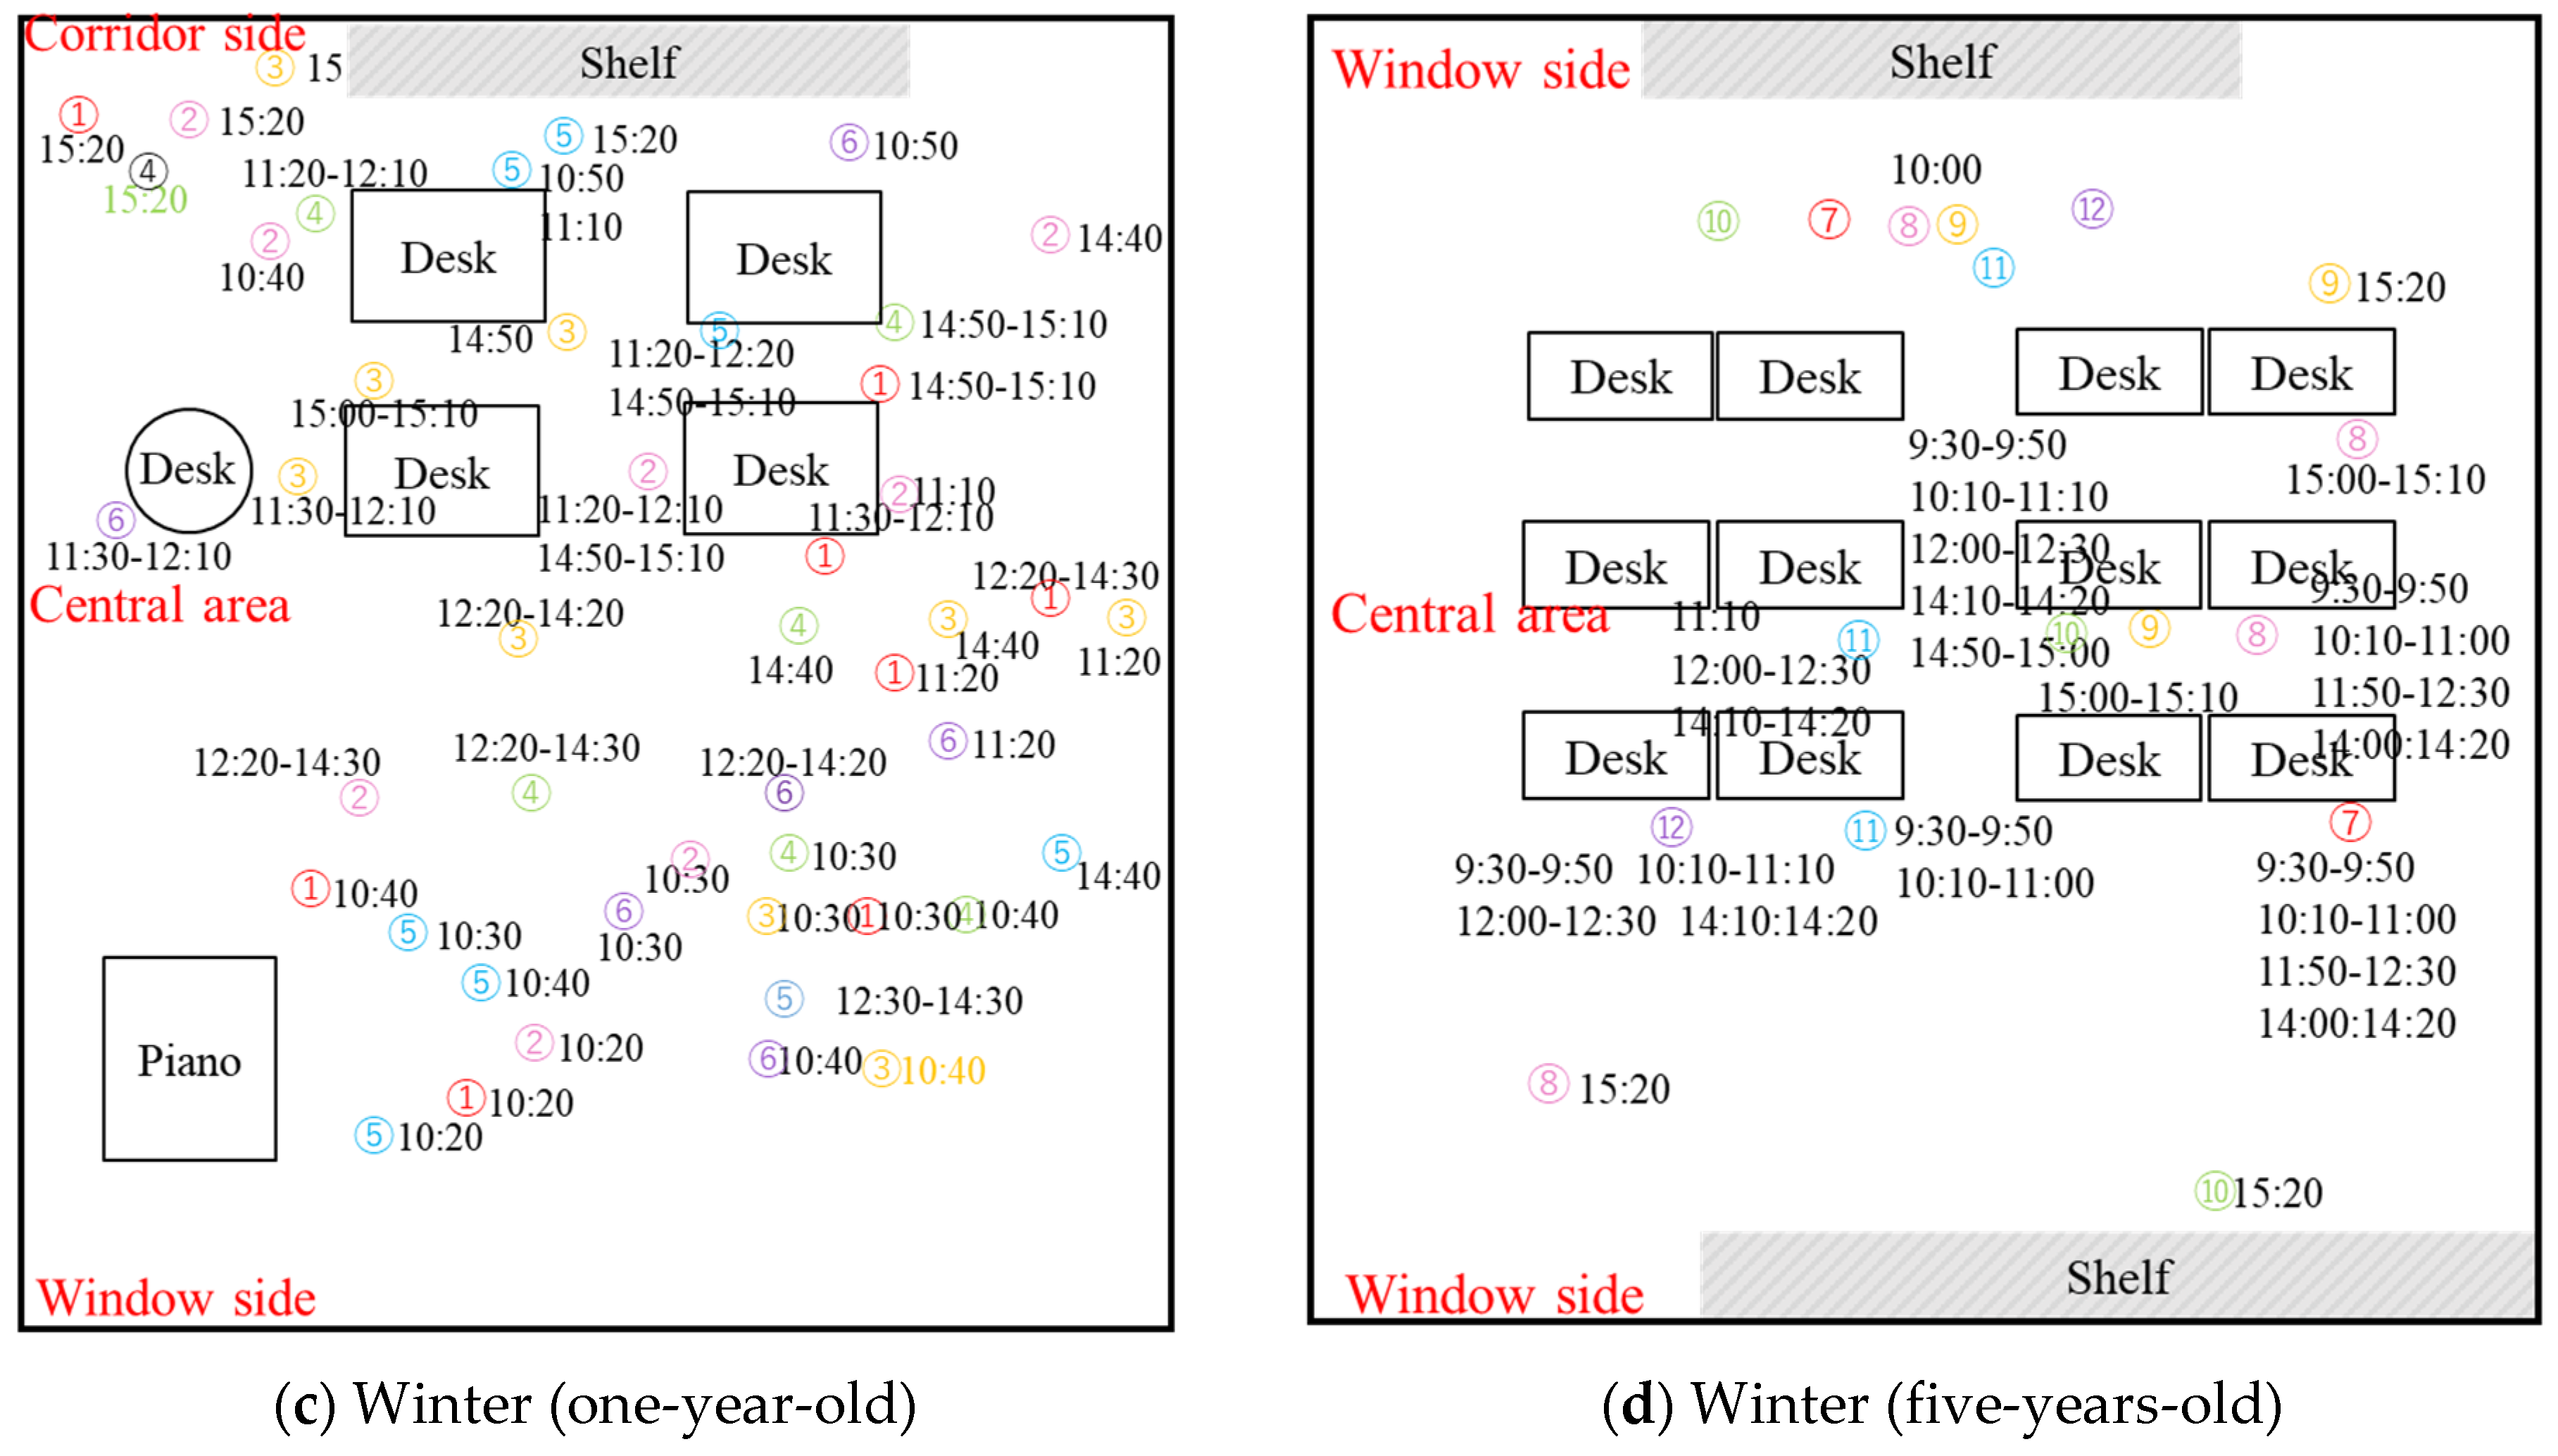
3.2.2. Distribution of Horizontal Temperature
4. Conclusions
- Based on the questionnaire survey, nursery teachers’ adaptability and comfort behaviors (such as air conditioner switch on/off, adjusting the temperature of the air conditioner, or window opening/closing) to indoor temperature were mainly judged by their own thermal feelings, which could bring a physiological burden to the children.
- The uneven indoor vertical temperature distribution could be significantly reduced by using air conditioning and floor heating simultaneously, which may help the nursery create and maintain a comfortable thermal environment for the children.
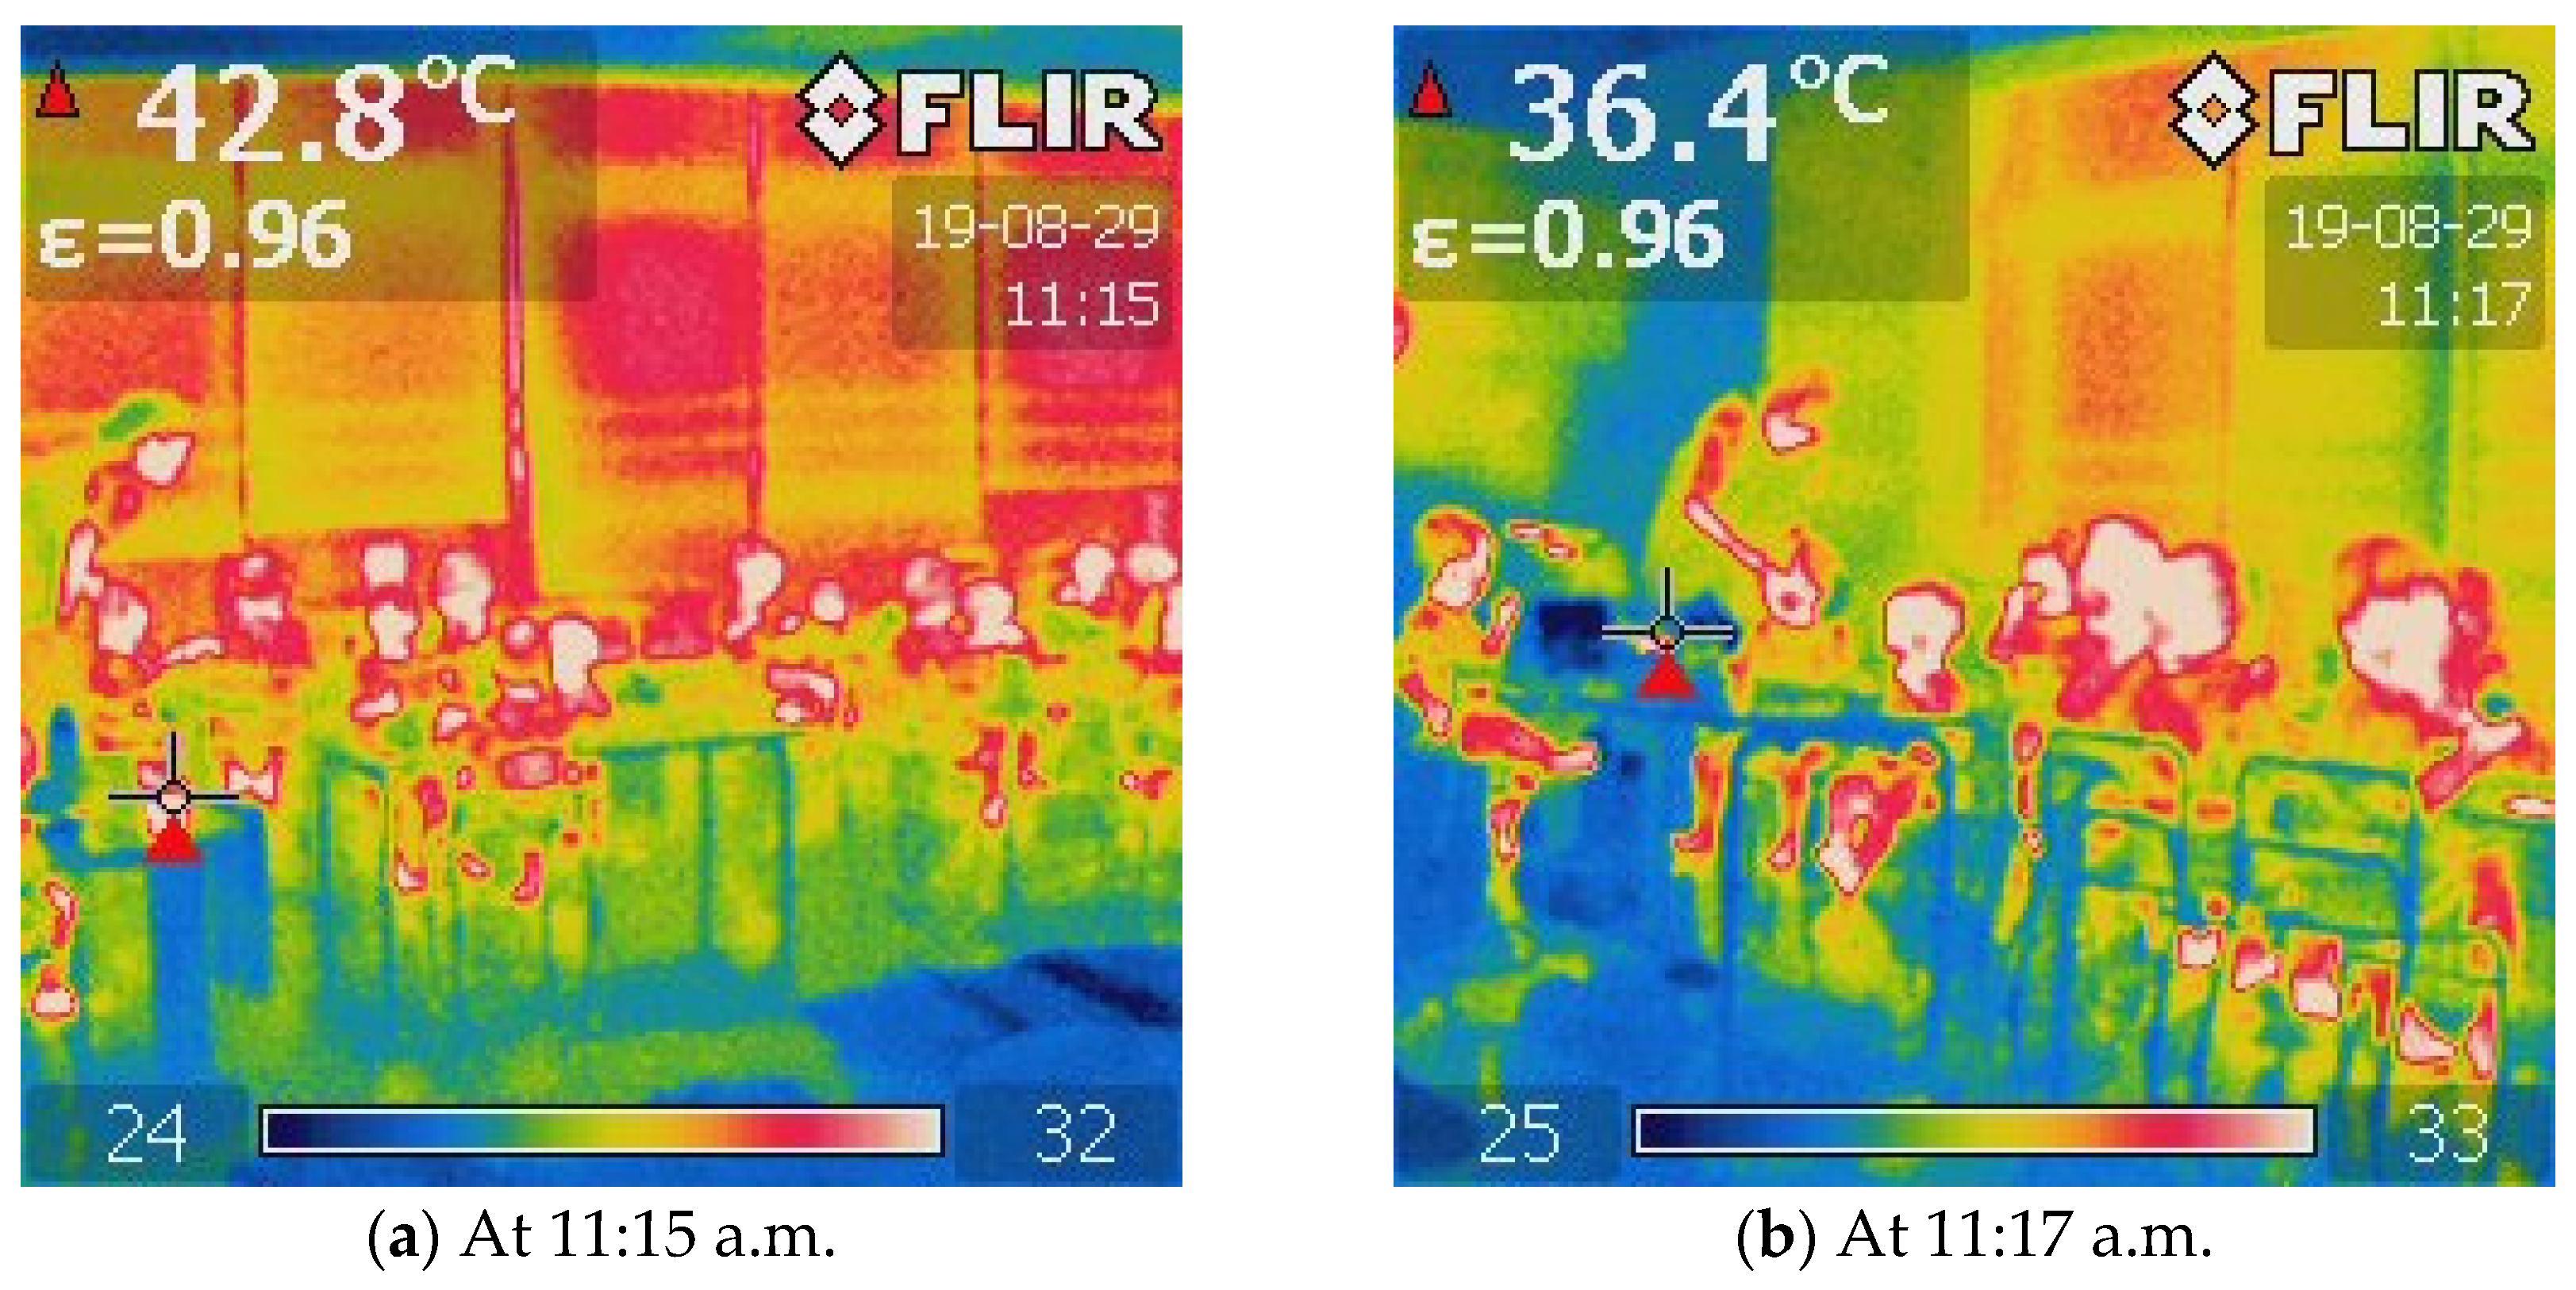
- Solar radiation, outdoor weather, and cold air blowing from the air conditioner outlet led to uneven indoor temperature distribution. Over-cooling or over-heating reduces the thermal comfort of occupants. Therefore, specifical attention should be paid to the thermal environment when children are close to the window and near the air outlet of the air conditioner. Therefore, nursery schools and nursery teachers should prevent children from moving around on the window side and near air conditioning vents during the hot summer by setting up individualized methods such as changing the classroom layouts and activity areas for children. In addition, a more suitable air-conditioning system for nursery schools should be reconsidered to reduce the above-mentioned drawbacks of conventional air conditioning systems, and we cited a radiation air-conditioning system as having the advantage of eliminating airflow, which can improve the current drawbacks of direct air blowing and help create a suitable thermal environment for children. On the other hand, in terms of building design, the approach of improving the thermal insulation of windows and facades of buildings and sun shading in summer could also contribute to improving the thermal environment for the children.
- The density of occupants may cause the temperature around the human body to be relatively high. We suggest that teachers can improve the thermal comfort of gathered children through thermal adaptive behavior.
Author Contributions
Funding
Institutional Review Board Statement
Informed Consent Statement
Data Availability Statement
Conflicts of Interest
References
- Branco, P.T.; Alvim-Ferraz, M.C.; Martins, F.G.; Ferraz, C.; Vaz, L.G.; Sousa, S.I. Impact of indoor air pollution in nursery and primary schools on childhood asthma. Sci. Total Environ. 2020, 745, 140982. [Google Scholar] [CrossRef] [PubMed]
- Huang, L.; Zhu, Y.; Ouyang, Q.; Cao, B. A study on the effects of thermal, luminous, and acoustic environments on indoor environmental comfort in offices. Build. Environ. 2012, 49, 304–309. [Google Scholar] [CrossRef]
- Annesi-Maesano, I.; Agabiti, N.; Pistelli, R.; Couilliot, M.-F.; Forastiere, F. Subpopulations at increased risk of adverse health outcomes from air pollution. Eur. Respir. J. 2003, 21, 57S–63S. [Google Scholar] [CrossRef] [Green Version]
- Inoue, Y. Prevention of heat illness in children and the Elderly. Jpn. J. Biometeorol. 2004, 41, 61–66. [Google Scholar] [CrossRef]
- Copple, C. Fostering young children’s representation, planning, and reflection: A focus in three current early childhood models. J. Appl. Dev. Psychol. 2003, 24, 763–771. [Google Scholar] [CrossRef]
- Korsavi, S.S.; Montazami, A. Children’s thermal comfort and adaptive behaviours; UK primary schools during non-heating and heating seasons. Energy Build. 2020, 214, 109857. [Google Scholar] [CrossRef]
- Vásquez, N.G.; Rupp, R.F.; Díaz, L.A.; Cardona, A.G.; Arenas, D.M. Testing a method to assess the thermal sensation and preference of children in kindergartens. In Proceedings of the 30th International PLEA Conference: Sustainable Habitat for Developing Societies: Choosing the Way Forward—Proceedings, Ahmedabad, India, 16–18 December 2014. [Google Scholar]
- Nam, I.; Yang, J.; Lee, D.; Park, E.; Sohn, J.-R. A study on the thermal comfort and clothing insulation characteristics of preschool children in Korea. Build. Environ. 2015, 92, 724–733. [Google Scholar] [CrossRef]
- Madureira, J.; Paciência, I.; Rufo, J.; Ramos, E.; Barros, H.; Teixeira, J.P.; de Oliveira Fernandes, E. Indoor air quality in schools and its relationship with children’s respiratory symptoms. Atmos. Environ. 2015, 118, 145–156. [Google Scholar] [CrossRef] [Green Version]
- Fabbri, K. Indoor Thermal Comfort Perception. In A Questionnaire Approach Focusing on Children; Springer Science and Business Media LLC: Berlin/Heidelberg, Germany, 2015. [Google Scholar]
- Yun, H.; Nam, I.; Kim, J.; Yang, J.; Lee, K.; Sohn, J. A field study of thermal comfort for kindergarten children in Korea: An assessment of existing models and preferences of children. Build. Environ. 2014, 75, 182–189. [Google Scholar] [CrossRef]
- Fabbri, K. Thermal comfort evaluation in kindergarten: PMV and PPD measurement through datalogger and questionnaire. Build. Environ. 2013, 68, 202–214. [Google Scholar] [CrossRef]
- Liang, H.-H.; Lin, T.-P.; Hwang, R.-L. Linking occupants’ thermal perception and building thermal performance in naturally ventilated school buildings. Appl. Energy 2012, 94, 355–363. [Google Scholar] [CrossRef]
- Huang, K.-T.; Huang, W.-P.; Lin, T.-P.; Hwang, R.-L. Implementation of green building specification credits for better thermal conditions in naturally ventilated school buildings. Build. Environ. 2015, 86, 141–150. [Google Scholar] [CrossRef]
- Al-Rashidi, K.; Loveday, D.; Al-Mutawa, N. Impact of ventilation modes on carbon dioxide concentration levels in Kuwait classrooms. Energy Build. 2012, 47, 540–549. [Google Scholar] [CrossRef]
- Fong, M.; Hanby, V.; Greenough, R.; Lin, Z.; Cheng, Y. Acceptance of thermal conditions and energy use of three ventilation strategies with six exhaust configurations for the classroom. Build. Environ. 2015, 94, 606–619. [Google Scholar] [CrossRef]
- Frontczak, M.; Wargocki, P. Literature survey on how different factors influence human comfort in indoor environments. Build. Environ. 2011, 46, 922–937. [Google Scholar] [CrossRef]
- Zomorodian, Z.S.; Tahsildoost, M.; Hafezi, M. Thermal comfort in educational buildings: A review article. Renew. Sustain. Energy Rev. 2016, 59, 895–906. [Google Scholar] [CrossRef]
- Teli, D.; Jentsch, M.F.; James, P.A. The role of a building’s thermal properties on pupils’ thermal comfort in junior school classrooms as determined in field studies. Build. Environ. 2014, 82, 640–654. [Google Scholar] [CrossRef] [Green Version]
- Li, X.; Chen, Q. Development of a novel method to detect clothing level and facial skin temperature for controlling HVAC systems. Energy Build. 2021, 239, 110859. [Google Scholar] [CrossRef]
- Li, W.; Zhang, J.; Zhao, T.; Liang, R. Experimental research of online monitoring and evaluation method of human thermal sensation in different active states based on wristband device. Energy Build. 2018, 173, 613–622. [Google Scholar] [CrossRef]
- Cosma, A.C.; Simha, R. Thermal comfort modeling in transient conditions using real-time local body temperature extraction with a thermographic camera. Build. Environ. 2018, 143, 36–47. [Google Scholar] [CrossRef]
- Cosma, A.C.; Simha, R. Machine learning method for real-time non-invasive prediction of individual thermal preference in transient conditions. Build. Environ. 2018, 148, 372–383. [Google Scholar] [CrossRef]
- Wang, F.; Zhu, B.; Li, R.; Han, D.; Sun, Z.; Moon, S.; Gong, Z.; Yu, W. Smart control of indoor thermal environment based on online learned thermal comfort model using infrared thermal imaging. In Proceedings of the 2017 13th IEEE Conference on Automation Science and Engineering (CASE), Xi’an, China, 20–23 August 2017. [Google Scholar] [CrossRef]
- Cheng, X.; Yang, B.; Hedman, A.; Olofsson, T.; Li, H.; Van Gool, L. NIDL: A pilot study of contactless measurement of skin temperature for intelligent building. Energy Build. 2019, 198, 340–352. [Google Scholar] [CrossRef]
- Sugimoto, C. Human sensing using wearable wireless sensors for smart environments. In Proceedings of the International Conference on Sensing Technology, ICST, Wellington, New Zealand, 3–5 December 2013. [Google Scholar] [CrossRef]
- Sim, S.Y.; Koh, M.J.; Joo, K.M.; Noh, S.; Park, S.; Kim, Y.H.; Park, K.S. Estimation of Thermal Sensation Based on Wrist Skin Temperatures. Sensors 2016, 16, 420. [Google Scholar] [CrossRef] [PubMed] [Green Version]
- Smith, C.J. Pediatric Thermoregulation: Considerations in the Face of Global Climate Change. Nutrients 2019, 11, 2010. [Google Scholar] [CrossRef] [Green Version]
- Berko, J.; Ingram, D.D.; Saha, S.; Parker, J.D. Deaths attributed to heat, cold, and other weather events in the United States, 2006–2010. Natl. Health Stat. Rep. 2014, 2014, 76. [Google Scholar]
- Falk, B. Effects of Thermal Stress During Rest and Exercise in the Paediatric Population. Sports Med. 1998, 25, 221–240. [Google Scholar] [CrossRef] [PubMed]
- Fukazawa, T.; Ikeda, S.; Kim, S.; Tochihara, Y. Seasonal clothing variation and thermal resistance of clothing ensembles of infants living in Kyushu. J. Home Econ. Jpn. 2009, 60, 635–643. (In Japanese) [Google Scholar] [CrossRef]
- Teli, D.; James, P.A.; Jentsch, M.F. Thermal comfort in naturally ventilated primary school classrooms. Build. Res. Inf. 2013, 41, 301–316. [Google Scholar] [CrossRef]
- Aparicio-Ruiz, P.; Barbadilla-Martín, E.; Martín, J.G.; Sanz, J.M. A field study on adaptive thermal comfort in Spanish primary classrooms during summer season. Build. Environ. 2021, 203, 108089. [Google Scholar] [CrossRef]
- Kirin Nursery School; SKT Co., Ltd.; West Japan Telecom and Telephone Corporation; Kyushu Institute of Technology. Fukuoka City LoRaWANTM Was Used to Realize the Trial Operation of IoT Nursery School. 2018. Available online: https://www.ntt-west.co.jp/newscms/fukuoka/7221/20180228.pdf (accessed on 26 November 2021). (In Japanese).
- L. and W. (Japan) Ministry of Health, Guidelines for Infectious Disease Control in Nurseries, Ministry of Health, Labour and Welfare (Japan). 2018, p. 32. Available online: https://www.mhlw.go.jp/file/06-Seisakujouhou-11900000-Koyoukintoujidoukateikyoku/0000201596.pdf (accessed on 24 November 2021). (In Japanese).
- L. and W. (Japan) Ministry of Health, Building Environmental Health Management Standard, Ministry of Health, Labour and Welfare (Japan). 2008. Available online: https://www.mhlw.go.jp/bunya/kenkou/seikatsu-eisei10/index.html (accessed on 24 November 2021). (In Japanese).
- Ole Fanger, P. Thermal comfort. Analysis and Applications in Environmental Engineering; Danish Technical Press: Copenhagen, Denmark, 1970. [Google Scholar]
- Alsmo, T.; Alsmo, C. Ventilation and Relative Humidity in Swedish Buildings. J. Environ. Prot. 2014, 5, 1022–1036. [Google Scholar] [CrossRef] [Green Version]
- Kalamees, T.; Vinha, J.; Kurnitski, J. Indoor Humidity Loads and Moisture Production in Lightweight Timber-frame Detached Houses. J. Build. Phys. 2006, 29, 219–246. [Google Scholar] [CrossRef]
- Bornehag, C.-G.; Blomquist, G.; Gyntelberg, F.; Järvholm, B.; Malmberg, P.; Nordvall, L.; Nielsen, A.; Pershagen, G.; Sundell, J. Dampness in Buildings and Health.Nordic interdisciplinary review of the scientific evidence on associations between exposure to “dampness” in buildings and health effects (NORDDAMP). Indoor Air 2001, 11, 72–86. [Google Scholar] [CrossRef]
- Bornehag, C.-G.; Sundell, J.; Bonini, S.; Custovic, A.; Malmberg, P.; Skerfving, S.; Sigsgaard, T.; Verhoeff, A. Dampness in buildings as a risk factor for health effects, EUROEXPO: A multidisciplinary review of the literature (1998–2000) on dampness and mite exposure in buildings and health effects. Indoor Air 2004, 14, 243–257. [Google Scholar] [CrossRef]
- Derby, M.M.; Hamehkasi, M.; Eckels, S.; Hwang, G.M.; Jones, B.; Maghirang, R.; Shulan, D. Update of the scientific evidence for specifying lower limit relative humidity levels for comfort, health, and indoor environmental quality in occupied spaces (RP-1630). Sci. Technol. Built Environ. 2016, 23, 30–45. [Google Scholar] [CrossRef]
- Arundel, A.V.; Sterling, E.M.; Biggin, J.H.; Sterling, T.D. Indirect health effects of relative humidity in indoor environments. Environ. Health Perspect. 1986, 65, 351–361. [Google Scholar] [CrossRef] [Green Version]
- Wolkoff, P. Indoor air humidity, air quality, and health—An overview. Int. J. Hyg. Environ. Health 2018, 221, 376–390. [Google Scholar] [CrossRef]
- Andersen, I.; Msc, G.R.L.; Jensen, P.L.; Proctor, D.F. Human Response to 78-Hour Exposure to Dry Air. Arch. Environ. Health Int. J. 1974, 29, 319–324. [Google Scholar] [CrossRef]
- Abusharha, A.A.; Pearce, E.I. The Effect of Low Humidity on the Human Tear Film. Cornea 2013, 32, 429–434. [Google Scholar] [CrossRef]
- Liu, C.; Zhang, Y.; Sun, L.; Gao, W.; Jing, X.; Ye, W. Influence of indoor air temperature and relative humidity on learning performance of undergraduates. Case Stud. Therm. Eng. 2021, 28, 101458. [Google Scholar] [CrossRef]
- C.S.S. and T. (Japan) Ministry of Education, Statistical Investigation Report on School Health Care, Ministry of Education, Culture, Sports, Science and Technology (Japan). 2019. Available online: https://www.mext.go.jp/content/20210728-mxt_chousa01-000013187_1.pdf (accessed on 10 December 2021). (In Japanese).
- ISO 7730; Ergonomics of the Thermal Environment Analytical Determination and Interpretation of Thermal Comfort Using Calculation of the PMV and PPD Indices and Local Thermal Comfort Criteria. International Organization for Standardization: Geneva, Switzerland, 2005.
- Imanari, T.; Omori, T.; Bogaki, K. Thermal comfort and energy consumption of the radiant ceiling panel system. Energy Build. 1999, 30, 167–175. [Google Scholar] [CrossRef]


| Year | Date | Temperature (°C) | Humidity (%) | Wind Speed (m/s) | Precipitation (mm) | Sunshine Duration (h) | ||||
|---|---|---|---|---|---|---|---|---|---|---|
| Mean | Min | Max | Mean | Min | Max | Mean | Total | Total | ||
| 2019 | 28 August | 25.7 | 23.7 | 29.3 | 92 | 72 | 100 | 1.9 | 86.0 | 0.0 |
| 29 August | 25.3 | 24.0 | 29.4 | 91 | 65 | 100 | 1.8 | 43.0 | 1.6 | |
| 30 August | 25.6 | 23.2 | 29.6 | 79 | 44 | 82 | 1.7 | 0.5 | 1.7 | |
| September | 25.0 | 23.0 | 29.2 | 90 | 71 | 100 | 1.5 | 4.5 | 0.8 | |
| 3 September | 27.5 | 23.2 | 31.9 | 78 | 59 | 100 | 2.4 | 0.5 | 8.2 | |
| 4 September | 27.2 | 24.5 | 31.2 | 80 | 61 | 94 | 2.0 | 0.0 | 4.4 | |
| 5 September | 28.4 | 25.1 | 33.2 | 75 | 56 | 92 | 2.2 | 1.0 | 8.4 | |
| 6 September | 29.8 | 25.8 | 34.8 | 63 | 40 | 84 | 3.2 | 0.0 | 4.3 | |
| 9 September | 30.0 | 25.9 | 34.8 | 71 | 71 | 88 | 2.3 | 0.0 | 10.0 | |
| 2020 | 18 February | 4.8 | 2.1 | 8.4 | 57 | 46 | 68 | 3.6 | 0.0 | 3.0 |
| 19 February | 7.0 | 1.7 | 14.2 | 66 | 42 | 82 | 2.2 | 0.0 | 10.1 | |
| 20 February | 9.6 | 6.0 | 14.8 | 64 | 44 | 79 | 2.4 | 0.0 | 9.1 | |
| 21 February | 12.5 | 4.4 | 18.5 | 50 | 9 | 79 | 2.7 | 0.0 | 10.0 | |
| 25 February | 15.2 | 11.5 | 19.7 | 63 | 41 | 100 | 3.1 | 7.0 | 0.9 | |
| Instrument | Parameters | Accuracy | Resolution |
|---|---|---|---|
| Thermo Recorder TR-72 nw (T&D Corporation, Matsumoto, Japan) | Air temperature | ±0.5 °C | 0.1 °C |
| Thermo Recorder TR-72 nw | Relative humidity | ±5% RH | 1% RH |
| Thermochron Type-G (KN Laboratories, Inc., Osaka, Japan) | The temperature in the pocket of the right thigh | ±1 °C | 0.5 °C |
| CHINO, CPA (CHINO Corporation, Tokyo, Japan) | Thermography camera | ±2 °C | 0.15 °C |
| Question | First Majority Response | Second Majority Response | Third Majority Response | |||
|---|---|---|---|---|---|---|
| Description 1/2pt | % | Description | % | Description | % | |
| Responsible class | Nursery school directors | 33.8 | Under one year old | 16.4 | Five years old | 15.1 |
| What is the type of air-conditioning | Ceiling cassette | 87.3 | Ceiling and floor | 7.0 | Floor standing | 4.2 |
| Setting rate of sunshade | Facilities installed | 94.4 | Facilities not installed | 5.6 | - | - |
| Types of sunshades | Window curtains | 67.4 | Roller shutter | 11.2 | Window shades | 6.7 |
| Is the setting temperature of air-conditioning adaptive or fixed (summer) | Adaptive | 50.7 | Fixed | 49.3 | - | - |
| (winter) | Adaptive | 57.7 | Fixed | 42.3 | - | - |
| What are the reasons for starting or changing air-conditioning temperature (multi-choice) | The questionnaire respondents are feeling cold or hot | 26.9 | The children are feeling cold or hot | 25.1 | The indoor thermometer shows high or low temperatures | 22.0 |
| Problems in the operation of air conditioning system (multi-choice) | I do not know whether the set temperature of the air conditioner matches the temperature of the child’s space | 20.9 | If they use it for a long time, they worry about whether the children feel comfortable or not | 17.6 | The smell of air conditioning and mold | 15.4 |
| Question | Description | Median | Mean | SD |
|---|---|---|---|---|
| How do you feel the indoor air temperature in summer? (When air-conditioning is on) | 1 (cold) to 7 (hot) | 4 | 3.70 | 0.64 |
| (When air-conditioning is off) | 1 (cold) to 7 (hot) | 2 | 1.75 | 0.91 |
| How do you feel the indoor air temperature in winter? (When air-conditioning is on) | 1 (cold) to 7 (hot) | 4 | 4.06 | 0.45 |
| (When air-conditioning is off) | 1 (cold) to 7 (hot) | 6 | 5.18 | 1.62 |
| Are you satisfied with the indoor thermal environment in summer? (When air-conditioning is on) | 1 (strongly dissatisfied) to 7 (strongly satisfied) | 2 | 2.07 | 0.82 |
| (When air-conditioning is off) | 1 (strongly dissatisfied) to 7 (strongly satisfied) | 6 | 4.68 | 1.95 |
| Are you satisfied with the indoor thermal environment in winter? (When air-conditioning is on) | 1 (strongly dissatisfied) to 7 (strongly satisfied) | 2 | 2.16 | 0.98 |
| (When air-conditioning is off) | 1 (strongly dissatisfied) to 7 (strongly satisfied) | 5 | 4.22 | 2.07 |
| Do you think the indoor thermal environment is comfortable in summer? (When air-conditioning is on) | 1 (no), 2 (not sure), 3 (yes) | 3 | 2.86 | 0.43 |
| (When air-conditioning is off) | 1 (no), 2 (not sure), 3 (yes) | 1 | 1.35 | 0.61 |
| Do you think the indoor thermal environment is comfortable in winter? (When air-conditioning is on) | 1 (no), 2 (not sure), 3 (yes) | 3 | 2.85 | 0.36 |
| (When air-conditioning is off) | 1 (no), 2 (not sure), 3 (yes) | 1 | 1.45 | 0.66 |
| Have you ever noticed vertical temperature differences? | 1 (never), 2 (sometimes), 3 (often), 4 (always) | 3 | 2.68 | 0.86 |
| Have you ever noticed horizontal temperature differences? | 1 (never), 2 (sometimes), 3 (often), 4 (always) | 3 | 3.24 | 0.69 |
| Season | Period | Way of Adjusting Indoor Air Temperature | |
|---|---|---|---|
| One-Year-Old Children’s Classroom | Five-Years-Old Children’s Classroom | ||
| Summer | 28–30 August, 2–6 September, and 9 September 2019 | Air conditioning | Air conditioning |
| Winter | 18 February, 20–21 February 2020, and 25 February 2020 | Air conditioning | Air conditioning |
| 19 February 2020 | Air conditioning + floor heating | Air conditioning | |
| Season | Date | Children’s Classroom | Measurement Object (Number) |
|---|---|---|---|
| Summer | 29 August 2019 | One-year-old | 1, 2, 3, 4, 5. |
| Five-years-old | 7, 9, 11, 12. | ||
| Winter | 19 February 2020 | One-year-old | 1, 2, 3, 4, 5. 6 (only for winter measurement) |
| Five-years-old | 7, 9, 11, 12. 8 and 10 (only for winter measurement) |
| Date | Time | Schedule | Time | Schedule |
|---|---|---|---|---|
| 29 August | One-year-old | Five-years-old | ||
| 9:30~ | Measurement starts Gymnastics | 9:30~ | Measurement starts Free play | |
| 9:50~ | Having a snack | 9:40~ | Reading | |
| 10:10~ | Dancing | 9:50~ | Singing | |
| 10:20~ | Free play | 10:10~ | Exercise | |
| 10:50~ | Preparing for lunch | 10:40~ | Move to another classroom activity | |
| 11:30~ | Lunch | 12:10~ | Preparing for lunch | |
| 12:10~ | Free play | 12:20~ | Lunch | |
| 12:20~ | Taking a nap | 13:10~ | Tidying up | |
| 14:30~ | End the nap and free play | 13:20~ | Free play | |
| 14:40~ | Free play | 13:50~ | Reading | |
| 14:50~ | Tidying up | 14:50~ | Free play | |
| 15:00~ | Having a snack | 15:00~ | Outdoor | |
| 15:30~ | Measurement end | 15:30~ | Measurement end | |
| 19 February | One-year-old | Five-years-old | ||
| 10:00~ | Measurement starts Having a snack | 9:30~ | Measurement starts | |
| 10:10~ | Free play | 9:40~ | Reading | |
| 10:20~ | Reading | 9:50~ | Singing | |
| 10:30~ | Gymnastics | 10:10~ | Writing | |
| 10:50~ | Outdoor activity | 11:20~ | Outdoor activity | |
| 11:10~ | Free play | 11:50~ | Enter indoors and prepare for lunch | |
| 11:30~ | Lunch | 12:10~ | Lunch | |
| 12:20~ | Taking a nap | 12:40~ | Free play | |
| 14:30~ | End the nap and free play | 12:50~ | Outdoor activity | |
| 14:40~ | Free play | 14:00~ | Free play | |
| 14:50~ | Having a snack | 14:20~ | Move to another classroom activity | |
| 15:20~ | Measurement end | 15:00~ | Having a snack | |
| 15:20~ | Measurement end | |||
Publisher’s Note: MDPI stays neutral with regard to jurisdictional claims in published maps and institutional affiliations. |
© 2022 by the authors. Licensee MDPI, Basel, Switzerland. This article is an open access article distributed under the terms and conditions of the Creative Commons Attribution (CC BY) license (https://creativecommons.org/licenses/by/4.0/).
Share and Cite
Yuan, X.; Ryu, Y. Evaluation of Children’s Thermal Environment in Nursery School: Through the Questionnaire and Measurement of Wearable Sensors Approach. Int. J. Environ. Res. Public Health 2022, 19, 2866. https://doi.org/10.3390/ijerph19052866
Yuan X, Ryu Y. Evaluation of Children’s Thermal Environment in Nursery School: Through the Questionnaire and Measurement of Wearable Sensors Approach. International Journal of Environmental Research and Public Health. 2022; 19(5):2866. https://doi.org/10.3390/ijerph19052866
Chicago/Turabian StyleYuan, Xin, and Yuji Ryu. 2022. "Evaluation of Children’s Thermal Environment in Nursery School: Through the Questionnaire and Measurement of Wearable Sensors Approach" International Journal of Environmental Research and Public Health 19, no. 5: 2866. https://doi.org/10.3390/ijerph19052866
APA StyleYuan, X., & Ryu, Y. (2022). Evaluation of Children’s Thermal Environment in Nursery School: Through the Questionnaire and Measurement of Wearable Sensors Approach. International Journal of Environmental Research and Public Health, 19(5), 2866. https://doi.org/10.3390/ijerph19052866