Review

Historical Trends and Projections of Snow Cover over the High Arctic: A Review

by
Hadi Mohammadzadeh Khani
1,2,*,
Christophe Kinnard
1,2 and
Esther Lévesque
1,2
1
Centre de Recherche sur les Interactions Bassins Versants—Écosystèmes Aquatiques (RIVE), Département des Sciences de l’Environnement, Université du Québec à Trois-Rivières, Quebec, QC G8Z 4M3, Canada
2
Centre d’Études Nordiques (CEN), Quebec, QC G1V 0A6, Canada
*
Author to whom correspondence should be addressed.
Water 2022, 14(4), 587; https://doi.org/10.3390/w14040587
Submission received: 11 December 2021 / Revised: 6 February 2022 / Accepted: 9 February 2022 / Published: 15 February 2022
(This article belongs to the Special Issue Whither Cold Regions Hydrology under Changing Climate Conditions)

Abstract

:
Snow is the dominant form of precipitation and the main cryospheric feature of the High Arctic (HA) covering its land, sea, lake and river ice surfaces for a large part of the year. The snow cover in the HA is involved in climate feedbacks that influence the global climate system, and greatly impacts the hydrology and the ecosystems of the coldest biomes of the Northern Hemisphere. The ongoing global warming trend and its polar amplification is threatening the long-term stability of the snow cover in the HA. This study presents an extensive review of the literature on observed and projected snow cover conditions in the High Arctic region. Several key snow cover metrics were reviewed, including snowfall, snow cover duration (SCD), snow cover extent (SCE), snow depth (SD), and snow water equivalent (SWE) since 1930 based on in situ, remote sensing and simulations results. Changes in snow metrics were reviewed and outlined from the continental to the local scale. The reviewed snow metrics displayed different sensitivities to past and projected changes in precipitation and air temperature. Despite the overall increase in snowfall, both observed from historical data and projected into the future, some snow cover metrics displayed consistent decreasing trends, with SCE and SCD showing the most widespread and steady decreases over the last century in the HA, particularly in the spring and summer seasons. However, snow depth and, in some regions SWE, have mostly increased; nevertheless, both SD and SWE are projected to decrease by 2030. By the end of the century, the extent of Arctic spring snow cover will be considerably less than today (10–35%). Model simulations project higher winter snowfall, higher or lower maximum snow depth depending on regions, and a shortened snow season by the end of the century. The spatial pattern of snow metrics trends for both historical and projected climates exhibit noticeable asymmetry among the different HA sectors, with the largest observed and anticipated changes occurring over the Canadian HA.

1. Introduction

The High Arctic (HA) terrestrial ecosystem is a remote and extremely cold biome often referred to as a polar desert [1]. The HA ecosystem is shaped by significant interactions between biological, hydrological and climatological factors [2]. The average January temperature in the HA typically remains below −15 °C and in some extreme areas, below −30 °C [3] while the air temperatures in July typically do not exceed 10 °C [3,4]. From an ecological perspective, the HA is characterized by knee-depth tundra vegetation, which grows only in sheltered locations [5]. Snowfall is the dominant form of precipitation and snow cover is the main cryospheric feature of the HA, blanketing the land, sea, lake and river ice surfaces between early September and early June [6,7,8]. The snow cover is responsible for several interactions and feedbacks in the HA that influence the climate, hydrology and ecology [9,10] of the region, due to its effects on the surface energy balance (e.g., reflectivity), water balance (e.g., water storage and release), thermal regimes (e.g., insulation), vegetation and trace gas fluxes [7,10]. In the absence of tall vegetation, snow drifting during the long winter results in highly heterogeneous snow accumulation, which is governed mainly by the interaction of wind flow and topography [11]. The HA has been shown to be particularly susceptible to warming air temperatures and changing in atmospheric moisture [12,13,14,15]. Trends in historical climate have affected key characteristics of snow cover, such as its amount, timing and duration (e.g., [16,17,18]). These changing characteristics in snow cover can have significant and far-reaching consequences on HA ecosystems, such as soil energy balance and soil moisture availability in summer and controlling the length of the vegetation growing season [19,20].
Previous studies that analysed in situ and satellite observations have revealed different responses in regional snow cover in the Arctic to warming temperature and increasing winter precipitation over the past 40–50 years. Past reviews have reported and analysed changes in snow cover at large scales, i.e., for the whole Northern Hemisphere or Arctic region. The present review is the first to provide an integrative review of both historical and projected changes in snow cover conditions for the High Arctic, a climatologically and ecologically unique region that comprises the polar desert biome. The reviewed studies span a long period of existing data collection on snow metrics (beginning from 1930). Being the coldest and driest region of the Arctic, the HA could display drastic changes in snow conditions in the near future, in response to the ongoing and projected wetting and warming trends in the Arctic, triggering rapid ecosystem responses that could affect the global climate. The main objective of this review was thus to review the historical trends and future projections in snow cover characteristics of the HA region.
The ecological classification of Arctic regions by the Arctic Biodiversity Assessment [21] was used to delineate the HA region. Then, the climatological classification by Callaghan et al. [22] was used to divide the HA into different sectors (Figure 1).

2. Historical Snow Cover Variability from Observations

A comprehensive review of historical changes in snow metrics in HA regions is discussed in the following sections. Different observation data sources (in situ and remote sensing) have been used to identify and interpret historical changes in snow metrics due to changing climate. Historical changes in snow cover were examined using the snow metrics outlined in Table 1, which include precipitation (P), snow cover extent (SCE), snow cover duration (SCD), snow depth (SD) and snow water equivalent (SWE).
Most previous studies that evaluated and discussed changes in snow cover examined them over the whole Northern Hemisphere or pan-Arctic region. In this review, only published studies focusing on the historical and projected changes of snow cover over the HA region have been considered and included. Studies conducted in specific HA sectors were first reviewed, followed by studies made at the local scale. The trends in each snow metric are presented in tables and maps according to their location. Studies conducted at the regional scale were distinguished by italic format and in different colours inside the tables from the studies conducted on specific HA sectors. The direction of trends is indicated by arrows (upward: strongly positive; oblique upward: slightly positive; downward: strongly negative; oblique downward: slightly negative; horizontal arrow: no trend), and trend magnitude by a red (decreasing) to blue (increasing) colour scale. For studies that only reported the direction of the trend without its magnitude, a single plain colour was used to indicate the sign of the trend (red: decreasing; blue: increasing). Moreover, as studies used different units for reporting the trend in the snow metrics, trends were reported in common units to allow comparison between different studies (P: mm/decade, SD: cm/decade, SWE: mm water equivalent/decade, SCD: days/decade and SCE: percent/decade).

2.1. Precipitation

In the HA, snowfall is the main type of precipitation, mostly occurring in the wintertime and remaining on the ground between early September and early June [1,2]. Snowfall thus has a critical influence on the amount and duration of the snow cover [2,3]. Several studies of precipitation over the Arctic have reported a rising trend in precipitation during the last four decades [4,6] (Table 2). This increase in precipitation was linked with an increase in water vapor in the troposphere [7].
Winter precipitation has been increasing at high latitudes over most of the HA region (Table 2). On the long time (1930–2010), the Atlantic sector has experienced a significant increase in winter precipitation. For example, Callaghan et al. [22] analysed the trends in seasonal precipitation totals between October and May, corresponding to the snowfall season, for long-term meteorological stations and drifting stations located north of 70° N, for the 1936–2009 period. Their results indicated that cold season precipitation increased between 1936 and 1980 by as much as 9.1 mm per decade and 10.1 mm per decade between 1980 and 2010 (Table 2). However, there has been spatial variability in precipitation trends at the local scale. Heterogeneous and weakly positive precipitation trends were notably reported in Svalbard, in the Atlantic sector; while the trend was positive in the north of the archipelago (1.5 mm per decade), it was negative in the south (−0.5 mm per decade), for the period of 1961–2012 [17,23].
As for the Atlantic sector, the North European sector also experienced a significant positive trend of winter precipitation, with an increase of 6.2 mm per decade between 1936 and 1980, and 9.9 mm per decade between 1980 and 2010 (Table 2). Over the West Siberian sector, negative trends were reported for the period 1936–1980, while for the more recent 1980–2009 period, this sector encountered the greatest increase in winter precipitation (17.1 mm per decade) of all the HA sectors. In the west-Siberian sector of the HA, Frey and Smith [24] reported a reduction of winter precipitation of greater magnitude (−13 mm per decade) during 1958–1993 (Table 2).
The East Siberian, Chukchi and Alaskan sectors experienced an overall decrease in precipitation of, respectively, −3.5, −8.4 and −0.4 mm per decade between 1930 and 1980, while precipitation increased in the other HA sectors (Table 2). However, after 1980, Chukchi still had a negative, albeit smaller trend with (−3.3 per decade), while the Siberian and Alaskan sectors showed a positive trend of 1 and 10.1 mm per decade, respectively.
The Canadian sector experienced an increase in cold season precipitation in the long-term, i.e., over 1930–2010 (Table 2). The greatest increase happened during the 1930–1980 period (8.5 mm per decade), while an increase with smaller magnitude occurred afterward (2.9 mm per decade during 1980–2010). Another study by Zhang et al. [25] reported a similar trend but with smaller magnitude of 5.2 mm per decade for longer period (1961–1998). Some studies investigated precipitation trends at the regional and local scales across the Canadian HA (Table 2). As for Callaghan et al. [22], they found a positive trend in snowfall and a significant increase in annual (35%) and winter (45%) precipitation (indicating snowfall) over the Canadian HA over that period. In general, the ratio of snowfall to total precipitation has been rising in the Canadian HA, due mainly to an increase in winter precipitation that generally falls as snow (an average of 25%). Another study at the regional scale found a positive trend in cold season snowfall with a magnitude of 54% between 1948 and 2012 [8]. The same trend albeit of slightly smaller magnitude was also reported at the local scale: Young et al. [26] analysed precipitation trends in Resolute (Nunavut, Canada) for the period 1950–2009 and found that snowfall has increased by around 20%. A study by Bjorkman et al. [27] reported an increase in total winter snowfall of 10.9 cm per decade at Eureka (Nunavut) over the period 1995–2010.
While snowfall has overall increased during the cold season in the HA, Screen and Simmonds [28] revealed a pronounced decline in summer snowfall across the Arctic Ocean and Canadian Arctic Archipelago from 1989 to 2009, based on in situ and an atmospheric reanalysis data (ERA-Interim). They concluded that the snowfall decrease is almost entirely driven by changes in precipitation phase (snow turning to rain), which they attributed to the Arctic warming trend over that period.

2.2. Snow Cover Duration

Trends in snow cover duration (SCD) observed at different scales over the last century show that SCD has declined across most of the HA sectors. For example, Derksen et al. [20] reported that annual snow cover duration is decreasing by up to 5 days per decade over the Arctic since 1967. Callaghan et al. [22] reported even higher declines over the HA sectors, with the most extreme reduction noted in the Canadian and north European sectors of the HA, by as much as 10 days per decade over 37 years (1972–2009).
There has been evidence of regional variability in SCD reduction over the different HA sectors. For example, Derksen et al. [29] revealed that during the period 1980–2015 snow cover onset occurred earlier than normal over the eastern Canadian HA and later than normal over the Eurasian and Alaskan HA sectors. Snow-off dates were near normal over most of the Eurasian HA over the period 1981–2010. Bulygina et al. [30] selected different snow depth thresholds to derive SCD and quantify the impact of climate change on SCD over the Eurasian sector for the period 1966–2007. When using a 1 cm depth threshold for snow presence, they found that there was a significant reduction in SCD across all the HA sectors, by 2–6 days per decade. The main reason for the decline was attributed to decreasing snow depth over most of Eurasia. Zhang and Ma [31] also studied the trends in snow cover onset and disappearance dates, and snow cover persistence across Eurasia over the period of 1976–2006. Their results showed that both annual and seasonal SCD have decreased across the entire Eurasian HA sector, which is consistent with the earlier findings by Bulygina et al. [30] and Brown and Robinson [32]. Brown and Dreksen [29] used daily snow depth observations from Canada and concluded that SCD has reduced by 4.4 days per decade annually over the period 1955–2013. However, SCD declined by 1.8 days per decade from August to January and by 2.3 days from February to July. The northern part of Europe and Eurasia demonstrated the same trend but with lower values. However, the most northwestern part of the Siberian sector showed a positive trend of 2–4 days/decade.
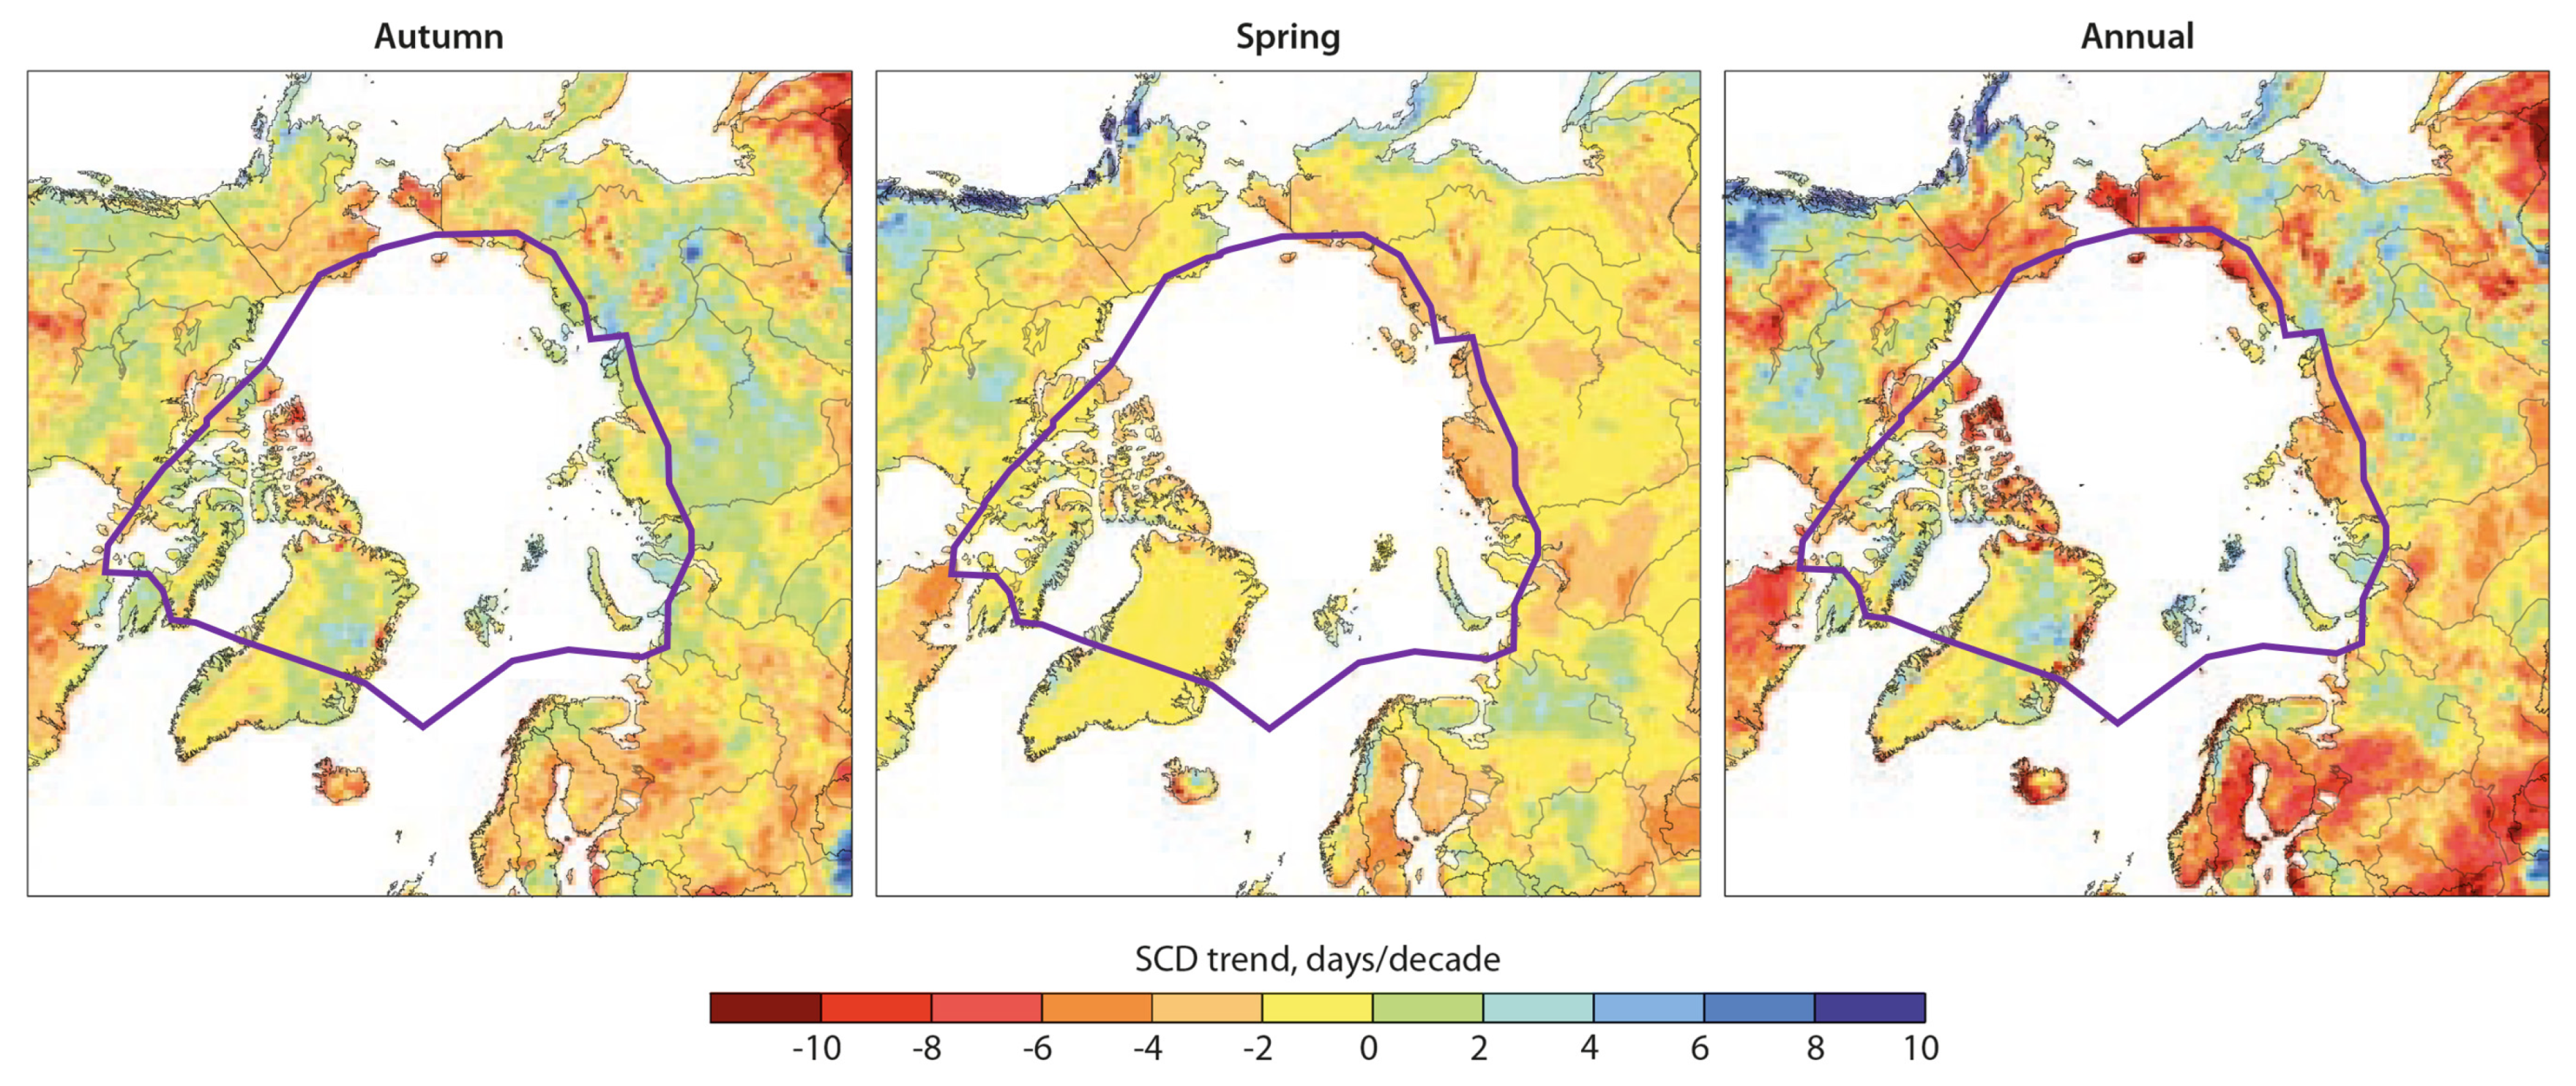
Several studies have attributed the negative trends in SCD to be mostly caused by earlier snow disappearance (Figure 2). Euskirchen et al. [33] studied seasonal snow cover variability over the 70–75° N latitude band, i.e., the southern region of the HA, over two warming periods of the 20th century (1910–1940 and 1970–2000) and found a greater sensitivity of snow cover to warming temperature during the more recent period. They also showed that spring SCD declined faster (1.1 days per decade) than the fall SCD (0.7 days per decade). Brown et al. [34] performed an extensive study on SCD based on ten different sources of data including SD observations, reanalysis, and satellite data. Figure 2 shows the trend in fall (left) and spring (right) SCD (days per decade) over the 1972–2008 period obtained from the NOAA weekly SCE data set maintained at Rutgers University [32]. Fall SCD mostly decreased over the Canadian, the east Eurasian, and Chukchi HA sectors between 2 to 10 days per decades, while it increased over the west and east Siberia between 2 to 6 days per decades (Figure 2).
Unlike the fall SCD, spring SCD showed a reduction between 4 to 10 days per decade within the HA during the 1972–2009 period (Figure 2). The pan-Arctic study of Callaghan et al. [22] showed that fall SCD decreased over all the HA except the East Siberian sector, with the largest decline in SCD observed over the North European and Canadian HA sectors. Spring SCD, on the other hand, decreased over all HA sectors except over the East Siberian and Atlantic sectors. This was consistent with the pattern of positive surface air temperature anomalies in the spring, observed over all Arctic land areas except for eastern North America [12]. However, in some regions (western Eurasia), declining SCD trends were attributed to a later winter onset [13]. Another study by Derksen et al. [20] confirmed this trend of declining SCD mostly driven by earlier spring melt over the whole HA. Using snow cover map produced from the NOAA daily Interactive Multisensor Snow and Ice Mapping System (IMS) for the period 1998–2010, they reported an earlier snow cover onset in the fall over much of the HA; however, the northern part of the North European sector and east part of the Atlantic sector showed an opposite trend (earlier onset by 10–20 days/decades).
At the local scale, Kankaanpää et al. [14] monitored the spatiotemporal variability of snowmelt patterns within the Zackenberg valley, northeast Greenland, over 2006–2014 [14]. They revealed that despite large interannual variations in snowmelt timing, the spatial pattern of snowmelt remained itself similar among sites. On Bylot Island in the Canadian HA sector, Bilodeau et al. [16] reported a significant reduction of 2 days per decade in SCD during the last two decades (2000s and 2010s). In Svalbard, Van Pelt et al. [17] found that the snow onset date in the fall increased by around 2 days per decade due to warming, whereas there was no significant trend in the snow disappearance date in response to spring/summer warming the period 1961–2012. Also, a recent study in archipelago (Svalbard) found a clear patterns of earlier snow melt date in the southern and central parts of the archipelago, while the northernmost parts exhibit little change or trend toward later snow melt date for the period 2000–2019 [18]. Young et al. [26] studied the variability of SCD in Bathurst and Cornwallis Island in the Canadian HA using a combination of in situ (point-scale) snow survey and snowmelt measurements, as well landscape-scale snow cover observations from remote sensing. They found no reduction in SCD at the point scale due to insufficient data, but they observed a shallower snowpack around ponds and plateau sites while they found deeper snow in incised valleys.

2.3. Snow Cover Extent

The Arctic land surface is covered by snow during a large part of the year, and approximately snow free during the short (July–August) summer, which makes the fall and spring transition seasons very important in terms of characterizing the temporal variability in SCE [20,22]. Over the last century, SCE has shown a significant decrease across the HA, with the sharpest decline observed since the early 1970s [32,36,37].
Several studies have used the weekly NOAA snow chart climate data record [38] to analyse changes in SCE over different time periods since 1966 [20,30,34,39]. Mudryk et al. [39] used the NOAA snow chart climate data record (CDR, [
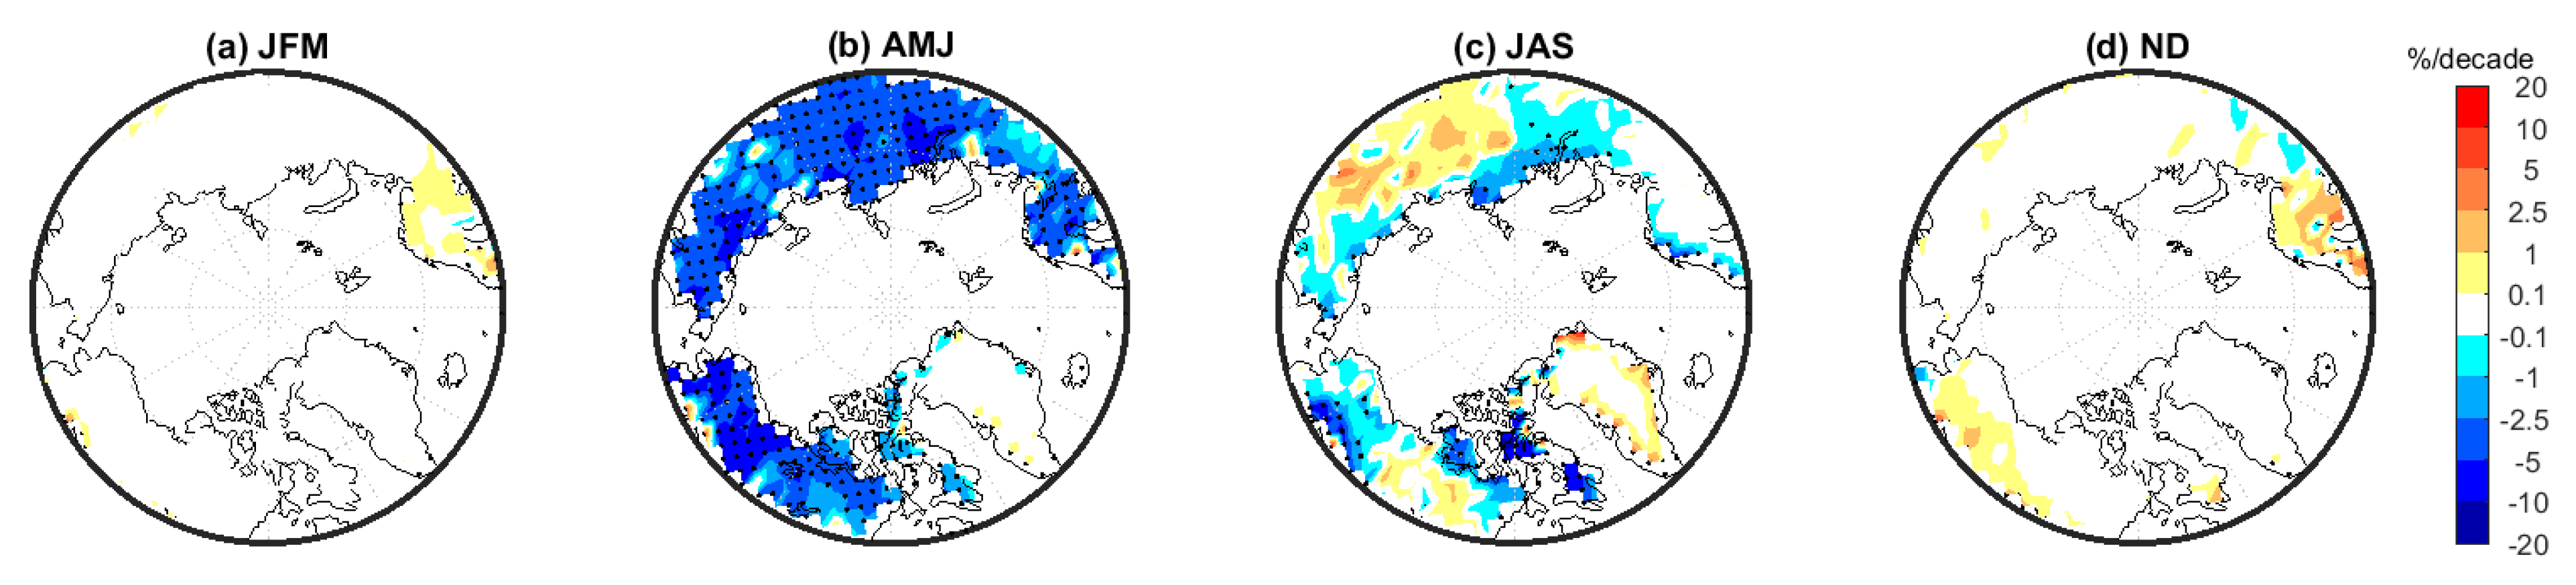
32]) to analyse spatial trends in snow cover over the Northern Hemisphere during the period 1981–2010. A large-scale decrease in SCE was found during spring over all HA sectors, with the most drastic reduction (20%) occurred over the northern European and Alaskan sectors. However, a significant increase in SCE was observed during winter and fall over the northern European and eastern Atlantic sectors. We recomputed linear trends in snow cover extent using the same dataset (the NOAA snow chart climate data record) but for the extended 1972–2021 period (Figure 3). Despite some differences among these studies and our updated trend maps regarding the seasonality of SCE trends, there is strong agreement that (i) annual SCE has declined overall; (ii) there is no evidence of significant changes in winter and early spring (JFM) SCE in the HA region, while (iii) extensive negative trends are seen during late spring (AMJ). Studies by Estilow et al. [38] and Thackeray et al. [40] reported that SCE declines were largest during summer, particularly during June and July over Arctic region. The updated trend map in Figure 3 shows negative trends in both spring (AMJ) and summer (JAS) in the HA, however significant trends are less extensive in summer than spring. No significant trends were found in the fall (ND).
In the Eurasian HA, Zhang and Ma [31] found no changes in SCE in winter during the 1975–2005 period, while declining SCE was observed in other seasons, particularly in summer with maximum reductions of 1.8% per decade. In Svalbard, North Atlantic HA, Van Pelt et al. [17] showed that end-of-summer SCE declined strongly (from 48 to 36%) for the period 1961–2012. Despite differences in trend magnitude due to the use of different datasets and time periods, all these studies consistently indicated reductions in spring and summer SCE over the 1981–2015 in HA regions except in the Atlantic sector (mainly Greenland), while no trends were reported in the fall across the Canadian and Atlantic sectors [38].
To compare and visualize the difference in SCE trends among cold regions (northern hemisphere, Arctic and High Artic), we analysed the seasonal trends in SCE using the NOAA weekly snow cover data [38] for each domain (Figure 4).
Despite the difference in the magnitude of the SCE reduction, SCE has declined overall across all the regions. However, both the Northern Hemisphere (NH) and the Arctic have experienced a significant SCE reduction since 1970 (1.03 and 0.3 million square kilometres per decade, respectively) while the HA has encountered a comparatively smaller reduction in spring SCE (0.03 million square kilometre per decade), due to the small area of the region. When looking at relative trends, the SCE reduction in spring has been much slower in the HA (−1.7%/decade) than the whole Arctic (−7.5%/decade) and NH (−5.5%/decade). SCE in the HA has reduced faster in summer (−6%/decade) than spring (−1.7%/decade), as is the case for the whole Arctic, due to the longer lasting snow cover. Overall, trends are slower in the HA compared to the Arctic-wide and NH-wide regions, as expected for the colder climate (Figure 4).

2.4. Snow Depth

Recent studies have indicated that (SD) has increased overall in the last few decades across the HA, except over the Canadian sector (Table 3). Snow depth was reported to increase over the Atlantic sector, for example by Van pelt et al. [17] who found a positive trend in mean snow depth in Svalbard. However, a study by Pedersen et al. [41] for Zackenberg showed no changes in snow depth. The greatest increase across the HA sectors was reported in the North European and Siberian sectors (Table 3). For instance, Bulygina et al. [30] analysed data for 1966 to 2007 over all the Eurasian sectors and found that the winter-averaged SD has increased in the western part of Russia, with maximum increases in Northern West Siberia (4 cm per decade). A similar positive trend was reported by Park et al. [42] across all the HA Siberian sectors (2012) with a magnitude of 2 cm per decade. Another study by Kitaev et al. [43] showed a similar trend but with a smaller magnitude of 1 cm per decade over all Siberian sectors between 1940 and 2002. Analysing snow depth in February from the same period, Popova [44] concluded that the most significant changes in snow depth were strongly connected to the strengthening of the zonal circulation at high latitudes that have continued since the beginning of the 1970s. The anomaly of the planetary wave pattern, induced by the declining sea ice in the Barents and Kara Seas, reinforced moisture transport and caused greater snow depth across western Siberia [45]. This is in accordance with earlier modelling results by Park et al. [17], who found a significant negative correlation between sea-ice extent in September and snow depths across north-eastern Siberia during autumn and winter, i.e., reduced sea-ice leading to higher snow depths.
Various studies for the Canadian HA reported significant decreases in snow depth (Table 3). For instance, Olsen et al., [12] found that the most pronounced reductions in snow cover and SD have occurred in the Canadian HA over the last century, while SD was increasing in a large portion of Eurasia. The analysis of winter and early spring snow depths from meteorological stations for the 1945–1995 period over the Canadian HA showed that the greatest decreases occurred in February and March. Also, maximum snow depth was reported to decrease by as much as 1 to 3 cm per decade in the Canadian HA during the 1960–2015 period [46]. Using observations from climate stations in Canadian HA regions, Vincent et al. [47] reported that the annual maximum snow depth decreased over the longer 1950–2012 period. These decreased SD were followed by significant decreases in spring and summer snow cover duration over most of the Arctic [46]. Snow depths trends were not linear, but rather were marked by a quick reduction from the mid-1970s onward that overlapped with a widely recorded change in atmospheric circulation in the Pacific-North American sector [48]. Park et al. [42] reported that the Alaskan HA exhibited a decrease in maximum snow depth of −2 cm per decade during the 1960–2010 period.
Local scale studies also revealed negative trends in SD within the Canadian and Alaskan HA sectors. A study in Alert (Nunavut) by Smith et al. [49] revealed that maximum winter snow depth obtained from Environment and Climate Change Canada meteorological stations, has decreased over 1950 to 2000 which is consistent with the larger-scale studies by Brown et al. [34] and Mudryk et al. [8]. Also, Stieglitz et al. [50] found that the mean snow depth over Prudhoe Bay (Alaskan sector) decreased significantly from 1940 to 2000 with the most dramatic reduction occurring in the 1970s. However, Bilodeau et al. [16] using in situ data from a meteorological station and manual measurements found that both the variability and the average winter snow depth have decreased over the last three decades in the western part of Bylot Island.
Table 3. Historical trends in SD (cm per decade). Positive trends are delineated by the blue colour scale and negative trends by the red colour scale (upward arrow: strongly positive; oblique upward arrow: slightly positive; downward arrow: strongly negative; oblique downward arrow: slightly negative; horizontal arrow: no trend). References
Spatial ScalePeriodReferences
19401950196019701980199020002010
Atlantic Water 14 00587 i002      2Bulygina et al. (2009) [30]
Svalbard Van Pelt et al. (2015) [17]
Zackenberg No differencePedersen et al. (2016) [41]
North European Water 14 00587 i001      4Bulygina et al. (2009) [30]
Water 14 00587 i001         3Park et al. (2012) [42]
West Siberian Water 14 00587 i001      4Bulygina et al. (2009) [30]
Water 14 00587 i002         2Park et al. (2012) [42]
East Siberian Water 14 00587 i002           1.35Kitaev et al. (2002) [43]
Water 14 00587 i002         1Park et al. (2012) [42]
Water 14 00587 i002      2Bulygina et al. (2009) [30]
Chukchi Water 14 00587 i002           1kiatev et al. (2002) [43]
Water 14 00587 i002         1Park et al. (2012) [42]
Water 14 00587 i001      4Bulygina et al. (2009) [30]
Alaskan Water 14 00587 i003      −2Park et al. (2012) [42]
Prudhoe Bay Stieglitz et al. (2003) [50]
Canadian Water 14 00587 i003        −2Park et al. (2012) [42]
Brown et al. (2010) [34]
Vincent et al. (2010) [47]
Bylot Bilodeau et al. (2013) [16]
Alert Smith et al. (2003) [49]

2.5. Snow Water Equivalent

Compared to other snow metrics, monitoring snow water equivalent (SWE) is more complicated due to limited surface observations and lingering challenges in retrieving SWE from remote-sensing data [51]. Despite this, recent studies have demonstrated significant reductions in SWE over much of the last century. The results from these studies are summarized in Table 4. A combination of in situ, remote sensing data and climate model outputs have been used to study the trends and variability of SWE across the Arctic. Despite the uncertainties associated with SWE retrieval algorithms, satellite data are best suited to investigate trends in SWE at large spatial scales.
Muskett [52] used multi-satellite sensors to derive the variations and trends in mean SWE at high latitudes of the Northern Hemisphere from 1978 to 2010. Their study revealed increasing SWE trends with regional variations in magnitude across the Siberian HA, while significant decreasing SWE trends were found across the western Siberia HA. Jeong et al. [53] used the GlobSnow observation dataset to characterize the temporal changes in SWE in the spring (February–April) between 1980–2012 for the Northern Hemisphere. Based on their results, the trend of observed SWE for February, March, and April showed tremendous spatial variability. In the HA, the Chukchi sector was the only region with increasing SWE during the spring. This could be due to significant increases in the cumulative precipitation from the previous winter to spring months. Other sectors showed overall decreases over the 1980–2012 period, which could be largely attributable to rising temperatures for the same months and/or decreasing winter precipitation [53].
Table 4. Historical trends in SWE (mm per decade). Positive trends are delineated by the blue colour scale and negative trends by the red colour scale (upward arrow: strongly positive; oblique upward arrow: slightly positive; downward arrow: strongly negative; oblique downward arrow: slightly negative; horizontal arrow: no trend). References
Spatial ScalePeriodReferences
194019501960197019801990200020102020
Atlantic
Svalbard Water 14 00587 i002        10Van Pelt et al. (2015) [17]
North European Water 14 00587 i002    10Jeong et al. (2017) [53]
West Siberian Water 14 00587 i002            7Brown et al. (2017) [10]
East Siberian Water 14 00587 i002            7Brown et al. (2017) [10]
Chukchi
 
Water 14 00587 i002            7Brown et al. (2017) [10]
Water 14 00587 i002    10Jeong et al. (2017) [53]
Alaskan Water 14 00587 i004−2 Brown et al. (2017) [10]
Canadian Water 14 00587 i004        −7Brown et al. (2017) [10]
Southeast Water 14 00587 i003    −50Mudryk et al. (2018) [8]
Southeast Water 14 00587 i002    10Jeong et al. (2017) [53]
Southwest Water 14 00587 i001    50Mudryk et al. (2018) [8]
Southwest Water 14 00587 i002    10Jeong et al. (2017) [53]
North Water 14 00587 i004    −11Mudryk et al. (2018) [8]
The southern Canadian HA showed significant spatiotemporal variability in SWE trends [54]. Decreasing trends were more pronounced in spring (10 mm/year) and in the southeast and south, while an increase (10 mm/year) was found in the southwest [8]. With advancing in the spring season (March to April) the larger area of snow cover in the west demonstrated a negative trend of SWE. There were two main reasons for these trends: mostly because of increasing temperatures for the same months and/or decreasing cumulative precipitation from the December to spring months [8,53]. Li et al. [55] used three different satellite products to estimate SWE trends at the scale of the Northern Hemisphere over a 32-year period (1979/80–2010/11). Their results showed a significant reduction in the total mass of snow for the HA regions. The most remarkable changes in total snow mass, −50 mm per year, occurred during January in northern Europe. Zhang and Ma [31] investigated the trends in seasonal and annual snow water equivalent (SWE) over Eurasia from 1979 to 2005. They found that annual SWE has decreased all over the region, with North Europe and west-Siberia showing the maximum reduction (−5.8 mm/decade).
Trends in SWE have shown pronounced seasonality, with the most dramatic reduction (−15.7 mm/decade) occurring in the spring. Brown et al. [10] analysed the trends in SWE using daily snow depth observations from the Global Historical Climatology Network (GHCN) and snow densities from snow surveys over the Arctic except Greenland. Their results indicated that SWE has decreased by −0.7 cm/decade across the Canadian HA during the period 1955–2013. It was also shown that SWE has decreased overall by −0.2 mm/decade over the Russian HA during that period. However, SWE increased during the earlier 1967–1993 period by 6.6 mm/decade, and then decreased afterwards by −4.9 mm/decade from 1994–2011 over the Russian Arctic. Mudryk et al. [8] showed considerable spatial heterogeneity in maximum SWE (SWEmax) trends for 1981–2015 across the Canadian HA. They discovered that SWEmax has decreased by 5–7.5% per decade in the north and by 2–5% in the southern part, while the west part has increased by as much as 2–5% per decade. There were no changes in the eastern part of the HA. This is consistent with the results of Jeong et al. [53] over the same period. A study on Svalbard snow cover changes published by Van Pelt et al. [17] showed that SWEmax in winter/spring has increased slightly (1 cm/decade) over the period 1961–2012.

3. Projected Snow Cover Conditions in the High Arctic

Small changes in climate may produce significant changes in snow availability and its spatiotemporal distribution. As such, snow-covered landscapes and ecosystems are very vulnerable to climate change and climate change will modify the availability of snow resources in the future [56]. Thus, developing methods to assess the impacts of potential future climate change scenarios on snow variables is an important task. Several methods have been developed and used to assess impacts of future climate change scenarios. More recent works have also proposed machine learning approaches to quantify climate impacts on snow cover [57,58]. Reasonable climate scenarios, which define the possible responses of the HA snow cover to changing Arctic climate, are essential for climate impact assessments and adaptation strategies [59]. Although much progress has been made in understanding and predicting snow-cover changes and their multiple consequences, many uncertainties remain [59]. Most of the projected scenarios anticipated for the terrestrial HA show that the snow metrics analysed in this review will be significantly modified over the climatological period of the twenty-first century [60,61,62]. The following sections present a review of the projected changes in HA sectors in terms of the changes in snow metrics outlined in Table 1.

3.1. Precipitation

It is anticipated that future snow cover trends, which are influenced by snowfall rates, atmospheric circulation, surface air temperature, and radiative forcing, will continue altering during the 21st century [63]. The majority of global climate models (GCMs) have predicted that winter snowfall (and precipitation more generally) will increase significantly at the high-latitudes of the Arctic [64]. The main reason for the increase in precipitation seems to be mostly connected to the greater moisture holding capacity of the warmer air rather than large-scale circulation changes [65]. However, the report of the Intergovernmental Panel on Climate Change (IPCC) emphasized that the cause of the precipitation increase over the Arctic can be mostly attributed to precipitation enhancement by the intensification of the activity of extratropical cyclones [66]. Also, to evaluate projected changes in future snow conditions, Raisanen [67] analysed the simulation of snow conditions provided by 20 global climate models. Their results revealed that mean winter (NDJFM) snowfall rates will rise by up to 45% across most of the northern high latitudes. To analyse projections of the Northern Hemisphere snowfall under the representative concentration pathway (RCP4.5) scenario, Krasting et al. [68] used 18 coupled atmosphere–ocean global climate models from the phase 5 Coupled Model Intercomparison Project (CMIP5) for the period of 2006–2100. Their results indicated that annual snowfall is anticipated to increase during the twenty-first century at higher latitudes, particularly in the HA sectors except for the northern Europe and West-Siberian sectors (Figure 4). On a seasonal basis, the highest increases in snowfall are anticipated to occur during wintertime (3 cm per decade) in the Chukchi and East-Siberian sectors, while negative trends are projected in spring and fall over large regions of the Northern European HA (9 cm per decade).
Despite the projected increases in total precipitation, it is anticipated that the annual snowfall rate will significantly drop by the end of the 21st century (Figure 5). Bintanja et al. [69] used 37 climate models in standardized twenty-first century (2006–2100) simulations to project the snowfall fraction. Their model outputs demonstrated that despite an intensifying of precipitation, the snowfall amount will strongly reduce by the end of century (2091–2100) and the dominant form of precipitation will be rain. The projected Arctic snowfall decrease was more pronounced in summer and autumn when temperature is reaching to melting point [70,71].

3.2. Snow Cover Duration

There are several studies that investigated and projected the future changes in SCD using multiple climate models, both at the annual and seasonal scales and for different time periods. Annual SCD is projected to decline across all the HA sectors for both RCP4.5 and RCP8.5 emission scenarios for the period 2006–2090 [10]. Annual SCD is projected to reduce by up to 10% under RCP4.5 and by up to 20% under RCP8.5 by 2050 in the HA (Figure 5) but with much larger relative decreases (>30%) over the European HA and western Alaska (Figure 6).
The highest SCD reduction (40–60%) is projected to occur by 2090 over the European HA. Decreasing SCD projections were also reported for the whole HA for the period of 2020–2080 [10]. Callaghan et al. [22] compared annual SCD projected for the 2049–2060 period with 1970–1999, produced using a composite of six of the highest resolution GCMs. Significant reductions in SCD of 10–20% were simulated over most of the Arctic by 2050, which the smallest losses occurring over Siberia (10%) and the largest reduction across Alaska (30–40%). Lawrence and Slater [63] used a Community Climate System Model simulation of the twentieth and twenty-first centuries to evaluate future changes in snow cover for the end of century 2080–2099 period. In terms of seasonal SCD, their results revealed that seasonal SCD will decrease significantly, with reductions of −14 ± 7 days in spring and −20 ± 9 days in autumn.

3.3. Snow Cover Extent

Seasonal snow cover extent (SCE) responds to both temperature and precipitation. SCE is anticipated to decrease in response to projected increasing temperature. The reduction of seasonal SCE is coupled to a shortening of the snow cover duration (Table 5). The CMIP5 models projected widespread reductions in SCE, particularly in spring [61]. Thackeray et al. [40] analysed the spring SCE projected by the CMIP5 ensemble models for the near term 2011–2040 period (Table 5). Their result showed that by the mid-century, there will be significant losses of snow cover extent, particularly in northern Europe compared to 2010 (10%). They also projected that by the latter half of the twenty-first century, the snow cover in June could completely disappear in response to rising global average temperature under the RCP8.5 scenario. Henderson et al. [72] projected Arctic snow cover changes in October, i.e., during the typical snow cover onset season, for the 2063–2092 period and under the RPC8.5 scenario. They found an overall snow cover reduction over all HA sectors, with the largest projected reductions reaching 35%.
Using the CMIP5 ensemble simulations, Mudryk et al. [8,73] showed that the snow cover extent in the fall and spring will reduce by 5–10% in the Canadian HA by 2020–2050. On the other hand, the snow cover between January and March was projected to decline only slightly, by 0.5%. However, larges differences in snow cover declines were noted within the Canadian HA, with snow cover declining faster in the southern parts than in the northern parts (Table 5).

3.4. Snow Depth

Projected snow depth trends were found to be highly heterogeneous across the High Arctic. Lawrence and Slater [63] used a Community Climate System Model simulation of twentieth and twenty-first century climate over 2070–2099 which they compared to the reference period 1950–1969. Their results demonstrated asymmetric trends in maximum snow depth across the HA sectors (Table 6). Despite a generalized snowfall increase projected in the Arctic (cf. Section 3.1), the maximum snow depth in the Alaskan and Canadian HA was projected to decrease due to a shortening of the snow cover duration (see Figure 5), more frequent autumn and mid-winter melting, and increased snowpack compaction. Over the East-Siberian, snow depth was projected to increase where snowfall was projected to increase (Table 6) and where declining snow cover duration was moderate. The most drastic SD reductions (about 40 cm) were projected over north Europe while no significant changes in snow depth were found over the Atlantic sector (eastern part of Greenland).
Some studies reported that the timing of maximum snow depth would be altered in the future. For example, in Svalbard, projected climate change led to an earlier peak of maximum snow depth in the spring and an increased frequency and intensity of wintertime rain-on-snow events (Adakudlu et al. [74]).

3.5. Snow Water Equivalent

Different trends in SWE were projected across the HA sectors. Shi and Wang [61] projected global mean annual and seasonal SWE for three different time periods including 2015–2035, 2046–2065, 2080–2099 (Table 7). Their objectives were to assess how will SWE respond to different RCPs scenarios in the 21st century in terms of the magnitude, timing and seasonality across the of Northern Hemisphere. They also studied the relative contributions of air temperature and precipitation changes to the projected SWE changes over the 21st century.
Their results for mean annual SWE showed similar trends for three different periods, with SWE decreasing overall in the Atlantic, North European, Alaskan and Canadian sectors, and generally increasing in the Chukchi, East-Siberian and West-Siberian sectors (Table 7). More contrasted seasonal trends were found however: SWE was projected to increase by up to 20% in winter and spring, except in the North European sector and eastern Atlantic sector where SWE could decrease by up to 15%. SWE was projected to decrease overall in summer and fall over the HA for all three time periods, particularly in the late 21st century. The projected negative SWE trends were of similar magnitude under the different RCP scenarios until 2035. However, thereafter the negative SWE trend accentuated under the RCP8.5 scenario.
Raisanen [67] used 20 global climate models to study changes in SWE for 21st century. Mean SWE in March was projected for the 2000–2049 and 2050–2099 periods and compared to reference period 1950–1999. In March, SWE was projected to increase in both the mid- and late-century periods over the HA, except in the North European Europe and Atlantic sectors. Projected increases in SWE reached 15% by 2000–2049 and 30% by 2050–2099. This was matched by equivalent decreases in SWE in the North European and Atlantic sectors, by 15% for 2000–2049 and 30% for 2050–2099. The authors suggested that SWE has a strong positive partial correlation with precipitation throughout the 21st century. As such, the projected increased in SWE was mainly attributed to the projected increases in precipitation in the HA.
Future changes in maximum monthly SWE were investigated by Callaghan et al. [22] using a composite of six of the highest resolution GCMs, that met the Arctic performance criteria applied in Overland et al. [75]. Projected trends in maximum monthly SWE for the 2049–2060 period was compared to the reference period 1970–1999. Their outcomes demonstrate a slight increase in maximum SWE, by 0–15%, across most of the High Arctic, with the largest increases (15–30%) projected in all Siberian sectors (including east and west Siberia and Chukchi).
At the country scale, Mudryk et al. [8] projected future changes in maximum SWE for Canada. An overall increase in maximum SWE of 5% per decade was found for the Canadian HA, but with significance spatial heterogeneity within the sector.

4. Discussion and Conclusions

Snow cover is a defining feature of High Arctic landscapes during at least 9 months of the year. This review has shown that climate change has clearly affected snow cover conditions (Table 1) in the HA. Observational evidence from in situ and satellite data demonstrate that the snow cover has been modified across the Arctic [8,10,76] as a result of warming air temperatures during the last decades and is expected to continue doing so into the present century according to the IPCC six assessment report on climate change [66].
In terms of precipitation, spatial differences in both the sign and magnitude of precipitation trends were found in the High Arctic over the last century. Snowfall has generally increased in the HA over the last four decades, except over the Chukchi sector. This increase in precipitation was attributed to increasing water vapor in the troposphere under warming temperature, as demonstrated by theoretical considerations [7]. The enhanced atmospheric water vapor content increases the moisture sources over the HA which result in heavier snowfall during winter and autumn, especially in the Eurasian HA [77]. Despite the increased snowfall during the last decades, the warming trend has caused a shortening of the snowfall season over the past two decades, which has led to decreases in snow cover duration, and in some sectors, reduced snow depths [28,77,78]. Of the snow cover metrics reviewed, only the snow cover duration (SCD) showed a homogenous decrease over all the HA sectors, by as much as 10 days per decade over 37 years (Figure 2), which was consistent with a concurrent decrease in air temperature [79]. The most drastic decrease in SCD was observed across the western part of the Canadian HA and Chukchi sector, by 8–10 days per decade. The trends in SCD appear to have been largely driven by earlier snow disappearance (snowmelt) which implies that snow cover onset (beginning of SCD) is less strongly coupled to air temperature than the snow-off date (end of SCD). During the spring, the SCD has decreased over all the HA sectors while the SCD trend in the fall was more heterogeneous: decreasing across Canada, Eurasia, and Chukchi, but increasing over the West-Siberian and East-Siberian sectors. Annual, spring (AMJ) and summer (JAS) SCE have experienced a significant reduction across all the HA sectors, which is consistent with the increase in air temperature and observed declining trend in June sea ice extent [34]. Significant SCE losses have been the most widespread in spring, followed by summer, while no significant changes were found in winter and fall [80] (Figure 3). Historical trends in SWE show remarkable heterogeneity across the HA sectors, following the trends in snow depth (SD) [10,81]. Observed data revealed that SWE increased, in parallel with snow depth, over all the sectors except the Canadian and the Chukchi sector.
Based on projections from global climate models, the snow metrics examined in this study are projected to continue changing over the twenty-first century in the HA. Most global climate models (GCMs) predict that winter snowfall (and precipitation more generally) will increase significantly in the high latitudes of the Arctic [82]. The main reason for the increase in precipitation seems to be mostly connected to the greater moisture capacity of the warmer air rather than large-scale circulation changes [65]. However, snowfall is projected to decrease in spring and autumn when temperature is reaching to melting point [69,70].
Despite the increase in winter snowfall, models predict that snow cover may become thinner and melt out earlier due to warming air temperature. The increase in temperature acts to reduce snow accumulation both by reducing the fraction of precipitation that falls as snow and by increasing snowmelt [67]. Most projections suggested that the magnitude of the changes in snow cover characteristics would be more intense after the mid-century. Despite the homogenous historical changes in SCD and SCE observed across all the HA sectors, asymmetrical SWE and SD trends are projected over the HA sectors, with the Siberian HA showing significant increases in SWE and SD, while drastic decreases are projected over the Canadian and Alaskan HA sectors.
The analysis of historical and projected changes in snow cover metrics made in this review suffered from the complexity of dealing with study results originating from different time periods and sources. Despite our best effort to report changes in common units in the summary tables, the complexity of merging different spatial and temporal scales still affect our ability to interpret coherent patterns of changes. The uncertainty in projections made with different models is also apparent, e.g., in the SCE and SWE projections (Table 5 and Table 7). Moreover, given that projections in precipitation are more spatially variable and uncertain than temperature, particularly at the regional and local scales [82,83], this uncertainty may limit our capacity to accurately project future snowpack changes.
The output of this review shows that climate change has already affected both the magnitude and seasonality of snow cover in the High Artic and that these modifications will continue to take place in the upcoming decades, affecting the ecosystems and the permafrost distribution of the region. This emphasizes that immediate actions are needed to adapt existing ecosystem management plans to mitigate the accelerating warming trend in the High Arctic.

Author Contributions

Conceptualization, H.M.K.; formal analysis, H.M.K. and C.K.; Writing—Original Draft Preparation: H.M.K.; Writing—Review & Editing, C.K. and E.L.; Supervision, C.K. and E.L.; Funding Acquisition, C.K. and E.L. The authors confirm contributions to the paper as follows. All authors have read and agreed to the published version of the manuscript.

Funding

This research was funded by the Natural Sciences and Engineering Council of Canada, grant numbers RGPIN-2015-03844 (C. Kinnard) and RGPIN-2015-05319 (E. Lévesque), the Canada Research Chair program, grant number 231380 (C. Kinnard) and the Centre de Recherche sur les interactions Bassins Versants Écosystèmes Aquatiques (RIVE) (H. Mohammadzadeh Khani).

Institutional Review Board Statement

Not applicable.

Informed Consent Statement

Not applicable.

Data Availability Statement

The NOAA weekly snow cover charts used to produce Figure 3 and Figure 4 are available from: https://www.ncei.noaa.gov/access/metadata/landing-page/bin/iso?id=gov.noaa.ncdc:C00756 (accessed on 10 December 2021).

Acknowledgments

We would like to express our sincere gratitude to the Arctic Monitoring and Assessment Program (AMAP) and the Journal of Climate for permission to use some of their figures in this review. We thank Stephan Gruber and Daniel Fortier for reviewing an earlier version of this manuscript. Finally, but most importantly, we thank all the researchers who have generated the knowledge and findings reviewed in this study.

Conflicts of Interest

The authors declared no potential conflicts of interest with respect to the research, authorship, and/or publication of this article.

References

  1. Woo, M.-K.; Young, K.L. High Arctic wetlands: Their occurrence, hydrological characteristics and sustainability. J. Hydrol. 2006, 320, 432–450. [Google Scholar] [CrossRef]
  2. Woo, M.K. Permafrost Hydrology; Springer: Berlin/Heidelberg, Germany, 2012; p. 574. [Google Scholar]
  3. Yang, D.; Goodison, B.E.; Metcalfe, J.R.; Louie, P.; Leavesley, G.; Emerson, D.; Hanson, C.L.; Golubev, V.S.; Elomaa, E.; Gunther, T.; et al. Quantification of precipitation measurement discontinuity induced by wind shields on national gauges. Water Resour. Res. 1999, 35, 491–508. [Google Scholar] [CrossRef]
  4. Pavelsky, T.M.; Smith, L.C. Intercomparison of four global precipitation data sets and their correlation with increased Eurasian river discharge to the Arctic Ocean. J. Geophys. Res. Atmos. 2006, 111, 1–20. [Google Scholar] [CrossRef]
  5. Bird, J.B. The Physiography of Arctic Canada; With Special Reference to the Area South of Parry Channel. J. Geol. 1967, 76, 725–726. [Google Scholar]
  6. Rawlins, M.A.; Steele, M.; Holland, M.M.; Adam, J.C.; Cherry, J.E.; Francis, J.A.; Groisman, P.; Hinzman, L.D.; Huntington, T.; Kane, D.L.; et al. Analysis of the Arctic system for freshwater cycle intensification: Observations and expectations. J. Clim. 2010, 23, 5715–5737. [Google Scholar] [CrossRef]
  7. Held, I.M.; Soden, B.J. Robust responses of the hydrological cycle to global warming. J. Clim. 2006, 19, 5686–5699. [Google Scholar] [CrossRef]
  8. Mudryk, L.R.; Derksen, C.; Howell, S.; Laliberté, F.; Thackeray, C.; Sospedra-Alfonso, R.; Vionnet, V.; Kushner, P.J.; Brown, R. Canadian snow and sea ice: Historical trends and projections. Cryosphere 2018, 12, 1157–1176. [Google Scholar] [CrossRef] [Green Version]
  9. Marsh, P.; Woo, M.K. The water balance of a small pond in the High Arctic. Geology 1997, 30, 109–117. [Google Scholar] [CrossRef] [Green Version]
  10. Brown, R.; Schuler, D.V.; Bulygina, O.; Derksen, C.; Wang, K.L.; Yang, D. Chapter 3: Arctic terrestrial snow cover. In Snow, Water, Ice and Permafrost in the Arctic (SWIPA); Arctic Monitoring and Assessment Programme: Oslo, Norway, 2017; pp. 25–64. [Google Scholar]
  11. Liston, G.E.; Hiemstra, C.A. The changing cryosphere: Pan-Arctic snow trends (1979–2009). J. Clim. 2011, 24, 5691–5712. [Google Scholar] [CrossRef]
  12. Olsen, M.S.; Callaghan, T.V.; Reist, J.D.; Reiersen, L.O.; Dahl-Jensen, D.; Granskog, M.A.; Goodison, B.; Hovelsrud, G.K.; Johansson, M.; Kallenborn, R.; et al. The changing arctic cryosphere and likely consequences: An overview. AMBIO 2011, 40 (Suppl. 1), 111–118. [Google Scholar] [CrossRef] [Green Version]
  13. Hori, M.; Sugiura, K.; Kobayashi, K.; Aoki, T.; Tanikawa, T.; Kuchiki, K.; Niwano, M.; Enomoto, H. A 38-year (1978–2015) Northern Hemisphere daily snow cover extent product derived using consistent objective criteria from satellite-borne optical sensors. Remote Sens. Environ. 2017, 191, 402–418. [Google Scholar] [CrossRef]
  14. Kankaanpää, T.; Skov, K.; Abrego, N.; Lund, M.; Schmidt, N.M.; Roslin, T. Spatiotemporal snowmelt patterns within a high Arctic landscape, with implications for flora and fauna, Arctic. Antarct. Alp. Res. 2018, 50, 1–17. [Google Scholar] [CrossRef] [Green Version]
  15. Alekseev, G.; Kuzmina, S.; Bobylev, L.; Urazgildeeva, A.; Gnatiuk, N. Impact of atmospheric heat and moisture transport on the Arctic warming. Int. J. Climatol. 2019, 39, 3582–3592. [Google Scholar] [CrossRef] [Green Version]
  16. Bilodeau, F.; Gauthier, G.; Berteaux, D. The effect of snow cover on lemming population cycles in the Canadian High Arctic. Oecologia 2013, 172, 1007–1016. [Google Scholar] [CrossRef] [PubMed]
  17. Van Pelt, W.J.; Kohler, J.; Liston, G.E.; Hagen, J.O.; Luks, B.; Reijmer, C.H.; Pohjola, V.A. Multidecadal climate and seasonal snow conditions in Svalbard. J. Geophys. Res. Earth Surf. 2016, 121, 2100–2117. [Google Scholar] [CrossRef]
  18. Vickers, H.; Karlsen, S.R.; Malnes, E. A 20-Year MODIS-based snow cover dataset for svalbard and its link to phenological timing and sea ice variability. Remote Sens. 2020, 12, 1123. [Google Scholar] [CrossRef] [Green Version]
  19. Royer, A.; Picard, G.; Vargel, C.; Langlois, A.; Gouttevin, I.; Dumont, M. Improved Simulation of Arctic Circumpolar Land Area Snow Properties and Soil Temperatures. Front. Earth Sci. 2021, 9, 1–19. [Google Scholar] [CrossRef]
  20. Derksen, C.; Brown, R.; Mudryk, L.; Luojus, K. Chapter 5: The Arctic. In State of the Climate in 2015; American Meteorological Society: Boston, MA, USA, 2016; p. 275. [Google Scholar]
  21. Barry, T.; Kurvits, T.; Alfthan, B.; Mork, E. Arctic Biodiversity Trends 2010—Selected Indicators of Change; CAFF International Secretariat: Akureyri, Iceland, 2010; p. 121. [Google Scholar]
  22. Callaghan, T.V.; Johansson, M.; Brown, R.D.; Groisman, P.Y.; Labba, N.; Radionov, V.; Barry, R.G.; Bulygina, O.N.; Essery, R.L.H.; Frolov, D.M.; et al. The changing face of Arctic snow cover: A synthesis of observed and projected changes. AMBIO 2011, 40, 17–31. [Google Scholar] [CrossRef] [Green Version]
  23. Førland, E.J.; Benestad, R.; Hanssen-Bauer, I.; Haugen, J.E.; Skaugen, T.E. Temperature and Precipitation Development at Svalbard 1900–2100. Adv. Meteorol. 2011, 2011, 1–14. [Google Scholar] [CrossRef]
  24. Frey, K.E.; Smith, L.C. Recent temperature and precipitation increases in West Siberia and their association with the Arctic Oscillation. Polar Res. 2003, 2, 287–300. [Google Scholar] [CrossRef] [Green Version]
  25. Zhang, X.; Vincent, L.A.; Hogg, W.D.; Niitsoo, A. Temperature and precipitation trends in Canada during the 20th century. Atmos.-Ocean 2000, 38, 395–429. [Google Scholar] [CrossRef]
  26. Young, K.L.; Brown, L.; Labine, C. Snow cover variability at Polar Bear Pass, Nunavut. Arct. Sci. 2018, 4, 669–690. [Google Scholar] [CrossRef] [Green Version]
  27. Bjorkman, A.D.; Elmendorf, S.C.; Beamish, A.L.; Vellend, M.; Henry, G.H.R. Contrasting effects of warming and increased snowfall on Arctic tundra plant phenology over the past two decades. Glob. Chang. Biol. 2015, 21, 4651–4661. [Google Scholar] [CrossRef] [PubMed]
  28. Screen, J.A.; Simmonds, I. Declining summer snowfall in the Arctic: Causes, impacts and feedbacks. Clim. Dyn. 2012, 38, 2243–2256. [Google Scholar] [CrossRef] [Green Version]
  29. Derksen, C.; Smith, S.L.; Sharp, M.; Brown, L.; Howell, S.; Copland, L.; Mueller, D.R.; Gauthier, Y.; Fletcher, C.G.; Tivy, A.; et al. Variability and change in the Canadian cryosphere. Clim. Chang. 2012, 115, 59–88. [Google Scholar] [CrossRef] [Green Version]
  30. Bulygina, O.N.; Razuvaev, V.N.; Korshunova, N.N. Changes in snow cover over Northern Eurasia in the last few decades. Environ. Res. Lett. 2009, 4, 1–6. [Google Scholar]
  31. Zhang, Y.; Ma, N. Spatiotemporal variability of snow cover and snow water equivalent in the last three decades over Eurasia. J. Hydrol. 2018, 559, 238–251. [Google Scholar] [CrossRef]
  32. Brown, R.D.; Robinson, D.A. Northern Hemisphere spring snow cover variability and change over 1922–2010 including an assessment of uncertainty. Cryosphere 2011, 5, 219–229. [Google Scholar] [CrossRef] [Green Version]
  33. Euskirchen, E.S.; Mcguire, A.D.; Chapin, F.S. Energy feedbacks of northern high-latitude ecosystems to the climate system due to reduced snow cover during 20th century warming. Glob. Chang. Biol. 2007, 13, 2425–2438. [Google Scholar] [CrossRef]
  34. Brown, R.; Derksen, C.; Wang, L. A multi—Data set analysis of variability and change in Arctic spring snow cover extent, 1967–2008. J. Geophys. Res. 2010, 115, 1–16. [Google Scholar] [CrossRef]
  35. AMAP. Snow, Water, Ice and Permafrost in the Arctic (SWIPA) 2017; Changing permafrost and its impacts; Arctic Monitoring and Assessment Programme (AMAP): Oslo, Norway, 2017; p. 856. [Google Scholar]
  36. Déry, S.J.; Brown, R.D. Recent Northern Hemisphere snow cover extent trends and implications for the snow-albedo feedback. Geophys. Res. Lett. 2007, 34, 1–6. [Google Scholar] [CrossRef]
  37. Woo, M.K.; Young, K.L. Disappearing semi-permanent snow in the High Arctic and its consequences. J. Glaciol. 2014, 60, 192–200. [Google Scholar] [CrossRef] [Green Version]
  38. Estilow, T.W.; Young, A.H.; Robinson, D.A. A long-term Northern Hemisphere snow cover extent data record for climate studies and monitoring. Earth Syst. Sci. Data 2015, 7, 137–142. [Google Scholar] [CrossRef] [Green Version]
  39. Mudryk, L.; Kushner, P.; Derksen, C. Interpreting observed northern hemisphere snow trends with large ensembles of climate simulations. Clim. Dyn. 2014, 43, 1–14. [Google Scholar] [CrossRef]
  40. Thackeray, C.W.; Fletcher, C.G.; Mudryk, L.R.; Derksen, C. Quantifying the uncertainty in historical and future simulations of Northern Hemisphere spring snow cover. J. Clim. 2016, 29, 8647–8663. [Google Scholar] [CrossRef]
  41. Pedersen, S.H.; Tamstorf, M.K.; Abermann, J.; Westergaard-Nielsen, A.; Lund, M.; Skov, K.; Sigsgaard, C.; Mylius, M.R.; Hansen, B.U.; Liston, G.E.; et al. Spatiotemporal characteristics of seasonal snow cover in Northeast Greenland from in situ observations. Arctic, Antarct. Alp. Res. 2016, 48, 653–671. [Google Scholar] [CrossRef] [Green Version]
  42. Park, H.; Yabuki, H.; Ohata, T. Analysis of satellite and model datasets for variability and trends in Arctic snow extent and depth, 1948–2006. Polar Sci. 2012, 6, 23–37. [Google Scholar] [CrossRef] [Green Version]
  43. Kitaev, L.; Kislov, A.; Krenke, A.; Razuvaev, V.; Martuganov, R.; Konstantinov, I. The snow cover characteristics of northern Eurasia and their relationship to climatic parameters. Boreal Environ. Res. 2002, 7, 437–445. [Google Scholar]
  44. Popova, V.V. Structure of multi-year variations of the snow cover depth in North Eurasia. Russ. Meteorol. Hydrol. 2004, 8, 78–88. [Google Scholar]
  45. Wegmann, M.; Orsolini, Y.; Vázquez, M.; Gimeno, L.; Nieto, R.; Bulygina, O. Arctic moisture source for Eurasian snow cover variations in autumn. Environ. Res. Lett. 2015, 10, 1–10. [Google Scholar] [CrossRef] [Green Version]
  46. Kunkel, K.E.; Robinson, D.A.; Champion, S.; Yin, X.; Estilow, T.; Frankson, R.M. Trends and Extremes in Northern Hemisphere Snow Characteristics. Curr. Clim. Chang. Rep. 2016, 2, 65–73. [Google Scholar] [CrossRef] [Green Version]
  47. Vincent, L.A.; Zhang, X.; Brown, R.D.; Feng, Y.; Mekis, E.; Milewska, E.J.; Wan, H.; Wang, X.L. Observed trends in Canada’s climate and influence of low-frequency variability modes. J. Clim. 2015, 28, 4545–4560. [Google Scholar] [CrossRef]
  48. Brown, R.D.; Braaten, R.O.; Brown, R.D. Spatial and temporal variability of Canadian monthly snow depths, 1946–1995. Atmos. Ocean. 1998, 36, 37–54. [Google Scholar] [CrossRef]
  49. Smith, S.L.; Burgess, M.M.; Taylor, A.E. High Arctic permafrost observatory at Alert, Nunavut—analysis of a 23 year data set, in Permafrost. In Proceedings of the 8th International Conference on Permafrost, Zürich, Switzerland, 21–25 July 2003; pp. 1073–1078. [Google Scholar]
  50. Stieglitz, M.; Déry, S.J.; Romanovsky, V.E.; Osterkamp, T.E. The role of snow cover in the warming of arctic permafrost. Geophys. Res. Lett. 2003, 30, 1–4. [Google Scholar] [CrossRef]
  51. Bormann, K.J.; Brown, R.D.; Derksen, C.; Painter, T.H. Estimating snow-cover trends from space. Nat. Clim. Chang. 2018, 8, 924–928. [Google Scholar] [CrossRef]
  52. Muskett, R.R. Multi-satellite and sensor derived trends and variation of snow water equivalent on the high-latitudes of the Northern Hemisphere. Int. J. Geosci. 2012, 3, 1–13. [Google Scholar] [CrossRef] [Green Version]
  53. Jeong, D.I.; Sushama, L.; Khaliq, M.N. Attribution of spring snow water equivalent (SWE) changes over the northern hemisphere to anthropogenic effects. Clim. Dyn. 2017, 48, 3645–3658. [Google Scholar] [CrossRef] [Green Version]
  54. Mudryk, L.; Chereque, A.E.; Derksen, C.; Luojus, K.; Decharme, B. Terrestrial Snow Cover, NOAA Technical Report OAR ARC. 2021, 1–8. Available online: https://repository.library.noaa.gov/view/noaa/34201 (accessed on 10 December 2021).
  55. Li, Z.; Liu, J.; Huang, L.; Wang, N.; Tian, B.; Zhou, J.; Zhang, P. Snow mass decrease in the Northern Hemisphere (1979/80–2010/11). Cryosphere Discuss. 2014, 8, 5623–5644. [Google Scholar]
  56. Collados-Lara, A.J.; Pardo-Igúzquiza, E.; Pulido-Velazquez, D. Assessing the impact of climate change–and its uncertainty–on snow cover areas by using cellular automata models and stochastic weather generators. Sci. Total Environ. 2021, 788, 147776. [Google Scholar] [CrossRef]
  57. Thackeray, C.W.; Derksen, C.; Fletcher, C.G.; Hall, A. Snow and Climate: Feedbacks, Drivers, and Indices of Change. Curr. Clim. Chang. Rep. 2019, 5, 322–333. [Google Scholar] [CrossRef]
  58. Pardo-Igúzquiza, E.; Collados-Lara, A.J.; Pulido-Velazquez, D. Estimation of the spatiotemporal dynamics of snow covered area by using cellular automata models. J. Hydrol. 2017, 550, 230–238. [Google Scholar] [CrossRef]
  59. Bokhorst, S.; Pedersen, S.H.; Brucker, L.; Anisimov, O.; Bjerke, J.W.; Brown, R.D.; Ehrich, D.; Essery, R.L.H.; Heilig, A.; Ingvander, S.; et al. Changing Arctic snow cover: A review of recent developments and assessment of future needs for observations, modelling, and impacts. AMBIO 2016, 45, 516–537. [Google Scholar] [CrossRef] [PubMed] [Green Version]
  60. Mudryk, L.; Canada, C.C.; Derksen, C.; Canada, C.C.; Kushner, P. Characterization of Northern Hemisphere Snow Water Equivalent Datasets. J. Clim. 2015, 28, 8037–8051. [Google Scholar] [CrossRef] [Green Version]
  61. Shi, H.X.; Wang, C.H. Projected 21st century changes in snow water equivalent over Northern Hemisphere landmasses from the CMIP5 model ensemble. Cryosphere 2015, 9, 1943–1953. [Google Scholar] [CrossRef] [Green Version]
  62. Derksen, C.; Burgess, D.; Duguay, C.; Howell, S.; Murdyk, L.; Smith, S.; Thackeray, C.; Kirchmeier-Young, M. Changes in Snow, Ice, and Permafrost Across Canada; Government of Canada: Ottawa, ON, Canada, 2019; pp. 194–260.
  63. Lawrence, D.M.; Slater, A.G. The contribution of snow condition trends to future ground climate. Clim. Dyn. 2010, 34, 969–981. [Google Scholar] [CrossRef] [Green Version]
  64. IPCC Working Group I. Contribution of Working Group I to the Fourth Assessment Report of the Intergovernmental Panel on Climate Change; Cambridge University Press: New York, NY, USA, 2007. [Google Scholar]
  65. Cassano, J.J.; Uotila, P.; Lynch, A.H.; Cassano, E.N. Predicted changes in synoptic forcing of net precipitation in large Arctic river basins during the 21st century. J. Geophys. Res. Biogeosci. 2007, 112, 1–20. [Google Scholar] [CrossRef] [Green Version]
  66. Deliang, C.; Maisa, R.; Bjørn, H.S.; Kim, C.; Aïda, D.-N.; Paul, E.; Seita, E.; Sergio Henrique, F.; Edward, H.; Pandora, H.; et al. Climate Change 2021. The Physical Science Basis. 2020. Available online: https://www.ipcc.ch/report/sixth-assessment-report-working-group-i/ (accessed on 10 December 2021).
  67. Raisanen, J. Warmer climate: Less or more snow? Clim. Dyn. 2008, 30, 307–319. [Google Scholar] [CrossRef]
  68. Krasting, J.P.; Broccoli, A.J.; Dixon, K.W.; Lanzante, J.R. Future changes in Northern Hemisphere snowfall. J. Clim. 2013, 26, 7813–7828. [Google Scholar] [CrossRef] [Green Version]
  69. Bintanja, R.; van der Wiel, K.; van der Linden, E.C.; Reusen, J.; Bogerd, L.; Krikken, F.; Selten, F.M. Strong future increases in Arctic precipitation variability linked to poleward moisture transport. Sci. Adv. 2020, 6, 1–7. [Google Scholar] [CrossRef] [PubMed] [Green Version]
  70. Bintanja, R. The impact of Arctic warming on increased rainfall. Nat. Sci. Rep. 2018, 8, 1–6. [Google Scholar] [CrossRef] [Green Version]
  71. Brown, R.D.; Mote, P.W. The response of Northern Hemisphere snow cover to a changing climate. J. Clim. 2009, 22, 2124–2145. [Google Scholar] [CrossRef]
  72. Henderson, G.R.; Peings, Y.; Furtado, J.C.; Kushner, P.J. Snow–atmosphere coupling in the Northern Hemisphere. Nat. Clim. Chang. 2018, 8, 1–11. [Google Scholar] [CrossRef]
  73. Mudryk, L.; Santolaria-Otín, M.; Krinner, G.; Ménégoz, M.; Derksen, C.; Brutel-Vuilmet, C.; Brady, M.; Essery, R. Historical Northern Hemisphere snow cover trends and projected changes in the CMIP6 multi-model ensemble. Cryosphere 2020, 14, 2495–2514. [Google Scholar] [CrossRef]
  74. Adakudlu, M.; Andersen, J.; Bakke, J.; Beldring, S.; Benestad, R.; Bilt, W.V.D.; Bogen, J.; Borstad, C.; Breili, K.; Breivik, Ø.; et al. Climate in Svalbard 2100—A Knowledge Base for Climate Adaptation; Hanssen-Bauer, I., Førland, E.J., Hisdal, H., Mayer, S., Sandø, A.B., Sorteberg, A., Eds.; Norwegian Centre for Climate Services (NCCS): Bergen, Norway, 2019; pp. 1–105. [Google Scholar]
  75. Overland, J.E.; Wang, M.; Walsh, J.E.; Christensen, J.H.; Kattsov, V.M.; Chapman, W.L. Chapter 3. Climate Model Projections for the Arctic. In Snow, Water, Ice and Permafrost in the Arctic (SWIPA); Arctic Monitoring and Assessment Programme (AMAP): Oslo, Norway, 2011. [Google Scholar]
  76. Callaghan, T.V.; Johansson, M.; Brown, R.D.; Groisman, P.Y.; Labba, N.; Radionov, V.; Bradley, R.S.; Blangy, S.; Bulygina, O.N.; Christensen, T.R.; et al. Multiple effects of changes in Arctic snow cover. AMBIO 2011, 40, 32–45. [Google Scholar] [CrossRef] [Green Version]
  77. Liu, J.; Curry, J.A.; Wang, H.; Song, M.; Horton, R.M. Impact of declining Arctic sea ice on winter snowfall. Proc. Natl. Acad. Sci. USA 2012, 109, 4074–4079. [Google Scholar] [CrossRef] [Green Version]
  78. Ye, H. Increases in snow season length due to earlier first snow and later last snow dates over North Central and Northwest Asia during 1937–94. Geophys. Res. Lett. 2011, 28, 551–554. [Google Scholar] [CrossRef]
  79. AMAP. Assessment Report: Arctic Pollution Issues; Arctic Monitoring and Assessment Programme (AMAP): Oslo, Norway, 1998; p. 856. [Google Scholar]
  80. Derksen, C.; Brown, R. Spring snow cover extent reductions in the 2008–2012 period exceeding climate model projections. Geophys. Res. Lett. 2012, 39, 1–6. [Google Scholar] [CrossRef] [Green Version]
  81. Kong, Y.; Wang, C.H. Responses and changes in the permafrost and snow water equivalent in the Northern Hemisphere under a scenario of 1.5 °C warming. Adv. Clim. Chang. Res. 2017, 8, 235–244. [Google Scholar] [CrossRef]
  82. IPCC. Climate Change 2013: The Physical Science Basis. Contribution of Working Group I to the Fifth Assessment Report of the Intergovernmental Panel on Climate Change; Stocker, T.F., Qin, D., Plattner, G.-K., Tignor, M., Allen, S.K., Boschung, J., Nauels, A., Xia, Y., Bex, V., Midgley, P.M., Eds.; Cambridge University Press: New York, NY, USA, 2013; p. 1535. [Google Scholar]
  83. IPCC. Climate Change 2014: Synthesis Report. Contribution of Working Groups I, II and III to the Fifth Assessment Report of the Intergovernmental Panel on Climate Change; IPCC: Geneva, Switzerland, 2014; Volume 218, p. 151. [Google Scholar]
Figure 1. Map of the Northern Hemisphere displaying the High Arctic zones delineated according to the Circumpolar Arctic Vegetation Map [21,22]. Th black line indicates the whole Arctic extent while colored polygons indicate High Arctic sectors.
Water 14 00587 g001
Figure 2. Annual and seasonal trends in SCD (days per decade) over the 1972/1973–2008/2009 snow seasons from the NOAA weekly snow cover maps. The territory of HA is indicated by a polygon (map reproduced with permission from AMAP [35]).
Water 14 00587 g002
Figure 3. Linear trends in SCE (percent per decade) by season over the 1972–2021 period calculated from weekly NOAA snow charts [38]. Trends were computed by linear regression and trend significance (black dots) assessed with a two-tail t-test (p < 0.05).
Water 14 00587 g003
Figure 4. Seasonal trends (red = summer (JAS), blue = spring (AMJ)) in SCE (km/decade) over the 1970–2021 period derived from the NOAA weekly snow cover maps. Relative trends (%/decade) are indicated in parenthesis. (a) NH; (b) Arctic, (c) HA [38].
Water 14 00587 g004
Figure 5. Projected trends in snowfall (2006–2100; cm decade−1): (A) Annual, (B) September–November (SON), (C) December–February (DJF), and (D) March–May (MAM) [68]. The map reproduced from [58] with permission from Journal of Climate.
Water 14 00587 g005
Figure 6. Projected changes in mean annual SCD under RCP4.5 and RCP8.5 scenarios, with respect to 1986–2005 for three 20-year time slices centred on 2025, 2055 and 2090. The map reproduced from [10] with permission from AMAP.
Water 14 00587 g006
Table 1. Snow metrics used to analyse historical and projected changes in snow cover.
Snow MetricsUnits
Precipitation (P)mm
Snow cover duration (SCD)days
Snow cover extent (SCE)%
Snow depth (SD)cm
Snow water equivalent (SWE)mm water equivalent
Table 2. Historical trends for cold season (October–May) total precipitation over the 1936–2009 period (mm per decade). Positive trends are delineated by the blue colour scale and negative trends by the red colour scale (upward arrow: strongly positive; oblique upward arrow: slightly positive; downward arrow: strongly negative; oblique downward arrow: slightly negative; horizontal arrow: no trend).
Spatial ScalePeriodReferences
193019401950196019701980199020002010
Atlantic Water 14 00587 i002         9.1 Water 14 00587 i001   10.1Callaghan et al. (2011) [22]
Svalbard Water 14 00587 i0020.05Van Pelt et al. (2015) [17]
Water 14 00587 i0020.05Førland et al. (2011) [23]
North European Water 14 00587 i002         6.2 Water 14 00587 i002   9.9Callaghan et al. (2011) [22]
West Siberian Water 14 00587 i004−0.2 Water 14 00587 i001   17.1Callaghan et al. (2011) [22]
Mys Kamennyj Water 14 00587 i003−13 Frey and Smith (2003) [24]
East Siberian Water 14 00587 i004        −3.5 Water 14 00587 i002   1Callaghan et al. (2011) [22]
Chukchi Water 14 00587 i003        −8.4−3.3Callaghan et al. (2011) [22]
Alaskan Water 14 00587 i004        −0.4 Water 14 00587 i001   10.1Callaghan et al. (2011) [22]
Canadian Water 14 00587 i002         8.5 Water 14 00587 i002   2.9Callaghan et al. (2011) [22]
Water 14 00587 i002     5.2Zhang et al. (2000) [25]
Resolute Water 14 00587 i002     2.6Young et al. (2018) [26]
Eureka Water 14 00587 i001   10.9Bjorkman et al. (2015) [27]
Whole latitudinal Water 14 00587 i002         1.8 Water 14 00587 i002   5.8Callaghan et al. (2011) [22]
Table 5. Projected relative changes (% per decade) in mean annual SCE in the High Arctic under the RCP8.5 emission scenario compared to the references period (Lawrence et al. [63] 1950–1969, Thackeray et al. [40]: 2011–2040). Positive trends are delineated by the blue colour scale and negative trends by the red colour scale (upward arrow: strongly positive; oblique upward arrow: slightly positive; downward arrow: strongly negative; oblique downward arrow: slightly negative; horizontal arrow: no trend).
Spatial ScalePeriodReferences
20302040205020602070208020902100
Atlantic Water 14 00587 i004  −20Lawrence et al. (2010) [63]
Water 14 00587 i004    −20Henderson et al. (2010) [72]
North European Water 14 00587 i003  −25Lawrence et al. (2010) [63]
Water 14 00587 i003    −30Henderson et al. (2010) [72]
Water 14 00587 i004 −10 Thackeray et al. (2016) [40]
West Siberian Water 14 00587 i004  −15Lawrence et al. (2010) [63]
Water 14 00587 i003    −25Henderson et al. (2010) [72]
Water 14 00587 i004 −7.5 Thackeray et al. (2016) [40]
East Siberian Water 14 00587 i004  −10Lawrence et al. (2010) [63]
Water 14 00587 i004    −20Henderson et al. (2010) [72]
Water 14 00587 i004 −3 Thackeray et al. (2016) [40]
Chukchi Water 14 00587 i004  −10Lawrence et al. (2010) [63]
Water 14 00587 i003    −25Henderson et al. (2010) [72]
Water 14 00587 i004 −3 Thackeray et al. (2016) [40]
Alaskan Water 14 00587 i004  −20Lawrence et al. (2010) [63]
Water 14 00587 i004    −20Henderson et al. (2010) [72]
Water 14 00587 i004 −10 Thackeray et al. (2016) [40]
Canadian Water 14 00587 i004   −20Lawrence et al. (2010) [63]
Water 14 00587 i004    −20Henderson et al. (2010) [72]
Water 14 00587 i004   −10 Mudryk et al. (2018) [8]
Table 6. Projected relative changes in mean annual SD (cm over the whole period) under the RCP8.5 emission scenario. Positive trends are delineated by the blue colour scale and negative trends by the red colour scale (upward arrow: strongly positive; oblique upward arrow: slightly positive; downward arrow: strongly negative; oblique downward arrow: slightly negative; horizontal arrow: no trend) [63].
Spatial ScalePeriod
208020902100
Atlantic Water 14 00587 i00210
North European Water 14 00587 i003−30
West Siberian Water 14 00587 i00130
East Siberian Water 14 00587 i00210
Chukchi Water 14 00587 i00210
Alaskan Water 14 00587 i003−30
Canadian Water 14 00587 i004−10
Table 7. Projected relative changes in mean annual SWE under the RCP8.5 emission scenario (%) compared to 1966–1990 period. Positive trends are delineated by the blue colour scale and negative trends by the red colour scale (upward arrow: strongly positive; oblique upward arrow: slightly positive; downward arrow: strongly negative; oblique downward arrow: slightly negative; horizontal arrow: no trend). References—add proper callouts to all ie [34] that link to the References: these are meaningless at present.
Spatial ScalePeriodReferences
20302040205020602070208020902100
Atlantic Water 14 00587 i004−15 Water 14 00587 i004     −20Raisanen (2008) [67]
Water 14 00587 i004−15 Callaghan et al. (2011) [22]
North European Water 14 00587 i004−15 Water 14 00587 i003     −30Raisanen (2008) [67]
Water 14 00587 i004  −20 Water 14 00587 i003−30 Water 14 00587 i003−40 Shi et al. (2015) [61]
West Siberian Water 14 00587 i00115 Water 14 00587 i001     15Raisanen (2008) [67]
Water 14 00587 i002  10 Water 14 00587 i004−20 Shi et al. (2015) [61]
Water 14 00587 i001  15 Callaghan et al. (2011) [22]
East Siberian15 Water 14 00587 i001  30 Raisanen (2008) [67]
Water 14 00587 i002  10 Water 14 00587 i00120 Water 14 00587 i00120 Shi et al. (2015) [61]
Water 14 00587 i001  25 Callaghan et al. (2011) [22]
Chukchi Water 14 00587 i00115 Water 14 00587 i001     30Raisanen (2008) [67]
Water 14 00587 i002  10 Water 14 00587 i00120 Water 14 00587 i00130 Shi et al. (2015) [61]
Water 14 00587 i001  15 Callaghan et al. (2011) [22]
Alaskan Water 14 00587 i00115 Water 14 00587 i001     15Raisanen (2008) [67]
Water 14 00587 i002  10 Water 14 00587 i003−20 Water 14 00587 i003−30 Shi et al. (2015) [61]
Canadian 15 Water 14 00587 i001     20Raisanen (2008) [67]
Water 14 00587 i002  10 Water 14 00587 i0025 Water 14 00587 i0025 Shi et al. (2015) [61]
Water 14 00587 i0027.5 Mudryk et al. (2018) [8]
Water 14 00587 i001  15 Callaghan et al. (2011) [22]
Publisher’s Note: MDPI stays neutral with regard to jurisdictional claims in published maps and institutional affiliations.

