Article

Comparing Different Phosphorus Extraction Methods: Effects of Influencing Parameters

1
Faculty of Agricultural and Food Sciences, Széchenyi István University, 9200 Mosonmagyaróvár, Hungary
2
Institute for Wildlife Management and Nature Conservation, Hungarian University of Agriculture and Life Sciences, 2100 Gödöllő, Hungary
3
Csernozjom Kft, 1122 Budapest, Hungary
4
Research Centre for Astronomy and Earth Sciences, Geographical Institute, Budaörsi út 45, 1112 Budapest, Hungary
5
Institute for Environmental Sciences, Hungarian University of Agriculture and Life Sciences, 2100 Gödöllő, Hungary
*
Author to whom correspondence should be addressed.
Sustainability 2022, 14(4), 2158; https://doi.org/10.3390/su14042158
Submission received: 22 November 2021 / Revised: 8 February 2022 / Accepted: 9 February 2022 / Published: 14 February 2022
(This article belongs to the Section Sustainable Agriculture)

Abstract

:
The current study compares the phosphorus (P) analysis methods of ammonium lactate (AL), Mehlich 3 (M3); water extraction (P-WA(P)&P-WA(PO4)), cobalt hexamine (CoHex) and X-ray fluorescence (XRF) as an estimate of total soil P. The ratio of the P-content/XRF was first calculated and compared with the whole dataset. Based on the comparison of all the data, there were significant differences between the results of P-WA(P) and P-WA(PO4) vs. M3 and AL, CoHex vs. M3 and CoHex vs. AL methods (p < 0.001). The second step was the analysis of the influencing factors based on their categories for a more in-depth understanding of their role (CaCO3-content, pH, soil texture and clay content). The results showed that higher CaCO3 content (>1%) resulted in lower correlations (6/10 cases). The extraction methods, the soil, the classification method of the soil properties and the statistical analyses affect the evaluation. The dataset covers a good range of the analysed factors for the evaluation of phosphorus in the majority of Hungarian soil types in arable use. There were two methods that detected the largest amount of P from the total P in the soil: AL and M3.

1. Introduction

At the current utilization rate, it is estimated that the global phosphorous (P) reserve at the current utilization rate will last from 600 to 1000 years [1]. Hence, there is an urgent need to adopt sustainable and effective use of P fertilizers worldwide. In the European Union, the Soil Protection Act makes it mandatory for farmers to monitor and maintain adequate levels of soil fertility by regular testing. However, there is still no common regulation for analytical methods of soil analysis [2,3].
Soils can only be managed sustainably at a global level if sufficient, reliable and comparable information is available. The harmonization of soil analysis methods is important in order to be able to comply with legislation and boundary conditions and assess agricultural sustainability. According to the results of the FAO GLOSOLAN project data, harmonised information is critical in order to compare information and model the P variation between different world areas, on either a regional or global scale [4,5], and to support an appropriate management decision (FAO, Global Soil Partnership).
Among nutrients, P in soil is one of the most difficult to analyse due to its different forms, e.g., P dissolved in the soil solution; P absorbed into clay minerals, Fe and Al (hydr-)oxides, P in primary minerals [6]; organic P and microbial P pools [7]. Speciation of P pools has led to the development of various P extraction methods [8,9], which are currently used to prevent P loss from agricultural soils and eutrophication of water bodies [10]. Thus, the detailed P circulation in the soil-plant-water system is of primary importance, both economically and environmentally. Consequently, major P flows are modelled on a national scale [11] or with respect to the agroecosystems [12]. However, all predictions and control must be based on accurate measurements.
The extractants for P analysis are supposed to model different environmental conditions. Water extraction methods (WA) determine P in soil solution [11,12,13], Mehlich 3 (M3) [14,15,16] and ammonium lactate (AL) extractants are used to measure the soluble and exchangeable P forms in some countries such as Belgium, Germany, Hungary, Lithuania, Norway, Poland and Slovenia [17,18]. The readily and slowly exchangeable nutrient forms in the soil can be measured with the cobalt hexamine trichloride (CoHex) method [19,20]. At the same time, X-ray fluorescence (XRF) can be used to quantify the total soil P content [21].
The Mehlich 1 (double acid, M1) [22] procedure is designed for the evaluation of P in acid sandy soils, and this method has been widely used in North and South America [6,23,24], whereas the Mehlich 2 [25] method was a standard method for assessing the fertilizer and liming requirements of crops in the Czech Republic and Slovakia up to 1994 [23], before being replaced by the Mehlich 3 (M3) method [26,27]. Although the M3 was initially introduced for acid soils, its use has been extended to include alkaline soils [28,29,30,31] also in Estonia, some provinces of Canada and states in the USA [8,32] to represent the tightly sorbed and partly organic P pools. In a comparative study, Sarker [33] reported significant differences in P pools extracted with the Olsen, Mehlich 3, Kelowna and Bray & Kurtz [34] methods, with the Mehlich 3 showing the highest values.
The lactic acid (AL) method [35] is applied in several Western European countries, with some countries substituting Ca-lactate for AL [36], buffered at pH 3.75, to extract P bound to Al and Fe (hydr-)oxides, and therefore generally extracting more P than other methods. This method is supposed to represent a plant-available P pool in the soil.
X-ray fluorescence (XRF) spectrometry is attracting much attention as an upcoming proximal soil sensing (PSS) technique. XRF is a quick method for determining the total elemental compositions of soil samples [21].
Several studies investigated and compared the efficiency of P extraction methods and their relationship with soil properties [11,12], but their contribution to the optimization of the fertilization strategies of agricultural soils is still not clear, especially in relation to main soil factors, such as pH and electrical conductivity (EC) values, clay and organic matter contents, and the amount of carbonates [11,12].
The cobalt hexamine trichloride (CoHex) method described by Ciesielski and Sterckeman [19] is currently a standard method to determine soil cation exchange capacity (CEC) [31].
The present study aims to compare the extraction efficiency of the most widely used P extraction methods and to quantify and highlight the role of core soil properties on the P extraction efficiency. The working hypothesis is that increasing trends of clay and carbonate contents and pH values influence the P extractability in nonlinear ways on the examined Hungarian soils. This hypothesis was tested by analysing soils from a nationwide sampling campaign in Hungary, in which soils with different properties and under various management were sampled. The samples were analysed and categorized according to the main influencing factors.

2. Materials and Methods

2.1. Collection of the Soil Samples

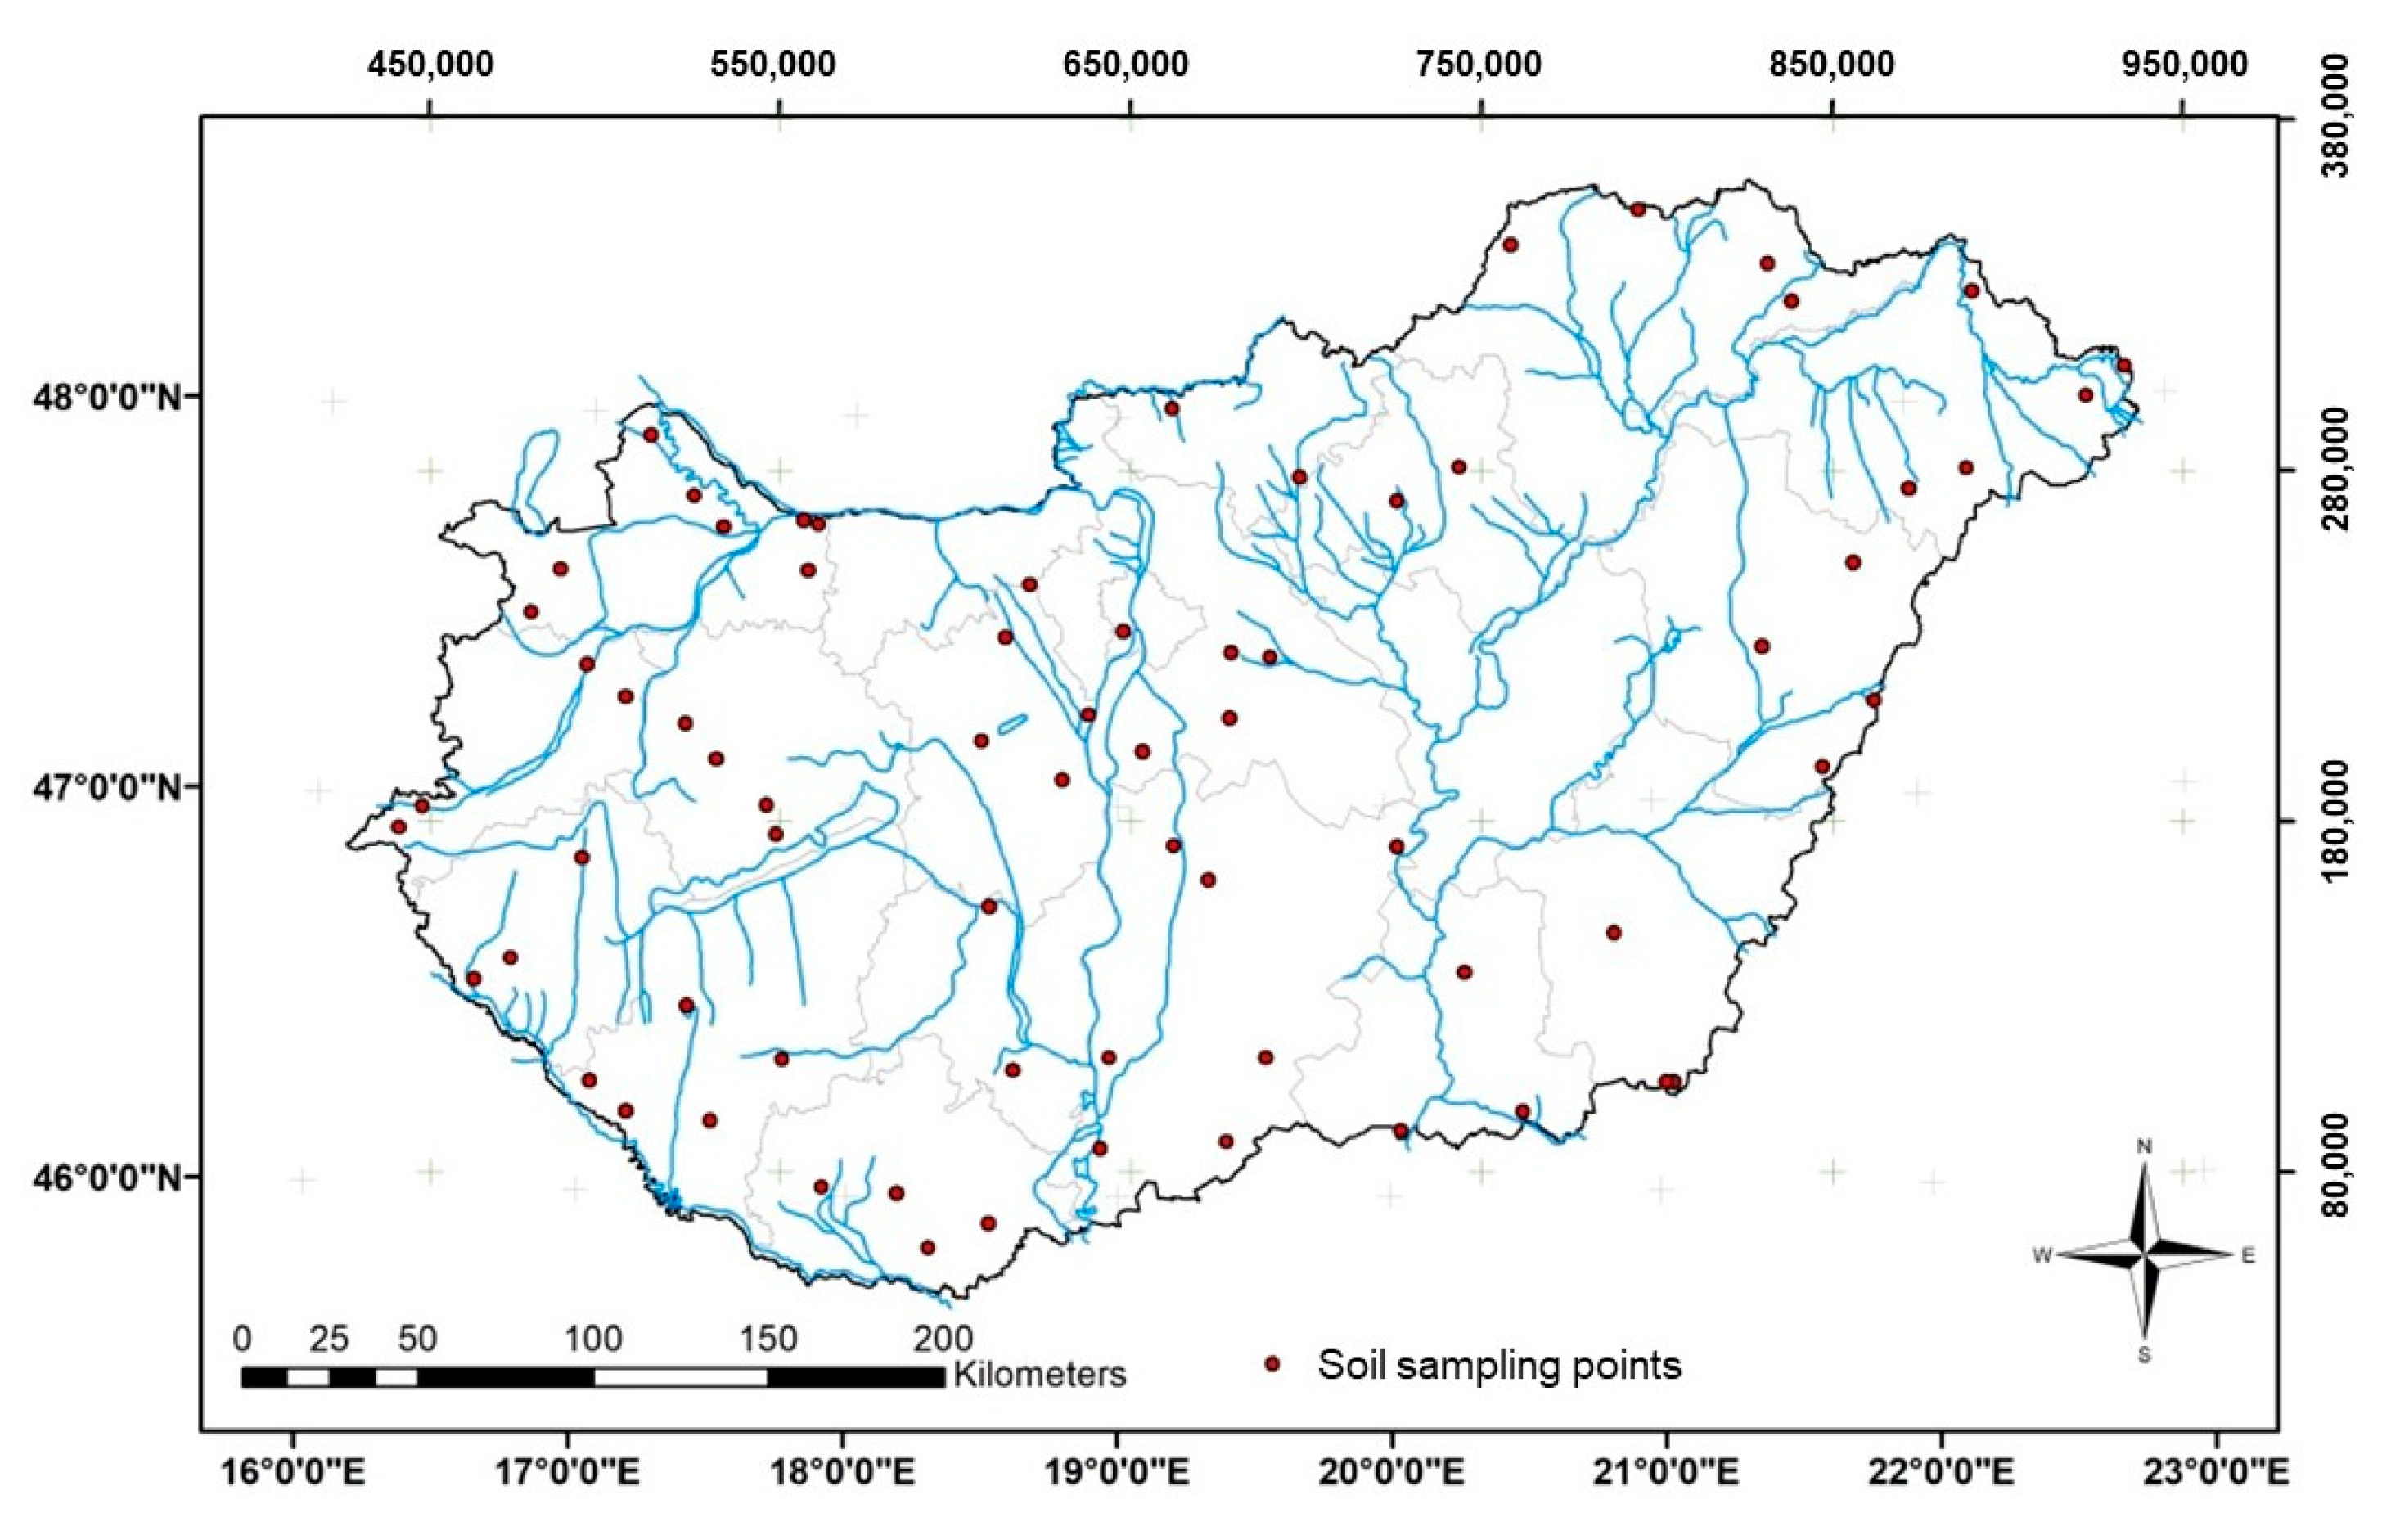
In the summer of 2017, seventy geo-referenced soil samples were collected from the 0–20 cm at sites throughout Hungary (Figure 1). The sites included 59 intensive arable fields, five forests, five grasslands and one horticultural area. The chosen soils were mainly Chernozems, Phaeozems, Cambisols, and Luvisols.
The locations of the seventy samples were selected according to Minasny–McBratney [37] and Roudier–Hedley [38]. Factors considered in this selection were land use, soil type, climate data, accessibility, and market value.
Soil experts took the samples based on the following requirements:
-
Take a clean sample bag and attach a barcode label to it.
-
Collect the sample from a bare spot if possible.
-
Remove plants or plant debris before you take the sample.
-
Put the sample in an empty and clean white bucket and break the particles to find stones and roots.
-
Remove the stones (>2 mm), big roots and organic material particles (>2 mm) from the sample. Take a picture of the soil.
-
Transfer the sample into the sample bag.
-
The required sample weight should be:
If dry—minimum of 600 g
If humid—minimum of 750 g
If wet—minimum of 850 g
-
Weigh all removed stones separately.
-
Attach a barcode label to the bag.
-
Close the sample bag by folding it and twisting the yellow ends of the sample bag.
-
Place the bag directly in the cooled box. Wet soil needs to be kept at <10 °C.

2.2. Laboratory Analysis

The selection of analytical methods was made on the basis of the International Soil-analytical Exchange Programme (ISE) of the Wageningen Evaluating Programmes for Analytical Laboratories (WEPAL), and was: Mehlich 3 (M3, [39]), water extraction (P and PO4, separately), X-ray fluorescence (XRF) [40]. The ammonium lactate (AL) method was used in the accredited Hungarian laboratory [41].
The samples had to reach the central location, cooled, and be dried a maximum of two days after they had been collected. The drying cabinet was set at 40 °C until the sample was dry. A sample was dry when humidity was neither visible (uniform color), nor tangible (the color inside the bigger soil parts is uniform after crushing). Once the samples were dry, drying was stopped—a process that had to be checked regularly (e.g., half-hourly).
Once the samples were dried, they were sieved through a 2 = mm sieve. All remaining stones and visible plant debris, and roots remaining in the sieve were thrown away. The weight of the dried and sieved sample must be of minimum 500 g.
The samples were placed in a strong plastic bag, the air pushed out of the plastic bag, folded at least seven times and folded over the end to make sure no soil can escape. They were stored in a cool area until sent to the Netherlands and to the Hungarian laboratories.
Water extractions were conducted using 12 g of air-dried soil in deionized water (1:5 w:v), shaken for 30 min, and the extract analysed by ICP-MS after filtration. In the water extraction, both P and PO4 were separately measured.
During the data analysis, the P-WA(PO4) measurements were converted to P, and the same extracts were used for measuring the chosen parameters, mainly to determine pH and EC values. Total P contents were determined by XRF following the ISO standard method [40]. The AL method (0.1 M ammonium lactate, 0.4 M acetic acid) was executed according to the Hungarian national standard [41].
Cobalt hexamine trichloride (CoHex) was used for the analysis of the cation exchange capacity (CEC [35]) by measuring the difference between the initial and the final concentration of Co quantified by ICP-MS. The total element content of soils was determined with an energy dispersive X-ray fluorescence spectrometer (ED-XRF) after milling and pelleting a subsample of 30 g to 1 mm particle size [42].
The CaCO3-content was determined using the gas volumetric method of Scheibler [43], soil texture was analysed by measuring the particle size distribution using laser diffractometry (Fritsch Analysette 22 Microtech Plus) after organic matter oxidation, carbonate dissolution and clay dispersion using H2O2, 10% HCl ad 0.5 M Na-pyrophosphate treatments, followed by sonication treatments. The particles size distribution was calculated applying a 1.54 refractive index value.

2.3. Influencing Factors

To evaluate the role of soil properties affecting the phosphorus extraction efficiency, samples were classified according to pH (KCl), CaCO3 content and clay content. Five pH (KCl) groups were created (Table 1), with minor modifications of the original categories. A minimum of 11 samples per group were available for statistical analysis.
In the Hungarian advisory system, CaCO3 content and soil types (place of production category) are the influencing factors considered for the assessment of phosphate availability in the soil. The evaluation of plant-available P is based on the lime content of the soil (below or above 1%, MÉM-NAK [44]). There are 44 samples with <1% CaCO3 and 26 samples with >1% CaCO3 content.
To investigate the dependence of phosphorus on lime content in a more detailed manner, five groups were created, considering the need to have at least five samples per group for statistical purposes (Table 1). Sample numbers for the most optimal statistical analysis were the basis for creating the groups; the minimum sample number was seven. Furthermore, the lime-free category (<0.1%) was used, so samples in the lime-free and very low content categories could be analysed separately.
On the texture identification triangle, the clay content groups are classified as 0–10, 10–20, 20–30%, etc. For a detailed analysis of the dependence of phosphorous on clay content, six groups were created (Table 1).

2.4. Statistical Analysis

Soil properties and analysis methods were described using descriptive statistics: arithmetic means, median, coefficient of variation (CV), standard deviation (RSD), maximum (Max), and minimum (Min) values.
Relationships between the P determination methods were evaluated with regression analysis.
Pearson correlation analysis was used to determine the relationship between the extraction methods and the soil parameters (pH, CaCO3, clay).
The normality of the data series of the different analysis methods was tested with the Kolmogorov–Smirnov test. A non-parametric Friedmann ANOVA test was used for data that were not normally distributed. A parametric, repeated measures ANOVA test was used for normally distributed data.
The Wilcoxon signed-rank test, a non-parametric statistical hypothesis test, was used to compare the analysis methods (WA, M3, CoHex, AL, XRF) to assess whether their mean ranks differed.
The pairwise analysis test was used to investigate the content dependence of the used soil parameter measurement methods between pH (KCl), CaCO3-content and clay content depending on the used soil parameter measurement method used. This type of location test is used to compare measurements of the analysis methods to assess whether their means differ. The ratio of extractable P-content/XRF was compared and classified according to specified pH, CaCO3 content and clay content groups.
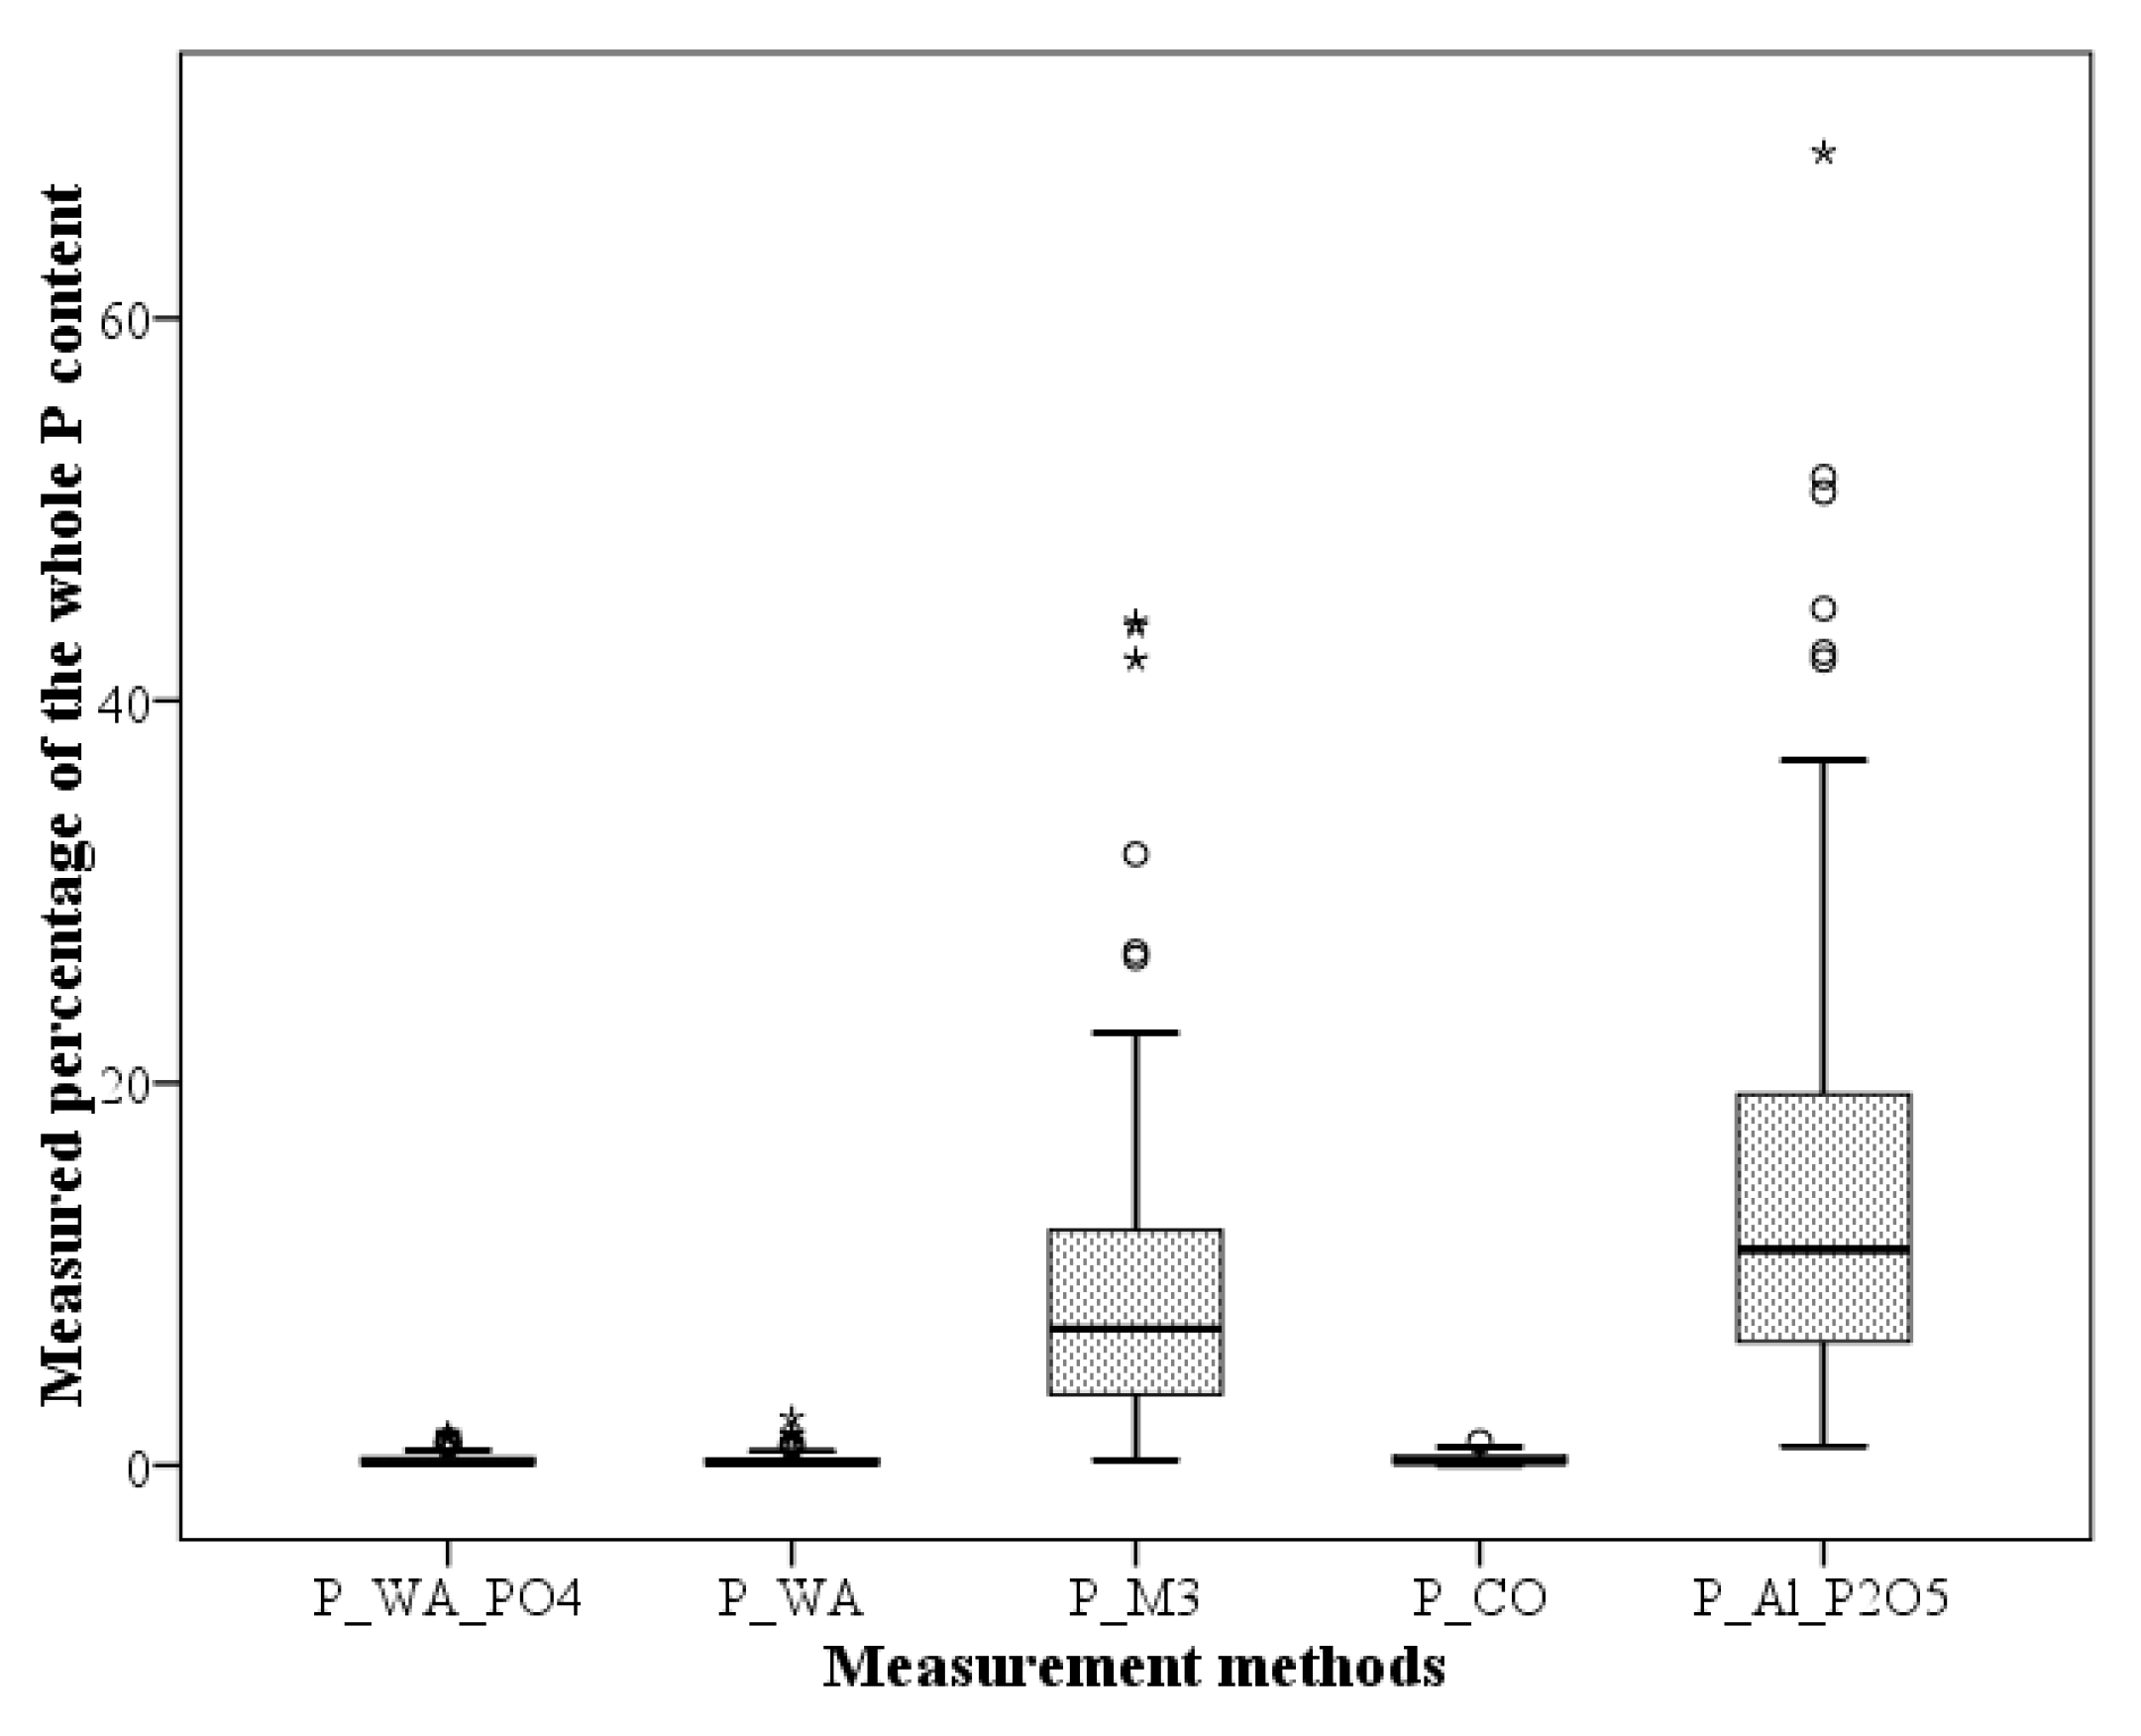
The non-parametric box plots method was used to display the variation in the P determination methods in the specific groups of pH (KCl), CaCO3-content and clay content.

3. Results

3.1. General Description of the Dataset

The descriptive statistics of the seventy soil samples dataset are presented in Table 2.
The pH (KCl) of the sample set covered a wide range of the pH scale from strongly acid to slightly alkalic soils. The CaCO3 was also diverse in the sample set from 0.1 to 18.7%. The median CaCO3 content was 0.4, so many samples were in the lime-free or low-lime category. There was a minimum of seven data in each CaCO3 category, so the effect of higher CaCO3 contents could be evaluated. The CaCO3 content showed the highest variability (CV = 1.6). The average clay content of the sample set was 14.3% which resulted in the use of seven texture classes during the evaluation. The full related database was uploaded to a repository (see Appendix A).

3.2. Comparison of Phosphorus Determination Methods

3.2.1. Descriptive Statistics of the Phosphorus Analysis Results

The descriptive statistics of the phosphorus content of the soil sample dataset used for comparison are presented in Table 3.
The highest P content was measured by XRF analysis which determines the total amount of P in the soil. The other methods measured much lower amounts because their extractants dissolve less P and they are mostly applied to represent the plant-available phosphorus content in the soil. Comparing the four other methods, P-WA(P) showed the lowest, whereas M3 had the highest measured P content in the soil. The mean and median of the P content measured by the four methods resulted in the following order: P-WA(P) < P-WA(PO4) < CoHex < M3 < AL < XRF.

3.2.2. Comparison of All the Values Measured by Six Different Methods

First, the non-parametric Kruskal–Wallis test was used to describe the situation of comparing the applied methods (Figure 2).
The boxplot shows two groups, one consisting of P_WA_PO4, P_Wa, and P_CO; and the other P_M3 and P_Al_P2O5. Due to the fact that almost all boxplots yielded the same results, no further boxplots are presented in the text; they are all available in Appendix B.
Secondly, a correlation regression was used to determine the relationships of the soil P content measured by the P-WA(P), P-WA(PO4), M3, CoHex, AL, and XRF methods. The correlations (R2) between the different phosphorus analysis methods are presented in Table 4; the figures are presented in Annex 1.
The strongest relationship was detected between the P content measured by the P-WA(PO4) vs. P-WA(P) (R2 = 0.89). The second strongest relationship was between the P-WA(PO4) vs. M3 methods (R2 = 0.72). The third strongest relationship showed between the P-WA(P) vs. M3 (R2 = 0.67)
A weak correlation was found between the P content determined by M3 and XRF methods, while there was no correlation between P-WA(PO4), P-WA(P) vs. CoHex (R2 = 0.39), M3 vs. AL (R2 = 0.33), M3 vs. XRF (R2 = 0.20) and CoHex vs. XRF methods. There was no relation between P-WA(PO4), P-WA(P) vs. AL and XRF methods.

3.2.3. Comparison of the Measurements of Five Methods Versus XRF

Table 5 shows the different RSD and the mean, median, minimum and maximum ratios that each method could measure from the total amount of P (XRF).
Mean percentage values resulting from all the P determination methods showed the following order of measured magnitude: P-WA(P) < CoHex < P-WA(PO4) < M3 < AL.
The pairwise analysis reveals strong significant differences between the results of P-WA(P) and P-WA(PO4) vs. M3 and AL results, between the CoHex vs. M3 and CoHex vs. AL methods (p < 0.001).

3.3. The Effect of Soil Parameters on the P Analysis Methods

3.3.1. Pearson Correlation Analysis

Pearson correlation analysis was applied to investigate the effect of pH (KCl), CaCO3-content and clay content.
The comparison of the P analysis methods results shows a very strong correlation between P-WA(P) and P-WA(PO4) (r = 0.94), M3 and P-WA(PO4) (r = 0.85), M3 and P-WA(P) (r = 0.82). A strong correlation was found between CoHex vs. P-WA(PO4) and P-WA(P) (r = 0.62), CoHex vs. M3 (r = 0.66), AL vs. CoHex (r = 0.67) and AL vs. XRF (r = 0.70) methods.

3.3.2. Evaluation of the Measured P Contents Considering CaCO3 Content

In the Hungarian advisory system, CaCO3 content is considered a major influencing factor for the availability of phosphate in the soil.
Table 6 shows the different ratios (%) that each method could measure from the total amount of P (indicated by the XRF method results) in the case of the two CaCO3 groups: below and above 1% (these two groups are used in the Hungarian advisory system, based on decades of plot experiments).
The mean, median, minimum and maximum percentage values stemming from the P determination methods resulted in similarities and differences in the two CaCO3 groups. The order of the measured magnitudes based on the mean in case of <1% CaCO3: CoHex < P-WA(P) < P-WA(PO4) < M3 < AL
The order of the measured magnitudes based on the median in case of <1% CaCO3: P-WA(P) < CoHex ≤ P-WA(PO4) < M3 < AL
The order of the measured magnitudes based on the mean and median in case of >1% CaCO3: P-WA(P) < P-WA(PO4) < CoHex < M3 < AL
With a higher than 1% CaCO3 content, the measured phosphorus from the total was lower in the case of P-WA(P), P-WA(PO4) methods.
In the case of M3, the results of the median were similar at both CaCO3 levels, but the results of the mean showed higher phosphorus in the case of <1% CaCO3.
A higher than 1% lime content resulted in higher phosphorus levels in the case of CoHex and AL methods. With a >1% CaCO3 content, the result of the mean phosphorus was 7.5% higher compared to the soils with <1% CaCO3.
With <1% CaCO3, the mean of the measured phosphorus with AL method was 12.79% from the total amount, while with >1% CaCO3 the mean of the measured phosphorus was 20.41%. With a higher lime content, the measured phosphorus was 37% higher compared to the lower lime content.
The higher the calcium, the higher the number of fixed phosphates, meaning that the AL method extracts more phosphates.
Regression analysis was used to determine the relationships of the soil P content measured by the P-WA(P), P-WA(PO4) M3, CoHex and AL methods, according to the lime content (Table 7).
There was one pair of methods where the correlation was not affected by the CaCO3-content): CoHex vs. M3. P-WA(PO4) vs. M3 was also almost equal.
The AL method resulted in a lower correlation with other methods of higher CaCO3-content. While it had 0.39, 0.41 and even 0.69 R2 values, the strength of correlation decreased with the increase of CaCO3 content: 0, 0.01, 0.1 and 0.2 R2 values.
The opposite happened with the P-WA(PO4) vs. P-WA(P) analyses; the higher CaCO3-content increased their correlation. The correlation of P-WA(PO4) vs. CoHex and the P-WA(P) vs. M3 also increased, while there was a slight decrease in the case of P-WA(P) vs. CoHex, besides all AL-related cases.

3.3.3. Pairwise Analysis of the Measured Values in the pH (KCl) Groups

The pairwise analysis of the measured phosphorous ratios compared with the measured total phosphorous amounts based on the pH (KCl) groups showed variations between the methods.
Based on the data evaluation of the analysis methods, a non-normal distribution was found in Group 1, 2, 4, and 5, so a non-parametric Friedmann ANOVA test was used. In Group 3 the data of the analysis methods showed normal distribution; as a result, a parametric Repeated Measures ANOVA test was used.
Group 1–3: In the first two pH (KCl) groups (pH 3.39–4.35, 4.36–5.47 and 5.48–6.78), the results of P-WA(P) vs. CoHex and M3 vs. AL methods were not significantly different in these acid groups. The two P-WA(P) phosphorus measurements and AL, M3 methods were significantly different. CoHex measured a significantly different amount of P compared to M3 and AL (Table 8).
Group 4: In the fourth group (pH 6.79–7.2), P-WA(P) vs. CoHex and M3 vs. AL methods were not significantly different, such as in groups 1, 2, 3. The P-WA(P) and Cohex methods results did not show a significant difference, but the CoHex method was not significantly different from M3, only from AL (Table 8).
Group 5: Based on the comparison between the groups, in the fifth pH (KCl) group (pH 7.21–8.14), M3 did not diverge from the AL method. CoHex and M3 were not significantly distinguishable, while CoHex was significantly different from AL methods. The results of the two P-WA(P) methods were similar, but in this group, P-WA(P) was considerably distinct from CoHex, while P-WA(PO4) was not significantly different from CoHex (Table 8).
P-WA(P), P-WA(PO4) vs. AL, M3 methods were significantly different in all pH (KCl) groups.
In group 5, from the two P-WA(P) methods, just the results of P-WA(PO4) were significantly different from CoHex.
CoHex and M3 methods were significantly different in all pH (KCl) groups. CoHex and AL methods were significantly different in the first three acid groups, but the two methods were not different in terms of pH (KCl) 6.79.
There was no significant difference between the results of AL vs. M3 and P-WA(P) vs. CoHex methods. The AL method differed significantly from Cohex, P-WA(P) methods in each pH (KCl) category.

3.3.4. Comparison of the Measured Values Based on the CaCO3-Content Groups

Group 1–2: In the first two CaCO3 groups (0–0.84%) P-WA(P), P-WA(PO4) vs. CoHex and M3 vs. AL methods were not significantly different. P-WA(P), P-WA(PO4) vs. AL, M3 methods were significantly different. The CoHex method was also significantly different from AL and M3 methods (Table 9).
Group 3–5: In these three groups, the results were identical with that of the first group, except for P-WA(PO4) vs. AL methods, which remained unchanged (Table 9).
The detailed classification based on CaCO3 content showed almost the same results when the pairwise analysis was based on all the data. The most similar methods were AL vs. M3 methods and P-WA(PO4), P-WA(P) vs. CoHex methods. CoHex vs. M3 and AL methods were significantly different in all CaCO3 groups. In this pairwise comparison, there was no significant difference between the results of AL and M3 in the CaCO3 groups.

3.3.5. Comparison of the Measured Values Based on the Clay-Content Groups

Group 1–5: In the first five groups (6.82–21.82%), the results of the pairwise analysis were the same in all groups (except for one result in group 4 where CoHex vs. M3 pair was not significantly different while in other groups it was). There was no significant difference between P-WA(P), P-WA(PO4) vs. Cohex and AL vs. M3 (Table 10).
Group 6: In the sixth clay group (21.83–24.89), the following pairs were significantly different: P-WA(PO4), P-WA(P) vs. Al, and CoHex vs. AL and M3 (Table 10).
The results of the pairwise analysis of the different clay groups produced almost identical results for the pairs; there were either no, or very little significance levels, or there were almost always 0.01 or stronger significance levels. The classification based on clay showed similar results to the pairwise analysis of all data.

3.3.6. All-Inclusive Evaluation of the Effect of the Examined Soil Parameters on Phosphorus Measurements

As a summary of the effect of all the examined soil parameters (pH (KCl), CaCO3 and clay), including all the groups created for each of them, a calculation was made to order the ratios of the significant results of the pairwise analysis (Table 11). It helps to evaluate the methods and establish general trends and tendencies.
Order: 1 to 7 (1: smallest difference 7: biggest difference based on all parameters).
Evaluation of the differences based on the four influencing factors resulted in the following order (1-smallest difference 7-biggest difference):
  • P-WA(PO4) vs. P-WA(P), P-WA(P) vs. CoHex and AL vs. M3
  • P-WA(PO4) vs. CoHex
  • P-WA(PO4) vs. AL
  • CoHex vs. AL
  • CoHex vs. M3
  • P-WA(PO4) vs. M3 and P-WA(P) vs. M3
  • P-WA(P) vs. AL

4. Discussion

Our findings indicate that pH and clay content influence the measured, plant-available P content of the soil, which opposes Blombäck et al.’s results [45]. They used pH, clay and total carbon as an explanatory variable for regression models, aiming to describe phosphorous saturation in the soil; however, they did not find notable improvements to the significance of the regression models.
Among the methods analysed, we found M3 as one of the two methods that measured the highest proportions of the total P. This contradicts the results of Silva and van Raij [46], who found that the anion exchange resin method resulted in the highest values for the determination coefficients for the correlations between phosphorous uptake by plants and soil phosphorous content. They also found that the resin method properly shows the effect of liming on the increase in P availability in soil, thus the M3 method does not; thus, the Mehlich method underestimates the plant-available phosphorous in the soil.
The water-soluble method measures the smallest amounts of plant-available P-content. However, it was not only used but found appropriate to evaluate the plant-available P-content of the soils of the Netherlands as early as the 1960 s [16]. Water-soluble P (PW) measurement was identified to be independent of organic matter content, pH, particle size distribution, and CaCO3-content, while also found to be sensitive to Fe2O3 content (above 10%). This goes against our findings, as we found dependencies on pH, lime and clay contents. The conclusion was that the PW value is an appropriate value for plant-available P content of the soil, and this is true for a wide variety of soils. It is in contradiction to the findings of Neyroud and Lischer [12], who found that PW values may underestimate the plant-available phosphorous in the soil. We also found that the water-soluble P and PO4 methods yielded similar results (and both were similar to the CoHex method), but they all had significant differences against all other methods in all groups of the influencing soil parameters. Pw is the fraction that has primary importance in diffuse pollution or P loss by leaching [46]. However, from the perspective of sustainability, selective erosion may also trigger considerable P loss from fertilized croplands resulting in sedimentation and consequent eutrophication of surface water bodies [47,48]. In contrast, considerable P loads were transported by the finest soil particles to surface water, where biological desorption occurs. Therefore, the biological desorption from sediments as potential P extraction must be considered [49].
In the case of the AL method, Neyroud and Lischer [12] corroborated that even the five laboratories they compared had different values, where the correlation coefficient (r) was between 0.48 to 0.97 with a standard deviation ranging from 0.25 to 0.54. Therefore, it was difficult to judge the comparisons in cases where various laboratories provide data with such significant differences. This fact highlights the gaps in the comparability of P extraction methods. It possibly reflects the importance of the role of the microbiome and many other environmental properties, such as drying-rewetting and freezing-thawing, as was shown by Blackwell et al. [50]. However, in our case, there was only one laboratory for AL, so the problem of high uncertainty measurements of various laboratories does not apply to our data. It was out of the scope for this study to compare other laboratories from other countries. However, the comparison of AL and M3 methods was similar (p = 1), while Neyroud and Lischer [12] found that AL method gives higher figures than M3 method.

5. Conclusions

This study shows that not only do the well-known extraction methods affect the evaluation of P measurements, but the soil and the chosen classification of the influencing soil parameters also affect it. As a result, we provide additional knowledge and understanding about the comparison of the influencing factors to help inform in cases where intervention is needed by applying extra phosphorus for appropriate fertilization.
Specifically, the all-inclusive pairwise analysis of the five different P measurement methods, based on the ratio between each P method and XRF method, proved that P-WA(P) vs. P-WA(PO4) and M3 vs. AL are similar (p = 1); and P-WA(P) vs. CoHex and P-WA(PO4) vs. CoHex are very similar (p values are 0.614 and 0.975), while all other pairs are different (p < 0.001).
Based on the analyses of the measured P ratios (compared with the amount measured with the XRF method), we can conclude that higher pH (KCl) results in more differences; e.g., in the case of P-WA(PO4) vs. CoHex, the p-value is 1 from pH 3.39 to 6.78 but turns to 0.825 in the pH (KCl) category of 6.79–7.2. Furthermore, it produces a significant difference in the highest group (7.21–8.14). This difference does not show up if we “just” compare all the data because although most of the values are very similar, the overall result shows no significant difference between the two methods (P-WA(PO4) vs. CoHex). However, if we analyse the pH (KCl) groups that allow us to separate acid, neutral, and slightly alkaline soils, it turns out that the highest category does produce a significant difference. This is an important detail that can be used in the future when different methods must be chosen, e.g., a common method for a project or an advisory system in a certain part of a continent or on a whole continent.
Based on the results in the CaCO3-groups, we can conclude that the effects are not linear. This is due to Group 4 (CaCO3-content = 3.17–8.79%), where p values are changing; e.g., in the case of P-WA(PO4) vs. P-WA(P) and P-WA(PO4) vs. CoHex, p is 1 in all other groups but decreases below 1 in Group 4. Vice versa, in the case of P-WA(PO4) vs. AL where there are significant differences in the two lowest CaCO3-content categories and p stays below 1 in the highest category (and in Group 3 also), also increases to 1 in Group 4. Making the trends even less obvious/logical, in the case of P-WA(P) vs. AL comparison, the differences are significant in Group 1 and 2 (with low CaCO3-content, p < 0.001), the significance is a little weaker in Group 3 and 5, while in Group 4, it is stronger than in Group 3 and 5, and weaker than in Group 1 and 2.
Thus, Group 4 differs and thus strengthens the idea that this group influences the measurements. Similarly, in the case of CoHex vs. AL comparison, the neighbours of Group 4 are different; Group 3 and Group 5 both have slightly weaker significant differences than Group 4. However, in this case, Group 4, Group 1, and Group 2 have the same p values (p < 0.001), so this is already the fifth case where Group 4 “behaves” differently from the other groups. Moreover, we can also conclude that, contrary to our most likely expectations of finding similarities in the case of pH (KCl) and CaCO3 as influencing factors—as we expected a connection between the two—their influencing effects are different. The pH (KCl) causes a stronger significance in differences with its increase, whereas this trend is not obvious in the case of CaCO3.
In the case of clay content, we can conclude that the highest category (in the present case, it is 21.83–24.89% clay) resulted in weaker significant differences.
Based on these results, an important conclusion can be drawn: analysing the all-inclusive data can result in very strong and significant differences between the applied methods. However, it can be misleading, as the in-depth analyses prove otherwise. Comparison of the methods based on the influencing factors shows that in some cases, there are also similarities besides the differences among the ways that provide more insight into method comparisons.
In conclusion, not only do the well-known extraction methods affect the evaluation of P measurements, but the soil and the chosen classification of the influencing soil parameters also affect it. This comparative analysis study can provide a guide to interpret the different analysis methods to achieve harmonization.
The comparison of the amount of P measured between the different analysis methods, compared to the total contents measured with the XRF method, has provided novel results. This comparative analysis study can provide some new approaches to compare and more appropriately interpret the different analysis methods. Furthermore, the in-depth analysis of the influencing factors can help farm managers find a more sustainable way of fertilization and thus, finite and expensive nutrients are not wasted.

Author Contributions

Conceptualization, all authors; methodology, V.V., M.V.; validation, G.J., C.C., V.V., M.V. and A.J.K.; formal analysis, Z.B., G.J., V.V. and C.C.; investigation, all authors; data curation, Z.B.; writing—original draft preparation, V.V.; writing—review and editing, C.C.; visualization, M.V.; supervision, C.C.; project administration, V.V., R.K., J.K., I.M.K.; funding acquisition, G.M. All authors have read and agreed to the published version of the manuscript.

Funding

The research presented in this paper was funded by the Thematic Excellence Program—National Challenges Subprogram—Complex Precision Crop Production Research at Széchenyi István University (TKP2020-NKA-14).

Institutional Review Board Statement

Not applicable.

Informed Consent Statement

Not applicable.

Data Availability Statement

Data available in a publicly accessible repository. The data presented in this study are openly available in Zenodo at https://doi.org/10.5281/zenodo.5684369 and https://doi.org/10.5281/zenodo.5851717 (all accessed on 7 February 2022).

Conflicts of Interest

The authors declare no conflict of interest.

Appendix A

Vona, V.; Centeri, C.; Vona, M. P, pH, lime and texture data of 70 Hungarian sites [Data set]. In Sustainability. Zenodo. 2021. https://doi.org/10.5281/zenodo.5684369 (accessed on 7 February 2022).

Appendix B

Biró, Z.; Vona, V.; Centeri, C. Results of statistical analyses of the comparison of phosphorous measurement laboratory methods [Data set]. Zenodo 2022 https://doi.org/10.5281/zenodo.5851717 (accessed on 7 February 2022).

References

  1. Isherwood, K.F. Fertiliser Consumption and Production: Long Term World Prospects; International Fertilizer Society Proceedings 507; International Fertilizer Society: York, UK, 2003; 28p. [Google Scholar]
  2. Houba, V.J.G.; Novozamsky, I.; van der Lee, J.J. Soil testing and plant analysis in Western Europe. Commun. Soil Sci. Plant Anal. 1992, 23, 2029–2051. [Google Scholar] [CrossRef]
  3. Jordan-Meille, L.; Rubæk, G.H.; Ehlert, P.A.I.; Genot, V.; Hofman, G.; Goulding, K.; Recknagel, J.; Provolo, G.; Barraclough, P. An overview of fertilizer-P recommendations in Europe: Soil testing, calibration and fertilizer recommendations. Soil Use Manag. 2012, 28, 419–435. [Google Scholar] [CrossRef]
  4. Torrent, J.; Barberis, E.; Gil-Sotres, F. Agriculture as a source of phosphorus for eutrophication in southern Europe. Soil Use Manag. 2007, 23, 25–35. [Google Scholar] [CrossRef]
  5. Senthilkumar, K.; Nesme, T.; Mollier, A.; Pellerin, S. Conceptual design and quantification of phosphorus flows and balances at the country scale: The case of France. Glob. Biogeochem. Cycles 2012, 26, GB2008. [Google Scholar] [CrossRef]
  6. Holford, I.C.R. Soil phosphorus: Its measurement, and its uptake by plants. Austr. J. Soil Res. 1997, 35, 227–240. [Google Scholar] [CrossRef]
  7. Sharpley, A.; Tunney, H. Phosphorus research strategies to meet agricultural and environmental challenges of the 21st Century. J. Environ. Qual. 2000, 29, 176–181. [Google Scholar] [CrossRef] [Green Version]
  8. Van Raij, B. New diagnostic techniques, universal soil extractants. Commun. Soil Sci. Plant Anal. 1994, 25, 799–816. [Google Scholar] [CrossRef]
  9. Tunney, H.; Breeuwsma, A.; Withers, P.J.A.; Ehlert, P.A.I. Phosphorus fertilizer strategies: Present and future. In Phosphorus Loss from Soil to Water, Proceedings of a Workshop, Wexford, Ireland, 29–31 September 1995; Tunney, H., Carton, O.T., Brookes, P.C., Johnson, A.E., Eds.; CAB International: Wallingford, UK, 1997; ISBN 0851991564. [Google Scholar]
  10. Wuenscher, R.; Unterfrauner, H.; Peticzka, R.; Zehetner, F. A comparison of 14 soil phosphorus extraction methods applied to 50 agricultural soils from Central Europe. Plant Soil Environ. 2015, 61, 86–96. [Google Scholar] [CrossRef]
  11. Ziadi, N.; Whalen, J.K.; Messiga, A.J.; Morel, C. Chapter Two—Assessment and Modeling of Soil Available Phosphorus in Sustainable Cropping Systems. In Advances in Agronomy; Sparks, D.L., Ed.; Academic Press: Cambridge, MA, USA, 2013; Volume 122, pp. 85–126. [Google Scholar] [CrossRef]
  12. Neyroud, J.-A.; Lischer, P. Do different methods used to estimate soil phosphorous availability across Europe give comparable results? J. Plant Nutr. Soil Sci. 2003, 166, 422–431. [Google Scholar] [CrossRef]
  13. Van der Paauw, F. An effective water extraction method for the determination of plant available phosphorus. Plant Soil 1971, 34, 467–481. [Google Scholar] [CrossRef]
  14. Mehlich, A. Mehlich 3 soil test extractant: A modification of the Mehlich 2 extractant. Commun. Soil Sci. Plant Anal. 1984, 15, 1409–1416. [Google Scholar] [CrossRef]
  15. Rumi, F.; Kashem, M.A.; Osman, K.T. Recovery of soil test phosphorus from an acidic soil amended with organic and inorganic phosphorus. Open J. Soil Sci. 2012, 2, 382–388. [Google Scholar] [CrossRef] [Green Version]
  16. Egnér, H.; Riehm, H.; Domingo, W. Untersuchungen über die chemische bodenanalyse als grundlage für die beurteiling des nährstoffzustandes der böden: II. Chemische extraktionsmethoden zur phosphor und kaliumbestimmung. Kungliga Lantbrukshögskol. Annal. 1960, 26, 199–215. [Google Scholar]
  17. Ulen, B. A simplified risk assessment for losses of dissolved reactive phosphorus through drainage pipes from agricultural soils. Acta Agric. Scand. Sect. B—Soil Plant Sci. 2006, 56, 307–314. [Google Scholar] [CrossRef]
  18. Blake, L.; Mercik, S.; Koerschens, M.; Moskal, S.; Poulton, P.R.; Goulding, K.W.T.; Weigel, A.; Powlson, D.S. Phosphorus content in soil, uptake by plants and balance in three European long-term field experiments. Nutr. Cycl. Agroecosys. 2000, 56, 263–275. [Google Scholar] [CrossRef]
  19. Ciesielski, H.; Sterckeman, T. Determination of CEC and exchangeable cations in soils by means of cobalt hexamine trichloride. Effects of experimental conditions. Agronomie 1997, 17, 1–8. [Google Scholar] [CrossRef] [Green Version]
  20. Vona, V.; Centeri, C.; Giczi, Z.; Kalocsai, R.; Biró, Z.; Jakab, G.; Milics, G.; Kovacs, A.J. Comparison of magnesium determination methods on Hungarian soils. Soil Water Res. 2020, 15, 173–180. [Google Scholar] [CrossRef]
  21. Weindorf, D.C.; Bakr, N.; Zhu, Y. Advances in Portable X-ray Fluorescence (PXRF) for Environmental, Pedological, and Agronomic Applications. Adv. Agron. 2014, 128, 65–2113. [Google Scholar] [CrossRef]
  22. Mehlich, A. Determination of P, Ca, Mg, K, Na, and NH4; Mimeo; North Carolina Soil Testing Division: Raleigh, NC, USA, 1953.
  23. Matejovic, I.; Durackova, A. Comparison of Mehlich 1-, 2-, and 3-, calcium chloride, Bray, Olsen, Egner, and Schachtschabel extractants for determination of nutrient in two soil types. Commun. Soil Sci. Plant Anal. 1994, 25, 1289–1302. [Google Scholar] [CrossRef]
  24. Tucker, M.R.; Messick, J.K.; Carter, C.C. Crop Fertilisation Based on North Carolina Soil Tests; Circular No. 1 (revised); North Carolina Department of Agriculture: Raleigh, NC, USA, 1996.
  25. Mehlich, A. New extractant for soil test evaluation of P, K, Mg, Ca, Na, Mn, and Zn. Commun. Soil Sci. Plant Anal. 1978, 9, 477–492. [Google Scholar] [CrossRef]
  26. Khiari, L.; Gallichand, J.; Bouslama, S. Volume or weight soil sampling for extracting Mehlich III elements with routine analyses? Commun. Soil Sci. Plant Anal. 2017, 48, 1753–1763. [Google Scholar] [CrossRef]
  27. Tucker, M.R. A review and update on the Mehlich 3 extractant. Presented at the Annual Meeting of Mid-Atlantic Soil Test Workgroup, Richmond, VA, USA, 18–19 February 2014. [Google Scholar]
  28. Tran, T.S.; Giroux, M.; Guilbeault, J.; Audesse, P. Evaluation of Mehlich 3 extractant to estimate the available P in Quebec soils. Commun. Soil Sci. Plant Anal. 1990, 21, 1–28. [Google Scholar] [CrossRef]
  29. Alva, A.K. Comparison of Mehlich 3, Mehlich 1, ammonium bicarbonateDTPA, 1.0 M ammonium acetate, and 0.2 M ammonium chloride for the extraction of calcium, magnesium, phosphorus, and potassium for a wide range of soils. Commun. Soil Sci. Plant Anal. 1993, 24, 603–612. [Google Scholar] [CrossRef]
  30. Mamo, T.; Richter, C.; Heiligtag, B. Comparison of extractants for the determination of available P, K, Ca, Mg, and Na in some Ethiopian and German soils. Commun. Soil Sci. Plant Anal. 1996, 27, 2197–2212. [Google Scholar] [CrossRef]
  31. Schmisek, M.E.; Cihacek, L.J.; Swenson, L.J. Relationship between the Mehlich 3 soil test extraction procedure and standard soil test methods in North Dakota. Commun. Soil Sci. Plant Anal. 1998, 29, 1719–1729. [Google Scholar] [CrossRef]
  32. Fotyma, M.; Dobers, E.S. Soil testing methods and fertilizer recommendations in Central-Eastern European countries. Fertil. Fertil. 2008, 30, 6–93. [Google Scholar]
  33. Sarker, A.; Kashem, M.; Osman, K.; Hossain, I.; Ahmed, F. Evaluation of available phosphorus by soil test methods in an acidic soil incubated with different levels of lime and phosphorus. Open J. Soil Sci. 2014, 4, 103–108. [Google Scholar] [CrossRef] [Green Version]
  34. ISO 23470:2007; Determination of Effective Cation Exchange Capacity (CEC) and Exchangeable Cations Using a Hexamminecobalt Trichloride Solution. ISO: Geneva, Switzerland, 2007.
  35. Egnér, H. Bestimmung der Kalibedürftigkeit des Bodens auf chemischen Wege. Vorláufige Mitteilung. Bodenkd. Pflanzenernähr. 1940, 21/22, 270–277. [Google Scholar] [CrossRef]
  36. Bray, R.H.; Kurtz, L.T. Determination of total organic and available forms of phosphorus in soils. Soil Sci. 1945, 59, 39–45. [Google Scholar] [CrossRef]
  37. Sarkadi, J.; Thamm, F.; Pusztai, A. A talaj P-ellátottságának megítélése a korrigált AL-P segítségével. Melior.-Öntöz. Tápanyaggazdálk. 1987, 2, 66–72. [Google Scholar]
  38. Minasny, B.; McBratney, A. A conditioned Latin hypercube method for sampling in the presence of ancillary information. Comput. Geosci. 2006, 32, 1378–1388. [Google Scholar] [CrossRef]
  39. Roudier, P.; Hedley, C.B. Smart sampling to assist on-farm nutrient management. In Accurate and Efficient Use of Nutrients on Farms; Occasional Report No. 26; Currie, L.D., Christensen, C.L., Eds.; Fertilizer and Lime Research Centre, Massey University: Palmerston North, New Zealand, 2013. [Google Scholar]
  40. Wolf, A.; Beegle, D. (Eds.) Recommended soil tests for macro and micronutrients. In Recommended Soil Testing Procedures for the Northeastern United States, 3rd ed.; Northeastern Regional Publication No. 493; Cooperative Extension, University of Delaware: Newark, DE, USA, 2009; pp. 39–48. [Google Scholar]
  41. MSZ 20135:1999; Determination of Soluble Soil Nutrients. 4.2.1. Section and 5.2. Section. Hungarian Standard Association: Budapest, Hungary, 1999. (In Hungarian)
  42. ISO 18227:2014; Soil Quality—Determination of Elemental Composition by X-ray Fluorescence. ISO: Geneva, Switzerland, 2014.
  43. MSZ-08-0206-2:1978; Evaluation of Some Chemical Properties of the Soil. Laboratory Tests. (pH Value, Phenolphthalein Alkalinity Expressed in Soda, All Water-Soluble Salts, Hydrolite (y1-Value) and Exchanging Acidity (y2-value). Hungarian Standard Association: Budapest, Hungary, 1978. (In Hungarian)
  44. Antal, J.; Buzás, I.; Debreczeni, B.; Nagy, M.; Sipos, S.; Sváb, J. A Műtrágyázás Irányelvei és Üzemi Számítási Módszer. I. Rész. N, P, K Műtrágyázási Irányelvek; Buzás, I., Fekete, A., Buzás, I.-N., Csengeri, P.-N., Kovács, Á.-N., Eds.; MÉM Növényvédelmi és Agrokémiai Központ: Budapest, Hungary, 1979; pp. 1–47. [Google Scholar]
  45. Blombäck, K.; Bolster, C.H.; Lindsjö, A.; Hesse, K.; Linefur, H.; Parvage, M.M. Comparing measures for determination of phosphorus saturation as a method to estimate dissolved P in soil solution. Geoderma 2021, 383, 114708. [Google Scholar] [CrossRef]
  46. Silva, F.C.; van Raij, B. Phosphorus availability of the evaluation by several extractors in soil samples cultivated with sugarcane. J. Soil Sci. Braz. 1996, 20, 83–90. [Google Scholar]
  47. Delgado, A.; Torrent, J. Comparison of soil extraction procedures for estimating phosphorus release potential of agricultural soils. Commun. Soil Sci. Plant Anal. 2001, 32, 87–105. [Google Scholar] [CrossRef]
  48. Kerr, J.G.; Burford, M.A.; Olley, J.M.; Bunn, S.E.; Udy, J. Examining the link between terrestrial and aquatic phosphorus speciation in a subtropical catchment: The role of selective erosion and transport of fine sediments during storm events. Water Res. 2011, 45, 3331–3340. [Google Scholar] [CrossRef] [PubMed]
  49. Simpson, Z.P.; McDowell, R.W.; Condron, L.M. The biotic contribution to the benthic stream sediment phosphorus buffer. Biogeochemistry 2020, 151, 63–79. [Google Scholar] [CrossRef]
  50. Blackwell, M.S.A.; Brookes, P.C.; de la Fuente-Martinez, N.; Gordon, H.; Murray, P.J.; Snars, K.E.; Williams, J.K.; Bol, R.; Haygarth, P.M. Chapter 1—Phosphorus Solubilization and Potential Transfer to Surface Waters from the Soil Microbial Biomass Following Drying-Rewetting and Freezing-Thawing. In Advances in Agronomy; Sparks, D.L., Ed.; Academic Press: Cambridge, MA, USA, 2010; pp. 1–35. [Google Scholar] [CrossRef]
Figure 1. Sampling locations of the 70 soil samples collected in Hungary during the summer of 2017.
Sustainability 14 02158 g001
Figure 2. Results of the non-parametric Kruskal–Wallis test compared the variety of applied methods (KW = 251.373, df = 4, p = 0.000, * = potential outliers, points at a greater distance from the median than 1.5 times the interquartile range).
Sustainability 14 02158 g002
Table 1. pH, CaCO3 and clay content groups with group thresholds and the number of samples classified.
GroupspH (KCl)CaCO3-ContentClay Particle Size (%)
Group 1 3.39–4.35 (n = 11)<0.1% (n = 27)6.82–9.64 (n = 8)
Group 2 4.36–5.47 (n = 11)0.11–0.84% (n = 17)9.65–12.74 (n = 24)
Group 3 5.48–6.78 (n = 12)0.85–3.16% (n = 7)12.75–15.69 (n = 14)
Group 4 6.79–7.2 (n = 13)3.17–8.79% (n = 9)15.70–18.59 (n = 13)
Group 5 7.21–8.14 (n = 23)8.80–18.71% (n = 10)18.60–21.82 (n = 6)
Group 6 21.83–24.89 (n = 5)
Table 2. The basic statistical summary of all samples.
IndicatorspH (KCl)CaCO3 (%)Clay (%)
Mean6.22.614.3
RSD1.34.24.4
Median70.413.3
CV0.21.60.3
Min3.40.16.8
Max8.118.724.9
RSD—standard deviation; CV—coefficient of variation.
Table 3. P content determined by the different methods for all samples (n = 70).
IndicatorsP Content (mg/kg)
P-WA(PO4)P-WA(P)M3CoHexALXRF
Mean1.81.656.31.9108.4597.1
RSD2.52.859.72.2143.4257.0
Median0.80.340.41.167.7539.3
CV1.41.71.11.21.30.4
Min0.10.33.30.04.465.5
Max13.713.9353.414.1785.61266.4
RSD—standard deviation; CV—coefficient of variation.
Table 4. The relationship between the P contents measured by P-WA(P), P-WA(PO4), M3, CoHex, AL, and XRF methods.
MethodsR2
P-WA(PO4) vs. P-WA(P) 0.89
P-WA(PO4) vs. M30.72
P-WA(P) vs. M30.67
AL vs. XRF0.49
CoHex vs. AL0.45
M3 vs. CoHex0.43
P-WA(PO4) vs. CoHex0.39
P-WA(P) vs. CoHex0.39
CoHex vs. XRF0.33
M3 vs. AL0.33
M3 vs. XRF0.2
P-WA(P) vs. AL0.09
P-WA(PO4) vs. AL0.08
P-WA(PO4) vs. XRF0.07
P-WA(P) vs. XRF 0.06
Table 5. The proportion of measured P from the total amount (XRF).
Indicators% P from the Total Amount of P, Measured with XRF
P-WA(PO4)P-WA(P)M3CoHexAL
Mean0.310.299.930.3015.62
RSD0.390.449.800.2513.49
Median0.130.097.150.2111.29
Min0.010.020.280.001.01
Max1.642.4644.131.2468.67
Table 6. The ratio (%) of measured P from the total amount (XRF) in the case of <1% and >1% CaCO3 content.
IndicatorsCaCO3 (%)% from the Total Amount of P (XRF)
P-WA(PO4)P-WA(P)M3CoHexAL
Mean<10.340.3310.800.2512.79
>10.260.228.470.3920.41
RSD<10.410.4810.570.2410.17
>10.360.388.320.2616.91
Median<10.160.117.010.1610.79
>10.130.067.150.4215.02
Min<10.020.031.310.001.09
>10.010.020.280.051.01
Max<11.512.4644.130.9651.70
>11.641.6542.151.2468.67
Table 7. Correlation regression between the measured P proportion (from the total amount XRF) between the different analysis methods in the two lime content categories.
MethodsR2 Values
<1% CaCO3>1% CaCO3
P-WA(PO4) vs. P-WA(P)0.660.93
P-WA(PO4) vs. CoHex0.280.40
P-WA(PO4) vs. AL0.410.00
P-WA(PO4) vs. M30.760.73
P-WA(P) vs. CoHex0.430.36
P-WA(P) vs. AL0.690.01
P-WA(P) vs. M30.560.64
CoHex vs. AL0.390.20
CoHex vs. M30.280.28
AL vs. M30.390.10
Table 8. Pairwise analysis of the measured phosphorous proportion compared with the measured total phosphorous amounts based on the pH (KCl) groups.
Group 1 Group 2 Group 3 *Group 4Group 5
pH (KCl)3.39–4.354.36–5.475.48–6.786.79–7.207.21–8.14
P-WA(PO4) vs. P-WA(P)p = 1p = 1p = 1p = 1p = 1
P-WA(PO4) vs. CoHexp = 1p = 1p = 1p = 0.825p < 0.015
P-WA(PO4) vs. ALp < 0.001p < 0.002p < 0.001p < 0.001p < 0.001
P-WA(PO4) vs. M3p < 0.001p < 0.001p < 0.001p < 0.001p < 0.001
P-WA(P) vs. CoHexp = 1p = 1p = 1p = 1p = 0.32
P-WA(P) vs. ALp < 0.019p < 0.007p < 0.001p < 0.003p < 0.001
P-WA(P) vs. M3p < 0.002p < 0.002p < 0.001p < 0.001p < 0.001
CoHex vs. ALp < 0.019p < 0.007p < 0.001p = 0.184p = 0.068
CoHex vs. M3p < 0.002p < 0.002p < 0.001p < 0.002p < 0.001
AL vs. M3p = 1p = 1p = 1p = 1p = 0.764
* Group 3: Tukey post hoc test.
Table 9. Pairwise analysis of the measured phosphorous ratios compared with the measured total phosphorous amounts based on the CaCO3 groups.
Group 1Group 2Group 3Group 4Group 5
CaCO3%<0.10.11–0.840.85–3.163.17–8.798.80–18.71
P-WA(PO4) vs. P-WA(P)p = 1p = 1p = 10.66p = 1
P-WA(PO4) vs. CoHexp = 1p = 1p = 10.162p = 1
P-WA(PO4) vs. ALp < 0.001p < 0.005p = 0.398p = 1p = 0.82
P-WA(PO4) vs. M3p < 0.001p < 0.001p < 0.001p < 0.001p < 0.001
P-WA(P) vs. CoHexp = 1p = 1p = 1p = 1p = 1
p-WA(P) vs. ALp < 0.001p < 0.001p < 0.016p < 0.0110.016
P-WA(P) vs. M3p < 0.001p < 0.001p < 0.001p < 0.001p < 0.001
CoHex vs. ALp < 0.001p < 0.001p < 0.009p < 0.001p < 0.016
CoHex vs. M3p < 0.001p < 0.001p < 0.001p < 0.001p < 0.001
AL vs. M3p = 1p = 1p = 1p = 1p = 1
Table 10. Pairwise analysis of the measured phosphorus ratios compared with the measured total phosphorous amounts based on the clay groups.
Clay (%)Group 1 *Group 2Group 3
6.82–9.649.65–12.7412.75–15.69
P-WA(PO4) vs. P-WA(P)p = 1p = 1p = 1
P-WA(PO4) vs. CoHexp = 1p = 1p = 1
P-WA(PO4) vs. ALp < 0.001p < 0.001p < 0.001
P-WA(PO4) vs. M3p < 0.01p < 0.001p < 0.001
P-WA(P) vs. CoHexp = 1p = 1p = 1
P-WA(P) vs. ALp < 0.001p < 0.001p < 0.001
P-WA(P) vs. M3p < 0.01p < 0.001p < 0.002
CoHex vs. ALp < 0.001p < 0.001p < 0.001
CoHex vs. M3p < 0.01p < 0.001p < 0.019
AL vs. M3p = 1p = 1p = 1
Clay (%)Group 4Group 5 *Group 6 *
15.70–18.5918.60–21.8221.83–24.89
P-WA(PO4) vs. P-WA(P)p = 1p = 1p = 1
P-WA(PO4) vs. CoHexp = 0.092p = 1p = 1
P-WA(PO4) vs. ALp < 0.001p < 0.001p < 0.01
P-WA(PO4) vs. M3p < 0.001p < 0.01p = 1
P-WA(P) vs. CoHexp = 1p = 1p = 1
P-WA(P) vs. ALp < 0.001p < 0.001p < 0.01
P-WA(P) vs. M3p < 0.003p < 0.01p = 1
CoHex vs. ALp = 0.013p < 0.001p < 0.01
CoHex vs. M3p < 0.35p < 0.01p = 1
AL vs. M3p = 1p = 1p = 1
* Group 1, 5, 6: Tukey post hoc test.
Table 11. The average of the number of significant results of all the pairwise analyses of the P% measurements (compared with the XRF measuring the total amount) along with the four influencing factors (pH (KCl), CaCO3 and clay).
Methods% of the Significant Results Related to Soil Parameters
pH (KCl)CaCO3 Clay AverageORDER
P-WA(PO4) vs. P-WA(P)00001
P-WA(P) vs. CoHex00001
AL vs. M300001
P-WA(PO4) vs. CoHex200072
P-WA(PO4) vs. AL10040100803
CoHex vs. AL60100100874
CoHex vs. M310010067895
P-WA(PO4) vs. M310010083946
P-WA(P) vs. M310010083946
P-WA(P) vs. AL1001001001007
Publisher’s Note: MDPI stays neutral with regard to jurisdictional claims in published maps and institutional affiliations.

