
Spectrophotometric Determination of Molybdenum(VI) as a Ternary Complex with 4-Nitrocatechol and Benzalkonium Chloride


 ,
, 
Abstract
:1. Introduction
2. Results and Discussion
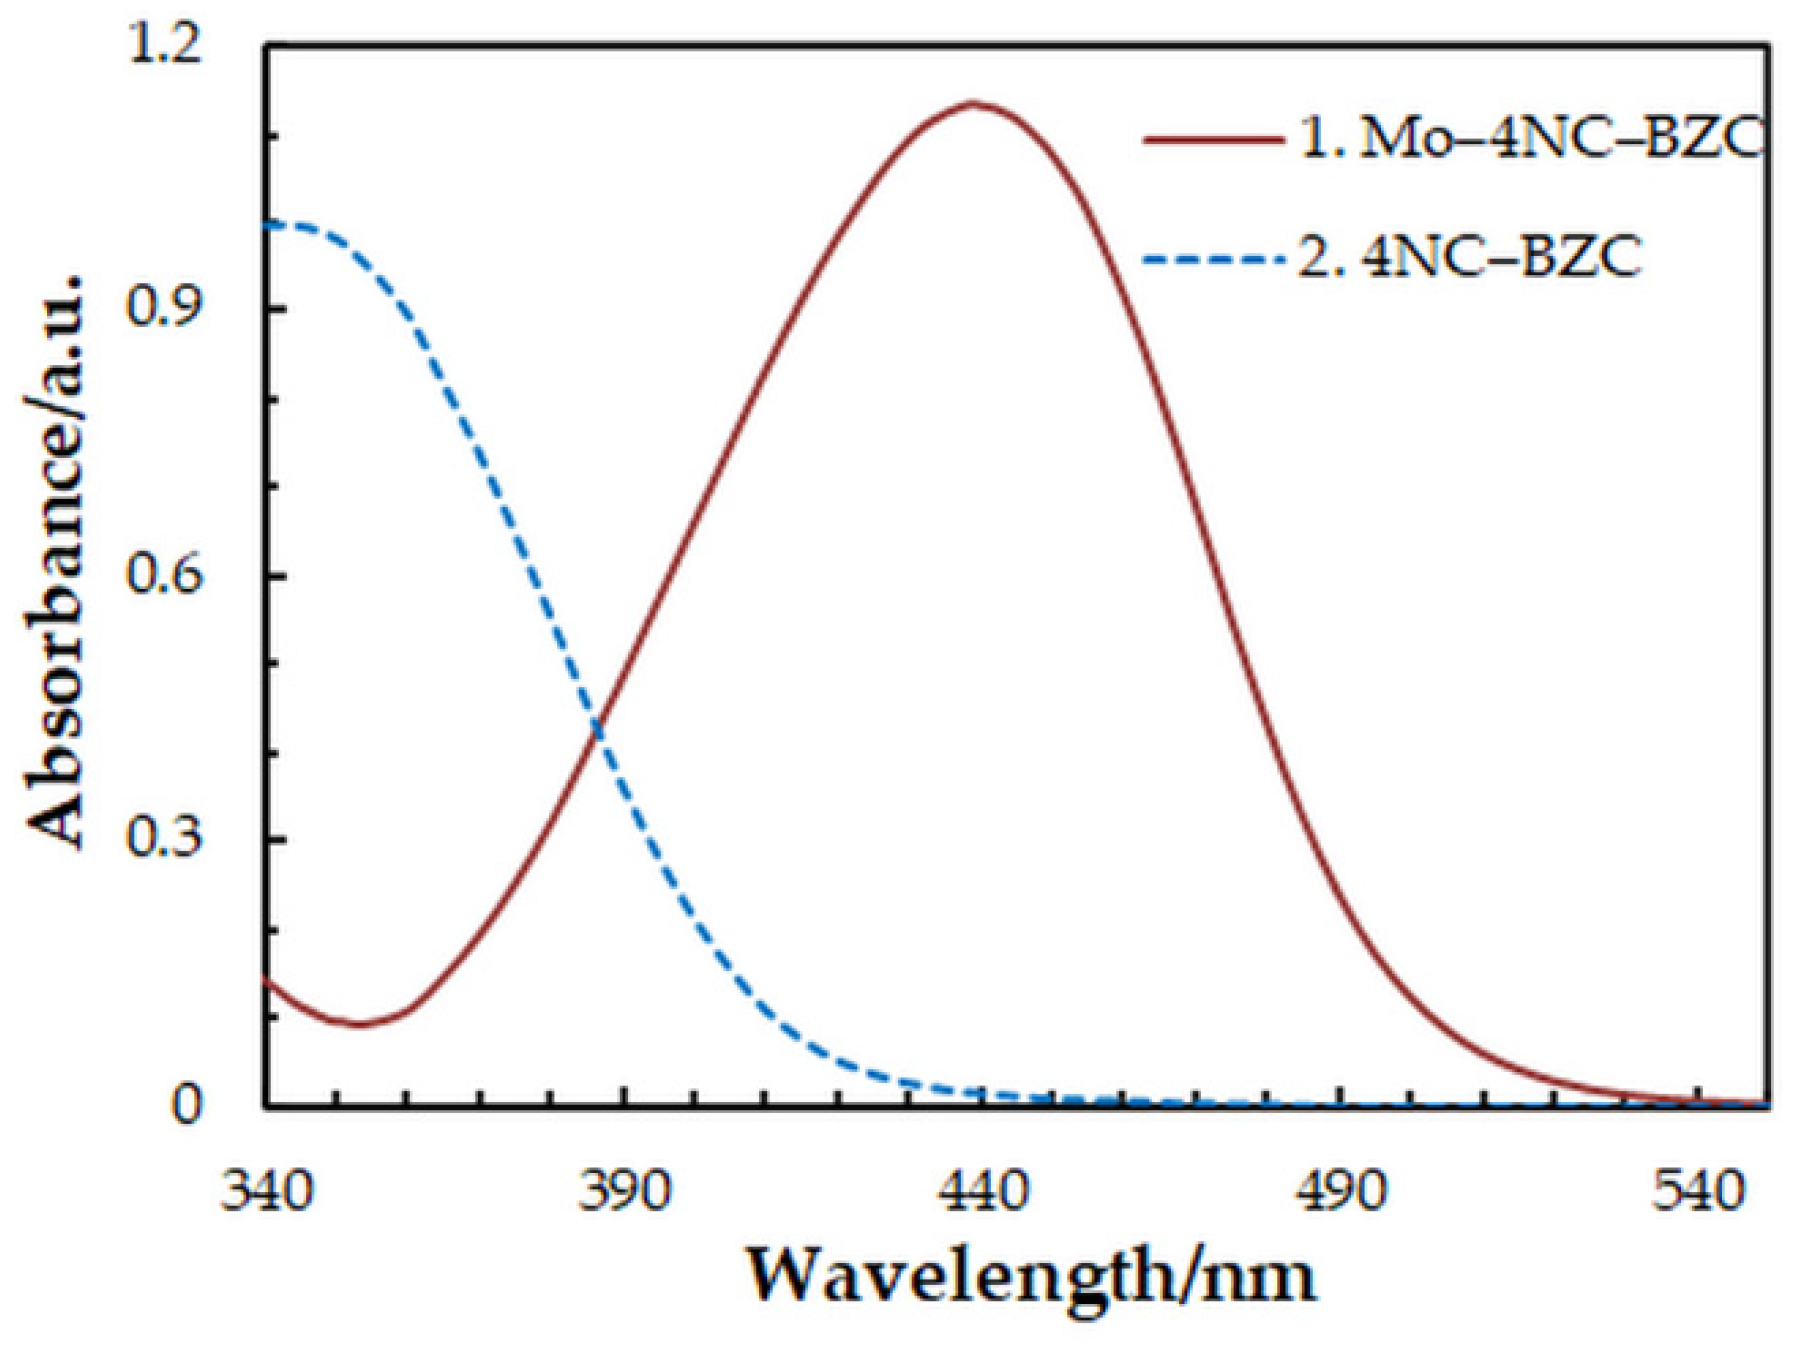
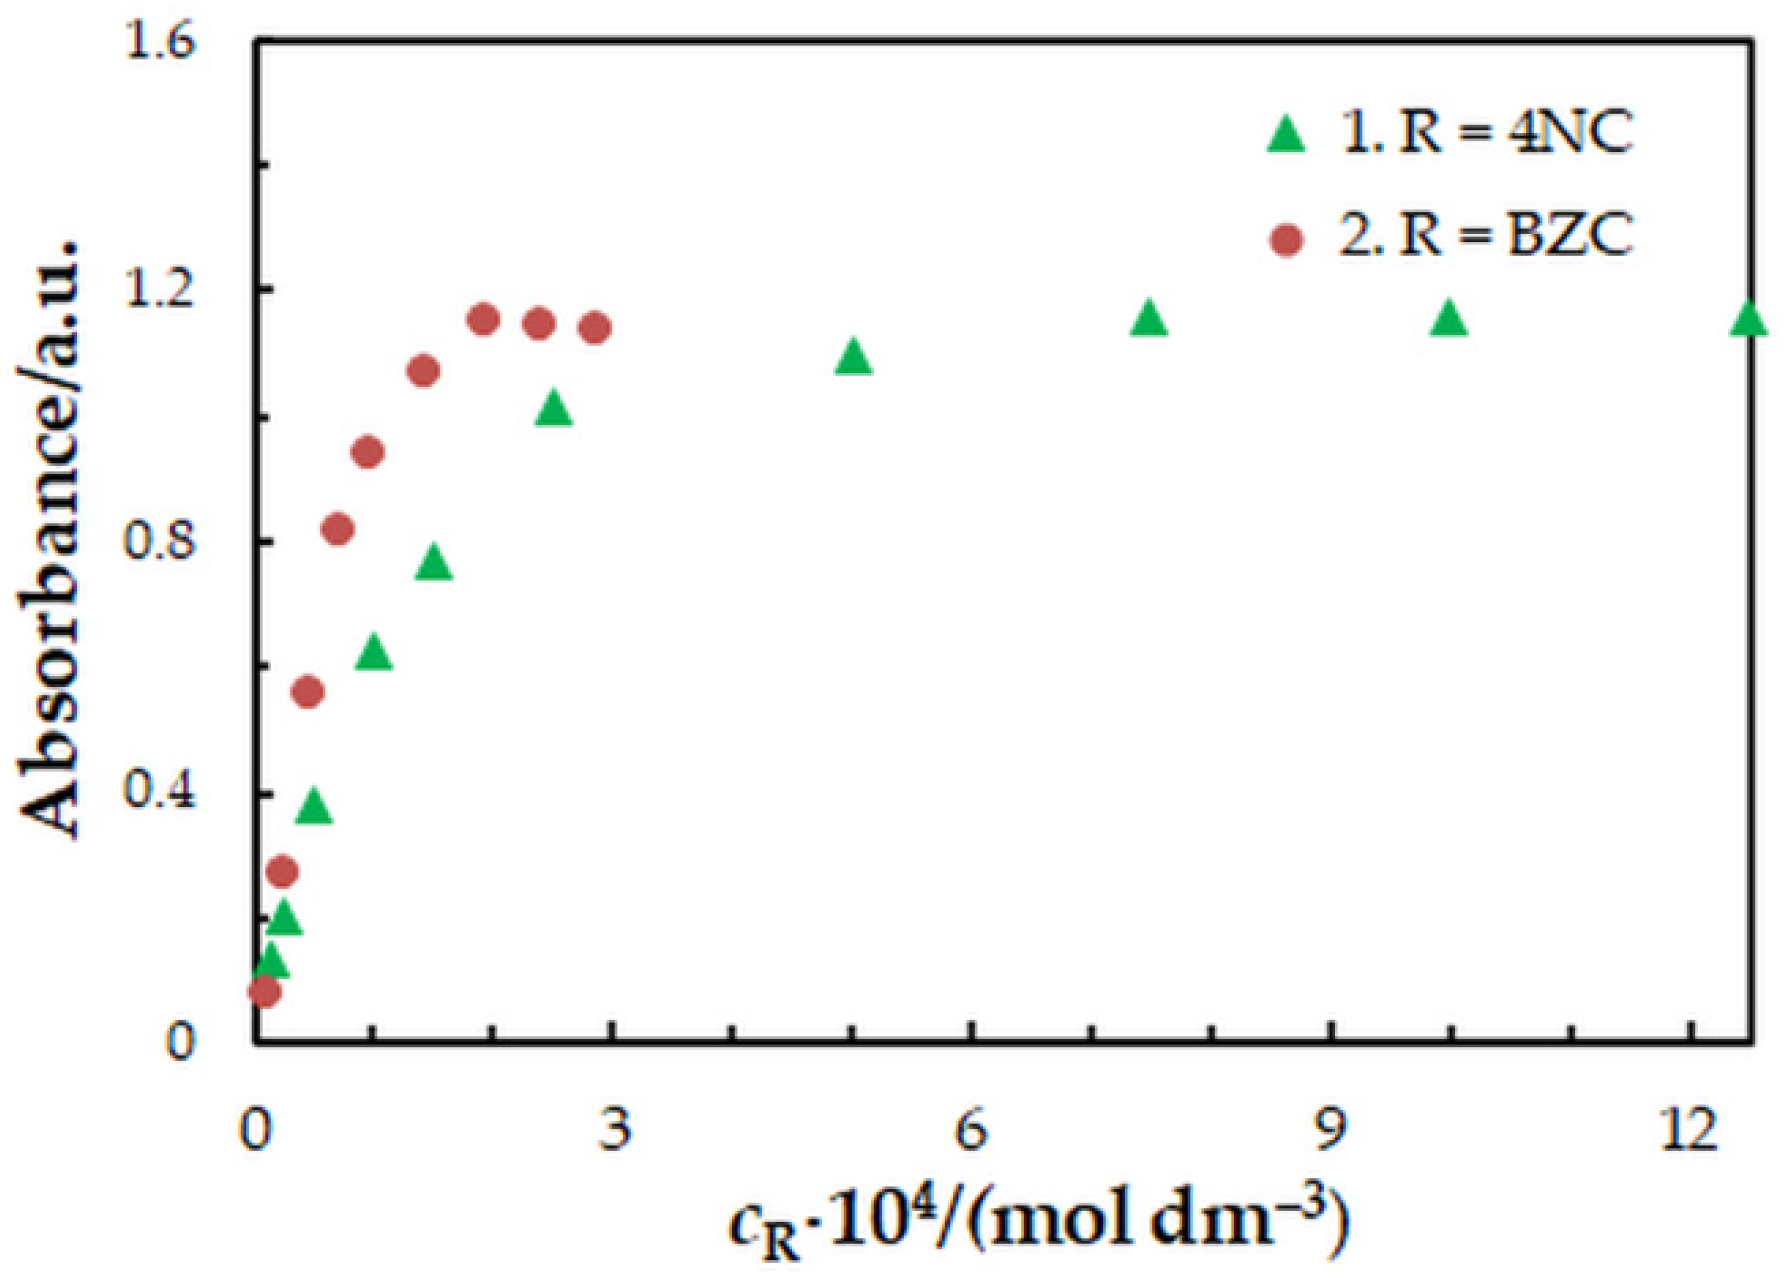
2.1. Liquid—Liquid Extraction—Spectrophotometric Optimization
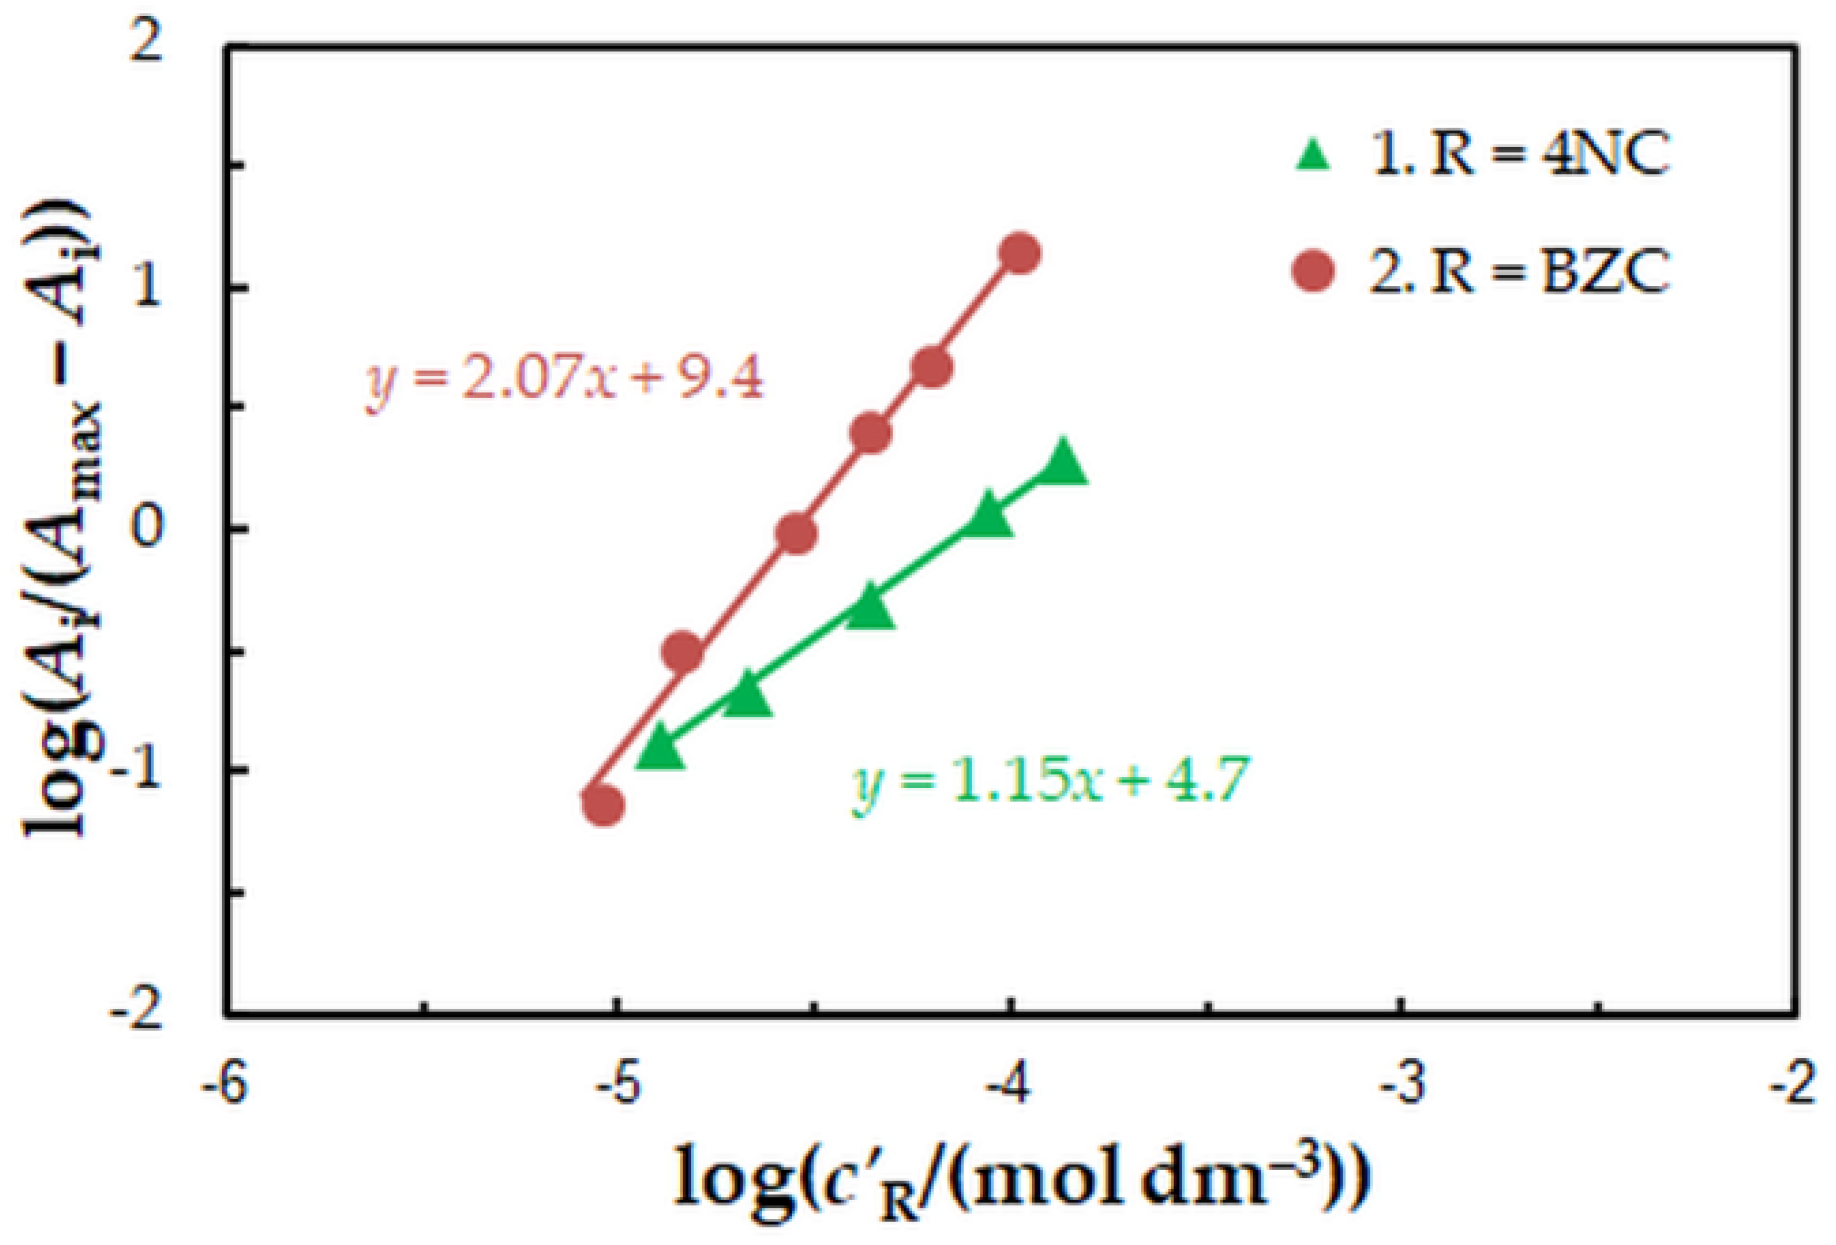
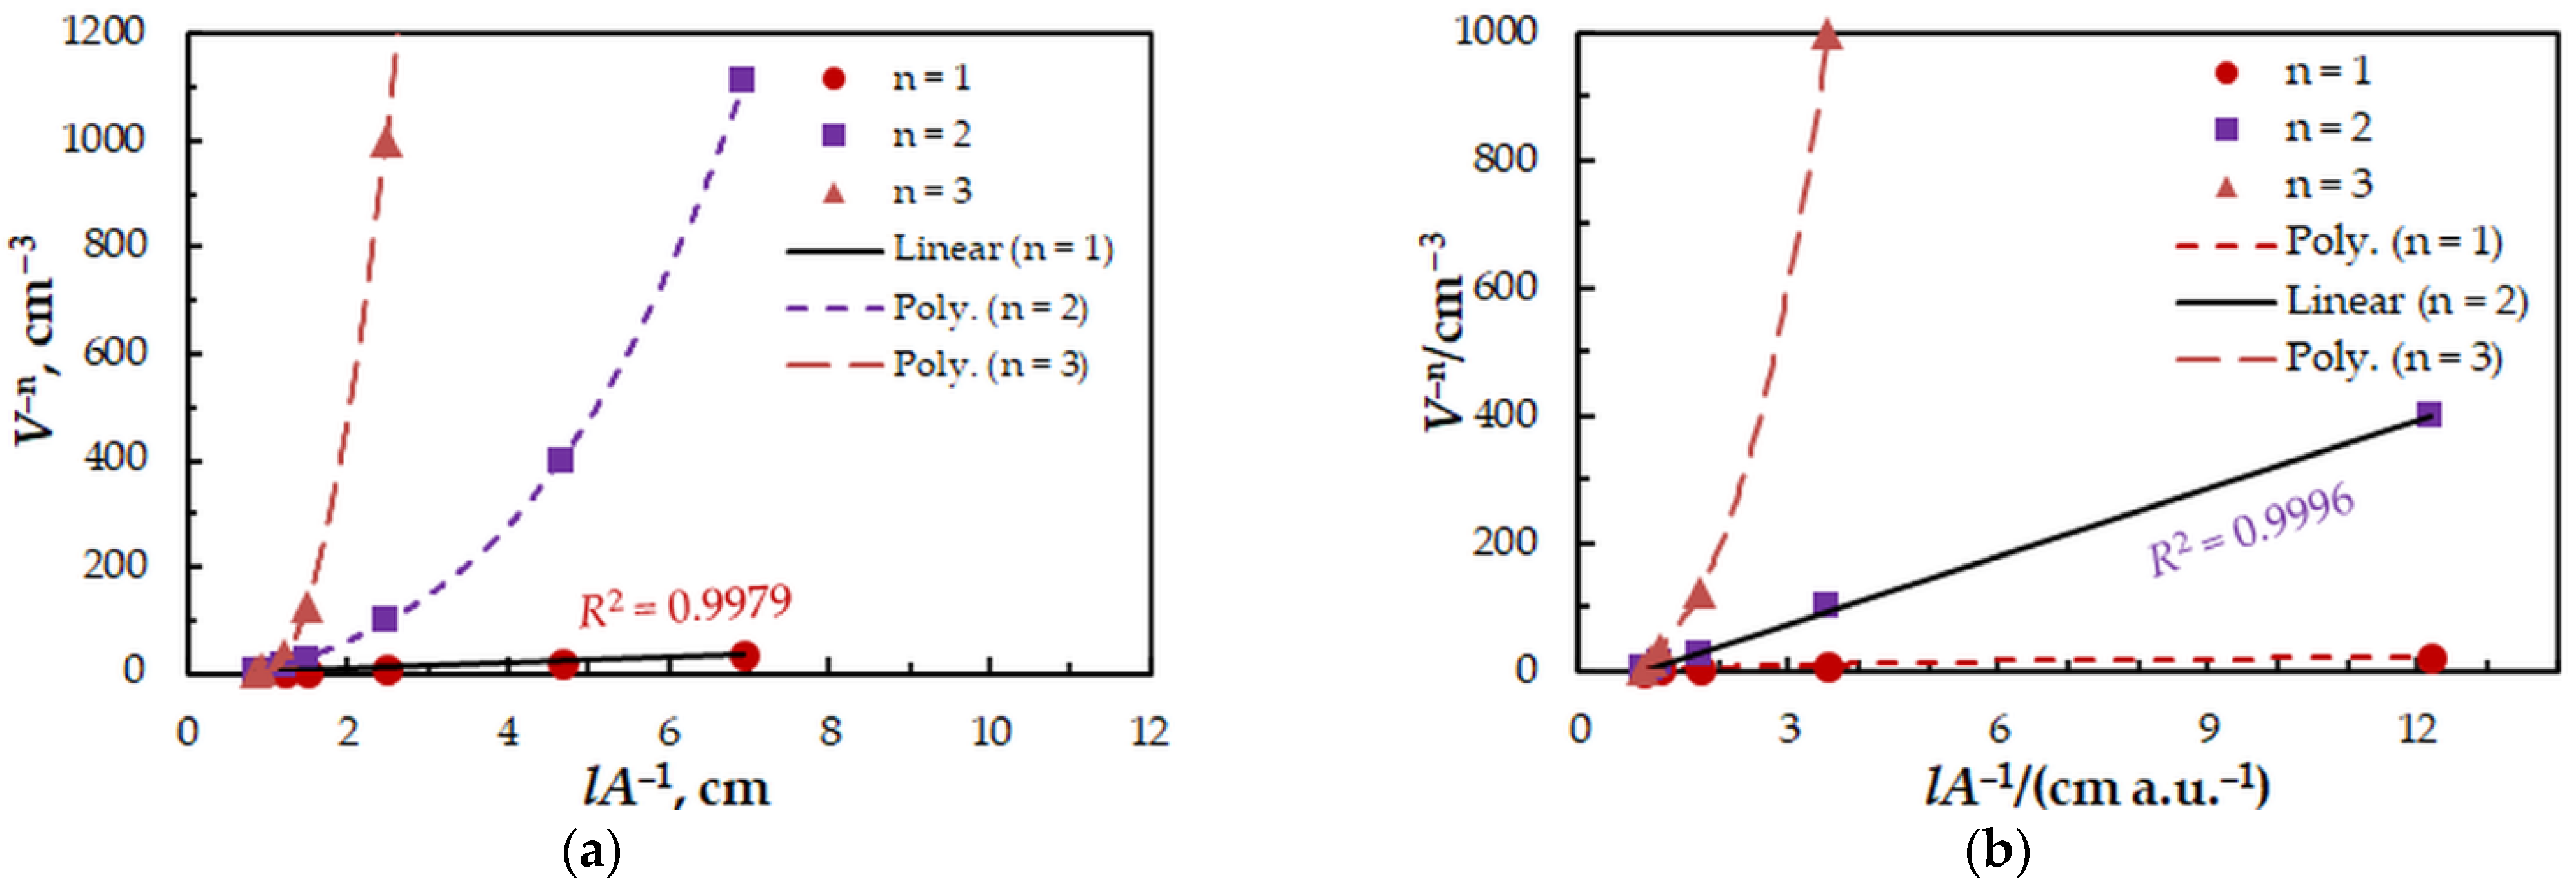
2.2. Molar Ratios and Formula of the Ternary Complex
2.3. Extraction Constant, Distribution Ratio and Fraction Extracted
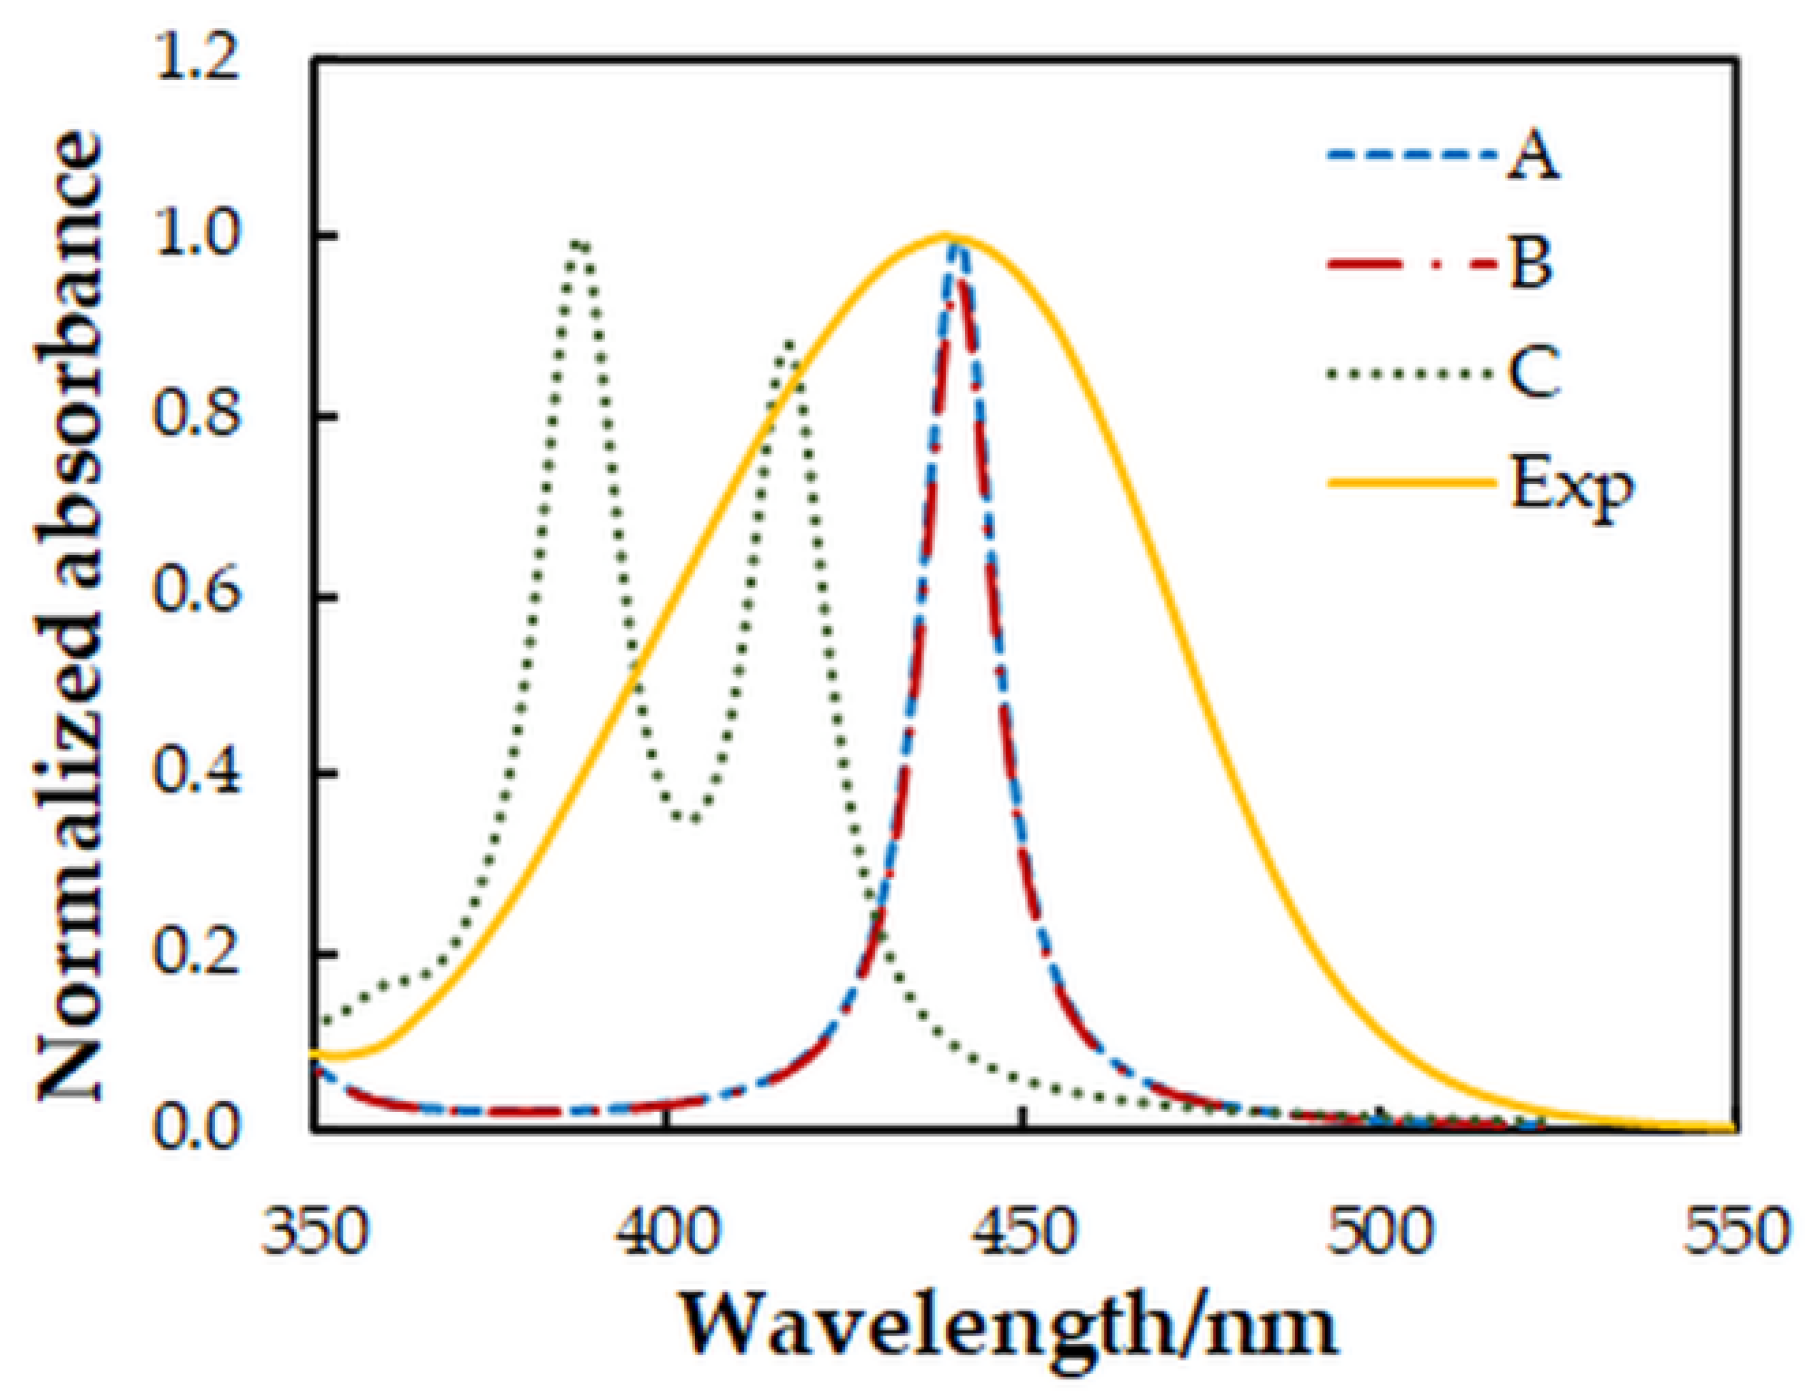
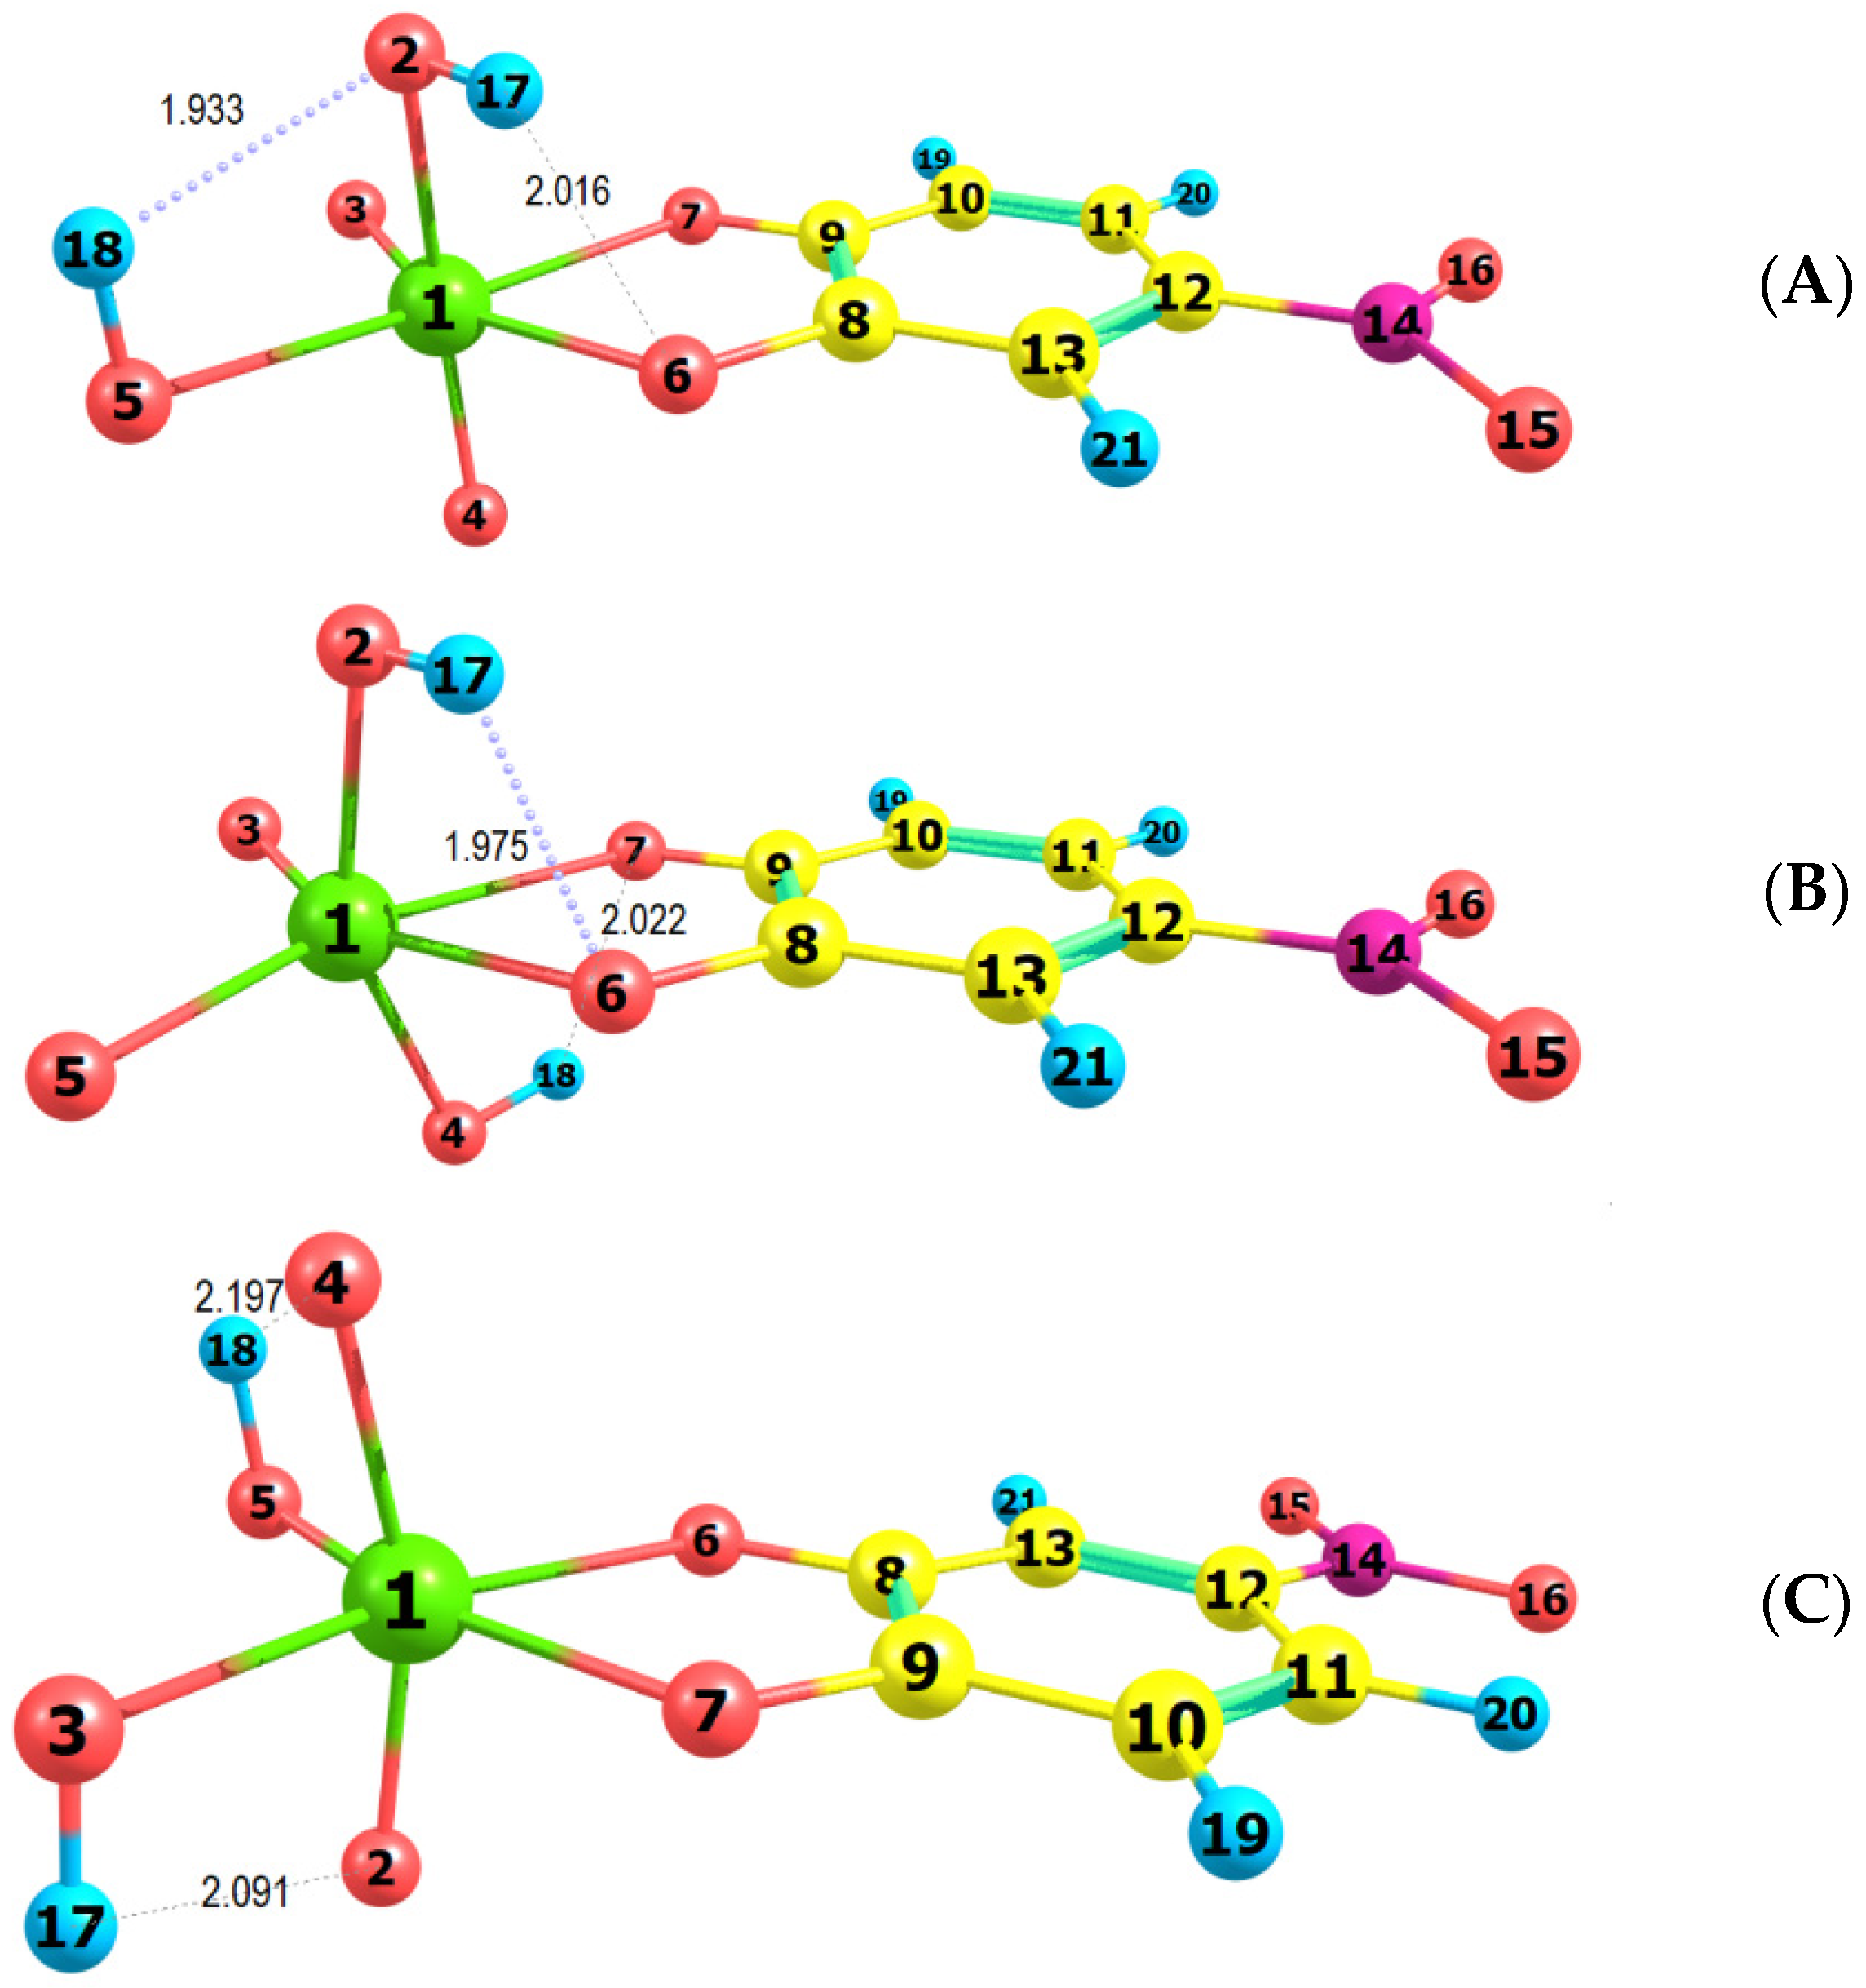
2.4. Ground-State Equilibrium Geometries of the Anionic Part, Spectral Comparison, Energies, and Kinetics
2.5. Effect of Foreign Ions and Masking Agents
2.6. Analytical Characteristics and Application
2.7. Comparison with Other Liquid—Liquid Extraction–Spectrophotometric Procedures
3. Experimental Section
3.1. Reagents and Chemicals
3.2. Instrumentation
3.3. General Optimization Procedure
3.4. Determination of the Distribution Ratio and Fraction Extracted
3.5. Sample Preparation
3.6. Procedure for the Determination of Molybdenum(VI)
4. Theoretical Section
5. Conclusions
Author Contributions
Funding
Institutional Review Board Statement
Informed Consent Statement
Data Availability Statement
Conflicts of Interest
Sample Availability
References
- Outteridge, T.; Kinsman, N.; Ronchi, G.; Mohrbacher, H. Editorial: Industrial relevance of molybdenum in China. Adv. Manuf. 2020, 8, 35–39. [Google Scholar] [CrossRef] [Green Version]
- Chatterjee, K.K. Uses of Metals and Metallic Minerals; New Age International (P) Ltd.: New Delhi, India, 2007; pp. 205–209. [Google Scholar]
- Lunk, H.-J.; Hartl, H. Discovery, properties and applications of molybdenum and its compounds. ChemTexts 2017, 3, 13. [Google Scholar] [CrossRef]
- Lide, D.R. CRC Handbook of Chemistry and Physics; CRC Press: Boca Raton, FL, USA, 2005. [Google Scholar]
- Schwarz, G.; Belaidi, A.A. Interrelations between Essential Metal Ions and Human Diseases; Sigel, A., Sigel, H., Sigel, R.K.O., Eds.; Springer: Dordrecht, The Netherlands, 2013; pp. 415–450. [Google Scholar] [CrossRef]
- PSmedley, P.; Cooper, D.; Ander, E.L.; Milne, C.; Lapworth, D. Occurrence of molybdenum in British surface water and groundwater: Distributions, controls and implications for water supply. Appl. Geochem. 2014, 40, 144–154. [Google Scholar] [CrossRef]
- Novotny, J.A.; A Peterson, C. Molybdenum. Adv. Nutr. 2018, 9, 272–273. [Google Scholar] [CrossRef]
- Ghasemzadeh, N.; Karimi-Nazari, E.; Yaghoubi, F.; Zarei, S.; Azadmanesh, F.; Reza, J.Z.; Sargazi, S. Molybdenum Cofactor Biology and Disorders Related to Its Deficiency; A Review Study. J. Nutr. Food Secur. 2019, 4, 206–217. [Google Scholar] [CrossRef]
- EFSA, Overview on Dietary Reference Values for the EU Population as Derived by the EFSA Panel on Dietetic Products, Nutrition and Allergies (NDA). Available online: https://www.efsa.europa.eu/sites/default/files/assets/DRV_Summary_tables_jan_17.pdf (accessed on 4 September 2021).
- Ivanov, V.M.; Kochelaeva, G.A.; Prokhorova, G.V. Methods for Determining Molybdenum. J. Anal. Chem. 2002, 57, 758–772. [Google Scholar] [CrossRef]
- Filik, H.; Tütem, E.; Apak, R. Use of the molybdenum–thiocyanate–rhodamine 6G ternary complex for spectrophotometric molybdenum determination without extraction. Anal. Chim. Acta 2004, 505, 77–82. [Google Scholar] [CrossRef]
- Pyrzynska, K. Determination of molybdenum in environmental samples. Anal. Chim. Acta 2007, 590, 40–48. [Google Scholar] [CrossRef]
- Kara, D.; Karadaş, C. A simple spectrophotometric method for the determination of trace levels of molybdenum using N,N′-bis(2-hydroxy-5-bromo-benzyl)1,2 diaminopropane. Spectrochim. Acta Part A 2015, 147, 158–162. [Google Scholar] [CrossRef]
- Temel, N.K.; Gürkan, R. Catalytic spectrophotometric determination of trace Mo(vi) in milk-based beverages in the presence of bromophenol blue and H2O2 using SDS as a sensitizer. Anal. Methods 2016, 8, 6284–6292. [Google Scholar] [CrossRef]
- Penner, M.H. Food Analysis; Nielsen, S.S., Ed.; Springer: Cham, Switzerland, 2017; pp. 89–106. [Google Scholar] [CrossRef]
- Passos, M.L.; Saraiva, M.L.M. Detection in UV-visible spectrophotometry: Detectors, detection systems, and detection strategies. Measurement 2019, 135, 896–904. [Google Scholar] [CrossRef]
- Marczenko, Z.; Balcerzak, M. Separation, Preconcentration and Spectrophotometry in Inorganic Analysis; Elsevier: Amsterdam, The Netherlands, 2000. [Google Scholar]
- Amin, A.S.; Moustafa, I.M.; El-Sharjawy, A.A. Utilization of Cloud-Point Preconcentration for Spectrophotometric Determination of Trace Amounts of Molybdenum(VI) in Plants and Water Samples. Can. Chem. Trans. 2015, 3, 486–496. [Google Scholar] [CrossRef]
- Snigur, D.; Chebotarev, A.; Dubovyiy, V.; Barbalat, D.; Bevziuk, K. Salicylic acid assisted cloud point extraction at room temperature: Application for preconcentration and spectrophotometric determination of molybdenum(VI). Microchem. J. 2018, 142, 273–278. [Google Scholar] [CrossRef]
- Agnihotri, R.; Singh, A.; Agnihotri, N. Extraction and Spectrophotometric Determination of Molybdenum(VI) using 3-hydroxy-2-[3-(4-methoxyphenyl)-1-phenyl-4-pyrazolyl]-4-oxo-4H-1-benzopyran as a Chelating Agent. J. Anal. Chem. 2019, 74, 81–86. [Google Scholar] [CrossRef]
- Kuliev, K.A.; Verdizade, N.A.; Aliev, S.G.; Abasquliyeva, U.B.; Efendieva, N.N. Analytical Application of Ion Associates of Molybdenum with Dithiolphenols and Aminophenols. J. Mater. Sci. Chem. Eng. 2019, 7, 1–18. [Google Scholar] [CrossRef] [Green Version]
- Klochkova, A.; Barbalat, D.; Chebotarev, A.; Snigur, D. Dispersive liquid–liquid semi-microextraction of molybdenum(VI) with 6,7-dihydroxy-2,4-diphenylbenzopyrylium chloride for its spectrophotometric determination. J. Iran. Chem. Soc. 2021, 18, 109–115. [Google Scholar] [CrossRef]
- Snigur, D.; Barbalat, D.; Chebotarev, A.; Synievyd, A.; Bevziuk, K. A rapid cloud point extraction of Molybdenum(VI) with 6,7-dihydroxy-2,4-diphenylbenzopyrylium perchlorate prior to its spectrophotometric determination. Chem. Pap. 2021, 75, 1823–1830. [Google Scholar] [CrossRef]
- Cornard, J.-P.; Rasmiwetti; Merlin, J.-C. Molecular structure and spectroscopic properties of 4-nitrocatechol at different pH: UV–visible, Raman, DFT and TD-DFT calculations. Chem. Phys. 2005, 309, 239–249. [Google Scholar] [CrossRef]
- Gavazov, K.B. Nitroderivatives of catechol: From synthesis to application. Acta Chim. Slov. 2012, 59, 1–17. [Google Scholar]
- Stojnova, K.T.; Lekova, V.D. Study on the Equilibria of Chelate Formation and the Ion-association of Anionic Chelate of Germanium(IV) with 4-Nitrocatechol and 2-(4-Iodophenyl)-3-(4-nitrophenyl)-5-phenyl-2H-tetrazolium Cation. Russ. J. Inorg. Chem. 2019, 64, 1235–1241. [Google Scholar] [CrossRef]
- Saravanska, A.D.; Racheva, P.V.; Divarova, V.V.; Toncheva, G.K.; Milcheva, N.P.; Delchev, V.B.; Gavazov, K.B. Extraction-Spectrophotometric and Theoretical Studies on a Ternary Complex Obtained from Vanadium(V) and 4-Nitrocatechol. Russ. J. Inorg. Chem. 2021, 66, 1880–1886. [Google Scholar] [CrossRef]
- Rowe, R.C.; Sheskey, P.; Quinn, M. (Eds.) Handbook of Pharmaceutical Excipients; Pharmaceutical Press: London, UK, 2009; pp. 56–58. [Google Scholar]
- Li, Y.; Xu, Z.; Yu, M.; Wang, Z.; Ma, W.; Dong, Z. Two Novel Methods for the Determination of Benzalkonium Chloride in Bandages by Resonance Light Scattering Technology. Tenside Surfact. Det. 2021, 58, 44–50. [Google Scholar] [CrossRef]
- Hristov, D.G.G.; Racheva, P.V.; Toncheva, G.K.; Gavazov, K.B. Extraction-Chromogenic System for Cobalt Based on 5-Methyl-4-(2-thiazolylazo) Resorcinol and Benzalkonium Chloride. Acta Chim. Slov. 2021, 68, 37–43. [Google Scholar] [CrossRef] [PubMed]
- Kustin, K.; Liu, S.-T. Kinetics and complex formation of molybdate with catechol. J. Am. Chem. Soc. 1973, 95, 2487–2491. [Google Scholar] [CrossRef]
- Natansohn, S.; Krugler, J.I.; Lester, J.E.; Chagnon, M.S.; Finocchiaro, R.S. Stability constants of complexes of molybdate and tungstate ions with o-hydroxy aromatic ligands. J. Phys. Chem. 1980, 84, 2972–2980. [Google Scholar] [CrossRef]
- Dimitrov, A.N.; Lekova, V.; Gavazov, K.B.; Boyanov, B.S. Investigation of the extraction equilibrium of ion-association complexes of molybdenum (VI) with some polyphenols and thiazolyl blue. Extraction-spectrophotometric determination of molybdenum. Cent. Eur. J. Chem. 2005, 3, 747–755. [Google Scholar] [CrossRef]
- Zhiming, Z.; Dongsten, M.; Cunxiao, Y. Mobile equilibrium method for determining composition and stability constant of coordination compounds of the form MmRn. J. Rare Earths 1997, 15, 216–219. [Google Scholar]
- Asmus, E. Eine neue Methode zur Ermittlung der Zusammensetzung schwacher Komplexe. Fresenius’ J. Anal. Chem. 1960, 178, 104–116. [Google Scholar] [CrossRef]
- Holme, A.; Langmyhr, F. A modified and a new straight-line method for determining the composition of weak complexes of the form AmBn. Anal. Chim. Acta 1966, 36, 383–391. [Google Scholar] [CrossRef]
- Harvey, A.E.; Manning, D.L. Spectrophotometric Methods of Establishing Empirical Formulas of Colored Complexes in Solution. J. Am. Chem. Soc. 1950, 72, 4488–4493. [Google Scholar] [CrossRef]
- Lekova, V.; Gavazov, K.B.; Dimitrov, A.N. Application of a ternary complex of tungsten(VI) with 4-nitrocatechol and thiazolyl blue for extraction-spectrophotometric determination of tungsten. Chem. Pap. 2006, 60, 283–287. [Google Scholar] [CrossRef]
- Kumar, A.; Dass, R.; Sharma, R.G. 3-Hydroxy-2-(2′-thienyl)-4H-chromen-4-one reagent for extractive spectrophotometric determination of molybdenum (V). Chem. Anal. 2005, 50, 625–630. [Google Scholar]
- Dimitrov, A.; Lekova, V.; Gavazov, K.; Boyanov, B.S. Ternary complex of molybdenum(VI) with 4-nitrocatechol and tetrazolium blue chloride and its application to extraction-spectrophotometric analysis of ferrous metallurgy products. J. Anal. Chem. 2007, 62, 122–125. [Google Scholar] [CrossRef]
- Shrivas, K.; Agrawal, K.; Harmukh, N. Trace level determination of molybdenum in environmental and biological samples using surfactant-mediated liquid–liquid extraction. J. Hazard. Mat. 2009, 161, 325–329. [Google Scholar] [CrossRef]
- Aswar, A.; Joshi, M. Extractive Spectrophotometric Determination of Molybdenum(VI) with 2-hydroxy-5-methylacetophenone-isonicotinoylhydrazone (HMAINH). Rev. Anal. Chem. 2010, 29, 69–80. [Google Scholar] [CrossRef]
- Dass, R.; Kapoor, J.K.; Gambhir, S. Extractive Spectrophotometric Method for Determination of Molybdenum in Steels and Environmental Samples. J. Chem. 2013, 2013, 420768. [Google Scholar] [CrossRef] [Green Version]
- Dass, R.; Kapoor, J.K.; Gambhir, S. Spectrophotometric determination of molybdenum using surfactant-mediated liquid--liquid extraction. Turk. J. Chem. 2014, 38, 328–337. [Google Scholar] [CrossRef]
- Zalov, A.Z.; Verdizade, N.V.; Hadjieva, A.B. Extraction and spectrophotometric determination of molybdenum with o-hydroxythiophenols and aromatic amines. Pak. J. Anal. Environ. Chem. 2015, 16, 16–23. [Google Scholar]
- Stojnova, K.; Racheva, P.; Divarova, V.; Yanev, P.; Lekova, V. Study on the Complex Formation and the Ion-Association of Anionic Chelate of Molybdenum(VI) with Bidentate Ligand and the Cation of 2,3,5-Triphenyl-2H-tetrazolium Chloride. Acta Chim. Slov. 2020, 67, 594–601. [Google Scholar] [CrossRef]
- Yerramilli, A.; Kavipurapu, C.S.; Manda, R.R.; Pillutha, C.M. Extractive spectrophotometric method for the determination of vanadium(V) in steels and titanium base alloy. Anal. Chem. 1986, 58, 1451–1453. [Google Scholar] [CrossRef]
- Stefanova, T.S.; Simitchiev, K.K.; Gavazov, K.B. Liquid–liquid extraction and cloud point extraction for spectrophotometric determination of vanadium using 4-(2-pyridylazo)resorcinol. Chem. Pap. 2015, 69, 495–503. [Google Scholar] [CrossRef]
- Frisch, M.J.; Trucks, G.W.; Schlegel, H.B.; Scuseria, G.E.; Robb, M.A.; Cheeseman, J.R.; Montgomery, J.A., Jr.; Vreven, T.; Kudin, K.N.; Burant, J.C. Gaussian 03, Revision C. 02, Gaussian, Inc., Wallingford CT; d) Becke, AD (1993). J. Chem. Phys. 2004, 98, 5648–5652. [Google Scholar]
- ChemCraft. Available online: http://www.chemcraftprog.com (accessed on 8 February 2022).


| Parameter | Optimization Range | Optimal Value | Figure |
|---|---|---|---|
| Wavelength, nm | UV/Vis | 439 | Figure 1 |
| Concentration of 4NC, mol dm−3 | (0.15–12.5) × 10–4 | 7.5 × 10⁻⁴ | Figure 2 |
| Concentration of BZC, mol dm−3 | (0.12–2.88) × 10−4 | 1.9 × 10⁻⁴ | Figure 2 |
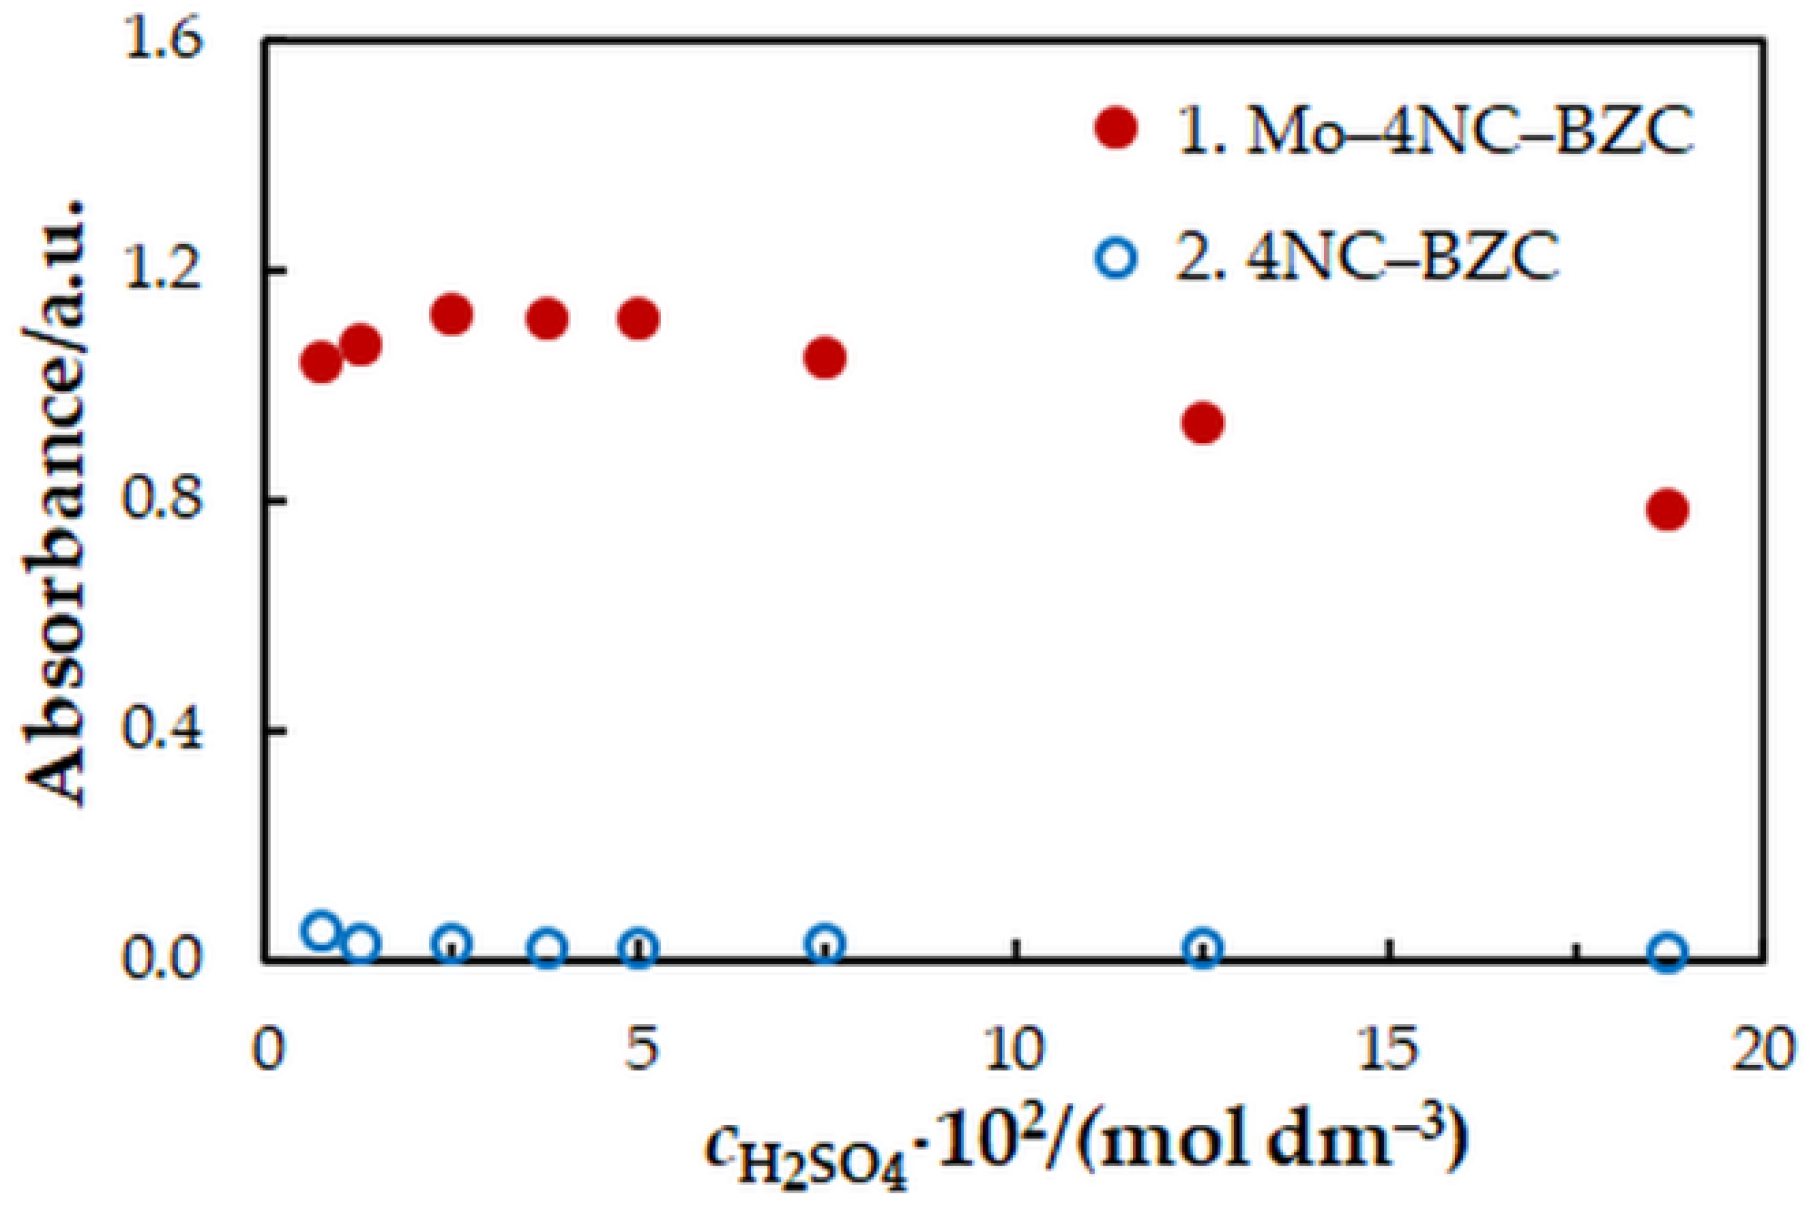
| Concentration of H2SO4, mol dm−3 | (0.25–18.75) × 10−2 | 3.75 × 10⁻² | Figure 3 |
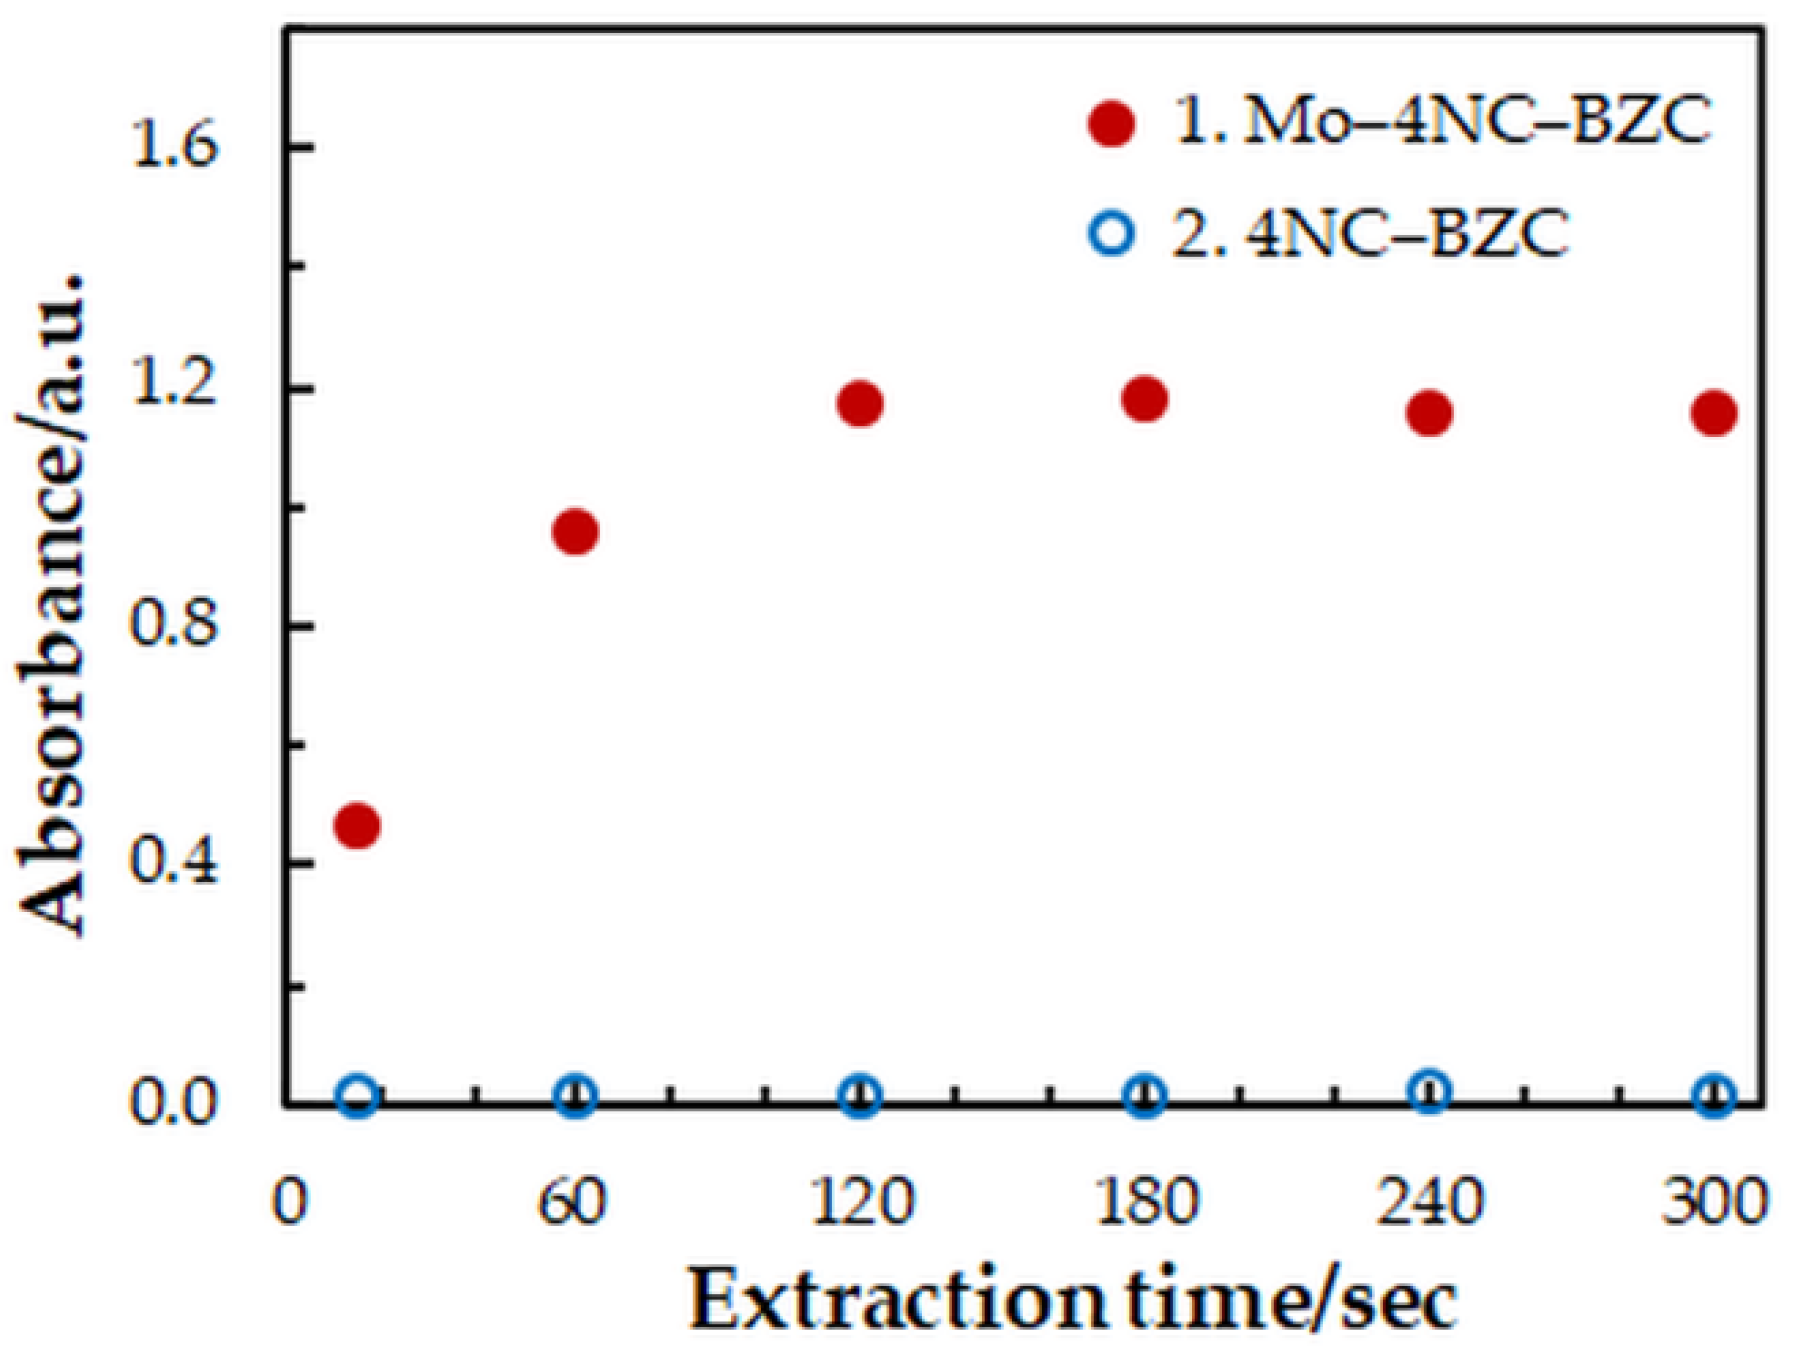
| Extraction time, s | 15–300 | 180 | Figure 4 |
| Characteristic | Value |
|---|---|
| Extraction constant (logK) | 9.1 ± 0.4 a 9.07 ± 0.08 b 9.11 ± 0.08 c |
| Distribution ratio (logD) | 1.22 ± 0.03 (n = 4) |
| Fraction extracted (E/%) | 94.3 ± 0.4 (n = 4) |
| Foreign Ion (FI) Added | Added Salt Formula | Amount of FI Added/mg | FI: Mo Mass Ratio | Amount of Mo Found/μg | E% |
|---|---|---|---|---|---|
| Al(III) | Al2(SO4)3 18H2O | 3.55 | 500 | 7.2 | 102 |
| Ca(II) a | CaSO4 | 3.55 | 500 | 7.0 | 98.4 |
| Cd(II) | CdCl2 | 1.42 | 200 | 7.0 | 98.0 |
| Citrate a | Na3C6H5O7 | 7.1 | 1000 | 7.1 | 100 |
| Cl− a | NaCl | 7.1 | 1000 | 7.1 | 100 |
| Co(II) | CoSO4 7H2O | 0.142 | 20 | 7.1 | 99.8 |
| Cr(III) b | Cr2(SO4)3 | 1.78 | 250 | 7.1 | 99.8 |
| Cr(VI) | K2CrO4 | 0.071 | 1 | 7.1 | 99.3 |
| Cu(II) | CuSO4 5H2O | 1.42 | 200 | 6.9 | 97.0 |
| EDTA | Na2EDTA | 35.5 | 5300 | 7.1 | 99.3 |
| F− | NaF | 3.55 | 500 | 7.4 | 104 |
| Fe(III) b | Fe2(SO4)3 | 2.84 | 400 | 7.1 | 99.8 |
| HPO42 a | Na2HPO4 12H2O | 7.1 | 1000 | 6.9 | 96.6 |
| K(I) a | K2SO4 | 7.1 | 1000 | 7.1 | 100 |
| Li(I) a | Li2SO4 H2O | 7.1 | 1000 | 7.1 | 100 |
| Mg(II) a | MgSO4 7H2O | 7.1 | 1000 | 7.2 | 101 |
| Mn(II) b | MnSO4 H2O | 0.355 | 50 | 7.2 | 101 |
| Ni(II) b | NiSO4 7H2O | 1.42 | 200 | 7.4 | 104 |
| NO3− | NaNO3 | 0.036 0.71 | 5 100 | 7.1 5.0 | 99.0 70.9 |
| Re(VII) | NH4ReO4 | 3.55 | 500 | 7.0 | 99.3 |
| Tartrate | K,NaC4H4O6 | 0.71 | 100 | 7.1 | 100 |
| V(V) b | NH4VO3 | 0.036 | 5 | 7.2 | 101.5 |
| W(VI) | Na2WO4 2H2O | 0.007 | 1 | 9.0 | 126 |
| Zn(II) a | ZnSO4 7H2O | 3.55 | 500 | 7.0 | 98.5 |
| Sample | Molybdenum Found a,b/% | |||
|---|---|---|---|---|
| # | Description | Mo Content/% | Other Components/% | |
| SM1 | 1.5% manganese-molybdenum steel (synthetic mixture) | 0.25 | 1.6 (Mn), 98.15 (Fe) | 0.247 ± 0.004 |
| SM2 | Austempered ductile iron (ADI) with added nickel and molybdenum | 0.37 | 1.5 (Ni), 98.13 (Fe) | 0.369 ± 0.003 |
| SM3 | Low nickel-free stainless steel (synthetic mixture) | 2.5 | 17 (Cr), 12 (Ni), 68.5 (Fe) | 2.44 ± 0.06 |
| SM4 | Acid-resistant austenitic stainless steel (synthetic mixture) | 2.5 | 20 (Cr), 34 (Ni), 3.4 (Cu), 40.1 (Fe) | 2.50 ± 0.04 |
| RSS1 | Referent standard steel c | 0.96 | 17.7 (W), 4.21 (Cr), 1.58 (V), 0.35 (Mn), 4.71 (Co),0.081 (C), 0.18 (Si), and the balance Fe | 0.955 ± 0.009 |
| RSS2 | Referent standard steel c | 0 d | 1.57 (W), 1.04 (V), 17.55 (Cr), 9.61 (Ni), 0.99 (Nb), 0.13 (Ta), and the balance Fe | 0.95 ± 0.01 |
| Reagent(s) | Organic Solvent (OS) | Volume of OS/cm3 | Acidity | Sample | Linear Range/ ng cm−3 | LOD/ ng cm−3 | λmax, nm | 10−4ε/ dm3 mol−1 cm−1 | Ref. |
|---|---|---|---|---|---|---|---|---|---|
| HTC | Chloroform | 10 | 1 mol dm−3 H2SO4 | Synthetic samples, steels, and reverberatory flue dust | 270–2400 | – | 424 | 3.6 | [39] |
| 4NC + BTC | 1,2-Dichloroethane | 5 | pH 1.8–4.0 | Steels and ferromolybdenum | 200–6700 | – | 445 | 2.38 | [40] |
| KSCN + MTOAC+ PBITU | 1-Pentanol | 5 | 3.0–5.0 mol dm−3 HCl | Water, soil, and root nodule | 20–1000 | 5 | 470 | 7.6 | [41] |
| HMAINH | MIBK | 10 | (1.5–1.8) × 10−2 mol dm−3 HCl | Alloys | 3000–16,000 | – | 410 | 0.5643 | [42] |
| CHHB | Toluene | 10 | 1 mol dm−3 H2SO4 | Steel, water, reverberatory flue dust, and industrial effluent | Up to 2310 | – | 404 | 5.62 | [43] |
| KSCN + CTAB | 1,2-Dichloroethane | 10 | 1.25 mol dm−3 H2SO4 | Water, steel, reverberatory flue dust, soil, and soybean nodules | 100–4200 | 2.39 | 460 | 4.01 | [44] |
| HTPs + aniline | Chloroform | 5 | pH 5.3–5.8 | Soil and pea | 40–4300 | 12–15 | 530–535 | 3.5–3.7 | [45] |
| DPs + APs | Chloroform | 5 | pH 4.1–5.9 | Soils, plants, and water | 300–22,000 | 9–10 | 516–534 | 4.16–5.35 | [21] |
| HMPPB | Carbon tetrachloride | 10 | (2–6) × 10−2 mol dm−3 H2SO4 | Synthetic mixtures, flue dust, and water | 380–1400 | 100 | 420 | 5.085 | [20] |
| DNC + TTC | Chloroform | 10 | (0.9–7.2) × 10−1 mol dm−3 H2SO4 | – | 670–6720 | 190 | 410 | 2.16 | [46] |
| 4NC + BZC | Chloroform | 5 | 3.75 × 10⁻² mol dm−3 H2SO4 | Synthetic mixtures, steels, and water | 18.6–3100 | 5.6 | 439 | 5.5 | This work |
Publisher’s Note: MDPI stays neutral with regard to jurisdictional claims in published maps and institutional affiliations. |
© 2022 by the authors. Licensee MDPI, Basel, Switzerland. This article is an open access article distributed under the terms and conditions of the Creative Commons Attribution (CC BY) license (https://creativecommons.org/licenses/by/4.0/).
Share and Cite
Divarova, V.V.; Saravanska, A.; Toncheva, G.; Milcheva, N.; Delchev, V.B.; Gavazov, K. Spectrophotometric Determination of Molybdenum(VI) as a Ternary Complex with 4-Nitrocatechol and Benzalkonium Chloride. Molecules 2022, 27, 1217. https://doi.org/10.3390/molecules27041217
Divarova VV, Saravanska A, Toncheva G, Milcheva N, Delchev VB, Gavazov K. Spectrophotometric Determination of Molybdenum(VI) as a Ternary Complex with 4-Nitrocatechol and Benzalkonium Chloride. Molecules. 2022; 27(4):1217. https://doi.org/10.3390/molecules27041217
Chicago/Turabian StyleDivarova, Vidka V., Antoaneta Saravanska, Galya Toncheva, Nikolina Milcheva, Vassil B. Delchev, and Kiril Gavazov. 2022. "Spectrophotometric Determination of Molybdenum(VI) as a Ternary Complex with 4-Nitrocatechol and Benzalkonium Chloride" Molecules 27, no. 4: 1217. https://doi.org/10.3390/molecules27041217