
Regional Differentiations of the Potential of Cultural Ecosystem Services in Relation to Natural Capital—A Case Study in Selected Regions of the Slovak Republic


Abstract
:1. Introduction
2. Materials and Methods
2.1. Theoretical and Methodological Baselines
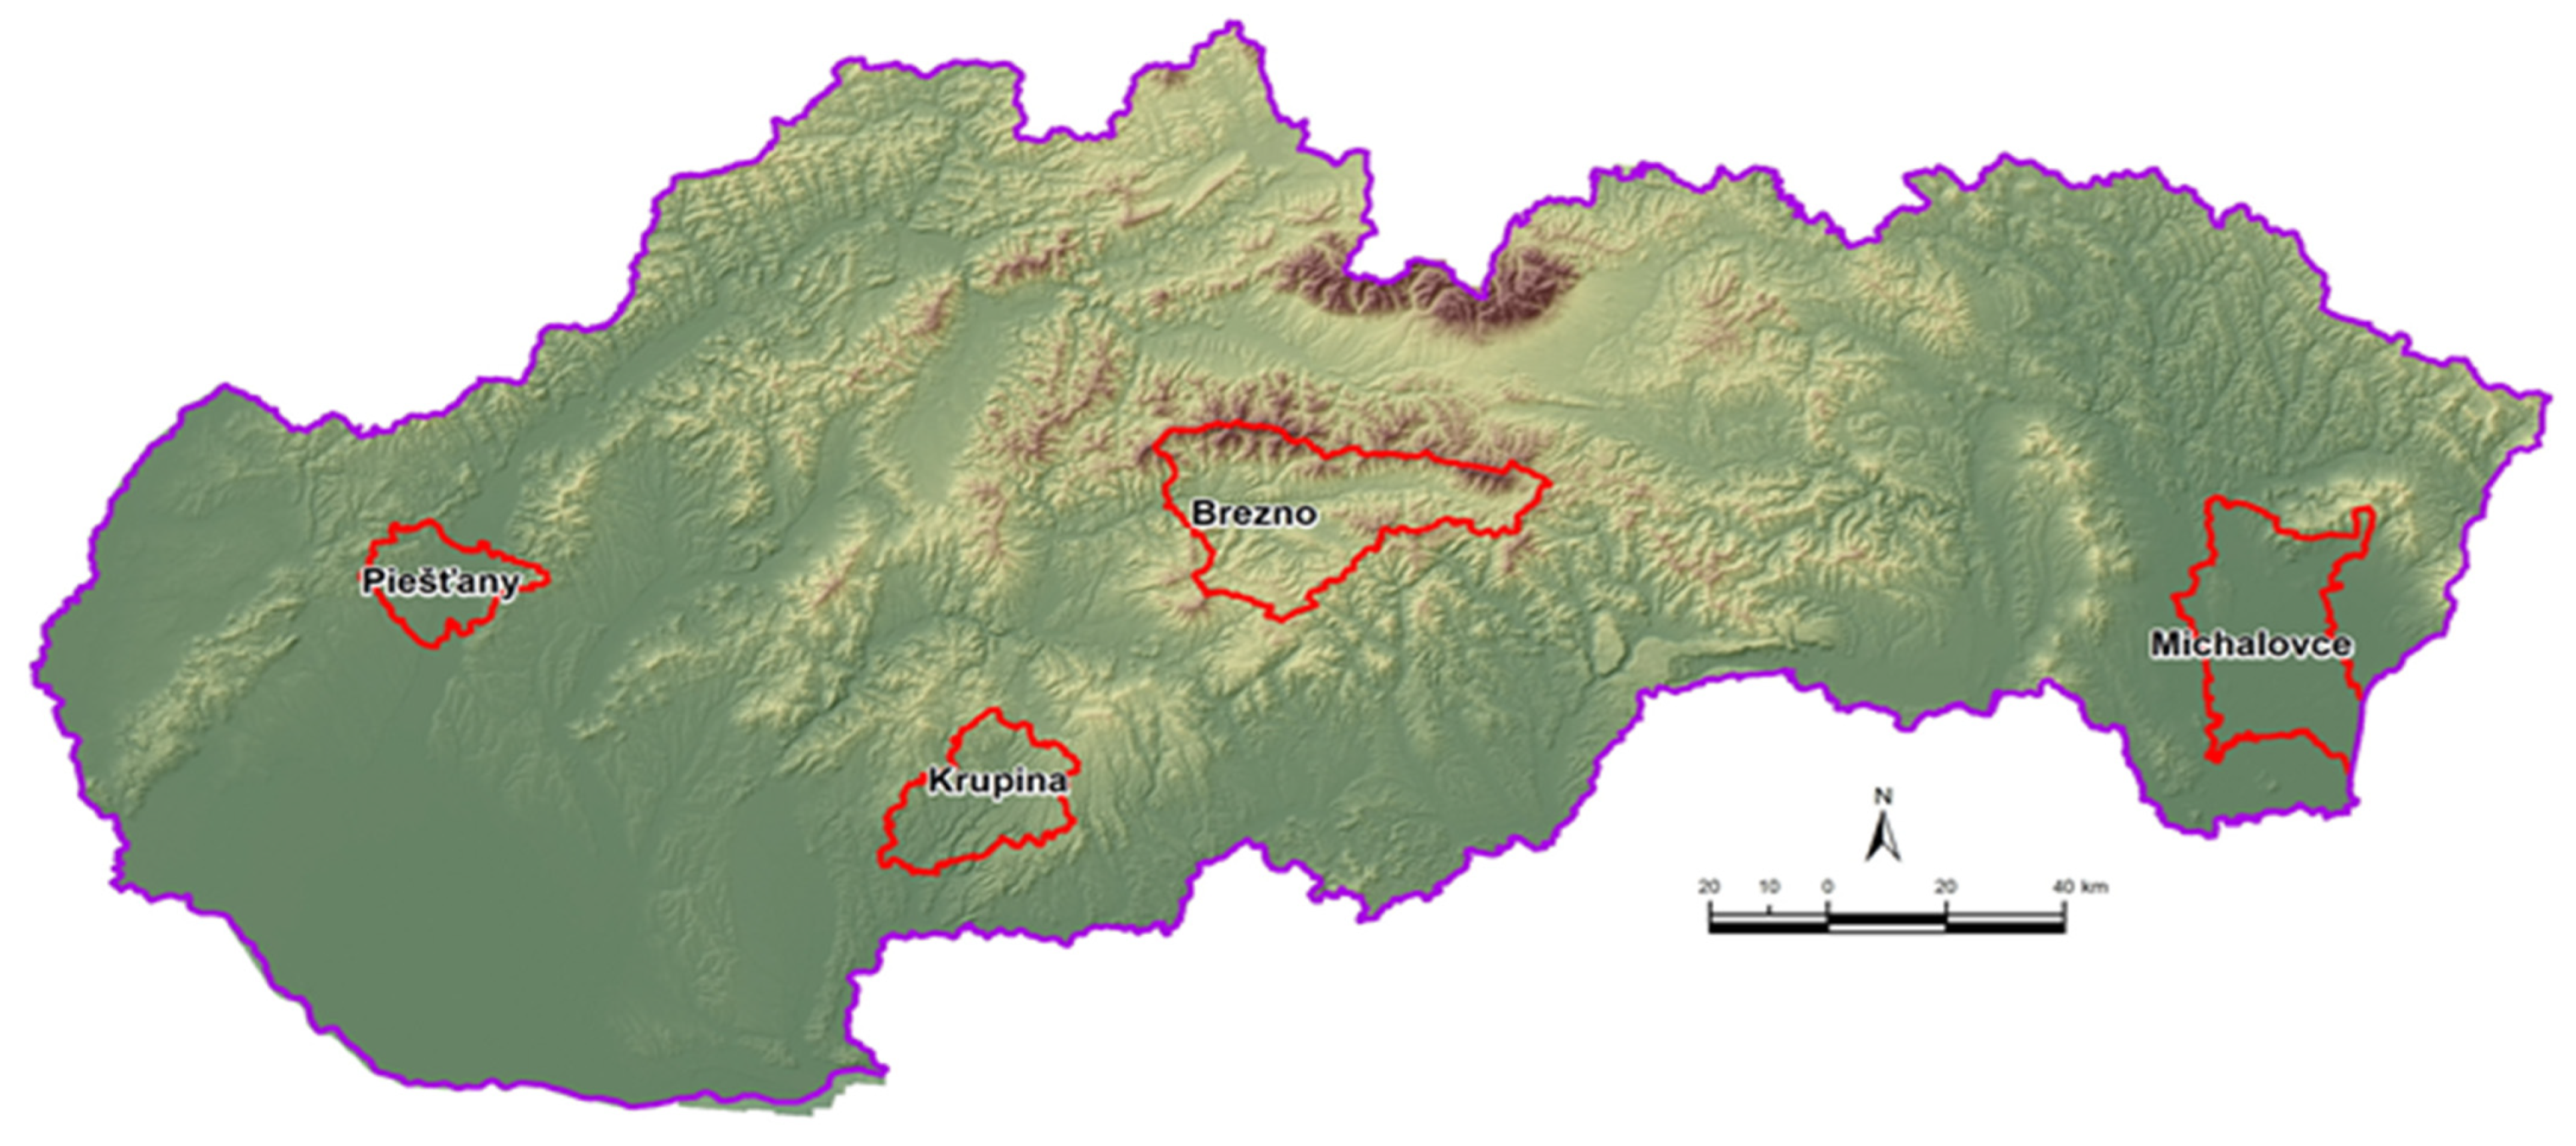
2.2. Study Area
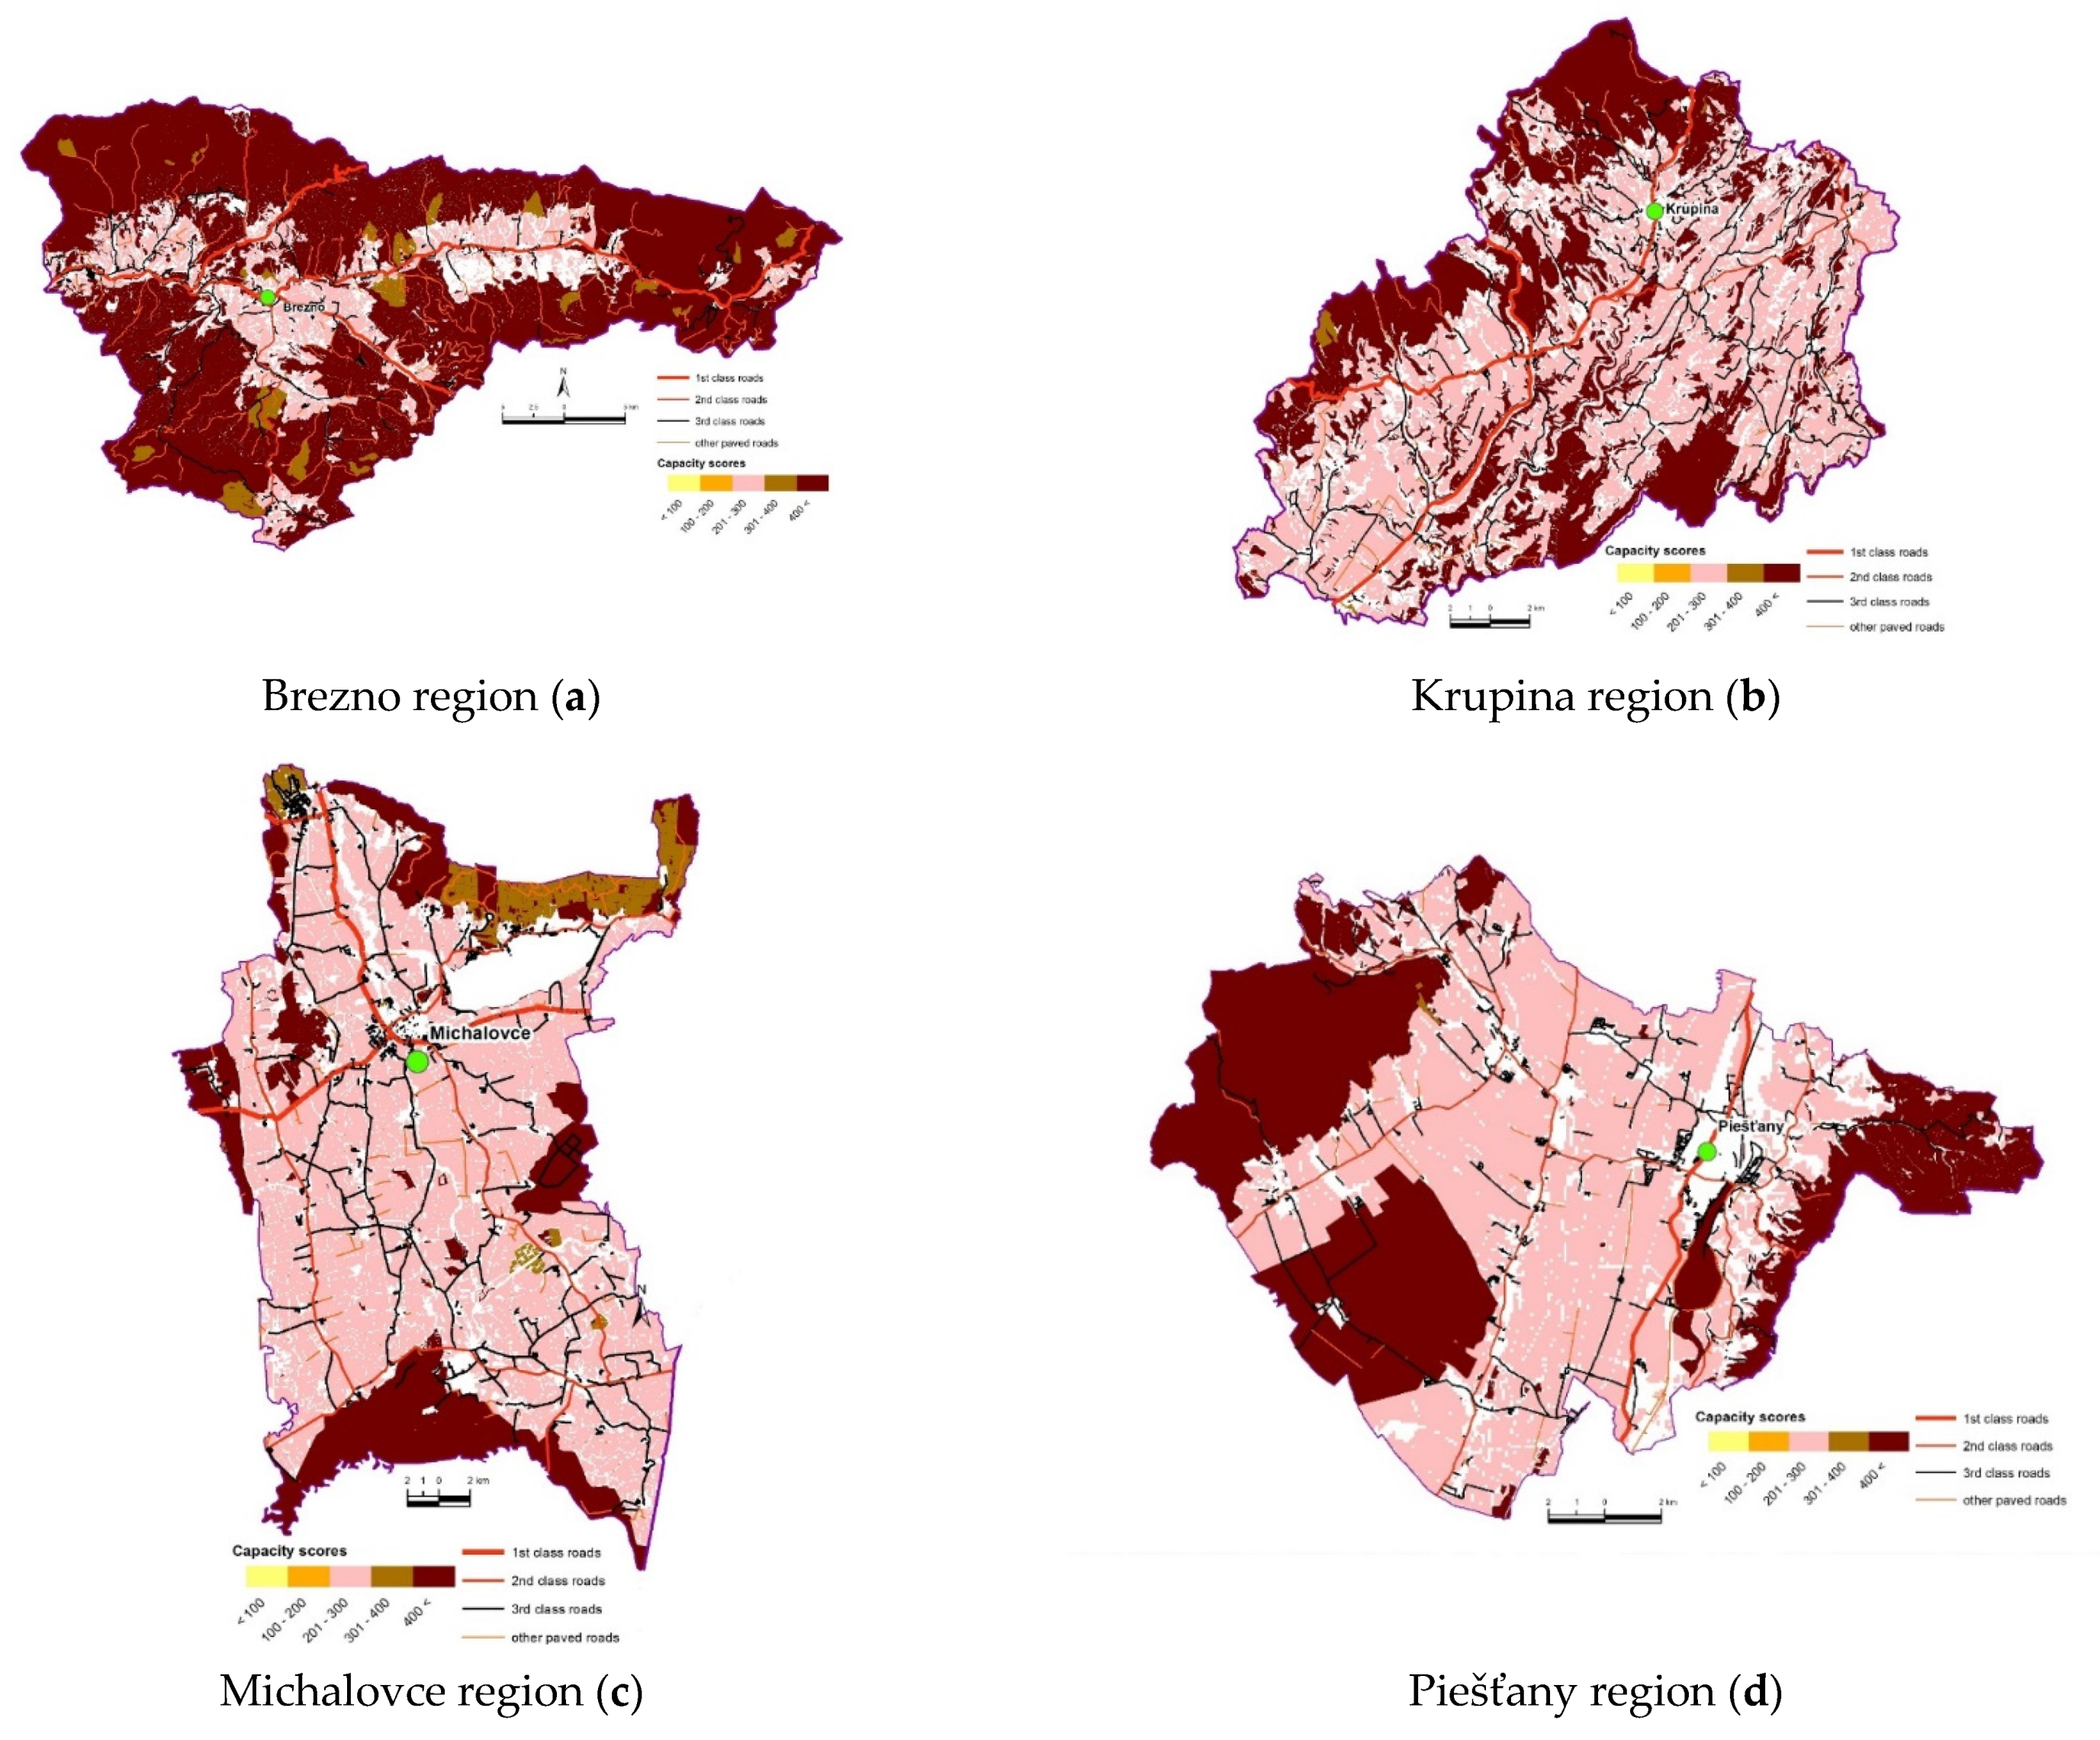
Geospatial Datasets Used for Specifying the Area Distribution of Ecosystems at the Regional Level
2.3. Cultural Ecosystem Services Assessment
2.3.1. Cultural Ecosystem Services Non-Monetary Assessment
2.3.2. Cultural Ecosystem Services Monetary Assessment
2.4. Statistical Model Regions Comparison
3. Results and Discussion
4. Conclusions
Author Contributions
Funding
Informed Consent Statement
Data Availability Statement
Acknowledgments
Conflicts of Interest
References
- Costanza, R.; d’Arge, R.; de Groot, R.; Farber, S.; Grasso, M.; Hannon, B.; Limburg, K.; Naeem, S.; O’Neill, R.V.; Paruelo, J.; et al. The Value of the World’s Ecosystem Services and Natural Capital. Ecol. Econ. 1998, 25, 3–15. [Google Scholar] [CrossRef]
- Millennium Ecosystem Assessment Board. Ecosystems and Human Well-Being: Our Human Planet; Summary for Decision Makers, The Millennium Ecosystem Assessment Series; Island Press: Washington, DC, USA, 2005; Volume 5. [Google Scholar]
- Lankia, T.; Kopperoinen, L.; Pouta, E.; Neuvonen, M. Valuing Recreational Ecosystem Service Flow in Finland. J. Outdoor Recreat. Tour. 2015, 10, 14–28. [Google Scholar] [CrossRef]
- Kanianska, R.; Jadudová, J.; Makovníková, J.; Kizeková, M.; Tomaškin, J. Ecosystem Services; Belianum: Banská Bystrica, Slovakia, 2016; ISBN 978-80-557-1129-4. (In Slovak) [Google Scholar]
- Beaumont, N.J.; Mongruel, R.; Hooper, T. Practical Application of the Ecosystem Service Approach (ESA): Lessons Learned and Recommendations for the Future. Int. J. Biodivers. Sci. Ecosyst. Serv. Manag. 2017, 13, 68–78. [Google Scholar] [CrossRef] [Green Version]
- Nahuelhual, L.; Carmona, A.; Lozada, P.; Jaramillo, A.; Aguayo, M. Mapping Recreation and Ecotourism as a Cultural Ecosystem Service: An Application at the Local Level in Southern Chile. Appl. Geogr. 2013, 40, 71–82. [Google Scholar] [CrossRef]
- Kemp, D.R.; Michalk, D.L. Towards Sustainable Grassland and Livestock Management. J. Agric. Sci. 2007, 145, 543–564. [Google Scholar] [CrossRef] [Green Version]
- Vandewalle, M.; Sykes, M.T.; Harrison, P.A.; Luck, G.W.; Berry, P.; Bugter, R.; Dawson, T.P.; Feld, C.K.; Harrington, R.; Haslett, J.R.; et al. Review Paper on Concepts of Dynamic Ecosystems and Their Services. The Rubicode Project Rationalising Biodiversity Conservation in Dynamic Ecosystems. 2009. Available online: http://www.rubicode.net/rubicode/RUBICODE_Review_on_Drivers.pdf (accessed on 9 September 2020).
- Daniel, T.C.; Muhar, A.; Arnberger, A.; Aznar, O.; Boyd, J.W.; Chan, K.M.; Costanza, R.; Elmqvist, T.; Flint, C.G.; Gobster, P.H.; et al. Contributions of Cultural Services to the Ecosystem Services Agenda. Proc. Natl. Acad. Sci. USA 2012, 109, 8812–8819. [Google Scholar] [CrossRef] [Green Version]
- Palkechová, L.; Kozáková, J. Economics of agrotourism establishments in selected agribusiness units of the Slovak Republic. Econ. Agric. 2015, 15, 69–85. (In Slovak) [Google Scholar]
- Pueyo-Ros, J. The Role of Tourism in the Ecosystem Services Framework. Land 2018, 7, 111. [Google Scholar] [CrossRef] [Green Version]
- Cooper, N.; Brady, E.; Steen, H.; Bryce, R. Aesthetic and Spiritual Values of Ecosystems: Recognizing the Ontological and Axiological Plurality of Cultural Ecosystem ‘Services’. Ecosyst. Serv. 2016, 21, 218–229. [Google Scholar] [CrossRef] [Green Version]
- Figueroa-Alfaro, R.W.; Tang, Z. Evaluating the Aesthetic Value of Cultural Ecosystem Services by Mapping Geo-Tagged Photographs from Social Media Data on Panoramio and Flickr. J. Environ. Plan. Manag. 2016, 60, 266–281. [Google Scholar] [CrossRef]
- Fish, R.; Church, A.; Winter, M. Conceptualising Cultural Ecosystem Services: A Novel Framework for Research and Critical Engagement. Ecosyst. Serv. 2016, 21, 208–217. [Google Scholar] [CrossRef] [Green Version]
- Černecký, J.; Gajdoš, P.; Ďuricová, V.; Špulerová, J.; Černecká, L.; Švajda, J.; Andráš, P.; Ulrych, L.; Rybanič, R.; Považan, R. The Value of Ecosystems and Their Services in Slovakia; ŠOP SR: Banská Bystrica, Slovakia, 2020; p. 166. ISBN 978-80-8184-078-4. (In Slovak)
- Hølleland, H.; Skrede, J.; Holmgaard, S.B. Cultural Heritage and Ecosystem Services: A Literature Review. Conserv. Manag. Archaeol. Sites 2017, 19, 210–237. [Google Scholar] [CrossRef]
- Sánchez, L.M.; Tejedor Cabrera, A.; Linares Gómez del Pulgar, M. The Potential Role of Cultural Ecosystem Services in Heritage Research through a Set of Indicators. Ecol. Indic. 2020, 117, 106670. [Google Scholar] [CrossRef]
- Tengberg, A.; Fredholm, S.; Eliasson, I.; Knez, I.; Saltzman, K.; Wetterberg, O. Cultural Ecosystem Services Provided by Landscapes: Assessment of Heritage Values and Identity. Ecosyst. Serv. 2012, 2, 14–26. [Google Scholar] [CrossRef]
- Vlami, V.; Kokkoris, I.P.; Zogaris, S.; Kehayias, G.; Dimopoulos, P. Cultural Ecosystem Services in the Natura 2000 Network: Introducing Proxy Indicators and Conflict Risk in Greece. Land 2021, 10, 4. [Google Scholar] [CrossRef]
- Guerry, A.D.; Polasky, S.; Lubchenco, J.; Chaplin-Kramer, R.; Daily, G.C.; Griffin, R.; Ruckelshaus, M.; Bateman, I.J.; Duraiappah, A.; Elmqvist, T.; et al. Natural Capital and Ecosystem Services Informing Decisions: From Promise to Practice. Proc. Natl. Acad. Sci. USA 2015, 112, 7348–7355. [Google Scholar] [CrossRef] [Green Version]
- Torralba, M.; Lovrić, M.; Roux, J.L.; Budniok, M.A.; Mulier, A.S.; Winkel, G.; Plieninger, T. Examining the relevance of cultural ecosystem services in forest management in Europe. Ecol. Soc. 2020, 25, 3. [Google Scholar] [CrossRef]
- Bouwma, I.; Schleyer, C.; Primmer, E.; Winkler, K.J.; Berry, P.; Young, J.; Carmen, E.; Špulerová, J.; Bezák, P.; Preda, E.; et al. Adoption of the ecosystem services concept in EU policies. Ecosyst. Serv. 2018, 29, 213–222. [Google Scholar] [CrossRef]
- Hönigová, I.; Vačkář, D.; Lorencová, E.; Melichar, J.; Götzl, M.; Sonderegger, G.; Oušková, V.; Hošek, M.; Chobot, K. Survey on Grassland Ecosystem Services: Report to the EEA—European Topic Centre on Biological Diversity; Nature Conservation Agency of the Czech Republic: Prague, Czech Republic, 2012; pp. 4–78. ISBN 978-80-87457-25-2. [Google Scholar]
- Schröter, M.; Bonn, A.; Klotz, S.; Seppelt, R.; Baessler, C. (Eds.) Atlas of Ecosystem Services Drivers, Risks, and Societal Responses; Springer International Publishing: Cham, Switzerland, 2019; ISBN 978-3-319-96228-3. [Google Scholar]
- De Groot, R.S.; Fisher, B.; Christie, M.; Aronson, J.; Braat, L.; Haines-Young, R.; Gowdy, J.; Maltby, E.; Neuville, A.; Polasky, S.; et al. Integrating the ecological and economic dimensions in biodiversity and ecosystem service valuation. In The Economics of Ecosystems and Biodiversity (TEEB): Ecological and Economic Foundations; Kumar, P., Ed.; Earthscan from Routledge: London, UK, 2010; pp. 9–40. [Google Scholar]
- Farber, S.; Costanza, R.; Childers, D.L.; Erickson, J.; Gross, K.; Grove, M.; Hopkinson, C.S.; Kahn, J.; Pincetl, S.; Troy, A.; et al. Linking ecology and economics for ecosystem management. BioScience 2006, 56, 121–133. [Google Scholar] [CrossRef] [Green Version]
- Burkhard, B.; Kandziora, M.; Hou, Y.; Müller, F. Ecosystem Service Potentials, Flows and Demands-Concepts for Spatial Localisation, Indication and Quantification. Landsc. Online 2014, 34, 1–32. [Google Scholar] [CrossRef]
- Zulian, G.; Maes, J.; Paracchini, M. Linking Land Cover Data and Crop Yields for Mapping and Assessment of Pollination Services in Europe. Land 2013, 2, 472–492. [Google Scholar] [CrossRef] [Green Version]
- Zulian, G.; Stange, E.; Woods, H.; Carvalho, L.; Dick, J.; Andrews, C.; Baró, F.; Vizcaino, P.; Barton, D.N.; Nowel, M.; et al. Practical Application of Spatial Ecosystem Service Models to Aid Decision Support. Ecosyst. Serv. 2018, 29, 465–480. [Google Scholar] [CrossRef] [PubMed]
- Müller, F.; Bicking, S.; Ahrendt, K.; Kinh Bac, D.; Blindow, I.; Fürst, C.; Haase, P.; Kruse, M.; Kruse, T.; Ma, L.; et al. Assessing Ecosystem Service Potentials to Evaluate Terrestrial, Coastal and Marine Ecosystem Types in Northern Germany—An Expert-Based Matrix Approach. Ecol. Indic. 2020, 112, 106116. [Google Scholar] [CrossRef]
- Perennes, M.; Campagne, C.S.; Müller, F.; Roche, P.; Burkhard, B. Refining the Tiered Approach for Mapping and Assessing Ecosystem Services at the Local Scale: A Case Study in a Rural Landscape in Northern Germany. Land 2020, 9, 348. [Google Scholar] [CrossRef]
- Directorate-General for Environment (European Commission). EU Biodiversity Strategy for 2030: Bringing Nature Back into Our Lives. 2021. Available online: https://op.europa.eu/en/publication-detail/-/publication/31e4609f-b91e-11eb-8aca-01aa75ed71a1 (accessed on 9 August 2021).
- Burkhard, B.; Maes, J. Mapping Ecosystem Services; Pensoft Publishers: Sofia, Bulgaria, 2017. [Google Scholar] [CrossRef]
- Campagne, C.S.; Roche, P.; Müller, F.; Burkhard, B. Ten Years of Ecosystem Services Matrix: Review of a (r)Evolution. One Ecosyst. 2020, 5, e51103. [Google Scholar] [CrossRef]
- Burkhard, B.; Kroll, F.; Nedkov, S.; Müller, F. Mapping Ecosystem Service Supply, Demand and Budgets. Ecol. Indic. 2012, 21, 17–29. [Google Scholar] [CrossRef]
- Maes, J. Mapping and Assessment of Ecosystems and Their Services: An Analytical Framework for Ecosystem Assessments under Action 5 of the EU Biodiversity Strategy to 2020: Discussion Paper—Final, April 2013. Available online: https://op.europa.eu/en/publication-detail/-/publication/c09a570b-e189-4a92-82ff-9897ab49a6b1/language-en (accessed on 10 September 2020).
- Frélichová, J.; Vačkář, D.; Pártl, A.; Loučková, B.; Harmáčková, Z.V.; Lorencová, E. Integrated Assessment of Ecosystem Services in the Czech Republic. Ecosyst. Serv. 2014, 8, 110–117. [Google Scholar] [CrossRef]
- Spyra, M. Ecosystem Services and Border Regions. Case Study from Czech–Polish Borderland. TeMA J. Land Use Mobil. Environ. 2014, 921–932. [Google Scholar] [CrossRef]
- Crouzat, E.; Zawada, M.; Grigulis, K.; Lavorel, S. Design and Implementation of a National Ecosystem Assessment—Insights from the French Mountain Systems’ Experience. Ecosyst. People 2019, 15, 288–302. [Google Scholar] [CrossRef] [Green Version]
- Bratman, G.N.; Anderson, C.B.; Berman, M.G.; Cochran, B.; de Vries, S.; Flanders, J.; Folke, C.; Frumkin, H.; Gross, J.J.; Hartig, T.; et al. Nature and Mental Health: An Ecosystem Service Perspective. Sci. Adv. 2019, 5, 6510. [Google Scholar] [CrossRef] [Green Version]
- Mederly, P.; Černecký, J. Katalóg ekosystémových služieb Slovenska. In Catalogue of Ecosystem Services in Slovakia; State Nature Conservancy of Slovak Republic: Banská Bystrica, Slovakia, 2019; ISBN 978-80-8184-067-8. (In Slovak) [Google Scholar]
- Mederly, P.; Černecký, J.; Špulerová, J.; Izakovičová, Z.; Ďuricová, V.; Považan, R.; Švajda, J.; Močko, M.; Jančovič, M.; Gusejnov, S.; et al. National Ecosystem Services Assessment in Slovakia—Meeting Old Liabilities and Introducing New Methods. One Ecosyst. 2020, 5, 53677. [Google Scholar] [CrossRef]
- Reid, W.V.; Mooney, H.A.; Cropper, A.; Capistrano, D.; Carpenter, S.R.; Chopra, K.; Dasgupta, P.; Dietz, T.; Duraiappah, A.K.; Hassan, R.; et al. Millennium Ecosystem Assessment Synthesis Report; Island Press: Washington, DC, USA, 2005. [Google Scholar]
- Tomaškin, J.; Krišková, Z. Natural and Cultural Heritage in the Country; Matej Bel University Publishing House—Belianum: Banská Bystrica, Slovakia, 2008; ISBN 978-80-8083-687-0. (In Slovak) [Google Scholar]
- Parente, G.; Bovolenta, S. The role of grassland in rural tourism and recreation in Europe. In Grassland—A European Resource? Proceedings of the 24th General Meeting of the European Grassland Federation, Lublin, Poland, 3–7 June 2012; Garmond Oficyna Wydawnicza: Poznań, Poland, 2012; pp. 733–743. ISBN 9788389250773. [Google Scholar]
- Page, J.S.; Dowling, R.K. Ecotourism; Themes in Tourism; Prentice Hall, Pearson Education: Harlow, UK, 2002; ISBN 9780582356580. [Google Scholar]
- Ministry of Economy of the Slovak Republic. Sectoral Operational Program Industry and Services. Bratislava. 2009. Available online: https://www.economy.gov.sk/eu-a-fondy/eurofondy/po-2004-2006-a-2007-2013/sektorovy-operacny-program-priemysel-a-sluzby-sop-ps/sektorovy-operacny-program-priemysel-a-sluzby-zakladne-dokumenty/operacny-program (accessed on 19 August 2021). (In Slovak)
- Rigová, Z.; Flaška, F.; Kološta, S. Regional differencies in Slovak local governments property tax revenues by NUTS III and LAU1 regions. In Interpolis ‘20; Belianum: Banská Bystrica, Slovakia, 2020; pp. 389–399. ISBN 978-80-557-1804-0. (In Slovak) [Google Scholar]
- Huber, L.; Schirpke, U.; Marsoner, T.; Tasser, E.; Leitinger, G. Does Socioeconomic Diversification Enhance Multifunctionality of Mountain Landscapes? Ecosyst. Serv. 2020, 44, 101122. [Google Scholar] [CrossRef]
- Schirpke, U.; Scolozzi, R.; Dean, G.; Haller, A.; Jäger, H.; Kister, J.; Kovács, B.; Sarmiento, F.O.; Sattler, B.; Schleyer, C. Cultural Ecosystem Services in Mountain Regions: Conceptualising Conflicts among Users and Limitations of Use. Ecosyst. Serv. 2020, 46, 101210. [Google Scholar] [CrossRef]
- Kološta, S. Formation and Shapes of Learning Regions; Belianum: Banská Bystrica, Slovakia, 2019; ISBN 978-80-557-1537-7. (In Slovak) [Google Scholar]
- Makovníková, J.; Pálka, B.; Kološta, S.; Orságová, K. Application of Matrix Approach for Evaluation and Assessment the Potential of Recreational Ecosystem Service in Model Regions in Slovakia. Open J. Ecol. 2021, 11, 437–450. [Google Scholar] [CrossRef]
- Bidegain, Í.; López-Santiago, C.A.; González, J.A.; Martínez-Sastre, R.; Ravera, F.; Cerda, C. Social Valuation of Mediterranean Cultural Landscapes: Exploring Landscape Preferences and Ecosystem Services Perceptions through a Visual Approach. Land 2020, 9, 390. [Google Scholar] [CrossRef]
- Primmer, E.; Varumo, L.; Krause, T.; Orsi, F.; Geneletti, D.; Brogaard, S.; Aukes, E.; Ciolli, M.; Grossmann, C.; Hernández-Morcillo, M.; et al. Mapping Europe’s institutional landscape for forest ecosystem service provision, innovations and governance. Ecosyst. Serv. 2021, 47, 101225. [Google Scholar] [CrossRef]
- Bateman, I.J.; Mace, G.M. The Natural Capital Framework for Sustainably Efficient and Equitable Decision Making. Nat. Sustain. 2020, 3, 776–783. [Google Scholar] [CrossRef]
- Maczka, K.; Chmielewski, P.; Jeran, A.; Matczak, P.; Van Riper, C.J. The ecosystem services concept as a tool for public participation in management of Poland’s Natura 2000 network. Ecosyst. Serv. 2019, 35, 173–183. [Google Scholar] [CrossRef]
- Hirons, M.; Comberti, C.; Dunford, R. Valuing Cultural Ecosystem Services. Annu. Rev. Environ. Resour. 2016, 41, 545–574. [Google Scholar] [CrossRef]
- Plieninger, T.; Bieling, C.; Ohnesorge, B.; Schaich, H.; Schleyer, C.; Wolff, F. Exploring futures of ecosystem services in cultural landscapes through participatory scenario development in the Swabian Alb, Germany. Ecol. Soc. 2013, 18, 39. [Google Scholar] [CrossRef] [Green Version]
- Branca, G.; Lipper, L.; McCarthy, N.; Jolejole, M.C. Food security, climate change, and sustainable land management: A review. Agron. Sustain. Dev. 2013, 33, 635–650. [Google Scholar] [CrossRef] [Green Version]
- Power Alison, G. Ecosystem services and agriculture: Tradeoffs and synergies. Philos. Trans. R. Soc. B Biol. Sci. 2010, 365, 2959–2971. [Google Scholar] [CrossRef] [PubMed]
- Taff, B.D.; Benfield, J.; Miller, Z.D.; D’Antonio, A.; Schwartz, F. The Role of Tourism Impacts on Cultural Ecosystem Services. Environments 2019, 6, 43. [Google Scholar] [CrossRef] [Green Version]
- Hou, Y.; Burkhard, B.; Müller, F. Uncertainties in Landscape Analysis and Ecosystem Service Assessment. J. Environ. Manag. 2013, 127, 117–131. [Google Scholar] [CrossRef]


| Benefit of Cultural ES | Brief Characteristics |
|---|---|
| Recreation, ecotourism, and geo-tourism | Ecosystems as places for leisure and regeneration [6,7]. |
| Recreation and tourism | Physical use of nature and landscape [8,9,10,11]. |
| Aesthetic values | Perception of the beauty of ecosystems; their components and elements [4,12,13]. |
| Knowledge system | Natural ecosystems provide unlimited opportunities for natural sciences, environmental education, and training, act as “field laboratories” for scientific research, and serve as important reference areas for the monitoring of environmental change [14,15]. |
| Cultural heritage | Created by the influence of ecosystems; their components and elements [9,16,17]. |
| Natural heritage | Consequence of ecosystem diversity (environmental diversity, biological diversity, and landscape diversity) [9,18]. |
| Roads/Region | Brezno | Michalovce | Piešťany | Krupina |
|---|---|---|---|---|
| 1st class roads (km) | 117.2 | 48.19 | 17.23 | 58.26 |
| 2nd class roads (km) | 40.32 | 114.61 | 72.16 | 23.9 |
| 3rd class roads (km) | 77.89 | 223.4 | 53.23 | 138.56 |
| road network density (km/km2) | 0.186 | 0.379 | 0.425 | 0.38 |
| Ecosystem/Region | Krupina | Brezno | Michalovce | Piešťany |
|---|---|---|---|---|
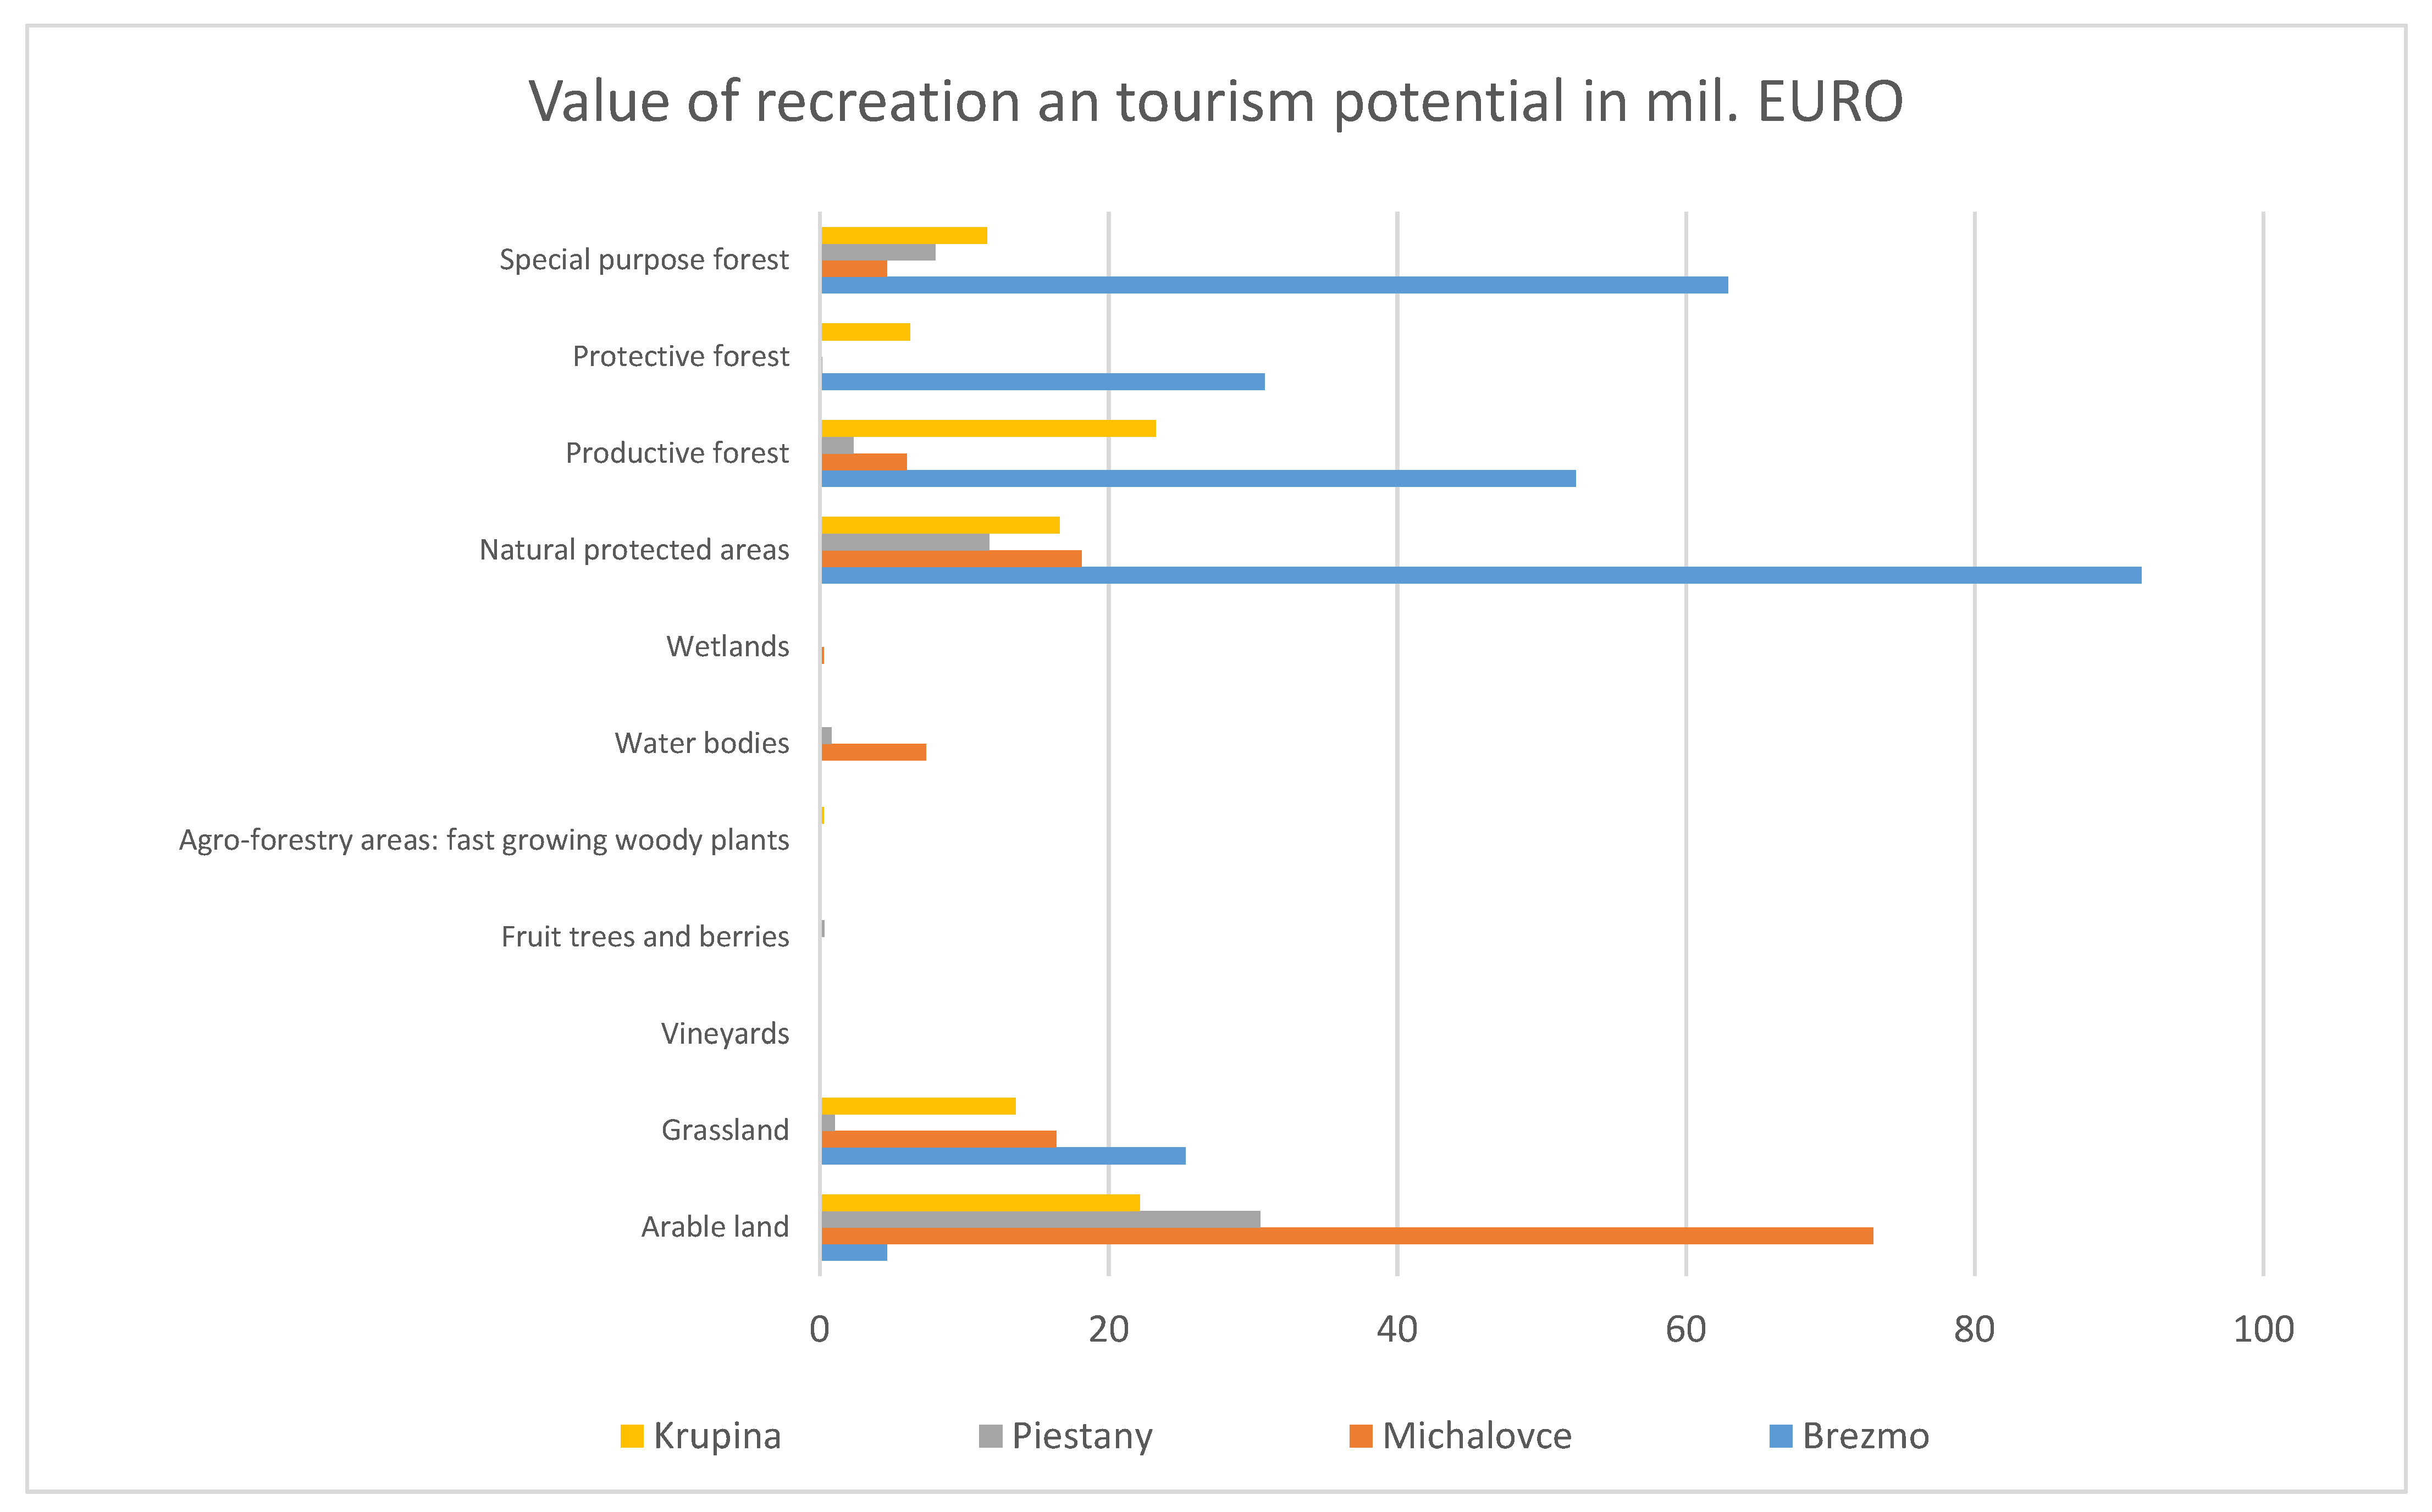
| Arable land | 15,266.6 | 3221.7001 | 50,260.8 | 21,022.1 |
| Grassland | 9362.1 | 17,455.6 | 11,295.5 | 726.9 |
| Vineyards | 73.2 | 0 | 62.3 | 43 |
| Fruit trees and berries | 30.5 | 0.5 | 64.5 | 179 |
| Agro-forestry areas: fast-growing woody plants | 163.7 | 0 | 13.9 | 1 |
| Water bodies | 60.1 | 20.2 | 3618.8 | 403 |
| Wetlands | 0.3 | 3.2 | 186.7 | 4.1 |
| Natural protected areas | 5725.9 | 31,528.73 | 6243.7 | 4050.9 |
| Productive forest | 8019.06 | 18,027.9 | 2081.6 | 813.57 |
| Protective forest | 2156.7 | 10,608.4 | 59.92 | 34.79 |
| Special purpose forest | 4561.05 | 24,759.3 | 1831.1 | 3150.4 |
| Capacity Scores | ||||||
|---|---|---|---|---|---|---|
| Ecosystem | Recreation Values | Aesthetic Values | Knowledge System | Cultural Heritage | Regional Significance | Natural Heritage |
| Arable land | 40 | 50 | 40 | 50 | 50 | 30 |
| Grassland | 40 | 50 | 40 | 50 | 50 | 60 |
| Vineyards | 50 | 50 | 60 | 50 | 50 | 40 |
| Fruit trees and berries | 50 | 50 | 60 | 50 | 50 | 40 |
| Agro-forestry areas: fast-growing woody plants | 50 | 50 | 60 | 35 | 50 | 30 |
| Water bodies | 56 | 49 | 49 | 56 | 56 | 49 |
| Wetlands | 40 | 60 | 50 | 60 | 50 | 80 |
| Natural protected areas | 80 | 80 | 70 | 70 | 80 | 80 |
| Productive forest | 80 | 80 | 70 | 70 | 80 | 80 |
| Protective forest | 80 | 80 | 70 | 70 | 80 | 80 |
| Special purpose forest | 70 | 70 | 70 | 60 | 80 | 50 |
| Region/Altitude | 0–300 m above Sea Level | 300 < m above Sea Level |
|---|---|---|
| Brezno | 0 | 428 |
| Krupina | 340 | 370 |
| Michalovce | 313 | 430 |
| Piestany | 317 | 445 |
| Indicator/Region | Brezno | Michalovce | Piešťany | Krupina |
|---|---|---|---|---|
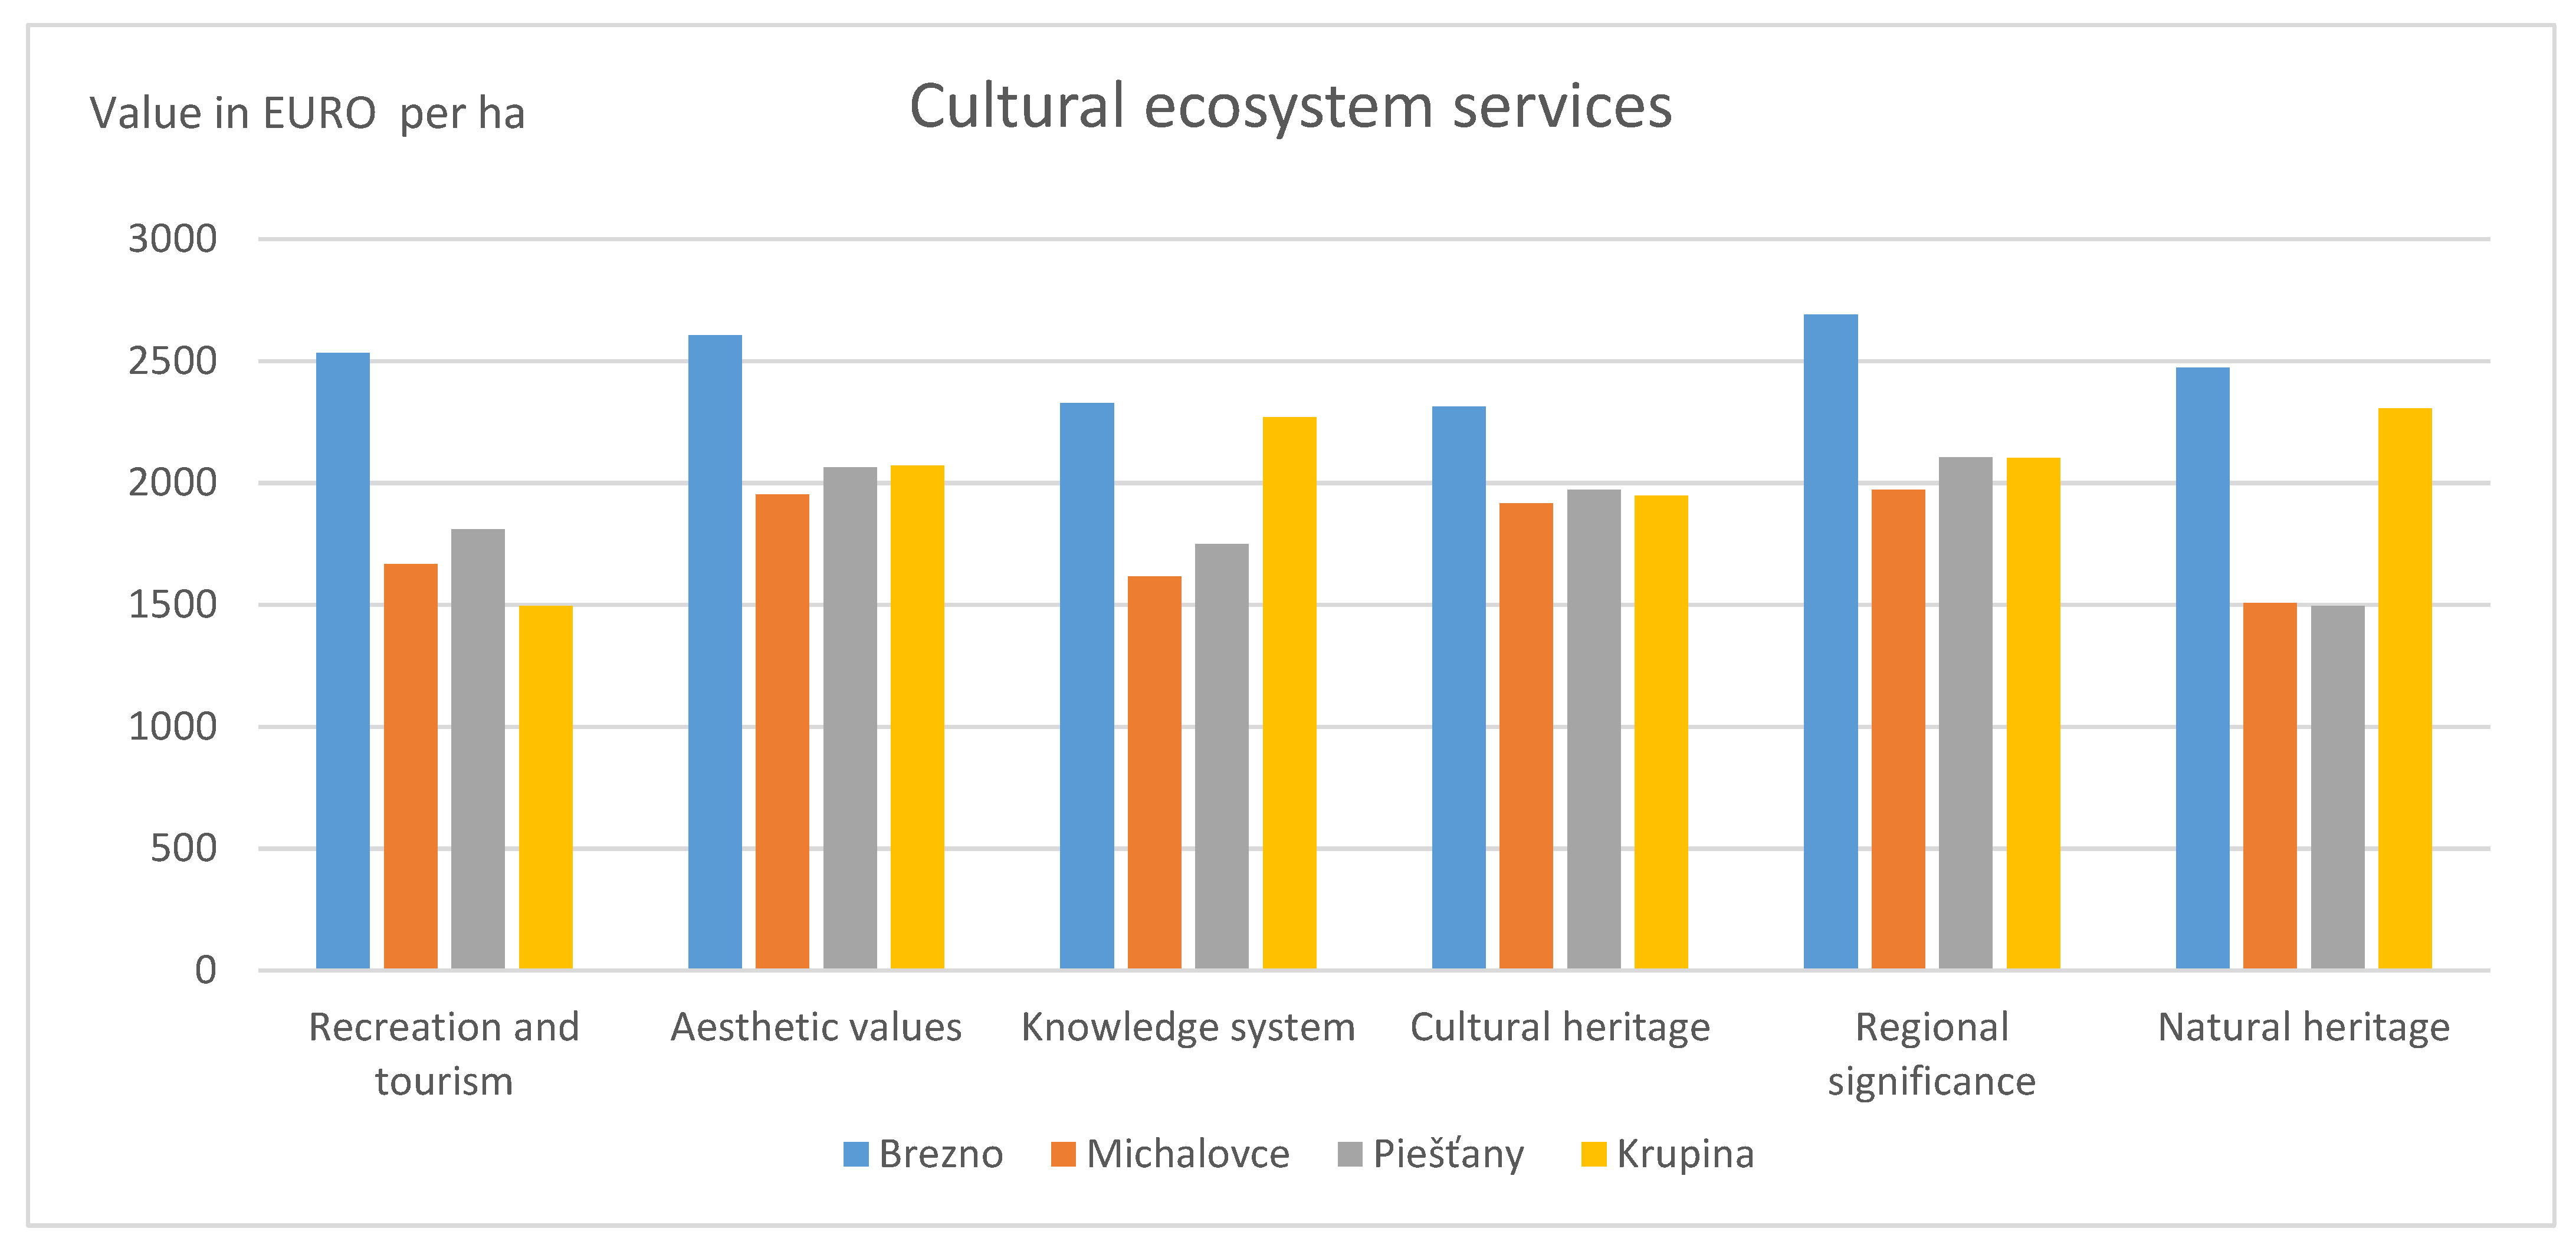
| Potential of cultural ES recreation and tourism (score) | 69.82 | 45.94 | 49.83 | 41.17 |
| Potential of cultural ES aesthetic values (score) | 71.78 | 53.78 | 56.89 | 57.10 |
| Potential of cultural ES knowledge system (score) | 64.12 | 44.54 | 48.20 | 62.51 |
| Potential of cultural ES cultural heritage (score) | 63.74 | 52.77 | 54.34 | 53.65 |
| Potential of cultural ES regional significance (score) | 74.12 | 54.33 | 58.02 | 57.96 |
| Potential of cultural ES natural heritage (score) | 68.13 | 41.54 | 41.17 | 63.52 |
| Number of visitors 2016 | 76,339 | 46,027 | 117,854 | 63,358 |
| Average number of visitors 2006–2016 | 65,294 | 39,134 | 112,052 | 47,250 |
| Number of accommodation facilities 2016 | 86 | 44 | 53 | 27 |
| Average number of accommodation facilities 2006–2016 | 94.45 | 49.45 | 55.72 | 25 |
| Number of stays 2016 | 191,521 | 115,824 | 654,083 | 347,836 |
| Average number of stays 2006–2016 | 168,601 | 103,521 | 65,657 | 298,054 |
Publisher’s Note: MDPI stays neutral with regard to jurisdictional claims in published maps and institutional affiliations. |
© 2022 by the authors. Licensee MDPI, Basel, Switzerland. This article is an open access article distributed under the terms and conditions of the Creative Commons Attribution (CC BY) license (https://creativecommons.org/licenses/by/4.0/).
Share and Cite
Makovníková, J.; Kološta, S.; Flaška, F.; Pálka, B. Regional Differentiations of the Potential of Cultural Ecosystem Services in Relation to Natural Capital—A Case Study in Selected Regions of the Slovak Republic. Land 2022, 11, 270. https://doi.org/10.3390/land11020270
Makovníková J, Kološta S, Flaška F, Pálka B. Regional Differentiations of the Potential of Cultural Ecosystem Services in Relation to Natural Capital—A Case Study in Selected Regions of the Slovak Republic. Land. 2022; 11(2):270. https://doi.org/10.3390/land11020270
Chicago/Turabian StyleMakovníková, Jarmila, Stanislav Kološta, Filip Flaška, and Boris Pálka. 2022. "Regional Differentiations of the Potential of Cultural Ecosystem Services in Relation to Natural Capital—A Case Study in Selected Regions of the Slovak Republic" Land 11, no. 2: 270. https://doi.org/10.3390/land11020270
APA StyleMakovníková, J., Kološta, S., Flaška, F., & Pálka, B. (2022). Regional Differentiations of the Potential of Cultural Ecosystem Services in Relation to Natural Capital—A Case Study in Selected Regions of the Slovak Republic. Land, 11(2), 270. https://doi.org/10.3390/land11020270