
Effectiveness of Electricity-Saving Communication Campaigns: Neurophysiological Approach


Abstract
:1. Introduction
2. Methods of Testing the Effectiveness of the Media Message
3. Materials and Methods
3.1. Participants
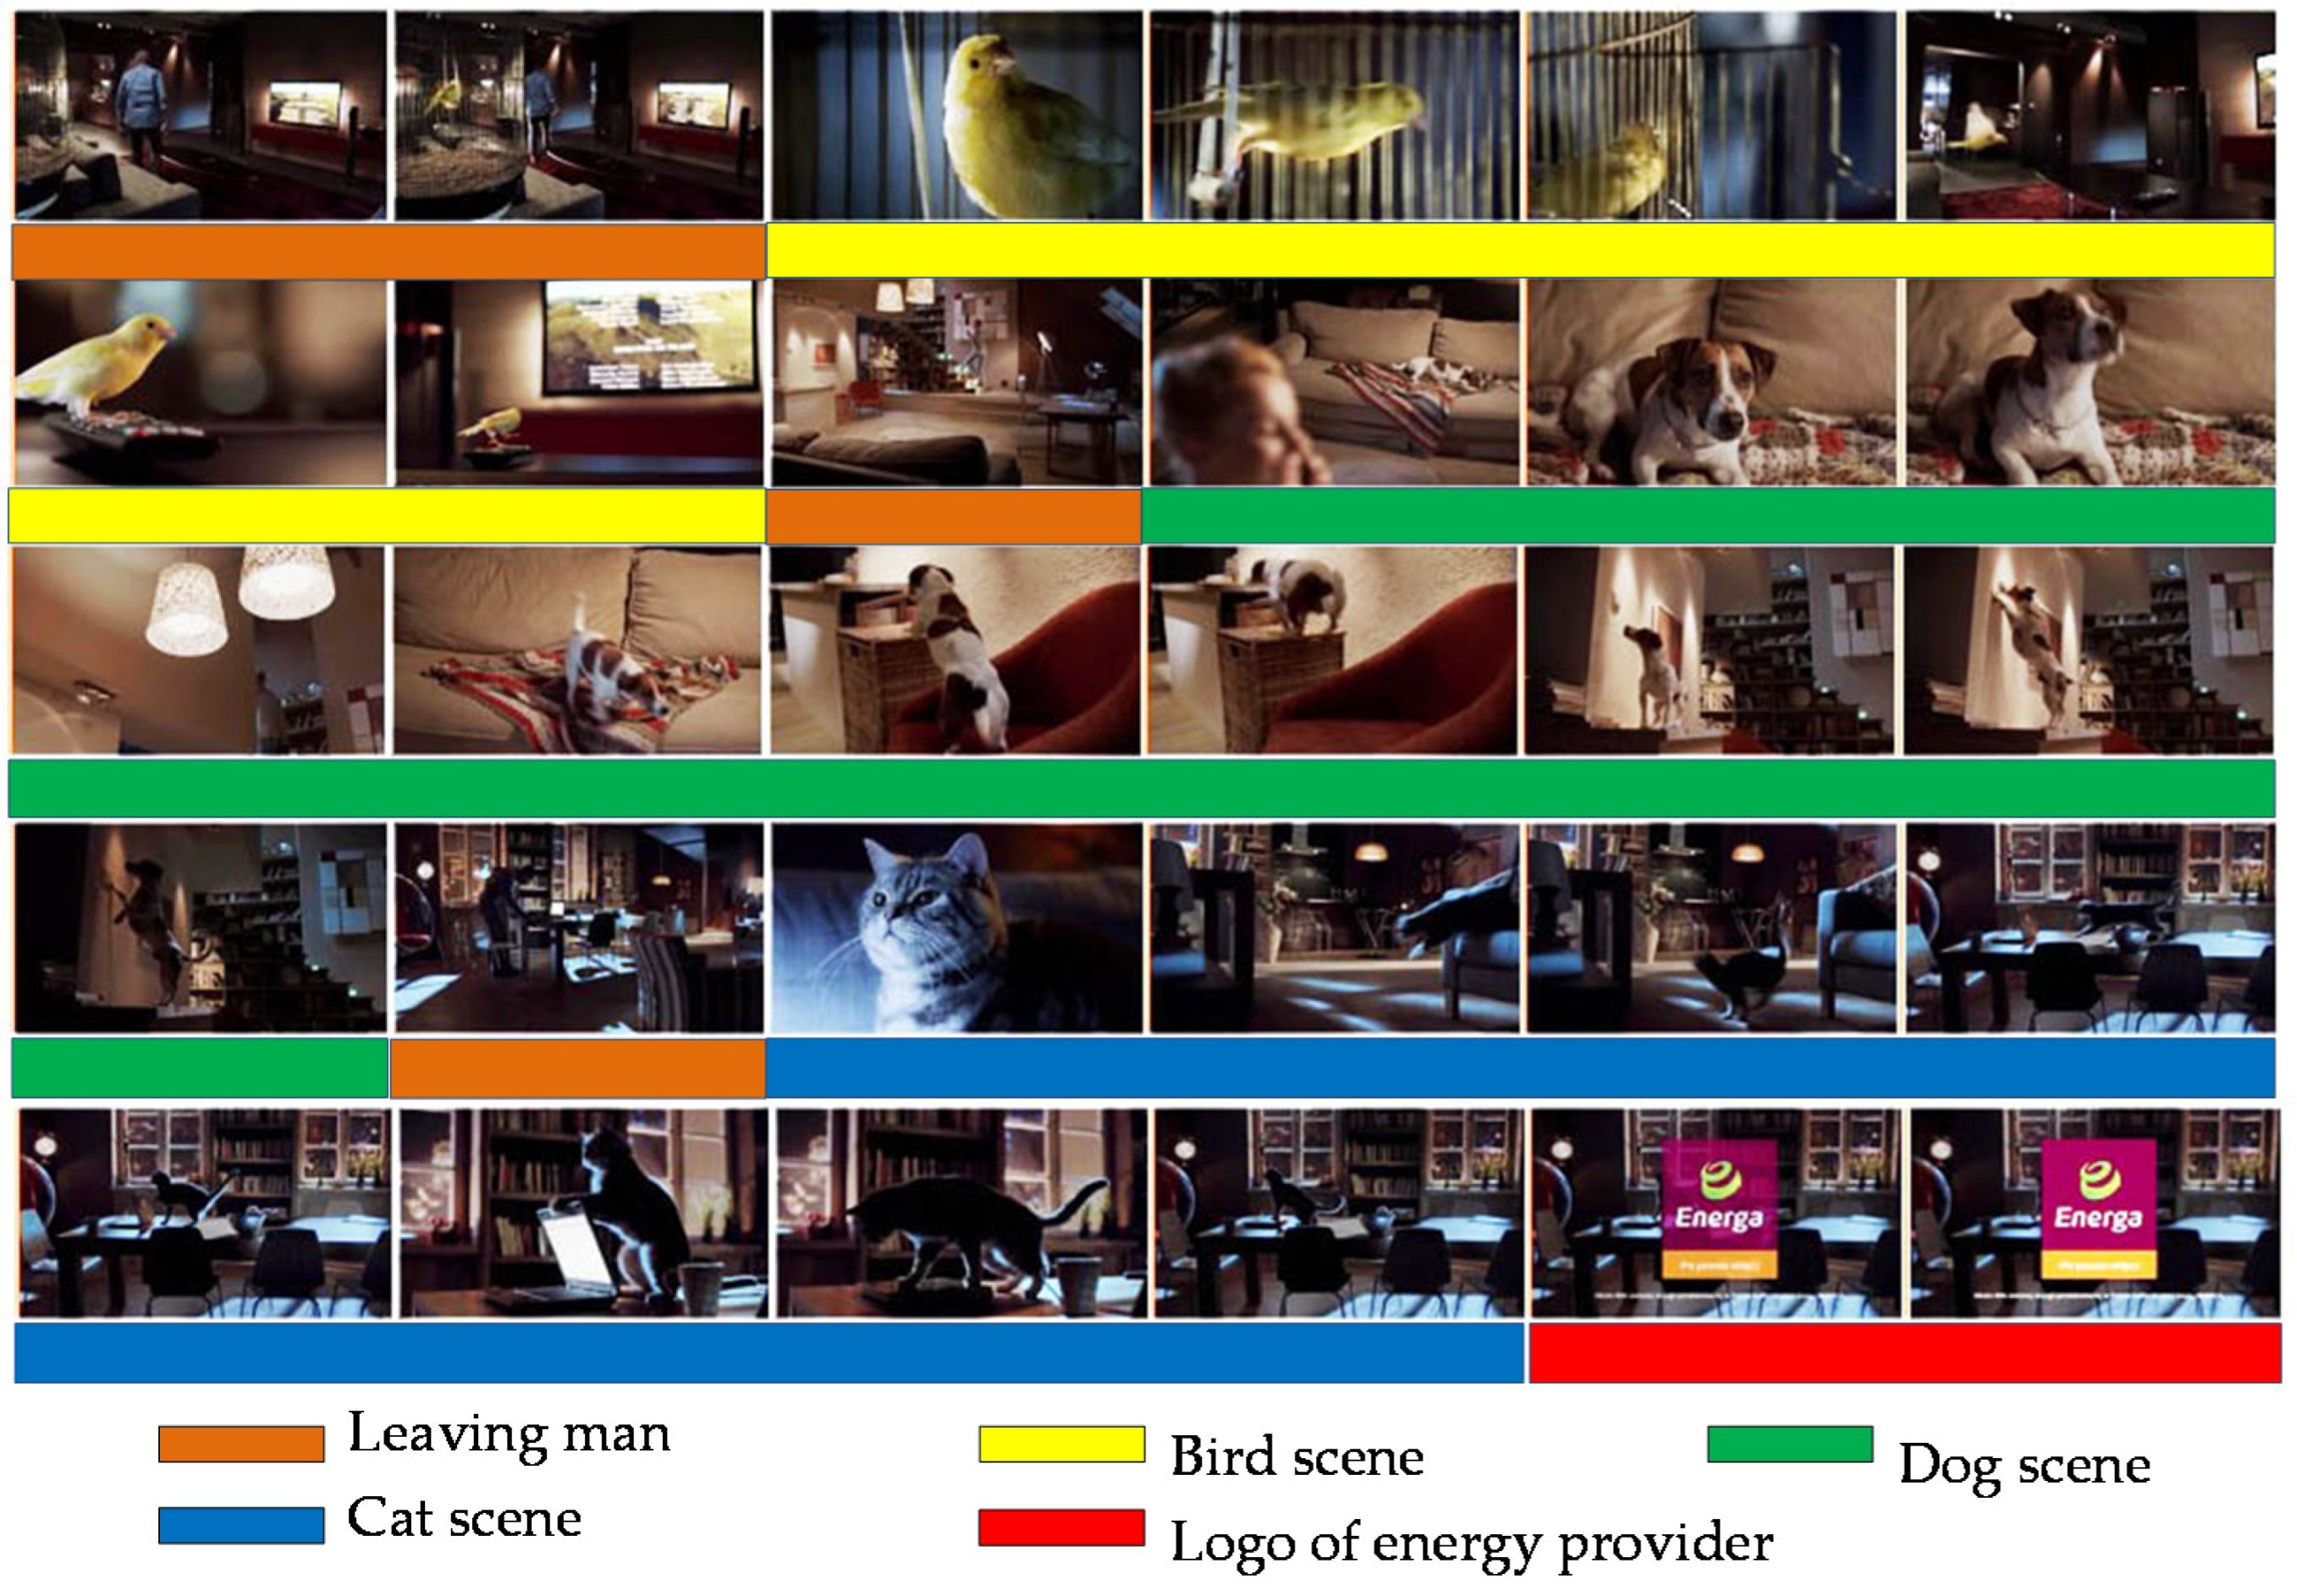
3.2. Stimuli
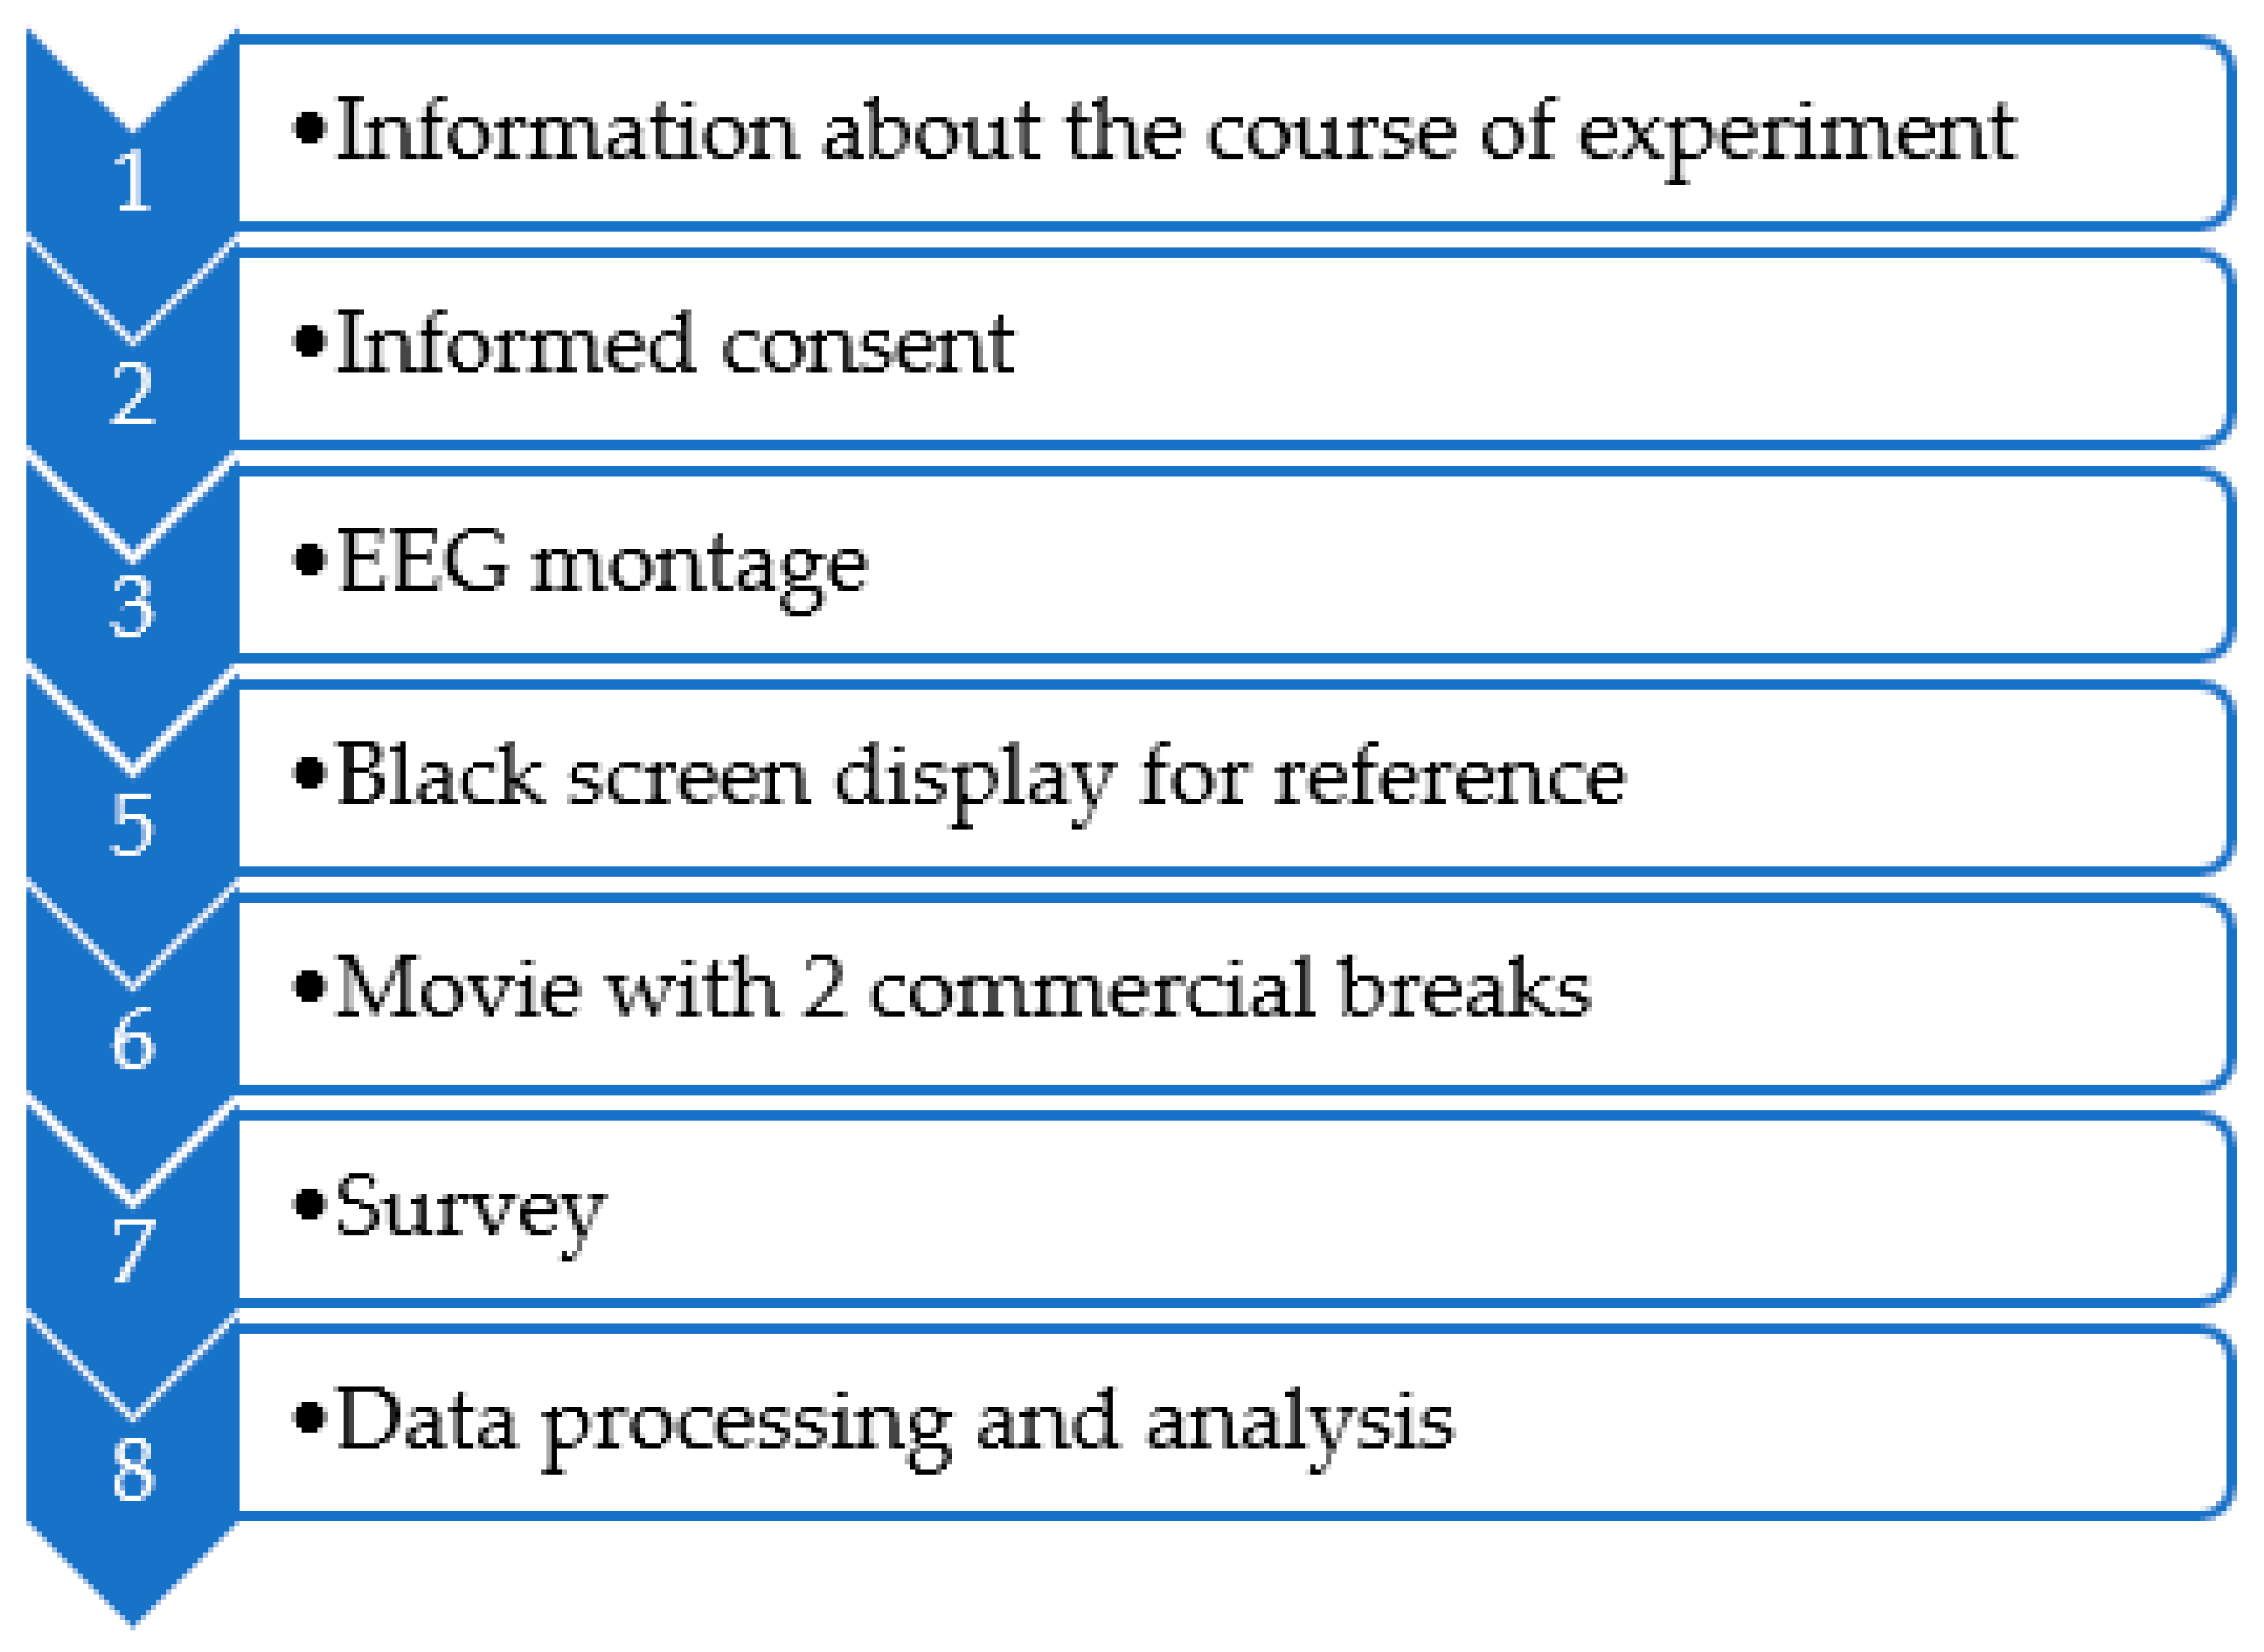
3.3. Procedure
3.4. Registration and Processing of Neurophysiological Data
3.5. Measures
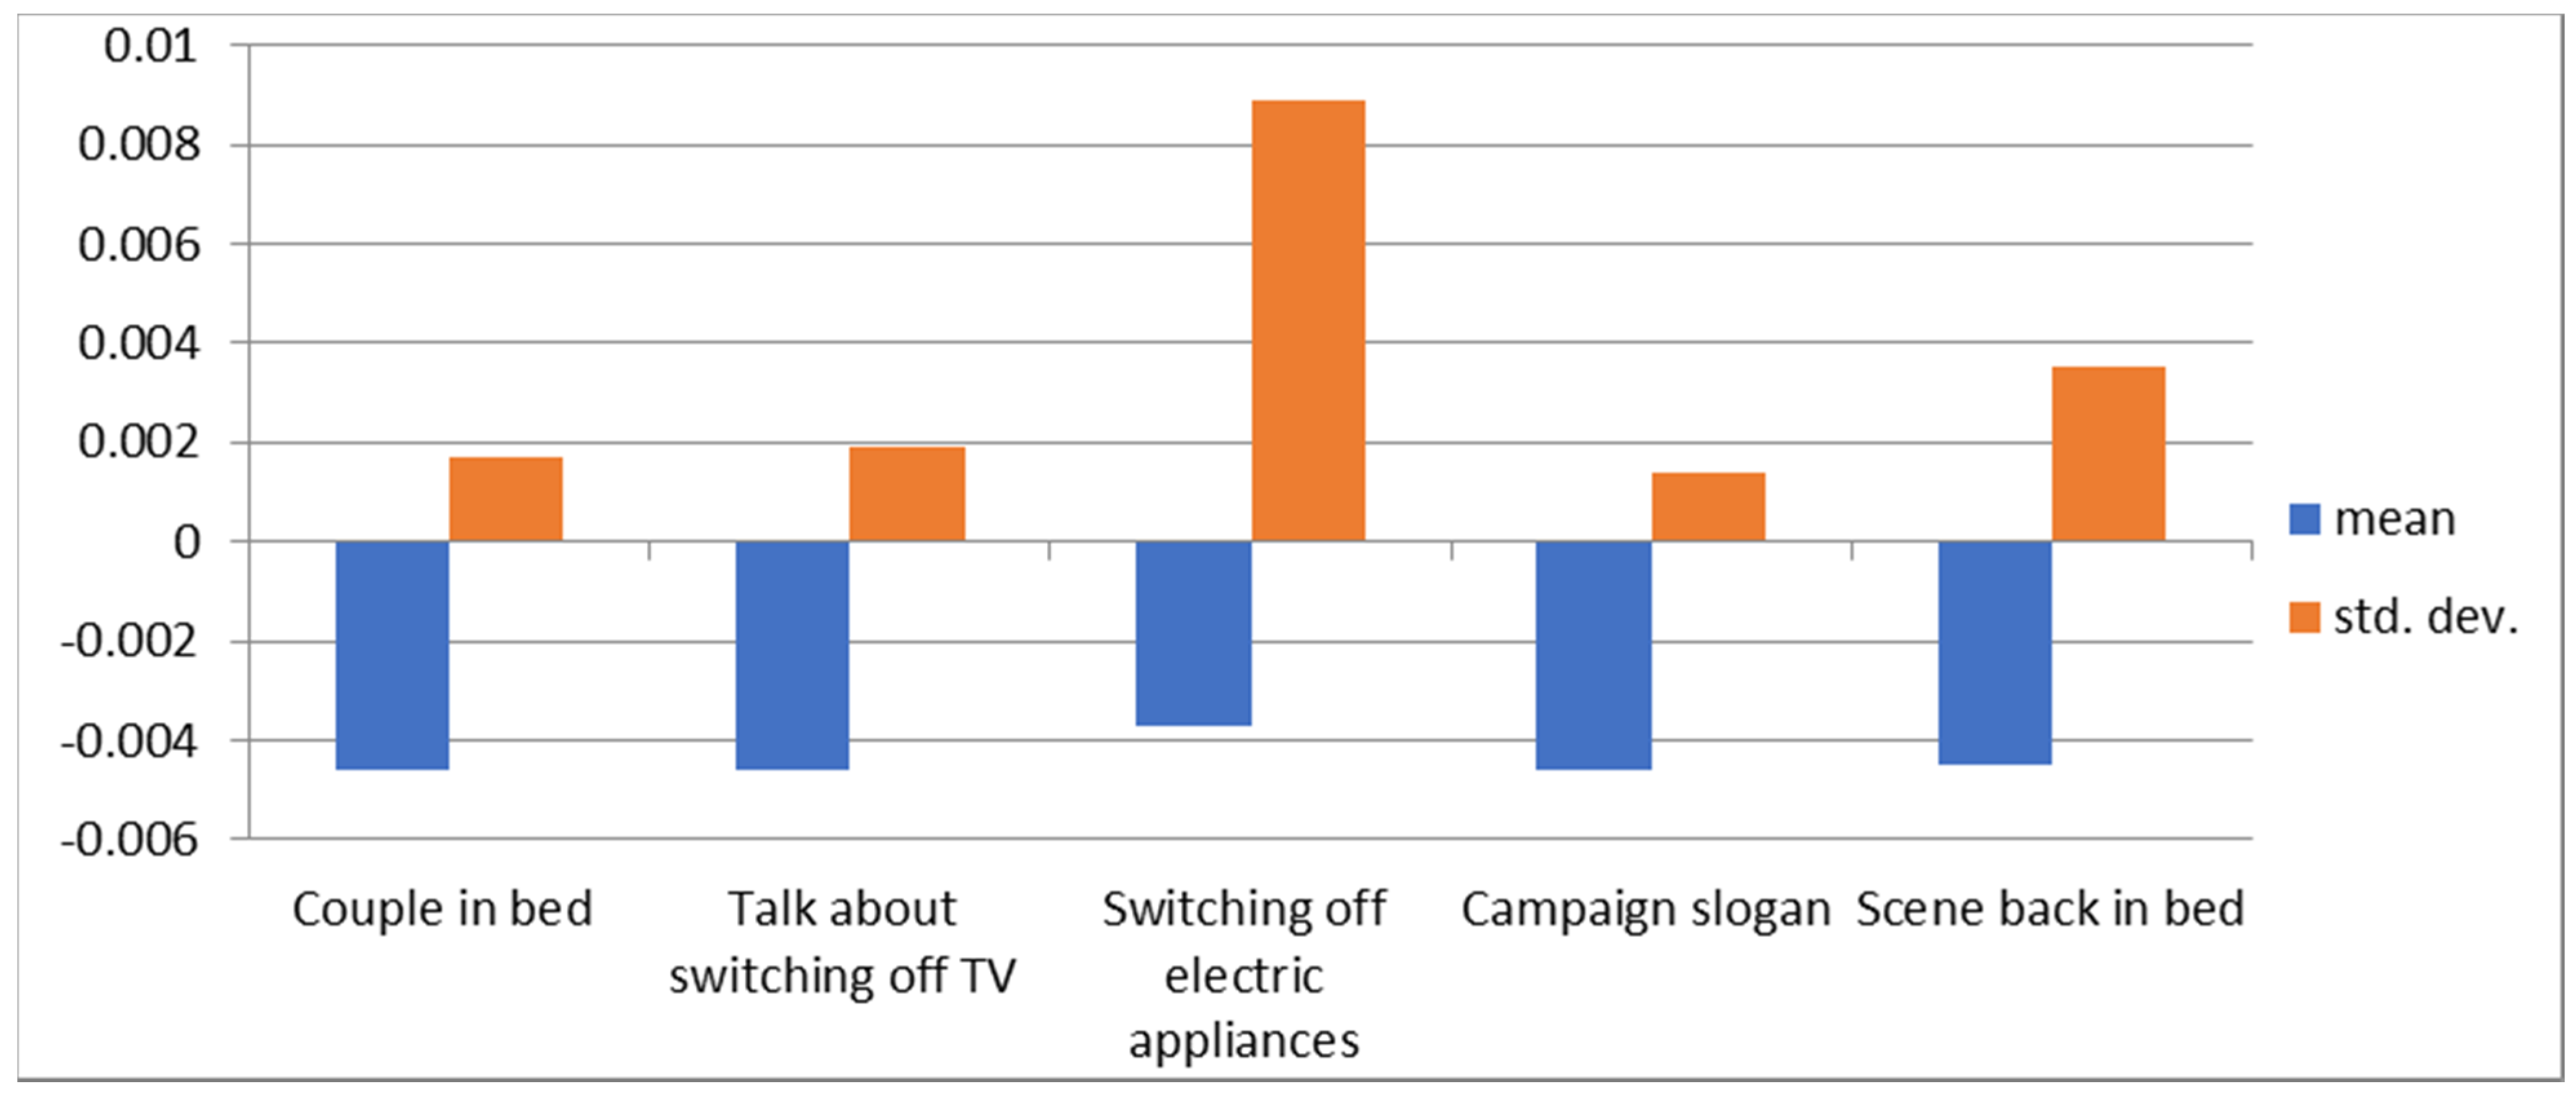
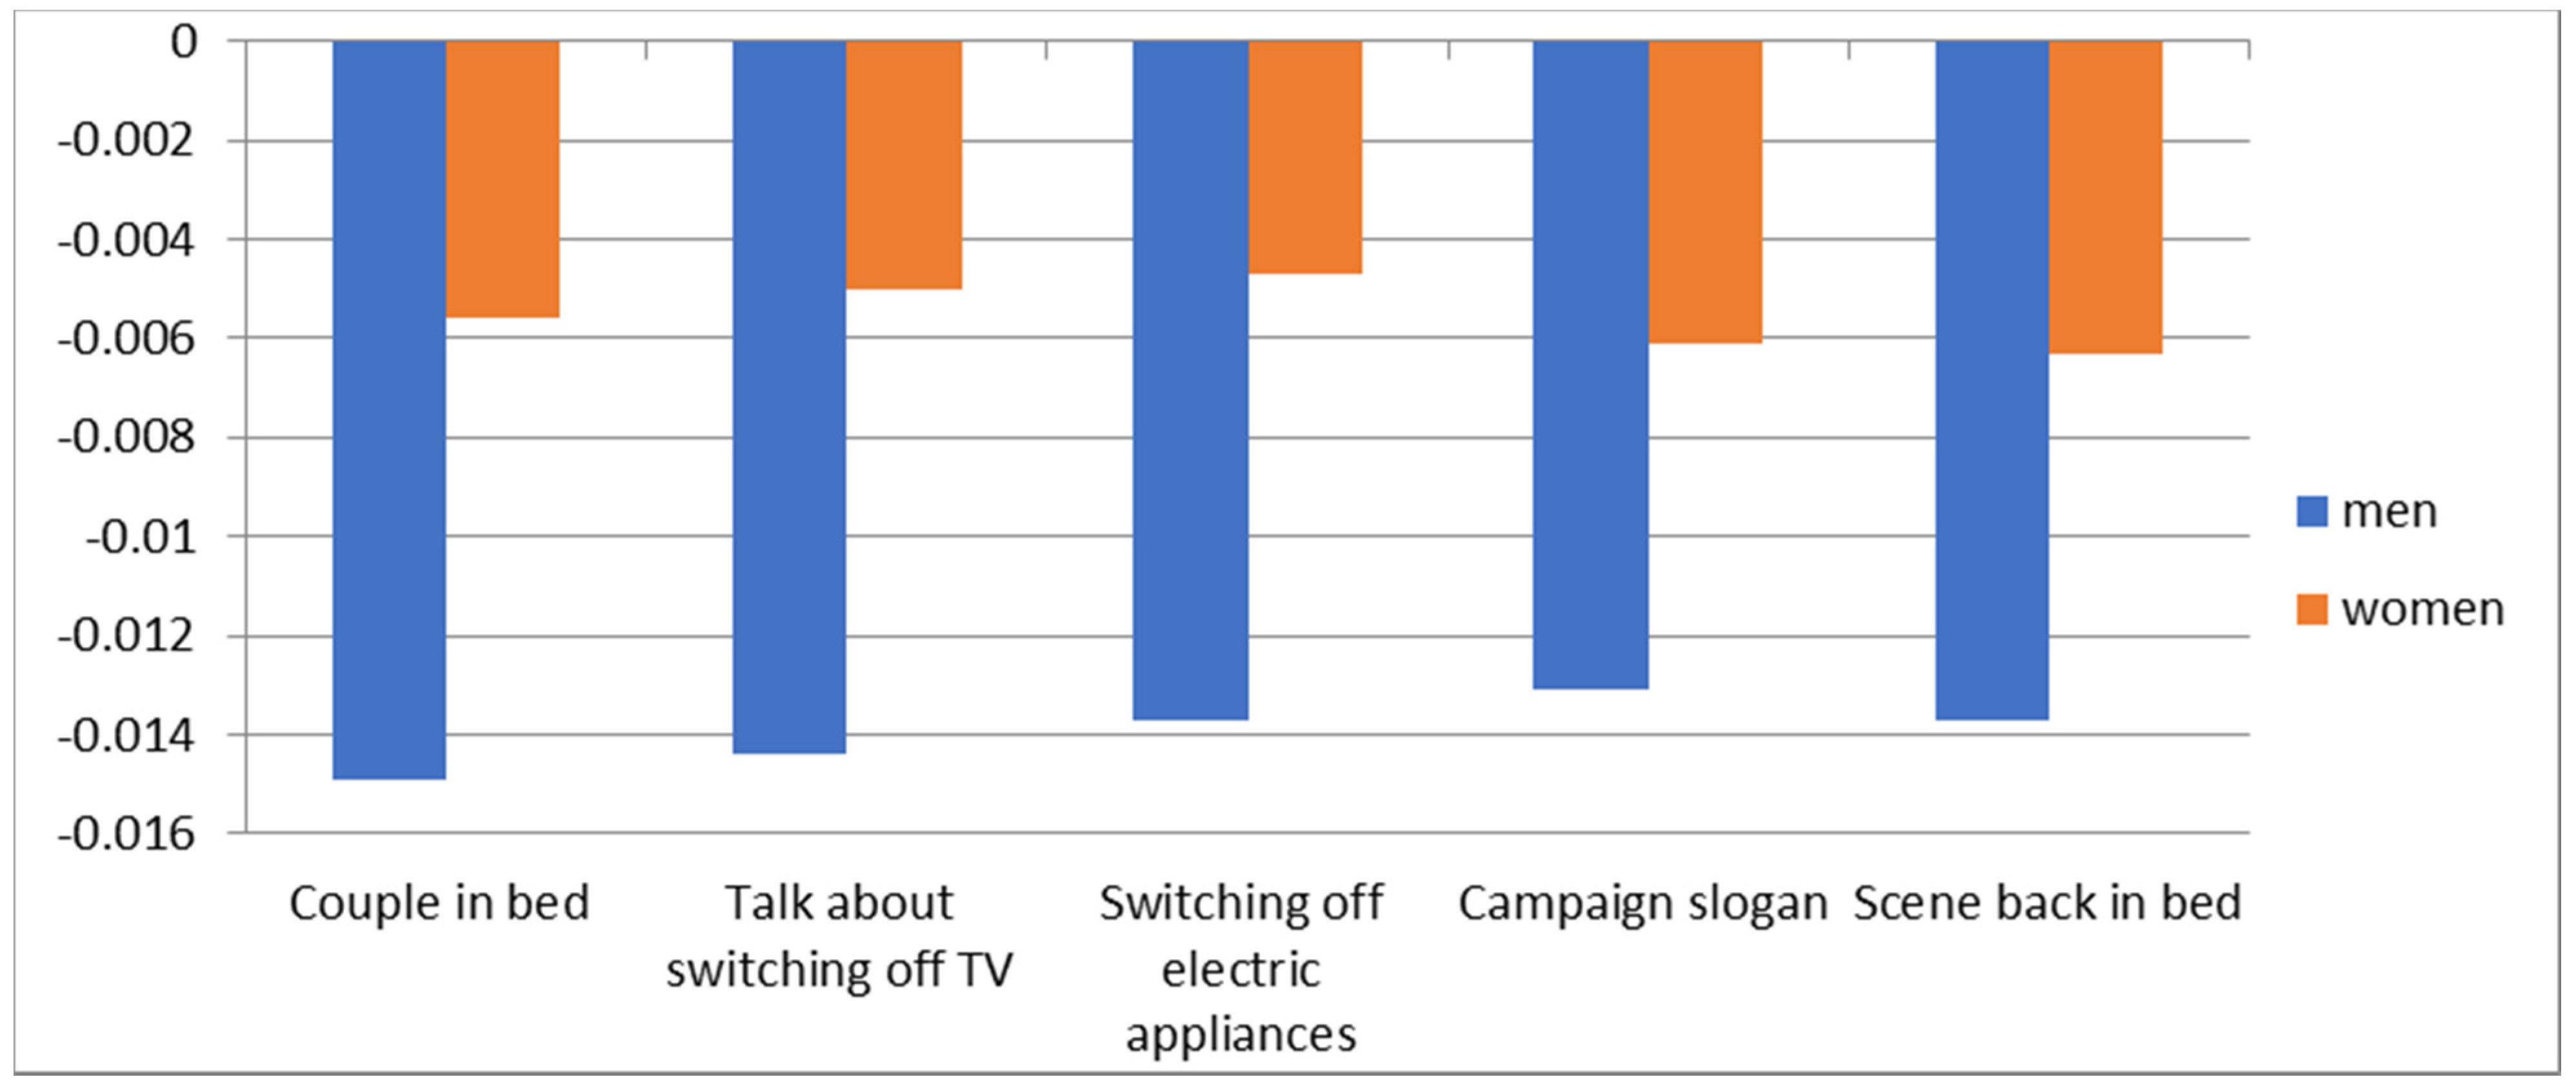
4. Results
5. Discussion
6. Conclusions
Author Contributions
Funding
Institutional Review Board Statement
Informed Consent Statement
Data Availability Statement
Conflicts of Interest
References
- Redl, C.; Hein, F.; Buck, M.; Graichen, P.; Jones, D. The European Power Sector in 2020: Up-to-Date Analysis on the Electricity Transition; Agora Energiewende and Ember: Berlin, Germany, 2021. [Google Scholar]
- European Commission, Directorate-General for Energy Progress on Competitiveness of Clean Energy Technologies. Report from the Commission to the European Parliament and the Council. COM(2021) 952 Final; European Commission: Brussels, Belgium, 2021. [Google Scholar]
- Climate Change 2021: The Physical Science Basis (WG1); Masson-Delmotte, V.; Zhai, P.; Pirani, A.; Connors, S.L.; Péan, C.; Chen, Y. (Eds.) Cambridge University Press: Cambridge, UK, 2021. [Google Scholar]
- Höök, M.; Tang, X. Depletion of Fossil Fuels and Anthropogenic Climate Change—A Review. Energy Policy 2013, 52, 797–809. [Google Scholar] [CrossRef] [Green Version]
- Delannoy, L.; Longaretti, P.-Y.; Murphy, D.J.; Prados, E. Peak Oil and the Low-Carbon Energy Transition: A Net-Energy Perspective. Appl. Energy 2021, 304, 117843. [Google Scholar] [CrossRef]
- European Environmental Agency. EEA Greenhouse Gases-Data Viewer. Available online: https://www.eea.europa.eu/data-and-maps/data/data-viewers/greenhouse-gases-viewer (accessed on 28 December 2021).
- Eurostat Statistics Explained. Available online: https://ec.europa.eu/eurostat/statistics-explained/ (accessed on 20 December 2021).
- Eurostat Energy Consumption in Households. Available online: https://ec.europa.eu/eurostat/statistics-explained/index.php?title=Energy_consumption_in_households (accessed on 15 December 2021).
- Campbell, U. The Biggest Sources of Residential Energy Consumption. Available online: https://www.connect4climate.org/article/biggest-sources-residential-energy-consumption (accessed on 30 December 2021).
- Desjardins, J. Visualizing U.S. Energy Consumption in One Chart. Available online: https://www.visualcapitalist.com/visualizing-u-s-energy-consumption-one-chart/ (accessed on 29 December 2021).
- Song, Q.; Li, J.; Duan, H.; Yu, D.; Wang, Z. Towards to Sustainable Energy-Efficient City: A Case Study of Macau. Renew. Sustain. Energy Rev. 2017, 75, 504–514. [Google Scholar] [CrossRef]
- Khan, I.; Halder, P.K. Electrical Energy Conservation through Human Behavior Change: Perspective in Bangladesh. Int. J. Renew. Energy Res. 2015, 6, 43–52. [Google Scholar]
- Kim, K.-H. Overview on Public Benefit Campaigns to Promote Energy Conservation and Energy Efficiency. In The United Nations Forum on Energy Efficiency and Energy Security: Taking Collaborative Action on Mitigation Climate Change; United Nations: Seoul, Korea, 2007. [Google Scholar]
- Piccolo, L.S.G.; Alani, H. Strategies and Tools to Raise Energy Awareness Collectively. In Proceedings of the Behave 2016—4th European Conference on Behaviour and Energy Efficiency, Coimbra, Portugal, 8–9 September 2016; University of Coimbra: Coimbra, Portugal, 2016. [Google Scholar]
- Carrico, A.R.; Vandenbergh, M.P.; Stern, P.C.; Dietz, T. US Climate Policy Needs Behavioural Science. Nat. Clim. Chang. 2015, 5, 177–179. [Google Scholar] [CrossRef]
- Rai, V.; Henry, A.D. Agent-Based Modelling of Consumer Energy Choices. Nat. Clim. Chang. 2016, 6, 556–562. [Google Scholar] [CrossRef]
- Rivas, S.; Cuniberti, B.; Bertoldi, P. Effective Information Measures to Promote Energy Use Reduction in EU Member States; JRC Science Hub: Brussels, Belgium; European Union: Brussels, Belgium, 2016; ISBN 978-92-79-59815-9. [Google Scholar]
- Bernard, L.; Semmler, W.; Hansen, J.E. Environment and Development Challenges. In The Oxford Handbook of the Macroeconomics of Global Warming; Bernard, L., Semmler, W., Eds.; Oxford University Press: Oxford, UK, 2015; ISBN 978-0-19-985697-8. [Google Scholar]
- Bohdanowicz, Z.; Łopaciuk-Gonczaryk, B.; Kowalski, J.; Biele, C. Households’ Electrical Energy Conservation and Management: An Ecological Break-Through, or the Same Old Consumption-Growth Path? Energies 2021, 14, 6829. [Google Scholar] [CrossRef]
- Steg, L. Promoting Household Energy Conservation. Energy Policy 2008, 36, 4449–4453. [Google Scholar] [CrossRef]
- Gerster, A.; Andor, M.A.; Peters, J. Information Campaigns for Residential Energy Conservation; Ruhr Economic Papers; RWI—Leibniz-Institut für Wirtschaftsforschung: Essen, Germany; Ruhr-University Bochum: Bochum, Germany; TU Dortmund University: Dortmund, Germany; University of Duisburg-Essen: Duisburg, Germany, 2020; ISBN 978-3-96973-008-9. [Google Scholar]
- Farrow, K.; Grolleau, G.; Mzoughi, N. Less Is More in Energy Conservation and Efficiency Messaging. Energy Policy 2018, 122, 1–6. [Google Scholar] [CrossRef]
- Abrahamse, W.; Steg, L.; Vlek, C.; Rothengatter, T. A Review of Intervention Studies Aimed at Household Energy Conservation. J. Environ. Psychol. 2005, 25, 273–291. [Google Scholar] [CrossRef]
- Rice, R.E.; Atkin, C.K. Public Communication Campaigns; SAGE Publications, Inc.: London, UK, 2013; ISBN 978-1-4129-8770-7. [Google Scholar]
- Csobod, É.; Grätz, M.; Szuppinger, P. Overview and Analysis of Public Awareness Raising Strategies and Actions on Energy Savings, INTENSE/Deliverable 6.1/WP6/Year 2009; Baltic Environmental Forum: Riga, Latvia, 2009. [Google Scholar]
- Fernandez, M.; Piccolo, L.; Maynard, D.; Wippoo, M.; Meili, C.; Alani, H. Pro-Environmental Campaigns via Social Media: Analysing Awareness and Behaviour Patterns. J. Web Sci. 2017, 3, 1–15. [Google Scholar] [CrossRef]
- Keller, S.; Otjen, A.J.; McNally, M.; Wilkinson, T.J.; Dockery, B.; Leonard, J.; Southworth, H. Improving Awareness of Energy Conservation: Rocky Mountain City. JEET 2021, 1, 4–19. [Google Scholar] [CrossRef]
- Revell, K. Estimating the Environmental Impact of Home Energy Visits and Extent of Behaviour Change. Energy Policy 2014, 73, 461–470. [Google Scholar] [CrossRef] [Green Version]
- Karlin, B.; Davis, N.; Sanguinetti, A.; Gamble, K.; Kirkby, D.; Stokols, D. Dimensions of Conservation: Exploring Differences among Energy Behaviors. Environ. Behav. 2014, 46, 423–452. [Google Scholar] [CrossRef] [Green Version]
- Owens, S.; Driffill, L. How to Change Attitudes and Behaviours in the Context of Energy. Energy Policy 2008, 36, 4412–4418. [Google Scholar] [CrossRef]
- Wood, G.; Newborough, M. Energy-Use Information Transfer for Intelligent Homes: Enabling Energy Conservation with Central and Local Displays. Energy Build. 2007, 39, 495–503. [Google Scholar] [CrossRef]
- Chatterton, T. An Introduction to Thinking about ‘Energy Behaviour’: A Multi-Model Approach; Department of Energy and Climate Change: London, UK, 2011. [Google Scholar]
- Wilson, C.; Dowlatabadi, H. Models of Decision Making and Residential Energy Use. Annu. Rev. Environ. Resour. 2007, 32, 169–203. [Google Scholar] [CrossRef]
- Allcott, H.; Mullainathan, S. Behavior and Energy Policy. Science 2010, 327, 1204–1205. [Google Scholar] [CrossRef]
- Jones, R.V.; Fuertes, A.; Lomas, K.J. The Socio-Economic, Dwelling and Appliance Related Factors Affecting Electricity Consumption in Domestic Buildings. Renew. Sustain. Energy Rev. 2015, 43, 901–917. [Google Scholar] [CrossRef] [Green Version]
- Gottwalt, S.; Garttner, J.; Schmeck, H.; Weinhardt, C. Modeling and Valuation of Residential Demand Flexibility for Renewable Energy Integration. IEEE Trans. Smart Grid 2017, 8, 2565–2574. [Google Scholar] [CrossRef]
- Reddy, A.K.N. Barriers to Improvements in Energy Efficiency. Energy Policy 1991, 19, 953–961. [Google Scholar] [CrossRef] [Green Version]
- Schultz, P.W. Strategies for Promoting Proenvironmental Behavior: Lots of Tools but Few Instructions. Eur. Psychol. 2014, 19, 107–117. [Google Scholar] [CrossRef]
- Frederiks, E.R.; Stenner, K.; Hobman, E.V. Household Energy Use: Applying Behavioural Economics to Understand Consumer Decision-Making and Behaviour. Renew. Sustain. Energy Rev. 2015, 41, 1385–1394. [Google Scholar] [CrossRef] [Green Version]
- Social Marketing for Public Health: Global Trends and Success Stories; Cheng, H.; Kotler, P.; Lee, N. (Eds.) Jones and Bartlett: Sudbury, MA, USA, 2011; ISBN 978-0-7637-5797-7. [Google Scholar]
- Information Campaigns: Balancing Social Values and Social Change; Salmon, C.T. (Ed.) Sage Annual Reviews of Communication Research; Sage Publications: Newbury Park, CA, USA, 1989; ISBN 978-0-8039-3218-0. [Google Scholar]
- French, J.; Blair-Stevens, C. Key Concepts and Principles of Social Marketing. In Social Marketing and Public Health: Theory and Practice; French, J., Blair-Stevens, C., McVey, D., Merritt, R., Eds.; Oxford University Press: Oxford, UK, 2010. [Google Scholar]
- Norberg, P.A.; Marcos, E. Planning the Social Marketing Campaign. In Handbook of Persuasion and Social Marketing; Stewart, D., Ed.; Praeger: Santa Barbara, CA, USA, 2015. [Google Scholar]
- Weinreich, N.K. Hands-on Social Marketing: A Step-by-Step Guide to Designing Change for Good; SAGE Publications, Inc.: Thousand Oaks, CA, USA, 2011; ISBN 978-1-4129-5369-6. [Google Scholar]
- Lee, N.; Kotler, P. Social Marketing: Behavior Change for Social Good, 6th ed.; SAGE Publications: Los Angeles, CA, USA, 2020; ISBN 978-1-5443-5149-0. [Google Scholar]
- Steg, L.; Shwom, R.; Dietz, T. What Drives Energy Consumers?: Engaging People in a Sustainable Energy Transition. IEEE Power Energy Mag. 2018, 16, 20–28. [Google Scholar] [CrossRef]
- Abrahamse, W.; Steg, L. How Do Socio-Demographic and Psychological Factors Relate to Households’ Direct and Indirect Energy Use and Savings? J. Econ. Psychol. 2009, 30, 711–720. [Google Scholar] [CrossRef]
- Parrish, B.; Heptonstall, P.; Gross, R.; Sovacool, B.K. A Systematic Review of Motivations, Enablers and Barriers for Consumer Engagement with Residential Demand Response. Energy Policy 2020, 138, 111221. [Google Scholar] [CrossRef]
- Sony, M.; Mekoth, N. A Qualitative Study on Electricity Energy-Saving Behaviour. MEQ 2018, 29, 961–977. [Google Scholar] [CrossRef]
- Pandey, D.; Agrawal, M.; Pandey, J.S. Carbon Footprint: Current Methods of Estimation. Environ. Monit. Assess. 2011, 178, 135–160. [Google Scholar] [CrossRef]
- Van den Broek, K.L.; Walker, I. Exploring the Perceptions of Drivers of Energy Behaviour. Energy Policy 2019, 129, 1297–1305. [Google Scholar] [CrossRef]
- Gołębiowska, B.; Bartczak, A.; Czajkowski, M. Energy Demand Management and Social Norms. Energies 2020, 13, 3779. [Google Scholar] [CrossRef]
- Baldinger, A.L.; Cook, W.A. Ad Testing. In Handbook of Marketing Research; Grover, R., Vriens, M., Eds.; Sage Publications: London, UK, 2006; pp. 487–505. [Google Scholar]
- Smith, S.M.; Albaum, G.S. An Introduction to Marketing Research; Qualtrics: Seattle, WA, USA, 2010. [Google Scholar]
- Zaltman, G. How Customers Think: Essential Insights into the Mind of the Market; Harvard Business School Press: Boston, MA, USA, 2003; ISBN 978-1-57851-826-5. [Google Scholar]
- Lindstrom, M. Buyology: Truth and Lies about Why We Buy, 1st ed.; Broadway Books: New York, NY, USA, 2010; ISBN 978-0-385-52389-9. [Google Scholar]
- Ohme, R.; Matukin, M.; Pacula-Lesniak, B. Biometric Measures for Interactive Advertising Research. J. Interact. Advert. 2011, 11, 60–72. [Google Scholar] [CrossRef]
- Ariely, D.; Berns, G.S. Neuromarketing: The Hope and Hype of Neuroimaging in Business. Nat. Rev. Neurosci. 2010, 11, 284–292. [Google Scholar] [CrossRef] [PubMed] [Green Version]
- Calvert, G.A.; Brammer, M.J. Predicting Consumer Behavior: Using Novel Mind-Reading Approaches. IEEE Pulse 2012, 3, 38–41. [Google Scholar] [CrossRef] [PubMed]
- Fisher, C.E.; Chin, L.; Klitzman, R. Defining Neuromarketing: Practices and Professional Challenges. Harv. Rev. Psychiatry 2010, 18, 230–237. [Google Scholar] [CrossRef]
- Żurawicki, L. Neuromarketing: Exploring the Brain of the Consumer; Springer: Berlin/Heidelberg, Germany; London, UK, 2010; ISBN 978-3-540-77828-8. [Google Scholar]
- Morin, C. Neuromarketing: The New Science of Consumer Behavior. Society 2011, 48, 131–135. [Google Scholar] [CrossRef] [Green Version]
- Agarwal, S.; Dutta, T. Neuromarketing and Consumer Neuroscience: Current Understanding and the Way Forward. Decision 2015, 42, 457–462. [Google Scholar] [CrossRef]
- Zelinková, J.; Shaw, D.J.; Mareček, R.; Mikl, M.; Urbánek, T.; Havlíčková, D.; Zámečník, P.; Haitová, P.; Brázdil, M. An Evaluation of Traffic-Awareness Campaign Videos: Empathy Induction Is Associated with Brain Function within Superior Temporal Sulcus. Behav. Brain Funct. 2014, 10, 27. [Google Scholar] [CrossRef] [Green Version]
- Mauri, M.; Ciceri, A.; Songa, G.; Sirca, F.; Onorati, F.; Russo, V. The Effects of Social Communication: A Research Study on Neuroscientific Techniques Application. In Proceedings of the Measuring Behavior 2014—9th International Conference on Methods and Techniques in Behavioral Research, Wageningen, The Netherlands, 27–29 August 2014; Spink, A., van den Broek, E.L., Loijens, L., Wołoszynowska-Fraser, M., Noldus, L., Eds.; Noldus Information Technology: Wageningen, The Netherlands, 2014. [Google Scholar]
- Falk, E.B.; O’Donnell, M.B.; Tompson, S.; Gonzalez, R.; Dal Cin, S.; Strecher, V.; Cummings, K.M.; An, L. Functional Brain Imaging Predicts Public Health Campaign Success. Soc. Cogn. Affect. Neurosci. 2016, 11, 204–214. [Google Scholar] [CrossRef] [Green Version]
- Borawska, A.; Duda, J.; Biercewicz, K. Best Practices of Neurophysiological Data Collection for Media Message Evaluation in Social Campaigns. Procedia Comput. Sci. 2021, 192, 4017–4026. [Google Scholar] [CrossRef]
- Piwowarski, M.; Nermend, K. Cognitive Neuroscience in the Design Process of Social Advertising. Procedia Comput. Sci. 2020, 176, 2959–2968. [Google Scholar] [CrossRef]
- Piwowarski, M. Cognitive Neuroscience Techniques in Examining the Effectiveness of Social Advertisements. In Neuroeconomic and Behavioral Aspects of Decision Making; Nermend, K., Łatuszyńska, M., Eds.; Springer Proceedings in Business and Economics; Springer International Publishing: Cham, Switzerland, 2017; pp. 341–352. ISBN 978-3-319-62937-7. [Google Scholar]
- Borawska, A.; Borawski, M.; Piwowarski, M. Techniques of Cognitive Neuroscience in the Assessment and Measurement of Environmental Public Service Announcements Effectiveness. In Proceedings of the 23rd World Multi-Conference on Systemics, Cybernetics and Informatics, Orlando, FL, USA, 6–9 July 2019; International Institute of Informatics and Systemics: Winter Garden, FL, USA, 2019; Volume 1, pp. 110–115. [Google Scholar]
- Sawe, N. Adapting Neuroeconomics for Environmental and Energy Policy. Behav. Public Policy 2019, 3, 17–36. [Google Scholar] [CrossRef] [Green Version]
- Wymer, W. Developing More Effective Social Marketing Strategies. J. Soc. Mark. 2011, 1, 17–31. [Google Scholar] [CrossRef]
- Raab, M.; Rocha, J. Campaigns to End Violence against Women and Girls; UN Women: New York, NY, USA, 2011. [Google Scholar]
- Donovan, R.J.; Henley, N. Social Marketing: Principles and Practice; IP Communications: Melbourne, Australia, 2003; ISBN 978-0-9578617-5-6. [Google Scholar]
- Varcoe, J. Assessing the Effectiveness of Social Marketing; ESOMAR®—The World Association of Research Professionals: Lincoln, NE, USA, 2004. [Google Scholar]
- Basil, M.D. Research and Evaluation in Social Marketing. In Social Marketing in Action; Basil, D.Z., Diaz-Meneses, G., Basil, M.D., Eds.; Springer International Publishing: Cham, Switzerland, 2019; pp. 45–57. ISBN 978-3-030-13019-0. [Google Scholar]
- Andrews, J.C.; Shimp, T.A. Advertising, Promotion and Other Aspects of Integrated Marketing Communication, 10th ed.; Cengage: Mason, OH, USA, 2017; ISBN 978-1-337-28265-9. [Google Scholar]
- Daymon, C.; Holloway, I. Qualitative Research Methods in Public Relations and Marketing Communications, 2nd ed.; Routledge: New York, NY, USA, 2011; ISBN 978-0-415-47117-6. [Google Scholar]
- Hakim, A.; Levy, D.J. A Gateway to Consumers’ Minds: Achievements, Caveats, and Prospects of Electroencephalography-based Prediction in Neuromarketing. WIREs Cogn. Sci. 2019, 10, e1485. [Google Scholar] [CrossRef] [PubMed]
- Smithson, J. Using and Analysing Focus Groups: Limitations and Possibilities. Int. J. Soc. Res. Methodol. 2000, 3, 103–119. [Google Scholar] [CrossRef]
- Gordon, R.; Ciorciari, J. Social Marketing Research and Cognitive Neuroscience. In Formative Research in Social Marketing; Kubacki, K., Rundle-Thiele, S., Eds.; Springer: Singapore, 2017; pp. 145–163. ISBN 978-981-10-1827-5. [Google Scholar]
- Wilkinson, D.; Birmingham, P. Using Research Instruments: A Guide for Researchers; RoutledgeFalmer: London, UK, 2003; ISBN 978-0-203-42299-1. [Google Scholar]
- French, J.; Gordon, R. Strategic Social Marketing: For Behaviour and Social Change, 2nd ed.; SAGE: Thousand Oaks, CA, USA, 2019; ISBN 978-1-5264-4604-6. [Google Scholar]
- Basil, M. Survey for Formative Research. In Formative Research in Social Marketing; Kubacki, K., Rundle-Thiele, S., Eds.; Springer: Singapore, 2017; pp. 251–263. ISBN 978-981-10-1827-5. [Google Scholar]
- Neeley, S.M.; Cronley, M.L. When Research Participants Don’t Tell It like It Is: Pinpointing the Effects of Social Desirability Bias Using Self vs. In direct-Questioning. In NA-Advances in Consumer Research; Kahn, B.E., Luce, M.L., Eds.; Association for Consumer Research: Valdosta, GA, USA, 2004; Volume 31, pp. 432–433. [Google Scholar]
- Cummings, R.G.; Harrison, G.W.; Rutström, E.E. Homegrown Values and Hypothetical Surveys: Is the Dichotomous Choice Approach Incentive-Compatible? Am. Econ. Rev. 1995, 85, 260–266. [Google Scholar]
- Bagozzi, R.P. The Role of Psychophysiology in Consumer Research. In Handbook of Consumer Behavior; Robertson, T.S., Kassarjian, H.H., Eds.; Prentice-Hall: Upper Saddle River, NJ, USA, 1991; pp. 124–161. [Google Scholar]
- List, J.A.; Gallet, C.A. What Experimental Protocol Influence Disparities between Actual and Hypothetical Stated Values? Environ. Resour. Econ. 2001, 20, 241–254. [Google Scholar] [CrossRef]
- Vecchiato, G.; Astolfi, L.; De Vico Fallani, F.; Toppi, J.; Aloise, F.; Bez, F.; Wei, D.; Kong, W.; Dai, J.; Cincotti, F.; et al. On the Use of EEG or MEG Brain Imaging Tools in Neuromarketing Research. Comput. Intell. Neurosci. 2011, 2011, 643489. [Google Scholar] [CrossRef] [Green Version]
- Johansson, P.; Hall, L.; Sikström, S.; Tärning, B.; Lind, A. How Something Can Be Said about Telling More than We Can Know: On Choice Blindness and Introspection. Conscious. Cogn. 2006, 15, 673–692. [Google Scholar] [CrossRef]
- McDonald, C. Is Your Advertising Working? A Guide to Evaluating Campaign Performance; World Advertising Research Center: Henley-on-Thames, UK; Oxfordshire, UK; Washington, DC, USA, 2003; ISBN 978-1-84116-139-6. [Google Scholar]
- Vecchiato, G.; Di Flumeri, G.; Maglione, A.G.; Cherubino, P.; Kong, W.; Trettel, A.; Babiloni, F. An Electroencephalographic Peak Density Function to Detect Memorization during the Observation of TV Commercials. In Proceedings of the 2014 36th Annual International Conference of the IEEE Engineering in Medicine and Biology Society, Chicago, IL, USA, 26–30 August 2014; IEEE: Chicago, IL, USA, 2014; pp. 6969–6972. [Google Scholar]
- Micu, A.C.; Plummer, J.T. Measurable Emotions: How Television Ads Really Work: Patterns of Reactions to Commercials Can Demonstrate Advertising Effectiveness. JAR 2010, 50, 137–153. [Google Scholar] [CrossRef]
- Varan, D.; Lang, A.; Barwise, P.; Weber, R.; Bellman, S. How Reliable Are Neuromarketers’ Measures of Advertising Effectiveness? Data from Ongoing Research Holds No Common Truth among Vendors. JAR 2015, 55, 176–191. [Google Scholar] [CrossRef] [Green Version]
- Kable, J.W. The Cognitive Neuroscience Toolkit for the Neuroeconomist: A Functional Overview. J. Neurosci. Psychol. Econ. 2011, 4, 63–84. [Google Scholar] [CrossRef] [PubMed] [Green Version]
- Harris, J.M.; Ciorciari, J.; Gountas, J. Consumer Neuroscience for Marketing Researchers. J. Consum. Behav. 2018, 17, 239–252. [Google Scholar] [CrossRef]
- Berns, G.S.; Moore, S.E. A Neural Predictor of Cultural Popularity. J. Consum. Psychol. 2012, 22, 154–160. [Google Scholar] [CrossRef]
- Falk, E.B.; Berkman, E.T.; Mann, T.; Harrison, B.; Lieberman, M.D. Predicting Persuasion-Induced Behavior Change from the Brain. J. Neurosci. 2010, 30, 8421–8424. [Google Scholar] [CrossRef] [PubMed]
- Falk, E.B.; Berkman, E.T.; Lieberman, M.D. From Neural Responses to Population Behavior: Neural Focus Group Predicts Population-Level Media Effects. Psychol. Sci. 2012, 23, 439–445. [Google Scholar] [CrossRef] [PubMed]
- Lim, W.M. Demystifying Neuromarketing. J. Bus. Res. 2018, 91, 205–220. [Google Scholar] [CrossRef]
- Harris, J.M.; Ciorciari, J.; Gountas, J. Consumer Neuroscience and Digital/Social Media Health/Social Cause Advertisement Effectiveness. Behav. Sci. 2019, 9, 42. [Google Scholar] [CrossRef] [PubMed] [Green Version]
- Guixeres, J.; Bigné, E.; Ausín Azofra, J.M.; Alcañiz Raya, M.; Colomer Granero, A.; Fuentes Hurtado, F.; Naranjo Ornedo, V. Consumer Neuroscience-Based Metrics Predict Recall, Liking and Viewing Rates in Online Advertising. Front. Psychol. 2017, 8, 1808. [Google Scholar] [CrossRef] [PubMed]
- Matukin, M.; Ohme, R.; Boshoff, C. EEG-Based Measures versus Panel Ratings: Predicting Social-Media Based Behavioral Responses to Super Bowl Ads. J. Adv. Res. 2016, 56, 205. [Google Scholar] [CrossRef]
- Venkatraman, V.; Dimoka, A.; Pavlou, P.A.; Vo, K.; Hampton, W.; Bollinger, B.; Hershfield, H.E.; Ishihara, M.; Winer, R.S. Predicting Advertising Success beyond Traditional Measures: New Insights from Neurophysiological Methods and Market Response Modeling. J. Mark. Res. 2015, 52, 436–452. [Google Scholar] [CrossRef] [Green Version]
- Vecchiato, G.; Maglione, A.G.; Cherubino, P.; Wasikowska, B.; Wawrzyniak, A.; Latuszynska, A.; Latuszynska, M.; Nermend, K.; Graziani, I.; Leucci, M.R.; et al. Neurophysiological Tools to Investigate Consumer’s Gender Differences during the Observation of TV Commercials. Comput. Math. Methods Med. 2014, 2014, 1–12. [Google Scholar] [CrossRef] [PubMed]
- Briesemeister, B.B.; Tamm, S.; Heine, A.; Jacobs, A.M. Approach the Good, Withdraw from the Bad—A Review on Frontal Alpha Asymmetry Measures in Applied Psychological Research. Psychology 2013, 4, 261–267. [Google Scholar] [CrossRef] [Green Version]
- Touchette, B.; Lee, S.-E. Measuring Neural Responses to Apparel Product Attractiveness: An Application of Frontal Asymmetry Theory. Cloth. Text. Res. J. 2017, 35, 3–15. [Google Scholar] [CrossRef]
- Kong, W.; Zhao, X.; Hu, S.; Vecchiato, G.; Babiloni, F. Electronic Evaluation for Video Commercials by Impression Index. Cogn. Neurodyn. 2013, 7, 531–535. [Google Scholar] [CrossRef] [PubMed] [Green Version]
- Deitz, G.D.; Royne, M.B.; Peasley, M.C.; Huang, J. “Coco” EEG-Based Measures versus Panel Ratings: Predicting Social-Media Based Behavioral Responses to Super Bowl Ads. J. Adv. Res. 2016, 56, 217. [Google Scholar] [CrossRef]
- Alonso Dos Santos, M.; Calabuig Moreno, F. Assessing the Effectiveness of Sponsorship Messaging: Measuring the Impact of Congruence through Electroencephalogram. IJSMS 2018, 19, 25–40. [Google Scholar] [CrossRef]
- Brodie, R.J.; Hollebeek, L.D.; Jurić, B.; Ilić, A. Customer Engagement: Conceptual Domain, Fundamental Propositions, and Implications for Research. J. Serv. Res. 2011, 14, 252–271. [Google Scholar] [CrossRef]
- Dmochowski, J.P.; Sajda, P.; Dias, J.; Parra, L.C. Correlated Components of Ongoing EEG Point to Emotionally Laden Attention—A Possible Marker of Engagement? Front. Hum. Neurosci. 2012, 6, 112. [Google Scholar] [CrossRef] [PubMed] [Green Version]
- Hollebeek, L.D.; Glynn, M.S.; Brodie, R.J. Consumer Brand Engagement in Social Media: Conceptualization, Scale Development and Validation. J. Interact. Mark. 2014, 28, 149–165. [Google Scholar] [CrossRef]
- Hollebeek, L. Exploring Customer Brand Engagement: Definition and Themes. J. Strateg. Mark. 2011, 19, 555–573. [Google Scholar] [CrossRef]
- Strecher, V.; McClure, J.; Alexander, G.; Chakraborty, B.; Nair, V.; Konkel, J.; Greene, S.; Couper, M.; Carlier, C.; Wiese, C.; et al. The Role of Engagement in a Tailored Web-Based Smoking Cessation Program: Randomized Controlled Trial. J. Med. Internet Res. 2008, 10, e36. [Google Scholar] [CrossRef] [PubMed]
- Yamada, F. Frontal Midline Theta Rhythm and Eyeblinking Activity during a VDT Task and a Video Game: Useful Tools for Psychophysiology in Ergonomics. Ergonomics 1998, 41, 678–688. [Google Scholar] [CrossRef] [PubMed]
- McMahan, T.; Parberry, I.; Parsons, T.D. Evaluating Player Task Engagement and Arousal Using Electroencephalography. Procedia Manuf. 2015, 3, 2303–2310. [Google Scholar] [CrossRef] [Green Version]
- Vourvopoulos, A.; Bermudez i Badia, S.; Liarokapis, F. EEG Correlates of Video Game Experience and User Profile in Motor-Imagery-Based Brain–Computer Interaction. Vis. Comput. 2017, 33, 533–546. [Google Scholar] [CrossRef]
- Stikic, M.; Berka, C.; Levendowski, D.J.; Rubio, R.F.; Tan, V.; Korszen, S.; Barba, D.; Wurzer, D. Modeling Temporal Sequences of Cognitive State Changes Based on a Combination of EEG-Engagement, EEG-Workload, and Heart Rate Metrics. Front. Neurosci. 2014, 8, 342. [Google Scholar] [CrossRef] [PubMed] [Green Version]
- Pope, A.T.; Bogart, E.H.; Bartolome, D.S. Biocybernetic System Evaluates Indices of Operator Engagement in Automated Task. Biol. Psychol. 1995, 40, 187–195. [Google Scholar] [CrossRef]
- Arapakis, I.; Barreda-Angeles, M.; Pereda-Banos, A. Interest as a Proxy of Engagement in News Reading: Spectral and Entropy Analyses of EEG Activity Patterns. IEEE Trans. Affect. Comput. 2019, 10, 100–114. [Google Scholar] [CrossRef]
- Short, C.E.; DeSmet, A.; Woods, C.; Williams, S.L.; Maher, C.; Middelweerd, A.; Müller, A.M.; Wark, P.A.; Vandelanotte, C.; Poppe, L.; et al. Measuring Engagement in EHealth and MHealth Behavior Change Interventions: Viewpoint of Methodologies. J. Med. Internet Res. 2018, 20, e292. [Google Scholar] [CrossRef] [PubMed]
- Dulabh, M.; Vazquez, D.; Ryding, D.; Casson, A. Measuring Consumer Engagement in the Brain to Online Interactive Shopping Environments. In Augmented Reality and Virtual Reality; Jung, T., Tom Dieck, M.C., Eds.; Progress in IS; Springer International Publishing: Cham, Switzerland, 2018; pp. 145–165. ISBN 978-3-319-64026-6. [Google Scholar]
- Marques, I.R.; Casais, B.; Camilleri, M.A. The Effect of Macrocelebrity and Microinfluencer Endorsements on Consumer–Brand Engagement in Instagram. In Strategic Corporate Communication in the Digital Age; Camilleri, M.A., Ed.; Emerald Publishing Limited: Bingley, UK, 2021; pp. 131–143. ISBN 978-1-80071-265-2. [Google Scholar]
- Pynta, P.; Seixas, S.A.S.; Nield, G.E.; Hier, J.; Millward, E.; Silberstein, R.B. The Power of Social Television: Can Social Media Build Viewer Engagement?: A New Approach to Brain Imaging of Viewer Immersion. JAR 2014, 54, 71–80. [Google Scholar] [CrossRef] [Green Version]
- Balasubramanian, S.; Gullapuram, S.S.; Shukla, A. Engagement Estimation in Advertisement Videos with EEG. arXiv 2018, arXiv:1812.03364. [Google Scholar]
- Clark, K.R.; Leslie, K.R.; Garcia-Garcia, M.; Tullman, M.L. How Advertisers Can Keep Mobile Users Engaged and Reduce Video-Ad Blocking: Best Practices for Video-Ad Placement and Delivery Based on Consumer Neuroscience Measures. JAR 2018, 58, 311–325. [Google Scholar] [CrossRef]
- Plassmann, H.; Venkatraman, V.; Huettel, S.; Yoon, C. Consumer Neuroscience: Applications, Challenges, and Possible Solutions. J. Mark. Res. 2015, 52, 427–435. [Google Scholar] [CrossRef]
- Klem, G.H.; Lüders, H.O.; Jasper, H.H.; Elger, C. The Ten-Twenty Electrode System of the International Federation. The International Federation of Clinical Neurophysiology. Electroencephalogr. Clin. Neurophysiol. Suppl. 1999, 52, 3–6. [Google Scholar] [PubMed]
- Stone, J.V. Independent Component Analysis: An Introduction. Trends Cogn. Sci. 2002, 6, 59–64. [Google Scholar] [CrossRef]
- Klimesch, W. EEG Alpha and Theta Oscillations Reflect Cognitive and Memory Performance: A Review and Analysis. Brain Res. Rev. 1999, 29, 169–195. [Google Scholar] [CrossRef]
- Borawski, M.; Biercewicz, K.; Duda, J. Determination of the Inaccuracies of Calculated EEG Indices. Sensors 2020, 20, 5715. [Google Scholar] [CrossRef]
- Redfern, N. Age, Gender and Television in the United Kingdom. J. Pop. Telev. 2015, 3, 57–73. [Google Scholar] [CrossRef]


| Indicators | Means of Measurement | |
|---|---|---|
| Awareness | -Percentage of recipients presenting awareness of the issue | -Audience surveys |
| Engagement | -Percentage of recipients involved in the debates and dialogues about the problem -Percentage of recipients who take action to acquire supplementary knowledge about the issue | -Audience surveys -Behavioral data (for example, website hits) |
| Change in behavior | -Percentage of audience members that report behavior change -Percentage of recipients for whom modifications of behavior were noted | -Audience surveys -Behavioral data (dependent on the type of campaign) |
| Social norm | -Percentage of recipients showing positive feelings toward the issue -Percentage of articles and attitudes favorable to the campaign -Legislation introduced on the promoted issue | -Audience surveys -Observations -Anecdotal feedback -Media and policy tracking |
| Wellbeing | -Percentage growth in social outcome -Percentage growth in environmental outcome | -Epidemiological data -Environmental data |
| Measure | Formula | Description |
|---|---|---|
| Attention (theta synchronization, alpha desynchronization) [101] | Brain signal shows an increase in theta activity and a decrease in alpha activity. | |
| Frontal asymmetry (approach-avoidance, interest index) [102,103,104,105,106,107,108,109] | Brain activity registered by left-frontal electrodes is compared with brain activity gathered by the right-frontal electrodes [102]. | |
| Memorization index [105] | The EEG signal is filtered in the theta band, and left-frontal channels are selected. The spatial average is computed for these channels [105]. | |
| Impression index [108] | The impression relates to the interval in which the subject is in the status of both good memorization and high attention [108]. | |
| Neuroengagement score [109] | The score for an individual is calculated by dividing the total area under the waveform corresponding to cortical activity by its standard deviation during stimulus presentation [109]. | |
| Pleasantness index [102] | The brain activity in the theta and alpha frequencies registered by the left-frontal electrodes is compared with the brain activity recorded by the right-frontal electrodes [102]. | |
| Reaction times [110] | The measure shows how quickly the brain responds after the presentation of stimuli [110]. |
| Energa | Turn off… | |||
|---|---|---|---|---|
| Women | Men | Women | Men | |
| Mean | 0.1175 | 0.0007 | −0.3581 | 0.1801 |
| Standard deviation | 1.0244 | 1.1299 | 0.8293 | 1.0491 |
| t | 0.2349 | −1.2506 | ||
| p | 0.8171 | 0.2280 | ||
Publisher’s Note: MDPI stays neutral with regard to jurisdictional claims in published maps and institutional affiliations. |
© 2022 by the authors. Licensee MDPI, Basel, Switzerland. This article is an open access article distributed under the terms and conditions of the Creative Commons Attribution (CC BY) license (https://creativecommons.org/licenses/by/4.0/).
Share and Cite
Borawska, A.; Borawski, M.; Łatuszyńska, M. Effectiveness of Electricity-Saving Communication Campaigns: Neurophysiological Approach. Energies 2022, 15, 1263. https://doi.org/10.3390/en15041263
Borawska A, Borawski M, Łatuszyńska M. Effectiveness of Electricity-Saving Communication Campaigns: Neurophysiological Approach. Energies. 2022; 15(4):1263. https://doi.org/10.3390/en15041263
Chicago/Turabian StyleBorawska, Anna, Mariusz Borawski, and Małgorzata Łatuszyńska. 2022. "Effectiveness of Electricity-Saving Communication Campaigns: Neurophysiological Approach" Energies 15, no. 4: 1263. https://doi.org/10.3390/en15041263
APA StyleBorawska, A., Borawski, M., & Łatuszyńska, M. (2022). Effectiveness of Electricity-Saving Communication Campaigns: Neurophysiological Approach. Energies, 15(4), 1263. https://doi.org/10.3390/en15041263