Abstract
Africa’s rapidly growing population is exerting a lot of pressure on agricultural resources including maize yields and harvest area. Across Africa, access to advanced options for increasing maize yields are inadequate. This is daunting as most of the cultivation of maize is in the hands of smallholder farmers who have inadequate access to modern methods of farming. This has resulted in an increase in dependency on harvest area to increase yields. However, it is still unclear how this maize-yield-harvest-area dynamic plays out across different regions of Africa. This study uses crop yield and harvest area time series data from FAOSTAT for the period 1961–2019. The data are analyzed using linear interpolation, the normalization technique, the rate of change, the Pearson correlation coefficient, the coefficient of determination and regression analysis. The results show that maize yields and harvest area have increased by 71.35% and 60.12%, respectively across Africa. Regionally, West, Middle and East Africa witnessed a positive relationship between maize yields and harvest area while in North and Southern Africa, maize yields and harvest area have an inverse relationship. For example, in assessing the relationship between maize yield and harvest area in Africa, this work observes that North Africa has a correlation of −35% and an R2 of 12%, while Southern Africa has a correlation of −36% and R2 of 13%. On the other hand, West Africa has a correlation of 87% and an R2 of 76%, while Middle Africa recorded a correlation of 66% and an R2 of 42%. East Africa recorded a correlation of 76% and R2 of 61%. These results confirm that maize yield and harvest area have a positive relationship in West, Middle and East Africa and a negative relationship in North and Southern Africa. These results underscore the fact that in North and Southern Africa, maize production is less dependent on harvest area as is the case in the other regions of Africa. Such findings have implications for adaptation planning especially in sub-Saharan Africa where food insecurity is closely related to land and forest degradation.
1. Introduction
Mankind is currently challenged by the global need to produce enough food to feed a rapidly growing world population and thereby reduce hunger and malnutrition [1]. Parallel to this major challenge is that of an increasing population and the situation is daunting as climate change, climate variability and related patterns of land use are rendering the task of producing more food very difficult [2,3,4]. Regarding these issues, Africa is one of the most severely impacted regions of the world, as most crop yields in general and maize yields continue to be affected by climatic and non-climatic drivers, thereby affecting the continent’s food security [4,5].
To grapple with these challenges, farmers have resorted to actions which have triggered further environmental repercussions on the environment and in other sectors of the economy in Africa (maladaptation). Indeed, many farmers have resorted to increasing their harvest area with the aim of enhancing maize yield [6]. The repercussions of this are a short-term increase in maize production, and parallel long-term damages caused to the environment such as increased deforestation, soil erosion, reduced soil organic carbon and reduced carbon dioxide sequestration [6].
In Africa, maize production is peculiar because maize is the second most cultivated crop on the continent [7]. Additionally, maize is peculiar because in Africa, it is cultivated essentially by smallholder peasant farmers who do not have adequate access to capital to invest in modern yield improvement methods or adaptation options. As such, the smallholder farmers often depend on increasing harvest area in bids aimed at increasing production [8]. These current challenges are even more daunting and warrant a better understanding as the demand for increased food production is expected to double by 2050 [9]. This surge is being driven by increased consumption of meat and dairy products, and population growth [9,10,11].
In addition, it has been reported that the yields of maize and harvest area may be fluctuating across Africa [9]. However, there are currently no studies that have analyzed this dynamic in enough detail to show how maize yields and harvest area vary from one region of Africa to another. Some authors have attempted a global, regional, and national analysis on maize yield trends to identify areas where crops might have stagnated [11,12,13,14,15,16,17]. However, no spatially detailed assessment of the trends in maize yield and harvest area have been attempted to date across Africa. The only attempt to investigate the maize yield harvest area dynamics is based on a study by Santpoot [18] which examines the drivers of maize yield expansion in sub-Saharan Africa and policies to boost maize production. This current study considers the current patterns of maize yield and harvest area across different regions of Africa based on time series maize yield and harvest area data.
This study proceeds by identifying the changes that these variables have witnessed over time as well as examining the relationship between these two variables as it has been often observed that farmers in the least developed parts of Africa focus their production improvement strategies on bringing more land into production; a practice that triggers maladaptation in the long-term [9]. The fact that agricultural production in most of Africa is in the hands of smallholder farmers makes resorting to more advanced methods of improving yields such as extension workers’ services, agronomic changes, high yielding varieties, soil amendments, fertilizers, machines, and pesticides, among others less accessible. These farmers depend on the false assertion that cultivating more land by increasing harvest area will enhance their yields, but this is not often the case [18]. Bringing more land into production may imply planting more seeds resulting in short term production gains. The fact that maize is the main cereal crop in Africa, and that it is an important staple crop further depicts the importance of maize. Since these dynamics have not been investigated in detail across Africa, this work aims to fill that research gap by identifying recent patterns in maize yield and harvest area across Africa.
2. Materials and Methods
2.1. Data Collection
Maize yield data (hg/ha) and maize harvest area data (ha) were collected from FAOSTAT [8]. These time series data cover the period 1961–2019. The data were first collected for various African countries from which regional annual trends were derived. These data were collected to track maize yield and maize harvest area trends across different African countries. The national time series data were then categorized and aggregated into regional time series for maize and maize harvest area. The aggregated country data were consistent with the regional data for these two variables reported by [8]. The regions included were: North Africa, West Africa, Middle Africa, East Africa, and Southern Africa (Table 1).

Table 1.
Countries included in this analysis.
The data were normalized and commuted into yield and harvest area data for the various regions (see Equation (1)). This is a process of rescaling the data from the original to ease handling, comparison, and interpretation. Values are often within the range 0–1. This is pertinent when using data that have input values and differing scales to ease comparison and computation. It is also important to be able to identify the minimum and the maximum values.
where Y is the normalized output, x is the value to be normalized and max and min are the maximum and minimum values of the time series.
Y = (x − min)/(max − min)
In conducting this research, some data availability constraints were observed. Some countries such as Tunisia, Lesotho, Cape Verde, Comoros, and Swaziland had no data, while others such as Eritrea and Djibouti had no maize yield and harvest area data before 1993 and 1983 respectively. Missing data values were common during the early years of the data compilation series. To complete the missing data, a 5-year linear interpolation average window was used to interpolate the missing data (see Equation (2)). In some countries such as Somalia and Sudan, data quality might be poor due to incomplete information, political strife, unstable institutions, misrepresentation of data and absence of access to proprietary data. Linear interpolation was used to estimate the unknown values or missing data through the known values or available data. Other possible estimation approaches are the regression approach based on ordinary least squared (OLS), method of moments (MOM) or maximum likelihood (MLH) approaches. The parameters estimation approach is also tenable as it uses data assimilation techniques [19]. However, linear interpolation is preferred because it uses the 5-year average to estimate the missing data and thus provides a more realistic estimate.
where x is the known value, Y is the unknown value or missing data, x1 and y1 are the coordinates that are below the known x value and x2 and y2 are the coordinates that are above the x value.
Y = y1 + ((x − x1)/(x2 − x1)) * (y2 − y1)
2.2. Data Analysis
To better understand the trends in maize yield and maize harvest area over time, the data were subjected to further analysis. This was based on the use of the approach for the computation of the rate of change, correlation analysis, coefficient of determination and regression analysis. Previously, normalization and linear interpolation were used to treat the data. These approaches are like those used by [9,20,21,22]. The choice of the regression approach was based on the Akaike Information Criterion (AIC). This was used to decide what model among several (intercept only, linear regression, quadratic and cubic) best fit the data. This criterion was initially proposed by Akaike (1974) [23]. In this case, this work settled for the linear regression model which had the minimum AIC. The equation (Equation (3)) used to compute the AIC is given as:
where ss is the residual sum of squares, n is the sample size (58, i.e., number of years of time series data) and p is the parameters (in this case 2 for maize yield and maize harvest area).
AIC = nlog (ss/n) + 2p
To better understand the changes in yields and maize harvest area, the rate of change approach based on moving averages was employed (Equation (4)). In addition, correlation coefficients between maize yield and harvest area were computed to provide an understanding of the relationship between maize yield and maize harvest area. The correlation coefficient helps to determine if an increase or decrease in maize harvest area is associated with an increase or decrease in maize yield. Equation (5) was used to compute this.
where RCy/ha represents the rate of change in maize yield and harvest area, and V1 and V2 are the yield or harvest area time series at the beginning of the time series and at the end, respectively.
where ρxy is the Pearson product-moment correlation coefficient, Cov(x,y) represents the covariance of variables x and y, σx is the standard deviation of x and σy is the standard deviation of y.
The coefficient of determination, or R2, was also used to compute how well the regression model fits the observed data. In other words, it enhances the evaluation of the extent to which the observed changes in maize yield are accounted for by the linear relationship between maize yield and harvest area. This was computed using Equation (6). To determine the trends in maize yield and harvest area, a regression model was used. This model was selected because it fit the observed data as defined in the Akaike [23] information criterion, used to decide which model fit the observed data best. A similar approach was also used by [20]. The resultant model parameters were used to guide the classification of yields and harvest area trends as follows. If the model was linear with a positive slope/coefficient, then yield and harvest area were increasing. However, if the linear model had a negative slope/coefficient, it showed that the yield or harvest area were declining. Equation (7) was used to fit the regression model.
where SSregression represents the sum squared regression error; SStotal represents the sum squared total error.
where Ym and Ha are maize yield (hg/ha) and harvest area (ha), respectively, b is the slope or coefficient of regression, x is the year and a is the intercept.
To assess the relationship between actual and expected maize yields and maize harvest area, this work had to simulate to estimations of the expected yields and expected harvest areas for each observed yield and harvest level. To accomplish this, the regression approach was employed as specified below:
where Sim.ExpY.Ha represents the simulated maize yield and maize harvest area, i is the intercept and s is the slope while x is the year. For details on the excel functions/codes used in computing the regressions, intercepts, and slopes, see the Supplementary Materials S1 & S2.
Sim.ExpY.Ha = i + sx
3. Results
3.1. Maize Yield Harvest Area Trends in Africa
In Africa, maize yields have assumed an overall rising trend between 1961 and 2019. In fact, they have increased from 499,210 hg/ha in 1961 to 855,422 hg/ha in 2019 (Table 2). Overall, there has been a 71.35% increase in maize yield across Africa. As concerns harvest area, Africa has witnessed a 60.12% increase in harvest area from 23,637,839 ha in 1961 to 37,847,719 ha in 2019 (Figure 1a,b). These findings show that in Africa, there is a strong correlation between maize yields and harvest area, meaning that maize production is strongly tied to harvest area changes. This is evident as most farmers in Africa use extensive farming through harvest area expansion as a means of increasing their crop production.

Table 2.
Change in maize yield and harvest area from 1961 to 2019 across Africa.
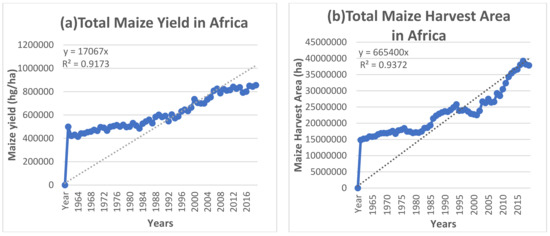
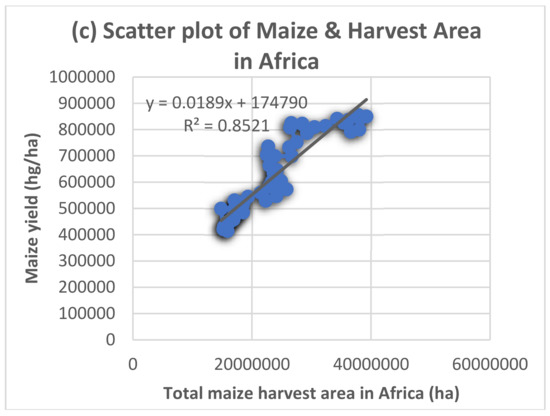
Figure 1.
Time series of (a) maize yield and (b) maize harvest area and (c) a scatter plot of maize yield and harvest area in Africa.
These results show a very strong correlation of 92% between maize yield and harvest area. This is an indication of a very strong linear relationship between maize yield and harvest area in Africa (Table. 3). Therefore, maize production in Africa highly correlates with harvest area. Additionally, these results show a coefficient of determination (R2) of 85% (Figure 1c, Table 2). This relatively high R2 is an indication that much of the variability in maize yields in Africa can be explained by its linear relationship with harvest area. The scatter plots of the relationship between maize yield and harvest area show that for Africa in general, when harvest area increases, maize yield also increases. The latter is justified by the strong correlation and R2 previously reported. The coefficient of the scatter plot is a positive number, and it stands at 0.0189, indicating increasing maize yield and harvest area across most of Africa (Figure 1c).
3.2. Maize Yield Harvest Area Trends in North Africa
In North Africa, maize yields have also assumed an overall increasing trend between 1961 and 2019. They have increased from 52,316 hg/ha in 1961 to 145,706 hg/ha in 2019. The region has witnessed a 178.51% increase in maize yield. In the context of harvest area, North Africa has witnessed a −2.69% decrease in harvest area from 1,090,536 ha in 1961 to 1,061,222 ha in 2019 (Table 2). Unlike the observations obtained at the African scale in general, it can be observed that in North Africa, while maize yields are increasing, harvest area is decreasing. This negative relationship is supported by a correlation of −35% between maize yield and harvest area (Table 2 and Figure 2).
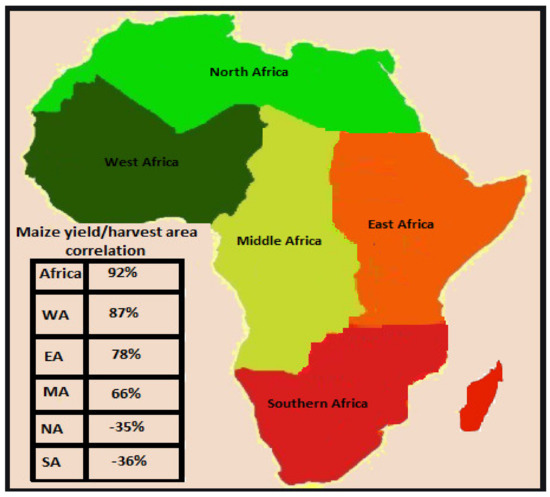
Figure 2.
Correlation between maize yield and harvest area across different regions of Africa.
In addition, an R2 of 12% is recorded for the relationship between maize yields and harvest area (Table 3 and Figure 2). The implication of this is that the relationship between maize yields and harvest area in North Africa is inverse, as seen in the fact that when maize yields are increasing, harvest area is declining (Figure 3). The R2 of 12% shows that maize harvest area only accounts for 12% of the variability in maize yields in North Africa. Unlike in most other parts of Africa, maize production is not often strongly associated with harvest area expansion. It is important to note that even though the increase in maize yield in North Africa is the highest in the continent of Africa, the region is witnessing a decrease in harvest area (Figure 4), which is equally the lowest in Africa throughout most of the series (Figure 4). This underscores the fact that maize yields in North Africa are not highly correlated with harvest area, as is the general trend across Africa. The coefficient of the scatter plot is a negative number, and it stands at −0.1513, underscoring that maize yields and harvest area have an inverse relationship.

Table 3.
Correlation and coefficient of determination (R2) between maize yield and harvest area.
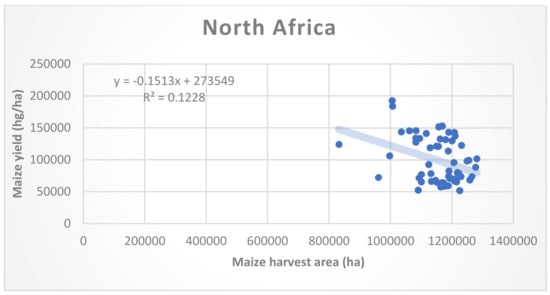
Figure 3.
Scatter plot of the relationship between maize yield and harvest area in North Africa.
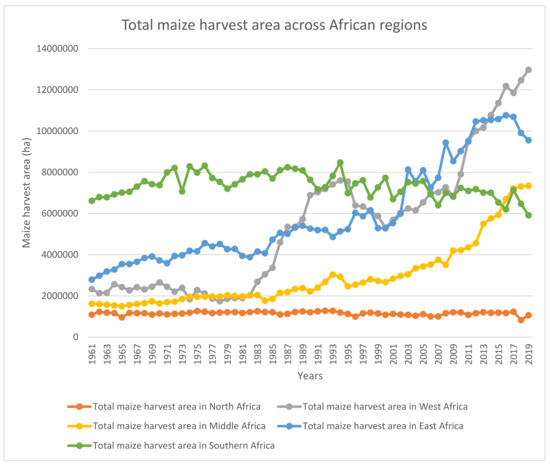
Figure 4.
Harvest area evolution across different African regions between 1961 and 2019.
3.3. Maize Yield Harvest Area Trends in West Africa
In West Africa, maize yield witnessed the second largest increase after North Africa from 96,090 ha/hg to 231,815 ha/hg between 1961 and 2019, respectively (Figure 6, Table 2). This increase in maize yields is equivalent to an about 141.25% increase in maize yields, which is the second largest in Africa. In the context of harvest area, West Africa witnessed an increase from 2,332,309 ha in 1961 to 12,972,300 ha in 2019 (Figure 4, Table 2). The latter is equivalent to an increase of about 456.2%.
On the other hand, West Africa is witnessing the highest increase in harvest area in Africa. In West Africa, the correlation between maize yield and harvest area is the highest of all the regions and it stands at about 87% (Table 3 and Figure 2) backed by an R2 of 76% (Table 3 and Figure 2). The high R2 also shows that about 76% of the variability in maize yields in West Africa can be explained by its linear relationship with harvest area. The resultant scatter plots shows that maize yield increases as harvest area increases (Figure 5). This underscores the importance of harvest area expansion as a means of enhancing production in Africa. The coefficient of the scatter plot is a positive number, and it stands at 0.0101 indicating that maize yield and harvest area have a direct relationship.
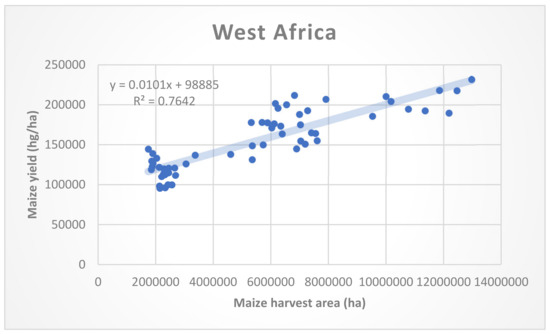
Figure 5.
Scatter plot of the relationship between maize yield and harvest area in West Africa.
3.4. Maize Yield Harvest Area Trends in Middle Africa
In Middle Africa, maize yields have also increased by 29.62%. This includes a shift from 76,482 hg/ha in 1961 to 99,143 hg/ha in 2019 (Figure 6, Table 2). Additionally, harvest area has increased by 353.09%. This has also involved a change from 1,621,270 ha in 1961 to 7,345,883 in 2019 (Figure 4, Table 2). As can be observed, Middle Africa has the fourth largest increase in maize yield in Africa and the second largest increase in harvest area.
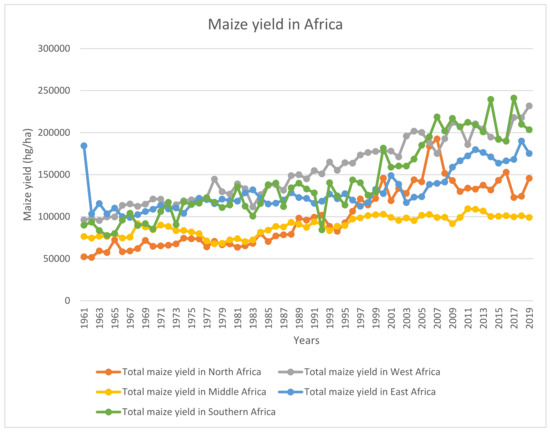
Figure 6.
Maize yield evolution across different African regions between 1961 to 2019.
The relationship between maize yield and harvest area is reflected in a correlation of about 66% and an R2 of 43% (Table 3). The correlation of 66% depicts an above average positive relationship which is further consolidated by the fact that both maize yields and harvest area are increasing (Figure 7 and Figure 2). The R2 of 43% shows that the observed trends in maize yields can only be explained by 43% of the variations in harvest area. In a nutshell, the positive relationship between maize yields and harvest area shows that maize production in Middle Africa is anchored on increases in harvest area. The coefficient of the scatter plot is a positive number, and it stands at 0.0048 indicating that maize yields and harvest area have a direct relationship.
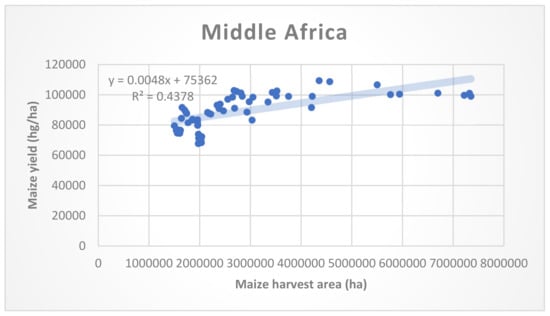
Figure 7.
Scatter plot of the relationship between maize yield and harvest area in Middle Africa.
3.5. Maize Yield Harvest Area Trends in East Africa
In East Africa, maize yield has increased from about 103,338 hg/ha in 1961 to 175,248 hg/ha in 2019. This is associated with a 69% change in maize yields (Figure 2, Table 2). Based on these results, East Africa witnesses an increase in maize yields. In terms of harvest area, East Africa witnessed the third largest increase in harvest area after West Africa, and Middle Africa. Harvest area increased from 2,789,143 ha in 1961 to 9,553,576 ha in 2019, a 242.53% increase (Figure 4, Table 1).
The scatter plot of the relationship between maize yield and forest area shows that as maize yield increases, so also does harvest area. As in West and Middle Africa, there is a positive correlation between maize yield and harvest area (78%) and an R2 of 61% (Figure 8 and Figure 2, Table 3) depicting that 61% of the variations in maize yields can be explained by its linear relationship with harvest area. The R2 and coefficient of the scatter plot are positive numbers, and they stand at about 61% and 0.0079, respectively, indicating that maize yield and harvest area have a direct relationship.
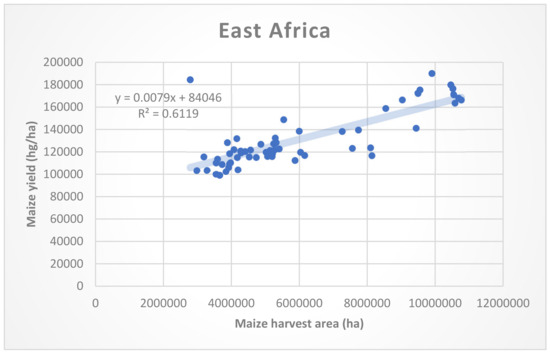
Figure 8.
Scatter plot of the relationship between maize yield and harvest area in East Africa.
3.6. Maize Yield Harvest Area Trends in Southern Africa
After North Africa, Southern Africa witnessed the second largest increase in maize yields of about 126.27%, from 89,938 hg/ha in 1961 to 203,510 hg/ha in 2019 (Figure 3, Table 1). Like North Africa, South Africa also witnessed a decrease in harvest area from 6,615,495 ha in 1961 to about 5,915,291 ha in 2019 (Figure 4, Table 2), this represents a decrease of −10.58%. The correlation between maize yields and harvest area is also negative at −36% showing that an increase in harvest does not necessarily result in an increase in maize yields (Figure 9 and Figure 2). The R2 of 13% further shows that the variations in maize yield can only be explained by 13% of its linear relationship with harvest area (Table 3). Therefore, it can be observed here that most of the increases observed in maize yields in Southern Africa can only be attributed to about 13% of the changes in harvest area. The coefficient of the scatter plot is a negative number, and it stands at −0.0294, indicating that maize yield and harvest area have an inverse relationship.
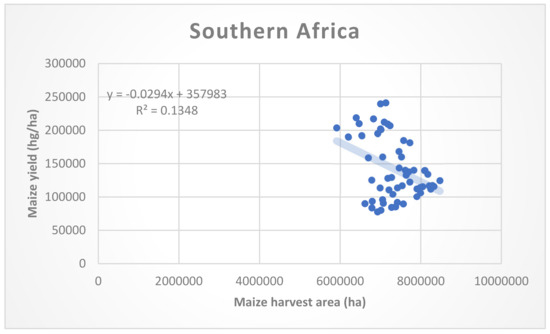
Figure 9.
Scatter plot of the relationship between maize yield and harvest area in South Africa.
3.7. Regional Scatter Plots of Actual Yield vs. Expected Yield and Actual Harvest Area vs. Expected Harvest Area
The scatter plots of the relationship between actual maize yield and expected maize yield are presented in Figure 10. It can be observed that most of the regions have a positive relationship. Within this, West Africa has the highest R2 of 93% followed by North Africa (79%) and Southern Africa (75%). The lowest R2 are recorded in East Africa (52%) and Middle Africa (0.9%) (Figure 10). Except for Middle Africa, all the other regions experience an above-average positive relationship between actual and expected maize yield in Africa. In the context of harvest area, it is observed that there is a strong positive relationship between actual and expected maize harvest area for West Africa, East Africa, and Middle Africa, as depicted by their R2 of 82%, 85% and 73%, respectively. North and Southern Africa record R2 of 4% and 5%, respectively; indicating low dependence on harvest area in these parts of Africa (Figure 11). This is indeed consistent with the negative relationship between maize yield and maize harvest area reported earlier. Additionally, the strong positive relationship depicted in West Africa, East Africa and Middle Africa is also consistent with the strong positive relationship between maize yield and harvest area reported in previous sections.
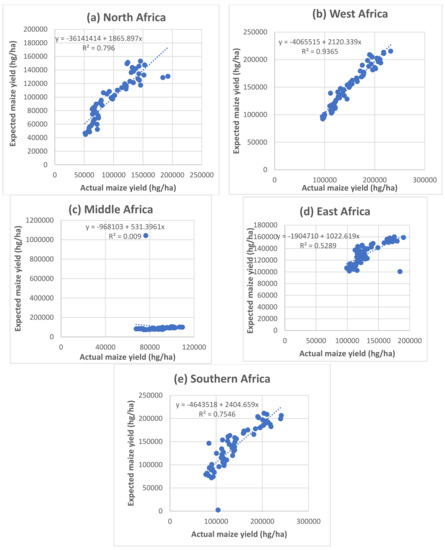
Figure 10.
Scatter plots of actual and expected maize yield in (a) North Africa, (b), West Africa (c), Middle Africa, (d) East Africa, & (e) Southern Africa.
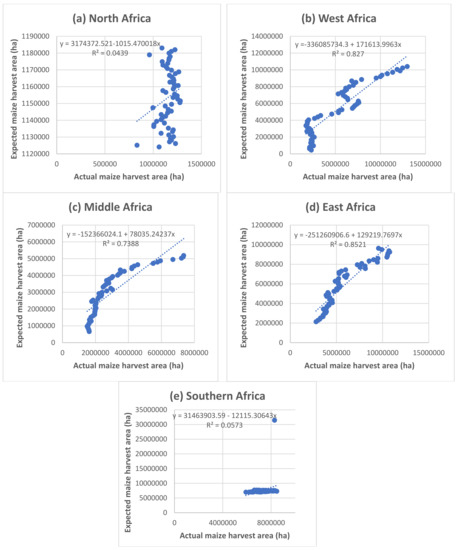
Figure 11.
Scatter plots of actual and expected maize harvest area in (a) North Africa, (b), West Africa (c), Middle Africa, (d) East Africa, & (e) Southern Africa.
4. Discussion
In general, this study has found that there is a positive correlation between maize yields and harvest area in some parts of Africa. This shows that in parts of Africa such as West Africa, Middle Africa and East Africa, maize production is tied to harvest area as efforts to increase maize yields are often associated with increasing maize harvest area. The dependence on extensive farming or harvest area expansion is due mainly to inadequate access to other options of improving maize yields such as extension and agronomic changes, high yielding varieties, soil types, tractors, combined harvesters, and fertilizers [20,21,22,23,24]. Extensive harvest area expansion to increase maize yields in Africa is often associated with maladaptation options such as shifting cultivation, and slash and burn cultivation. In the short term, these land use practices provide more land for cultivation and improve production due to the increase in the net area under cultivation [19,20,21,22]. However, in the long run, these land use practices result in the depletion of soil nutrients, increased exposure to soil erosion, loss of soil organic carbon and land degradation [18,23,25]. In fact, maize harvest area expansion across Africa is often at the expense of forests and grasslands which are increasingly degraded and thus having long-term environmental effects such as reduced carbon dioxide sequestration potential, accentuating climate change. In Africa, West Africa records some of the highest rates in deforestation [19,20,21,22,23,24,25].
Across Africa, this phenomenon of associating maize yields with increased harvest area does, however, vary. For example, in West, Middle and East Africa, the maize yields and harvest area dynamics are consistent with the phenomenon in which maize yield increase is closely related to increasing harvest area [20,22]. This is evident in the positive correlation between maize yield and harvest area. This is associated with the fact that most of the farmers in these regions of Africa are smallholder farmers with inadequate access to high yielding varieties, machines, and fertilizers. As such, they depend on harvest area expansion to increase their crop production [20,22,24].
The phenomenon of enhancing maize production based on increasing harvest area or cutting up more forests that is observed in Africa in general is valid in West, Middle and East Africa but is not consistent with observations in North and Southern Africa [20,22]. Here, maize production and yields are not strongly dependent on harvest area. In the results section, it is observed that in North and Southern Africa, maize yield has an inverse correlation with harvest area. This indicates that maize yields in these regions are not too dependent on expanding harvest area. These regions are the more developed regions of Africa, with more agriculturally intensive sectors that provide better access to high yielding varieties, tractors, pesticides, irrigation, and fertilizers [24]. In fact, maize yields are often complex and are generally determined by climate, soil types, agronomic and extension services, systems of production and crop inputs, among others. The influence of harvest area is often a very minor factor in the entire equation as countries or regions with lower harvest areas such as North and Southern Africa have still recorded high yields.
In sub-Saharan Africa, increased maize production has been associated with an increase in harvest area [26,27]. The harvest area of maize in sub-Saharan Africa excluding Southern Africa, increased by 60% over the past decade [26,28], while during the last 6 decades, the harvest area in the entire African continent increased by 60.12% [29]. Between 1961 and 2019, over 14,209,880 million hectares of land were brought under maize cultivation in Africa [29]. During this same period, Africa witnessed a total increase in maize production of about 356,212 hg/ha. However, it is important to note that in most sub-Saharan African countries, maize cultivation is essentially in the hands of smallholder farmers. Despite this, more large-scale land-based investments have been made to produce maize [26,27,28,29]. According to the land matrix, a global land acquisition observatory, maize is among the crops for which most large-scale land deals have been made [27,28,29,30]. Of the over 538 land deals made, 174 were in sub-Saharan Africa [29]. While the intentions of these land deals are to increase maize production, it has been argued that in the long term, continual expansion of harvest area across sub-Saharan Africa will result in unsustainable food systems as long-term yields will stagnate or even decline due to a reduction in the natural cover of land use [29,31,32].
It is now clear that from these results, considerable investments in maize production are needed in the coming decades to meet the twin challenges of sustaining maize yields and slowing the further expansion of cropland through more intensive methods of cultivation [33]. Ensuring that emphasis is not placed on further harvest area expansion but rather on increasing access to high-yielding varieties, pesticides, fertilizers, irrigation, agronomic and extension services, and machines [34]. These will create room for more intensive farming systems across Africa. More intensive farming systems will go a long way in increasing maize yields as well as in combating deforestation and its effects on the environment, enhancing carbon dioxide sequestration, reducing erosion, and improving soil organic carbon. However, pesticides and fertilizers should be treated with caution as they have the negative potential of degrading the environment [33,35,36,37,38,39]. Maize yields are complex, and their improvement cannot be based on harvest area expansion alone but on several drivers such precipitation, temperature, high-yielding varieties, mechanization, soil types, fertilizers, and pesticides, among others. That some regions of Africa depend heavily on cutting up more forest to increase production should be discouraged through adequate policies that support intensification. When people grow crops on a wider surface area, they are likely to plant more seeds but are not likely to enhance their crop yields if the other considerations listed above are not taken into consideration.
One of the major challenges of carrying out research in Africa has to do with the availability of data and issues of data quality. Carletto et al. [26] remarked that the quality of agricultural statistics in most developing world regions, especially Africa, is low. This is due mainly to a low level of research, extensive fallow lands and inadequate system of data storage, exchange, and transparency. In this work, data were missing for some years for countries such as Eritrea and Djibouti and the linear interpolation approach was used to estimate these missing data. Linear interpolation has been described as a good approach in improving on data quality in many cases of inadequate data [25,40,41,42,43]. In some countries such as Somalia, and Sudan, data quality might be poor due to incomplete information, political strife, unstable institutions, misrepresentation of data and absence of access to proprietary data.
5. Conclusions
This work has found that, except for North and Southern Africa, Africa in general and all other regions witness a strong relationship between maize yield and maize harvest area. In other words, many smallholder farmers depend on expanding their harvest area in attempts to ensure a better harvest. This accounts for high rates of shifting cultivation and bush fallowing in West Africa. This is often associated with inadequate knowledge of and access to other possible farm inputs. As mentioned earlier, maize production is a complex system influenced by several factors that go beyond harvest area. In fact, regions with smaller harvest areas are observed to have higher yields, as seen in the case of North and Southern Africa, due to increased dependence on other aspects of farming inputs, such as fertilizers, irrigation, high-yielding varieties, drought, and pest-resistant varieties inter alia. The increased dependence on harvest area in the other regions is often tied to several challenges such as: 1. Production is essentially in the hands of smallholder peasant farmers who have inadequate access to other options of increasing yields, 2. Additionally, in the face of inadequate farm inputs, farmers often have the perception that the more land they bring into production the higher the yields; while this is true in the short run in terms of maize production, it is often not the case when it comes to maize yields in the long-run. In fact, it is believed that if maize production in West Africa, for example, is intensified, it is very likely that yield will increase beyond the current levels, and this is likely going to impact food security in the region. Going forward, all stakeholders in maize production across Africa must consider empowering farmers such that they can have access to more sustainable intensive farming options rather than depending mostly on harvest area expansion. Access to extension and agronomic services, organic fertilizers, high-yielding varieties and drought tolerant varieties, as well as climate smart information that enhances their access to information related to changes in growing season precipitation, among others, must be enhanced. While these measures can be very pertinent, this work recommends other studies that evaluate the perceptions of maize farmers across sub-national scales to further understand their perceptions on possible ways forward. This work is the first to perform such an assessment at the African scale; it has also attempted to verify the relationship between the observed and simulated maize yield and maize harvest area. However, it is also suggested that satellite imaging of harvest areas be used to verify the connections between yield and harvest area. The current challenge is to be able to access imaging at scales that can provide reliable information, as most of the host satellites are foreign.
Supplementary Materials
The following are available online at https://www.mdpi.com/article/10.3390/agronomy12020374/s1, Supplementary Materials S1 and Supplementary Materials S2.
Author Contributions
T.E.E. designed this study, collected the data, performed the analysis, and wrote the paper. D.D. and A.C. had discussions with T.E.E., made suggestions, analysed the data, edited, and contributed to writing this paper. All authors have read and agreed to the published version of the manuscript.
Funding
This work was supported by a research grant from Mohammed VI Polytechnic University to T.E.E under the auspices of the research grant to professors with grant number UM6P. The link to the funder’s website is: https://www.um6p.ma/en. The funder had no role in the study design, data collection and analysis, decision to publish, or preparation of the manuscript.
Institutional Review Board Statement
Not applicable.
Informed Consent Statement
Not applicable.
Data Availability Statement
All the data used in this work are included in the Supplementary Materials File (S1 & S2).
Acknowledgments
The authors would like to thank UM6P for the funding that led to the realization of this work, as well as to all the authors whose works were consulted.
Conflicts of Interest
The authors declare no conflict of interest.
References
- OECD; FAO. OECD-FAO Agricultural Outlook 2018–2027; OECD Publishing: Paris, France; Food and Agriculture Organization of the United Nations: Rome, Italy, 2018. [Google Scholar]
- FAO. Food Security and Nutrition in the World the State of Building Climate Resilience for Food Security and Nutrition; FAO: Rome, Italy, 2018; Available online: www.fao.org/publications (accessed on 15 March 2021).
- Wheeler, T.; von Braun, J. Climate change impacts on global food security. Science 2013, 341, 508–513. [Google Scholar] [CrossRef] [PubMed]
- Homan, A.L.; Kemanian, A.R.; Forest, C.E. Analysis of climate signals in the crop yield record of sub-Saharan Africa. Glob. Chang. Biol. 2018, 24, 143–157. [Google Scholar]
- Tesfaye, K.; Gbegbelegbe, S.; Cairns, J.E.; Shiferaw, B.; Prasanna, B.M.; Sonder, K.; Boote, K.; Makumbi, D.; Robertson, R. Maize systems under climate change in sub-Saharan Africa. Int. J. Clim. Chang. Strateg. Manag. 2015, 7, 247–271. [Google Scholar] [CrossRef]
- Epule, E.T.; Peng, C.; Lepage, L.; Chen, Z. Forest loss triggers in Cameroon: A quantitative assessment using multiple linear regression approach. J. Geogr. Geol. 2011, 3, 30. [Google Scholar] [CrossRef] [Green Version]
- IPCC. Climate Change and Land. An IPCC Special Report on Climate Change, Desertification, Land Degradation, Sustainable Land Management, Food Security and Greenhouse Gas Fluxes in Terrestrial Ecosystems. 2019. Available online: https://www.ipcc.ch/report/srccl/ (accessed on 2 March 2021).
- FAOSTAT. 2021. Available online: http://www.fao.org/faostat/en/#home (accessed on 2 February 2021).
- Ray, D.K.; Ramankutty, N.; Mueller, N.D.; West, P.; Foley, J.A. Recent patterns of crop yield growth and stagnation. Nat. Commun. 2012, 3, 1293. [Google Scholar] [CrossRef] [Green Version]
- Nolte, K.; Chamberlain, W.; Giger, M. International Land Deals for Agriculture: Fresh insights from the Land Matrix: Analytical Report II; Bern Open Publishing: Bern, Germany, 2016; p. 68. Available online: https://www.ssoar.info/ssoar/handle/document/55664 (accessed on 2 February 2021).
- Foley, J.A.; Ramankutty, N.; Brauman, K.A.; Cassidy, E.S.; Gerber, J.S.; Johnston, M.; Mueller, N.D.; O’Connell, C.; Ray, D.K.; West, P.C.; et al. Solutions for a cultivated planet. Nature 2011, 478, 337–342. [Google Scholar] [CrossRef] [Green Version]
- Cassman, K.G. Ecological intensification of cereal production systems: Yield potential, soil quality, and precision agriculture. Proc. Natl. Acad. Sci. USA 1999, 96, 5952–5959. [Google Scholar] [CrossRef] [Green Version]
- Finger, R. Evidence of slowing yield growth—The example of Swiss cereal yields. Food Policy 2010, 35, 175–182. [Google Scholar] [CrossRef] [Green Version]
- Peltonen-Sainio, P.; Jauhiainen, L.; Laurila, I.P. Cereal yield trends in northern European conditions: Changes in yield potential and its realization. Field Crop. Res. 2009, 110, 85–90. [Google Scholar] [CrossRef]
- Brisson, N.; Gate, P.; Gouache, D.; Charmet, G.; Oury, F.-X.; Huard, F. Why are wheat yields stagnating in Europe? A comprehensive data analysis for France. Field Crop. Res. 2010, 119, 201–212. [Google Scholar] [CrossRef]
- Lin, M.; Huybers, P. Reckoning wheat yield trends. Environ. Res. Lett. 2012, 7, 024016. [Google Scholar] [CrossRef]
- Ladha, J.; Dawe, D.; Pathak, H.; Padre, A.; Yadav, R.; Singh, B.; Singh, Y.; Singh, P.; Kundu, A.; Sakal, R.; et al. How extensive are yield declines in long-term rice–wheat experiments in Asia? Field Crop. Res. 2003, 81, 159–180. [Google Scholar] [CrossRef]
- Santpoort, R. The drivers of maize area expansion in sub-saharan Africa. How policies to boost maize production overlook the interests of smallholder farmers. Land 2020, 9, 68. [Google Scholar] [CrossRef] [Green Version]
- Kostandini, G.; La Rovere, R.; Abdoulaye, T. Potential impacts of increasing average yields and reducing maize yield variability in Africa. Food Policy 2013, 43, 213–226. [Google Scholar] [CrossRef]
- Ray, D.K.; Gerber, J.; MacDonald, G.; West, P. Climate variation explains a third of global crop yield variability. Nat. Commun. 2015, 6, 5989. [Google Scholar] [CrossRef] [Green Version]
- Liu, B.; Asseng, S.; Müller, C.; Ewert, F.; Elliott, J.; Lobell, D.; Martres, P.; Ruane, A.C.; Wallach, D.; Jones, J.W.; et al. Similar estimates of temperature impacts on global wheat yield by three independent methods. Nat. Clim. Chang. 2016, 6, 1130–1136. [Google Scholar] [CrossRef]
- Moore, F.C.; Lobell, D. The fingerprint of climate trends on European crop yields. Proc. Natl. Acad. Sci. USA 2015, 112, 2670–2675. [Google Scholar] [CrossRef] [Green Version]
- Akaike, H. A new look at the statistical model identification. IEEE Trans. Autom. Control 1974, 19, 716–723. [Google Scholar] [CrossRef]
- Gilruth, P.T.; Marsh, S.E.; Itami, R. A dynamic spatial model of shifting cultivation in the highlands of Guinea, West Africa. Ecol. Model. 1995, 79, 179–197. [Google Scholar] [CrossRef]
- Binam, J.N.; Tonyè, J.; Wandji, N.; Nyambi, G.; Akoa, M. Factors affecting the technical efficiency among smallholder farmers in the slash and burn agriculture zone of Cameroon. Food Policy 2004, 29, 531–545. [Google Scholar] [CrossRef]
- Carletto, C.; Jolliffe, D.; Banerjee, R. From Tragedy to Renaissance: Improving Agricultural Data for Better Policies. J. Dev. Stud. 2015, 51, 133–148. [Google Scholar] [CrossRef]
- McNicol, I.; Ryan, C.; Williams, M. How resilient are African woodlands to disturbance from shifting cultivation? Ecol. Appl. 2015, 25, 2320–2336. [Google Scholar] [CrossRef]
- Ramankutty, N.; Evan, A.T.; Monfreda, C.; Foley, J.A. Farming the planet: 1. Geographic distribution of global agricultural lands in the year 2000. Glob. Biogeochem. Cycles 2008, 22, GB1003. [Google Scholar] [CrossRef]
- Ickowitz, A. Shifting cultivation and deforestation in tropical Africa: Critical reflections. Dev. Chang. 2006, 37, 599–626. [Google Scholar] [CrossRef]
- Folberth, C.; Gaiser, T.; Abbaspour, K.C.; Schulin, R.; Yang, H. Regionalization of a large-scale crop growth model for sub-Saharan Africa: Model setup, evaluation, and estimation of maize yields. Agric. Ecosyst. Environ. 2012, 151, 21–33. [Google Scholar] [CrossRef]
- Monfreda, C.; Ramankutty, N.; Foley, J.A. Farming the planet: 2. Geographic distribution of crop areas, yields, physiological types, and net primary production in the year 2000. Glob. Biogeochem. Cycles 2008, 22, GB1022. [Google Scholar] [CrossRef]
- Tilman, D.; Balzer, C.; Hill, J.; Befort, B.L. Global food demand and the sustainable intensification of agriculture. Proc. Natl. Acad. Sci. USA 2011, 108, 20260–20264. [Google Scholar] [CrossRef] [Green Version]
- Godfray, H.C.J.; Beddington, J.R.; Crute, I.R.; Haddad, L.; Lawrence, D.; Muir, J.F.; Pretty, J.; Robinson, S.; Thomas, S.M.; Toulmin, C. Food Security: The Challenge of Feeding 9 Billion People. Science 2010, 327, 812–818. [Google Scholar] [CrossRef] [Green Version]
- Epule, T.E.; New, G.M. Vulnerability of Crop Yields to Variations in Growing Season Precipitation in Uganda; Springer Nature Applied Sciences: Berlin/Heidelberg, Germany, 2019. [Google Scholar] [CrossRef] [Green Version]
- Trueblood, M.A.; Arnade, C. Crop yield convergence: How Russia’s yield performance has compared to global yield leaders. Comp. Econ. Stud. 2001, 43, 59–81. [Google Scholar] [CrossRef]
- Epule, T.E. Contribution of Organic Farming towards Global Food Security: An Overview; Book Chapter One in Book Organic Farming; Elsevier: Amsterdam, The Netherlands, 2019. [Google Scholar] [CrossRef]
- Herrero, M.; Thornton, P.; Power, B.; Bogard, J.; Remans, R.; Fritz, S.; Gerber, J.; Nelson, G.; See, L.; Waha, K.; et al. Farming and the geography of nutrient production for human use: A transdisciplinary analysis. Lancet Planet. Health 2017, 1, e33–e42. [Google Scholar] [CrossRef] [Green Version]
- Samberg, L.H.; Gerber, J.; Ramankutty, N.; Herrero, M.; West, P. Subnational distribution of average farm size and smallholder contributions to global food production. Environ. Res. Lett. 2016, 11, 124010. [Google Scholar] [CrossRef]
- Van Ittersum, M.K.; van Bussel, L.G.J.; Wolf, J.; Grassini, P.; van Wart, J.; Guilpart, N.; Claessens, L.; de Groot, H.; Wiebe, K.; Mason-D’Croz, D.; et al. Can sub-Saharan Africa feed itself? Proc. Natl. Acad. Sci. USA 2016, 113, 14964–14969. [Google Scholar] [CrossRef] [PubMed] [Green Version]
- Epule, T.E.; Bryant, C.R. Maize production responsiveness to land use change and climate trends in Cameroon. Sustainability 2014, 7, 384–397. [Google Scholar] [CrossRef] [Green Version]
- Rurinda, J.; van Wijk, M.; Mapfumo, P.; Descheemaeker, K.; Supit, I.; Giller, K. Climate change and maize yield in southern Africa: What can farm management do? Glob. Chang. Biol. 2015, 21, 4588–4601. [Google Scholar] [CrossRef]
- Bruinsma, J. Expert Meeting on How to Feed the World in 2050 the Resource Outlook to 2050: 1 by How Much Do Land, Water and Crop Yields Need to Increase by 2050? 2009. Available online: http://www.fao.org/3/a-ak971e.pdf (accessed on 19 March 2021).
- Tandzi, L.N.; Mutengwa, C.S. Estimation of maize (Zea mays L.) yield per harvest area: Appropriate methods. Agronomy 2019, 10, 29. [Google Scholar]
Publisher’s Note: MDPI stays neutral with regard to jurisdictional claims in published maps and institutional affiliations. |
© 2022 by the authors. Licensee MDPI, Basel, Switzerland. This article is an open access article distributed under the terms and conditions of the Creative Commons Attribution (CC BY) license (https://creativecommons.org/licenses/by/4.0/).