Article

Checkpoint-Dependent Sensitivities to Nucleoside Analogues Uncover Specific Patterns of Genomic Instability

by
Zainab Burhanuddin Kagalwala
1,2,†,
Mohammed Ayan Chhipa
1,3,†,
Zohreh Kianfard
1,3,
Essam Karam
1,3,
Sirasie P. Magalage
1,3 and
Sarah A. Sabatinos
1,3,*
1
Department of Chemistry and Biology, Faculty of Science, Toronto Metropolitan University, Toronto, ON M5B 2K3, Canada
2
School of Pharmacy, University College London, 29-39 Brunswick Square, Bloomsbury, London WC1N 1AX, UK
3
Yeates School of Graduate Studies, Toronto Metropolitan University, Toronto, ON M5B 2K3, Canada
*
Author to whom correspondence should be addressed.
These authors contributed equally to this work.
Curr. Issues Mol. Biol. 2025, 47(9), 756; https://doi.org/10.3390/cimb47090756
Submission received: 14 July 2025 / Revised: 24 August 2025 / Accepted: 27 August 2025 / Published: 12 September 2025
(This article belongs to the Section Biochemistry, Molecular and Cellular Biology)

Abstract

Nucleoside analogues are used as drugs and as labels in laboratory-based research. However, the effect of different nucleoside analogue mechanism(s) on cell sensitivity or mutagenesis is unclear. This is particularly important in cancer treatments where checkpoint proteins and DNA damage factors are often mutated. We tested six nucleoside analogues in fission yeast, Schizosaccharomyces pombe. We found that the mutations in the DNA replication checkpoint cause unique sensitivity profiles towards chemotherapeutic nucleoside analogues (gemcitabine, 5-fluorouracil, cytarabine) and the non-clinical analogue bromodeoxyuridine. Antiretroviral compounds, zidovudine and lamivudine, did not alter cell growth. We compared half-maximal inhibitory concentration (IC50) doses between checkpoint deficient yeast strains, examining culture growth and DNA mis-segregation. Intriguingly, gemcitabine and bromodeoxyuridine doses above the IC50 promoted better growth. Above each compound’s IC50 dose we saw that cells were insensitive to nucleoside analogue re-exposure, particularly in DNA replication checkpoint mutants (cds1∆, rad3∆). Thus, pairing nucleoside analogue use with personal genomics may inform drug choice, dose, and schedule. Finally, these data indicate that resistance may be predictable, informing clinical strategy.

1. Introduction

Nucleoside analogues mimic DNA/RNA bases. The clinical uses of nucleoside analogues range from cancer chemotherapy to the treatment of Human Immunodeficiency Virus (HIV). Nucleoside analogue drugs work by a variety of mechanisms, often causing DNA replication inhibition and/or DNA damage, e.g., [1,2,3]. Chemotherapeutics gemcitabine, cytarabine (AraC), and 5-fluorouracil (5FU) are antimetabolite prodrugs that are converted into active metabolites in vivo, and inhibit DNA replication in proliferating cells by incorporation, chain termination, and decreased dNTP levels [4]. 5FU also affects mRNA synthesis causing cell death [5,6,7,8]. Bromodeoxyuridine (BrdU) is incorporated into DNA during replication and can be detected using anti-BrdU antibodies [9]. BrdU is used to detect proliferation in laboratory studies [10,11]. Antiretroviral nucleoside analogues, zidovudine (AZT) and lamivudine (3TC), inhibit viral replication through chain termination [12] and are an important component of HIV prophylaxis and treatment regimens. In all these cases, polymerase activity and proliferation are coupled to drug efficacy.
Because of the link between nucleoside analogues and DNA metabolism, exposed cells may arrest in the cell cycle. Cell cycle checkpoints regulate transition between phases of growth, DNA synthesis, and division in response to genome instability [13]. Checkpoint loss in cancer may make cells more sensitive to various drugs. Checkpoint proteins activate regulatory cascades that promote cell cycle arrest and repair [14,15,16,17,18,19]. Checkpoints prevent DNA under-replication, chromosomal changes, and mutations. Loss of checkpoints causes genome instability and induces cycles of DNA damage, chromosome mis-segregation, and aneuploidy, e.g., [20,21,22,23,24]. Mutational changes and genomic instability have a profound impact on the development of cancer in mammals, e.g., [25,26,27,28] and development of heterogeneity within a population of cancer cells or tumour, e.g., [25,26,27]. Cancer cells frequently mutate during drug treatment and adapt, causing a therapeutic obstacle through emergent drug resistance, e.g., [29,30,31].
DNA replication arrest and DNA damage are two potent sources of genomic instability, carcinogenesis, and drug resistance [20,24,26,30,32]. DNA replication instability can be caused by a variety of environmental factors, including changes in nucleotide metabolism [33,34] or polymerase inhibition [35,36,37]. Barriers, including RNA-DNA R-loops and quadruplex DNA, may block unwinding and replication fork movement [38,39,40,41] to cause DNA damage. DNA double strand breaks (DSBs) are considered a particularly lethal form of DNA damage that activate the G2-M DNA damage checkpoint [42,43,44,45]. DSBs are caused by ionizing radiation and some drugs (e.g., phleomycin) [42,44,45,46]. A clinically useful class of DBS drugs includes camptothecin and irinotecan, molecules that bind topoisomerase to the DNA causing DNA replication fork collisions and DSBs in the next S-phase [47,48,49]. DSBs are particularly dangerous if unrepaired by anaphase, causing genome loss or gain in daughter cells, chromosome fusions, telomere loss, and chromosome instability [50,51]. Homologous recombination becomes an important downstream checkpoint response to DSBs and also DNA replication structures [52,53,54].
Some nucleoside analogues are known to cause DNA damage and mutation. Yet, the link between checkpoint kinase function (genotype), initial drug sensitivity, and emergence of resistance is not well described. Replication instability phenotypes, including single-stranded DNA accumulation, ssDNA gaps, and replication fork reversal, can cause DSBs and damage checkpoint effects in replication checkpoint mutants [55,56,57]. We used checkpoint-deficient mutants of fission yeast, Schizosaccharomyces pombe, to test nucleoside analogue sensitivity in either DNA replication or DNA damage checkpoint pathways. These single-gene effects can be used to deconvolve the relationships between dose and resistance. S. pombe is a rod-shaped, unicellular eukaryote that is phylogenetically distinct from the budding yeast Saccharomyces cerevisiae [58,59]. Nucleotide metabolism, chromosome structures, and some DNA damage and repair mechanisms are more similar between S. pombe and humans than in budding yeast [10,58,60]. We tested single-gene loss of function mutations for nucleoside analogue effects, to compare with loss of checkpoint in human disease. Single mutations are stringently defined in our fission yeast model, which is not the case in mammalian cell lines that undergo mutations during transformation.
We developed a rapid proliferative assay to detect S. pombe culture proliferation and survival [61]. These results directly support nucleoside analogue studies in fission yeast performed in our group (Kianfard et al., in preparation; and [10]) and others [11,62,63,64,65]. We found that anticancer nucleoside analogues are most affected by loss of the DNA replication checkpoint (cds1∆, rad3∆ mutants). Loss of the Rad3 apical checkpoint kinase (ATR orthologue; rad3∆ mutant) causes death at the half-maximal inhibitory concentration (IC50) dose. We propose that the IC50 dose is a “crisis point”, above which cell growth becomes less affected and potential for drug resistance increases. Antiretroviral drugs do not affect cell proliferation; thus, AZT and 3TC do not induce a catastrophic checkpoint response. We hypothesise that increased sensitivity to nucleoside analogues in checkpoint mutant cells triggers DNA mis-segregation in replication checkpoint mutant cells (cds1∆, rad3∆). We conclude that nucleoside analogue chemotherapy treatments should be considered in the context of personal genomics, and that nucleoside analogues should not be paired with ATR checkpoint kinase inhibitors clinically.

2. Materials and Methods

2.1. Yeast Strains

Fission yeast cells were cultured following standard conditions, e.g., [66,67]. Cells were grown from frozen stocks on yeast extract with supplements (adenine, histidine, leucine, uracil, lysine; YES 225 formulation, Sunrise Bioscience, San Diego, CA, USA) at 30 °C. Cultures for nucleoside analogue exposure were incubated at 30 °C overnight in pombe minimal glutamate (PMG) media supplemented with uracil and adenine (both 225 mg/L; BioShop, Burlington, ON, Canada). Other supplements were added as appropriate at 225 mg/L. Strain genotypes are listed in Table 1.
Schizosaccharomyces pombe lacks a thymidine salvage pathway. Strains used to assess nucleoside analogue sensitivity contained Herpes Simplex Virus 1 (HSV1) thymidine kinase that was stably integrated and expressed from a constitutive alcohol dehydrogenase promoter (Padh1-hsv-tk+). The human equilibrative nucleoside transporter 1 (hENT1) was stably integrated into strains using the Padh1 promoter (Padh1-hENT1+). Expression of hENT1 allows better nucleoside analogue uptake at lower doses, as described in [10,65].

2.2. Drugs

Nucleoside analogue drugs were resuspended in water or DMSO as stock solutions of 100 µM. The drugs used include gemcitabine (Toronto Research Chemicals, Toronto, ON, Canada), cytarabine (AraC; SigmaAldrich, Mississauga, ON, Canada), 5-fluorouracil (5-FU; BioShop Canada), 5-fluoro-2′-deoxyuridine (FUdR; BioShop Canada), bromodeoxyuridine (BrdU; SigmaAldrich Canada), and thymidine (BioShop, Canada). Antiretroviral compounds zidovudine (AZT) and lamivudine (3TC) were kind donations from Dr. Russell Viirre (Toronto Metropolitan University, Toronto, ON, Canada). Canavanine sulfate (Cedarlane, Burlington, ON, Canada) was added to PMG + HULA medium (Supplementary Figure S1) at 70 µg/mL [68].

2.3. Proliferation Assay and IC50

Liquid culture growth was used to evaluate the dependency of nucleoside analogue response on the cell cycle checkpoint. Decreased proliferation in the drug could indicate cell death or arrest. S. pombe checkpoint mutant cells (Table 1) were grown overnight in pombe minimal glutamate (PMG) media supplemented with 225 mg/mL uracil and adenine. Cultures were diluted in fresh PMG + UA to an OD600 of approximately 0.1 Diluted cultures were kept at room temperature for 2 h to acclimate. Well plates were prepared containing 200 µL of diluted cells, PMG + UA medium, and drug. Each drug was prepared and used at final concentrations of 0, 0.05, 0.25, 0.5, 2.5, 5.0, 25, 50, 125, 250, 375, and 500 µM; these doses generate an 11-point IC50 curve.
Optical density measurements at a wavelength of 600 nm (OD600) were taken using a spectrophotometer in 96-well growth plates. OD600 readings were taken before static incubation at 30 °C, and after 24 h and 48 h of growth at 30 °C. After the 48 h OD600 reading, 96-well plates were spotted onto yeast extract with supplements (YES; Sunrise Media, Carlsbad, CA, USA) and solid media (1.8% agar; BioShop), prepared and autoclaved as described. Spotting was performed using a 48-array pinner (V&P Scientific, San Diego, CA, USA, 3 µL hanging droplet). Pinned plates were then incubated at 30 °C overnight. The following day, the YES plates were scanned for analysis. Cells were also spotted onto PMG + HULA containing either FUdR or 70 µg/mL canavanine with Phloxine B. Spots were incubated for 3 days (FUdR) or 9 days (canavanine) before assessment.
Aggregate measurements were calculated from 4 replicate experiments. Heat maps were constructed in GraphPad Prism10. For checkpoint mutant sensitivity assessment, the average IC50 and toxic dose values from aggregate values were binned with a 4-point scale: 0 weak effect—500 µM or higher; 1—200 to 500 µM; 2—50 to 200 µM; 3—<50 µM, strong effect. The 4-point scale was used to create a checkpoint dependency prediction heat map for DNA replication checkpoint effects (strongly in rad3∆ and cds1∆) and DNA damage checkpoint effects (chk1∆ and rad3∆ affected).

2.4. Microscopy

Cells were fixed in cold 100% ethanol to a final concentration of 70% ethanol. Samples were vortexed and stored at 4 °C. To stain, fixed cells were rehydrated in water and then incubated in aniline methylene blue solution (AMB; 1% aniline blue water-soluble powder w/v, in 1 × PBS) for 15 min at room temperature. AMB binds to the S. pombe septum and fluoresces to specifically reveal septa. AMB-stained cells were smeared onto glass slides and air dried at room temperature. Samples were mounted in 4 μL of fluorescent imaging mounting medium (50% glycerol, 1% DABCO) containing 1 μg/mL DAPI. Samples were sealed with a coverslip and stored in a light-protected slide box at −20 °C. Cells were imaged on an Olympus IX83 Inverted Microscope (Olympus Corporation, Tokyo, Japan) linked to a Hamamatsu ORCA-Flash 4.0 CMOS digital camera (Hamamatsu Photonics K.K, Hamamatsu, Japan). CellSens acquisition software (Dimension 1.13 Olympus Corporation, Tokyo, Japan) was used to acquire images on DAPI-excitation 359 nm/emission 461 nm, and bright field settings. FIJI software was used to analyse the images [69] version 2.3.0/1.53f.

2.5. Statistical Analysis

IC50 OD600 values were imported into GraphPad Prism 10 for analysis. Drug concentrations were log10-transformed. A 3-parameter, non-linear fit of dose–response was fit to the data. IC50 values were calculated for each independent replicate. Graphs were made using the 48 h OD600 readings for comparison with calculated IC50 values. Replicate IC50 values were averaged and assessed using standard deviation between calculated values. Microscopy images were examined, and cells were measured tip-to-tip or tip-to-septum. A pairwise two-tailed t-test was used to compare cell lengths between treatment conditions and genotypes (GraphPad Prism 10).

3. Results and Discussion

Schizosaccharomyces pombe replication and damage checkpoints are initiated by the Rad3 kinase (Figure 1) [16,70,71]. Cells lacking cds1∆ or rad3∆ cannot activate the Intra-S and S-G2 checkpoints during replication stress; this causes DNA damage. Because the DNA replication checkpoint is important in processing nucleoside analogue effects, cds1∆ cells elongate, accumulate DBSs, and enter a lethal G2 arrest like in hydroxyurea [16,17,72]. Conversely, cells lacking chk1∆ can arrest in S-phase and stabilize DNA replication. However, chk1∆ cells cannot arrest in G2 if there is DNA damage [17,18,70]. Thus, chk1∆ cultures are a test for DSB-specific effects of nucleoside analogues. Because rad3∆ cannot arrest in either DNA replication instability or damage, we predicted that rad3∆ cells are most sensitive to nucleoside analogue effects. We expected that rad3∆ cells would present with DNA mis-segregation and “cell untimely torn” (cut) divisions, in which the septum forms over entangled DNA [73].
We tested thymidine- and cytidine-like nucleoside analogues (Figure 1) in S. pombe strains containing Herpes Simplex Virus (HSV1) thymidine kinase (hsv-tk+) and human equilibrative nucleoside transporter (hENT1+) transgenes (Table 1). Since hsv-tk+ is a thymidine kinase, we hypothesized that thymidine-analogues would show the greatest effects. Because excess thymidine alters dNTP pools and causes S-phase arrest in mammalian cells [74] and fission yeast [10], we predicted that all thymidine analogues would arrest cell growth. BrdU causes mutation and cell death in S. pombe DNA replication checkpoint mutants [10]. We expected lower IC50 values for these cds1∆ and rad3∆ cells.

3.1. Thymidine Analogues Induce Both DNA Replication and DNA Damage Stress

We used our S. pombe-adapted dose–response methods to examine culture growth by OD600 and to calculate half-maximal inhibitory (IC50) doses for each analogue [61]. IC50 values allow comparisons between strain sensitivities and different drugs [61,75]. IC50 values are used to suggest a drug dose that decreases proliferation [75]. Because S. pombe cells elongate during G2-checkpoint arrest, OD600 may increase simply because of bigger cells leading to higher turbidity. To determine if cells were truly dead or merely arrested, we spotted cultures onto drug-free medium after exposure.
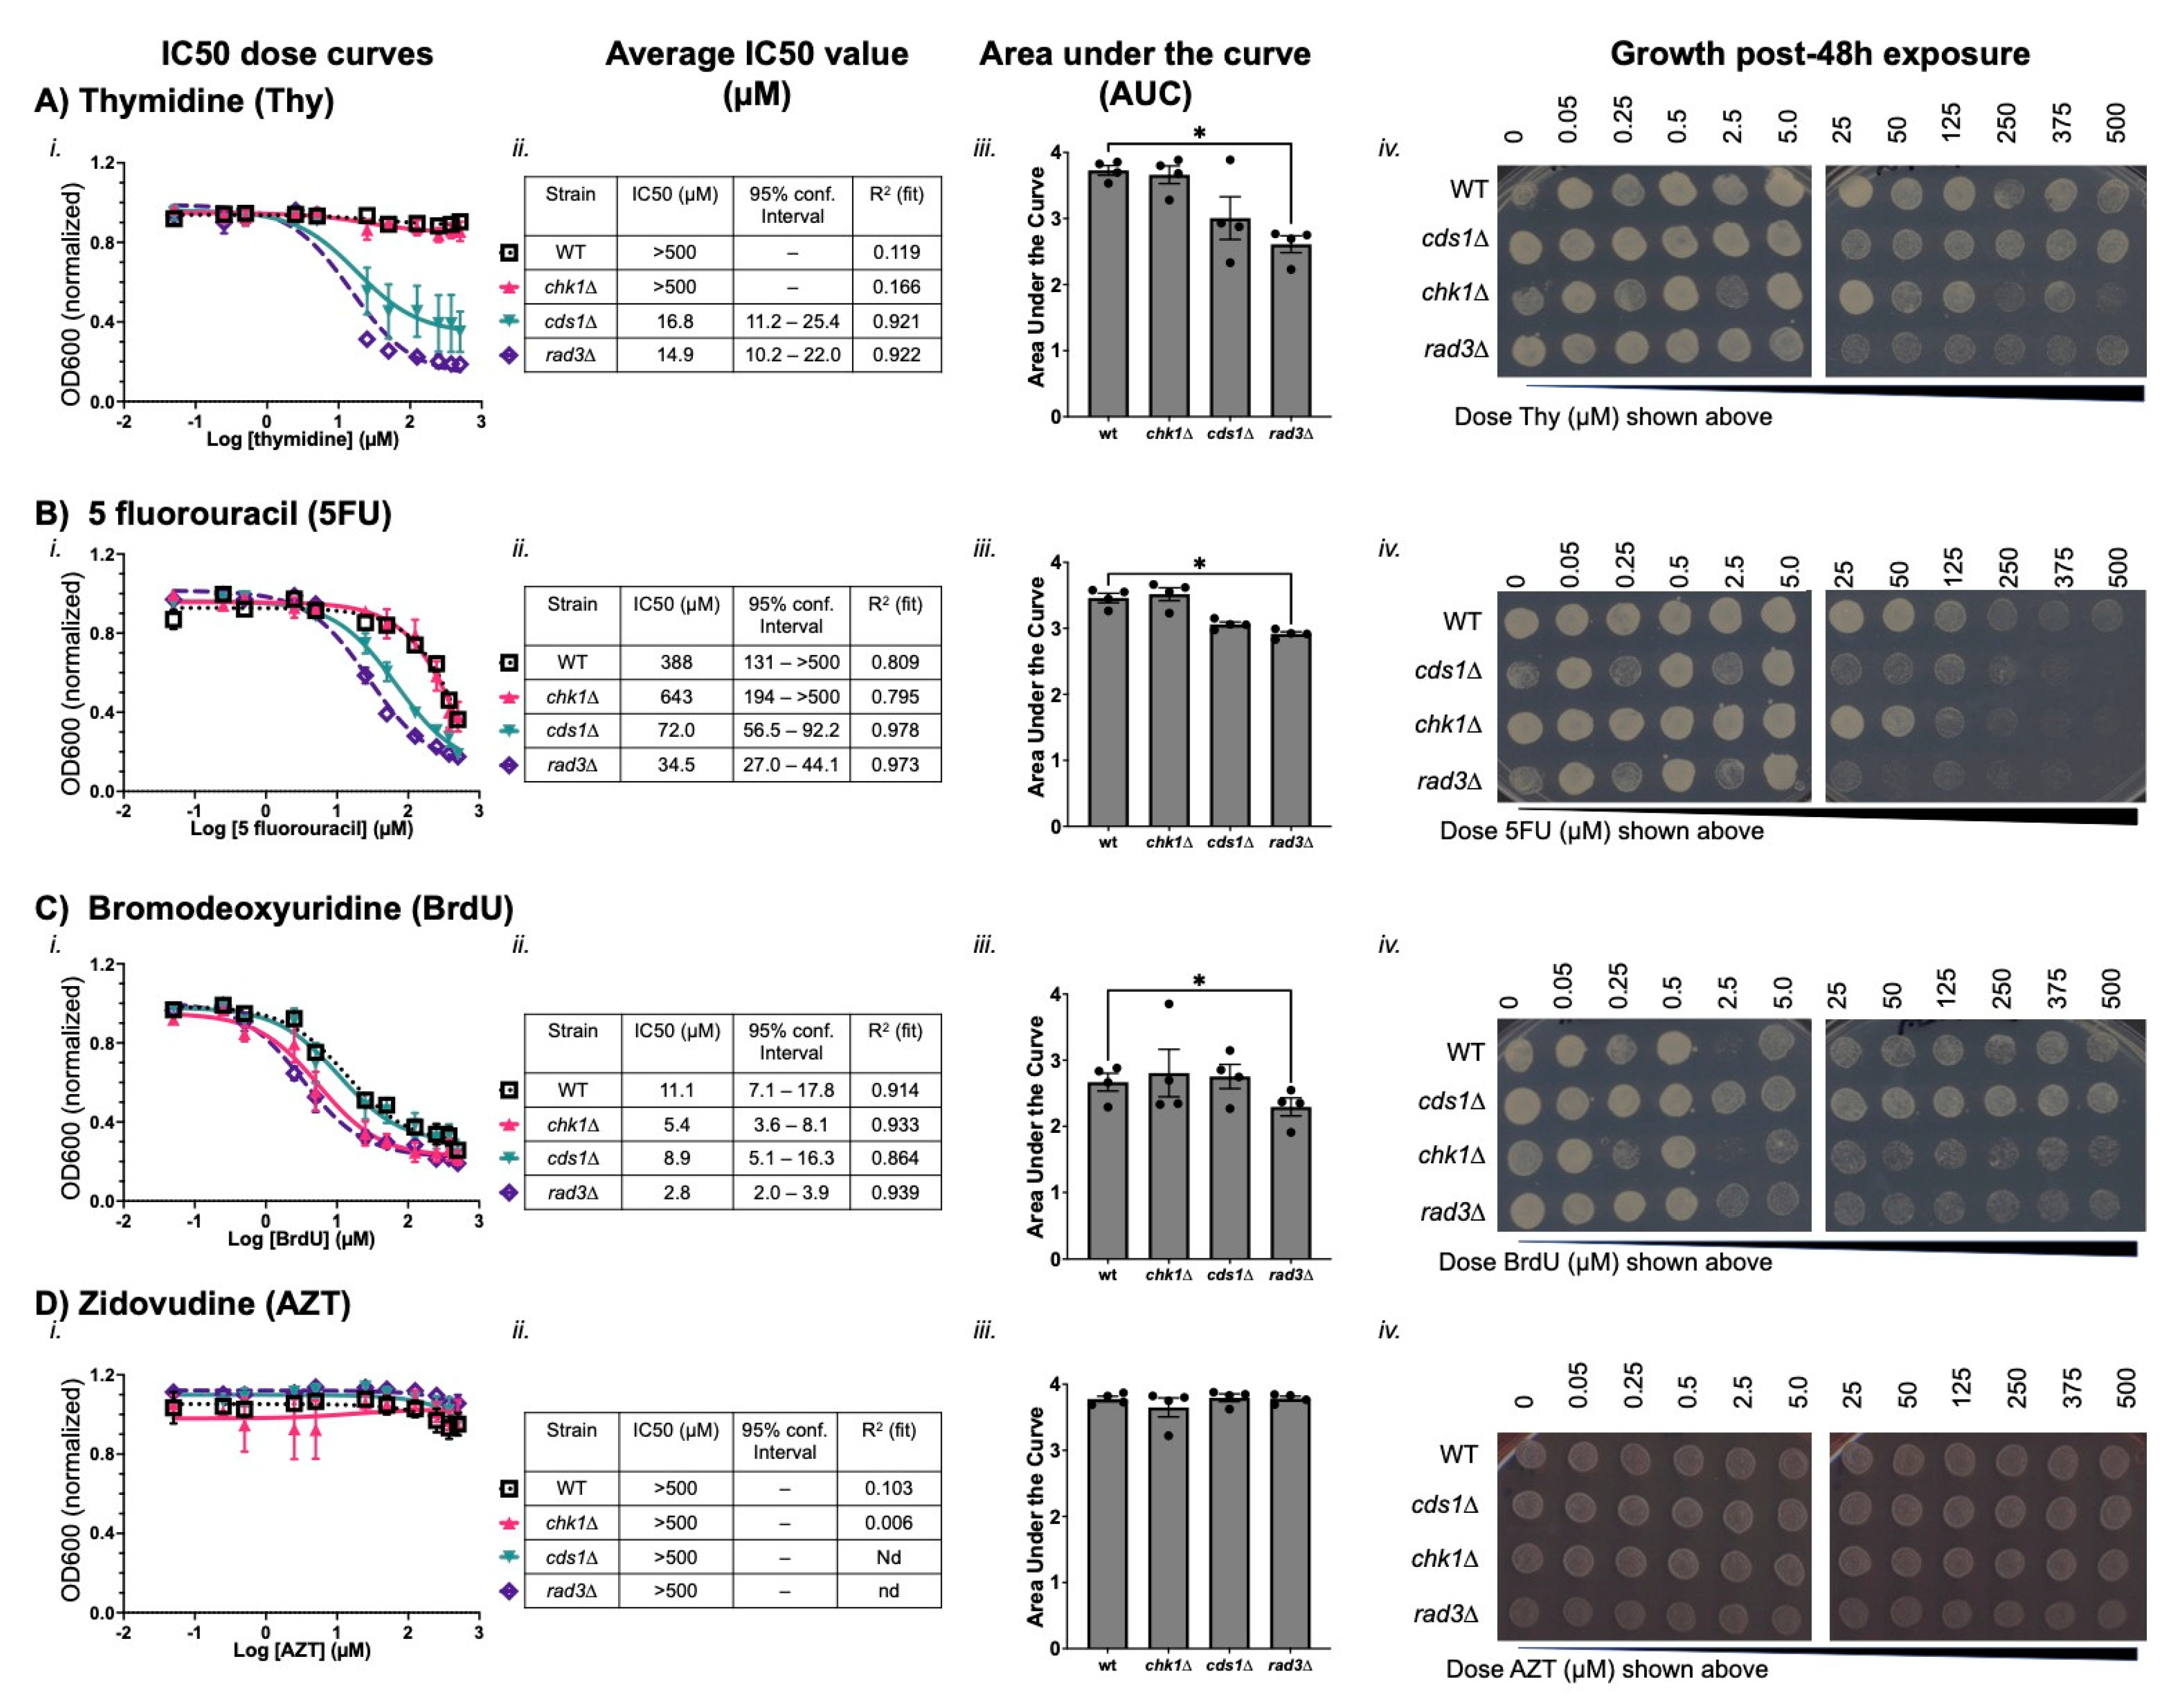
We found that thymidine, 5 fluorouracil (5FU), and bromodeoxyuridine (BrdU) all decreased cds1∆ and rad3∆ mutant cell growth, while zidovudine (AZT) did not. Thymidine IC50 values were 16.8 µM for cds1∆ and 14.9 µM for rad3∆; however, thymidine did not decrease OD600 or generate an IC50 value in wild type or chk1∆. A difference in growth was reflected in area under the curve (AUC), which was significantly lower in rad3∆ than wild type. The rad3∆ spot growth above 5 µM thymidine was slow with fewer cells per spot (Figure 2(Aiv)). These data confirm that high levels of thymidine are toxic to rad3∆ cells. Cultures of chk1∆ cells had less spot growth at the highest thymidine doses. The fact that cds1∆ cells show similar IC50 curves in liquid growth indicate that thymidine causes DNA replication instability that relies on the DNA replication checkpoint for stability. However, because rad3∆ cells are more sensitive than cds1∆, we infer that thymidine effects are not solely caused by replication checkpoint loss. Instead, chk1∆ growth reduction in spots after exposure to >100 µM thymidine indicates that high-dose thymidine causes genome instability, possibly through DNA damage.
In contrast, 5-fluorouracil (5FU) and bromodeoxyuridine (BrdU) affected the growth of all strains. 5FU was most potent in rad3∆ and cds1∆ (IC50s of 34.5 µM and 72.0 µM, respectively) but 10-fold more 5FU is required to cause growth effects in wild type and chk1∆ (IC50s of 388 µM and 643 µM). Spot growth after 48 h of 5FU exposure is minimal in rad3∆ and cds1∆ above 5 µM (Figure 2B). Wild type and chk1∆ cells have reduced spot growth > 50 µM. In all cases, the concentrations at which we observed reduced spot growth (Figure 2(Biv)) were lower than the calculated IC50s.
These data indicate that 5FU effects require the DNA replication checkpoint to preserve viability. However, even replication-checkpoint competent cells are sensitive to high doses of 5FU, which impairs cell growth. This may reflect that the primary mechanism of 5FU is reportedly upon RNA synthesis [5,6,7,8]; consequently, all our mutants tested would be susceptible to 5FU effects. While chk1∆ growth is similar to wild type after 5FU, the subtle difference in IC50 and maximum unaffected doses in spots argues that impact of DNA damage checkpoint loss should be investigated for differences in mutation kind and profile (i.e., [76]).
We found that BrdU also decreased OD600 and spot growth in all strains, and at lower doses than 5FU. BrdU is an important molecular tool to monitor DNA synthesis. Yet, the potential BrdU effects on DNA damage and proliferation are frequently overlooked in the interest of the desired experimental goal. BrdU IC50 values ranged from 2.8 µM in rad3∆ to 11.1 µM in wild type (Figure 2(Ci,Cii)). AUC for rad3∆ was significantly different from wild type (p < 0.05, Figure 2(Ciii)). While all spots showed diminished growth above 2.5 µM BrdU, cds1∆ spots were less affected by BrdU treatment (Figure 2(Civ)). Intriguingly, chk1∆ cells showed less growth by IC50 (5.4 µM) and in spots compared to cds1∆. These data indicate that BrdU generates substantial DNA damage that may be more impactful than its effect on DNA replication stability. Because cds1∆ cells grew better than wild type after BrdU treatment, we conclude that the loss of the DNA replication checkpoint in cds1∆ but presence of the DNA damage checkpoint may improve survival. In contrast, we infer that although OD600 turbidity is decreased in rad3∆ and chk1∆, these cells acquire DNA damage and do not grow in the presence of BrdU. After spotting onto BrdU-free medium to grow post-exposure, the rad3∆ and chk1∆ cells re-enter growth slowly. We conclude that slower rad3∆ or chk1∆ growth in BrdU is caused by DNA damage; these G2/M checkpoint-deficient strains cannot repair or arrest in the presence of BrdU-induced DSBs.
AZT is an antiretroviral polymerase inhibitor that did not inhibit growth in culture (Figure 2(Di)). All strains generated relatively flat dose–growth curves that cannot be used to calculate IC50 values. We reported all IC50 values as >500 µM, the highest dose that we tested. No significant difference in AUC values or spot growth was observed. Cells after 48 h of AZT did not die but grew into full spots, even at 500 µM. We conclude that AZT is a non-toxic thymidine nucleoside analogue that does not impact growth during or after treatment, nor is this dependent on the DNA replication or damage checkpoints. This contrasts with 5FU, BrdU, and thymidine, all which arrest cell growth and cause long-term effects that decrease growth after exposure.

3.2. Cytidine Anticancer Analogues Generate Replication Instability and Not DNA Damage Arrest

Cytidine-related nucleoside analogue drugs include gemcitabine (Gem), cytarabine (AraC), and the antiretroviral lamivudine (3TC). We used the same strains containing HSV1-TK. HSV1-TK is a promiscuous kinase that can phosphorylate a broad array of nucleosides including cytidine [38,40]. Because altered CTP and dCTP levels result in mutagenesis, we hypothesized that HSV1-TK may cause genome instability effects from cytidine nucleoside analogue drugs. If so, cytidine-dependent DNA replication instability and/or DNA damage would be detected in specific checkpoint mutants. We predicted that replication checkpoint kinase mutant cds1∆, or apical kinase rad3∆, would show the least growth in cytidine analogues in our transgenic strains expressing hENT1+ and HSV1-TK.
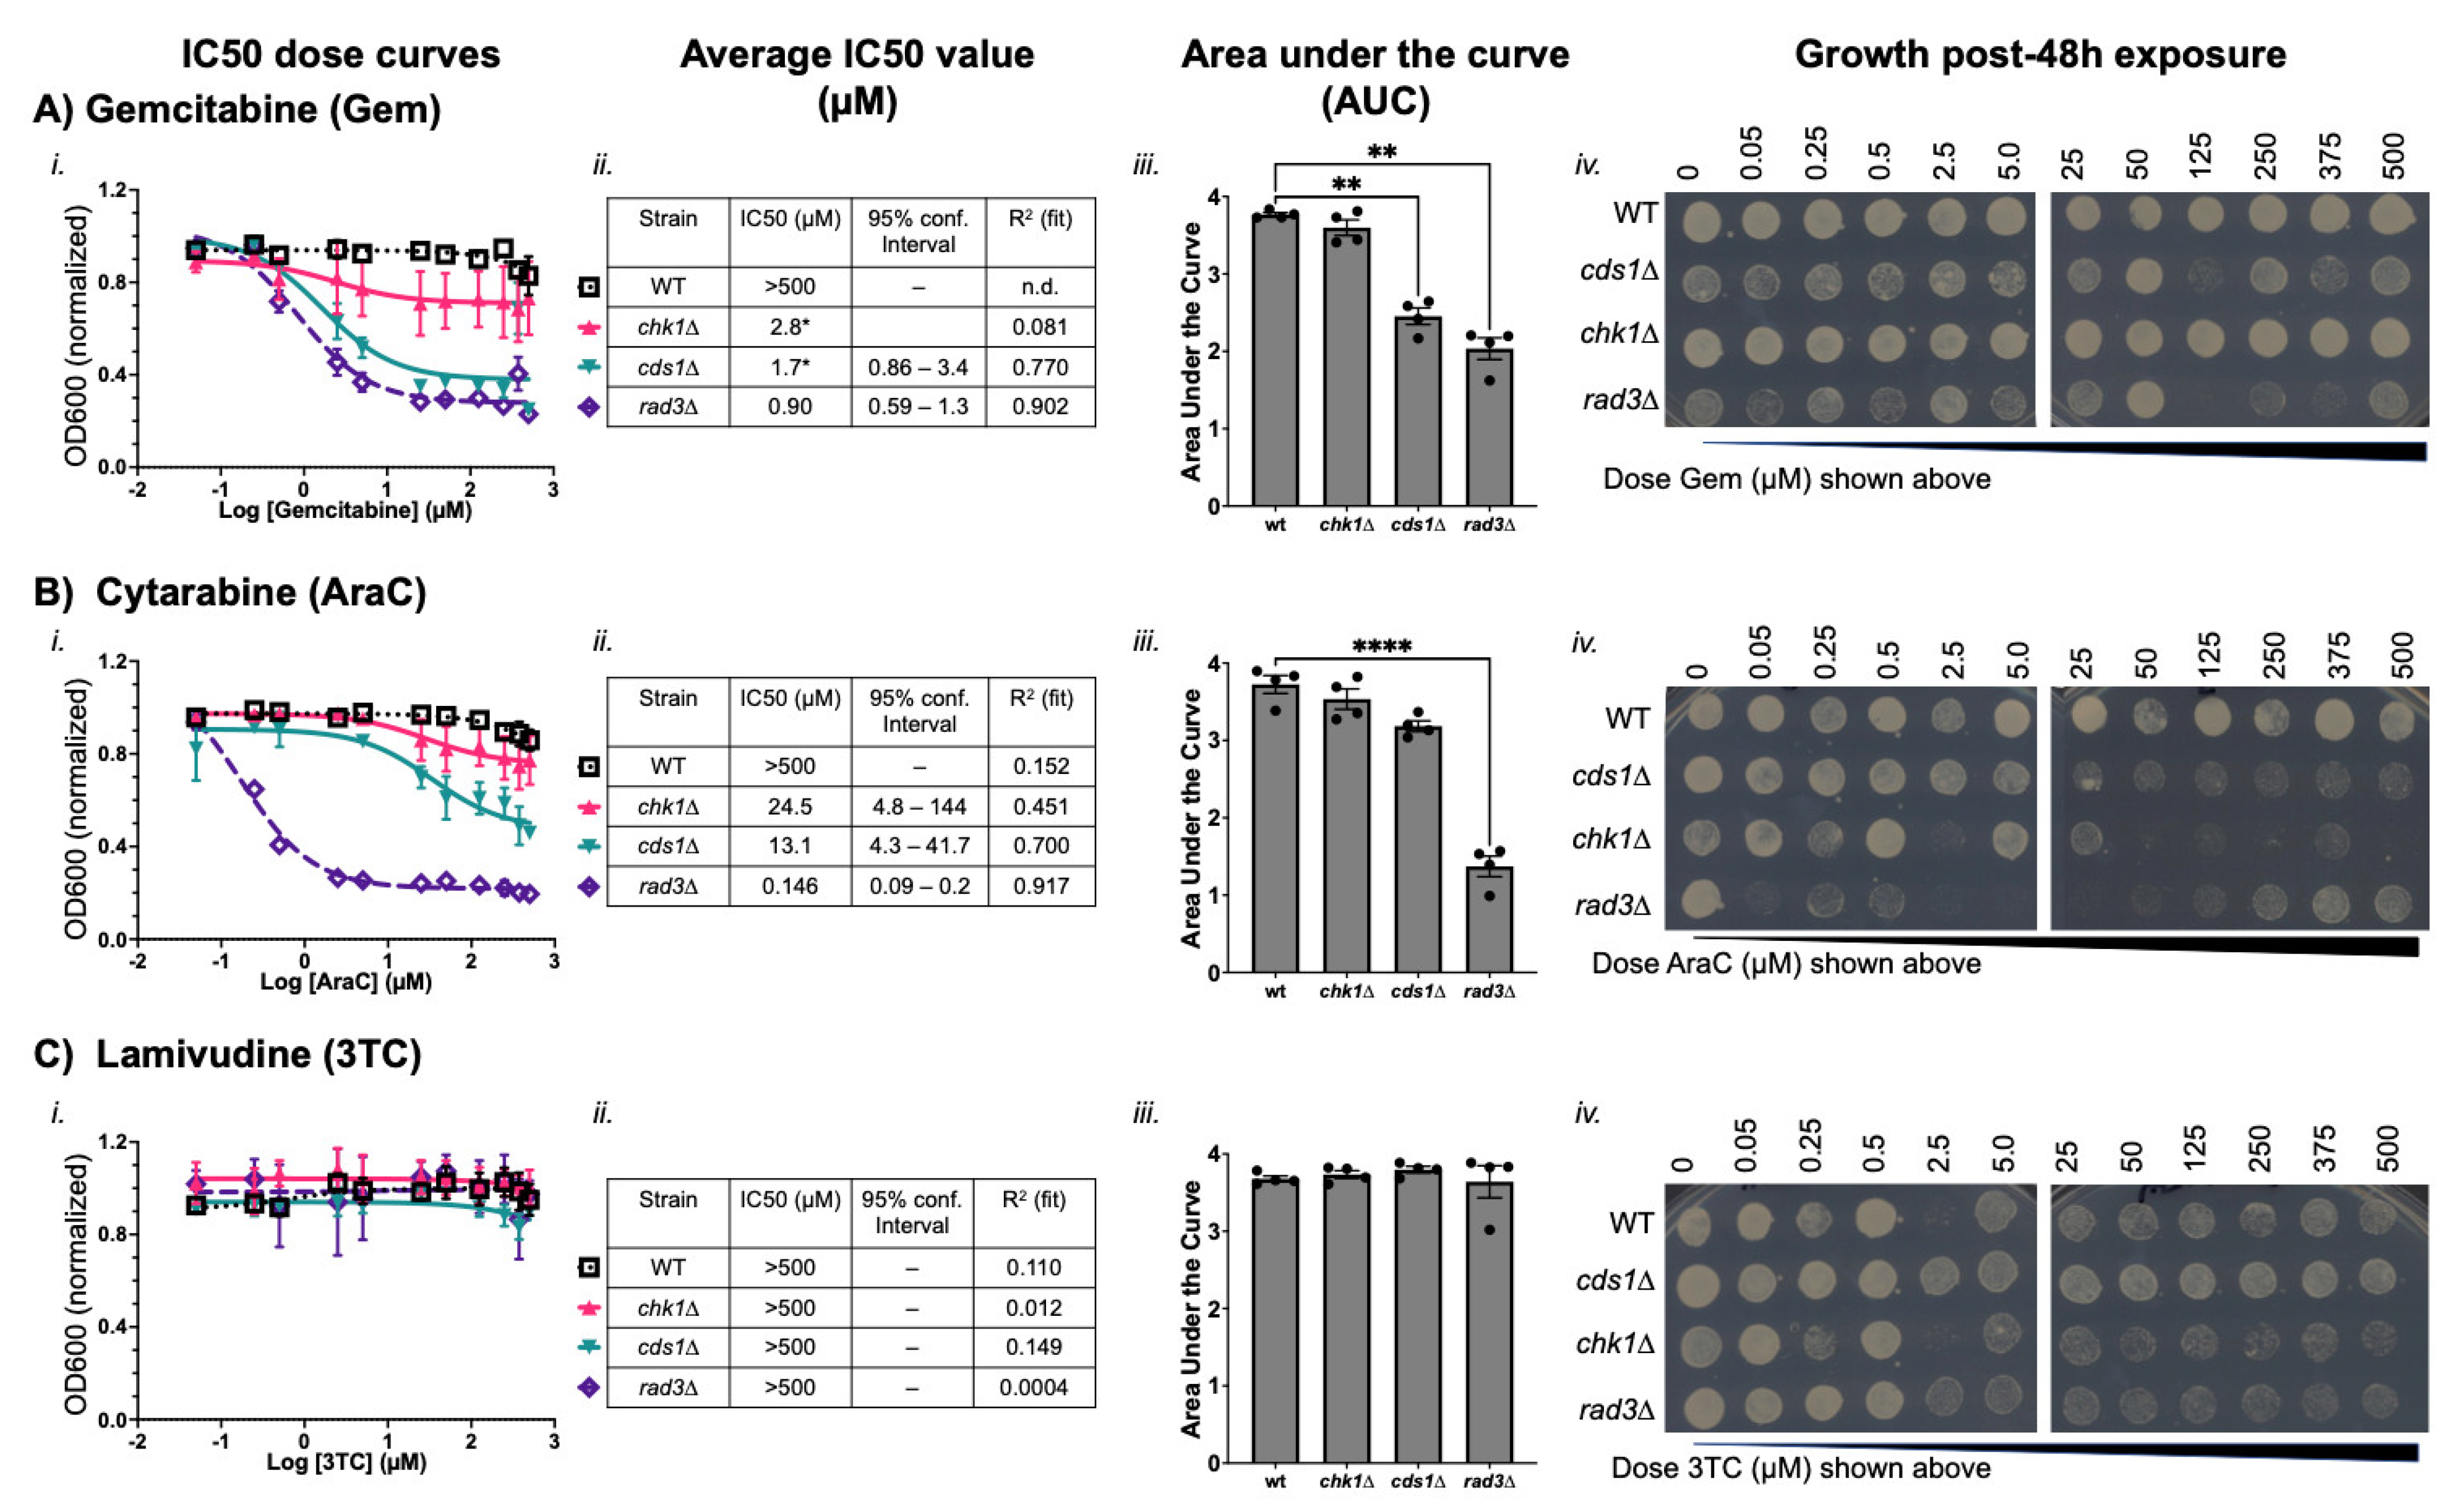
We found that gemcitabine and AraC both decrease the growth of replication checkpoint mutant cells. In this fission yeast-IC50 test of comparative dose–response effects, gemcitabine caused growth arrest in cds1∆ and rad3∆ cells (Figure 3A, IC50 values of 2.7 µM and 0.9 µM, respectively). The area under the curve for cds1∆ and rad3∆ was also significantly lower than wild type cells in gemcitabine. Both cds1∆ and rad3∆ cells had decreased spot growth above 50 µM doses. Oddly, cds1∆ and rad3∆ had improved growth at the highest gemcitabine doses. We hypothesized that high-dose gemcitabine promotes drug resistance, particularly in rad3∆ cells. Large colonies also emerged at the highest doses in cds1∆ cells after gemcitabine exposure and outgrowth. Future work will determine whether these large colonies harbour suppressor mutations caused by gemcitabine exposure. Together, our data suggest that gemcitabine effects on growth and mutation were highest in replication checkpoint mutants rad3∆ and cds1∆, and less effective at high dose.
Gemcitabine did not stop culture growth in wild type cells. The wild type dose–response curve, AUC values, and spot formation were all consistent with a conclusion that gemcitabine does not inhibit growth or kill cells in doses up to 500 µM. We recorded the IC50 value of gemcitabine in wild type as >500 µM from multiple replicate IC50 calculations that were averaged (Table 2). Intriguingly, when IC50 was calculated from normalized and aggregated data in the chart of Figure 3, chk1∆ cells generated an IC50 value of 2.8 µM gemcitabine (Figure 3(Aii)). Yet, the dose–response curve is not classically sigmoidal, and the degree of inhibition by gemcitabine on chk1∆ is low (Figure 3(Aiii)—lowest growth is 0.8 of normalized OD600). The area of chk1∆ curves in gemcitabine was not significantly different from wild type. The chk1∆ spots grew after all exposure doses. These data indicate that gemcitabine is not toxic to wild type or chk1∆ in the conditions that we tested.
In contrast, cytarabine (AraC) decreased growth of all checkpoint mutant cultures (Figure 3B). The rad3∆ cells had an IC50 of 0.15 µM and a significantly lower AUC compared to wild type (IC50 AraC > 500 µM). Growth of rad3∆ cells after AraC was tested by pinning onto plain medium, and rad3∆ cell growth was minimal or non-existent following even the lowest dose of 0.05 µM AraC and up to 250 µM. At the two highest doses, rad3∆ cells show some growth post-exposure (Figure 3(Biv)). We hypothesize that high-dose AraC limits toxicity at the highest doses in rad3∆. The cds1∆ cells had an IC50 of 13.1 µM and do not form spots above a dose of ~5 µM. The chk1∆ cells had an IC50 of 24.5 µM, and do not grow above the IC50 dose of ~25 µM. In the cds1∆ and chk1∆ samples, toxicity caused by AraC is coincident with the IC50 dose. OD600 values of non-cds1∆ cells did not capture the effect of AraC on replication-checkpoint competent cells. Replication-checkpoint mutants (i.e., cds1∆) may therefore experience arrest caused by DNA damage more quickly. We propose that DNA damage induction in cds1∆ inhibits growth and affects OD600 and thus IC50. However, replication-checkpoint competent cells (i.e., wild type, chk1∆) are damaged by AraC. In chk1∆, the effect is lethal above 25 µM.
We tested the antiretroviral drug lamivudine (3TC, Figure 3C) to determine how a cytidine-analogue viral polymerase inhibitor was tolerated in S. pombe mutants. In the IC50 test, all cultures grew and an IC50 dose could not be calculated (>500 µM). AUC values were similar for all strains. However, we repeatedly saw that checkpoint mutants had reduced and slower spot growth at the highest doses of 3TC (Figure 3(Civ)). This spot outgrowth indicated that although 3TC is generally non-toxic, there may be some dependency on checkpoint functions to survive high 3TC doses.

3.3. IC50 Doses of BrdU and Gemcitabine Induce DNA Mis-Segregation, Whilst Higher Doses Promote Drug-Resistant Morphologies

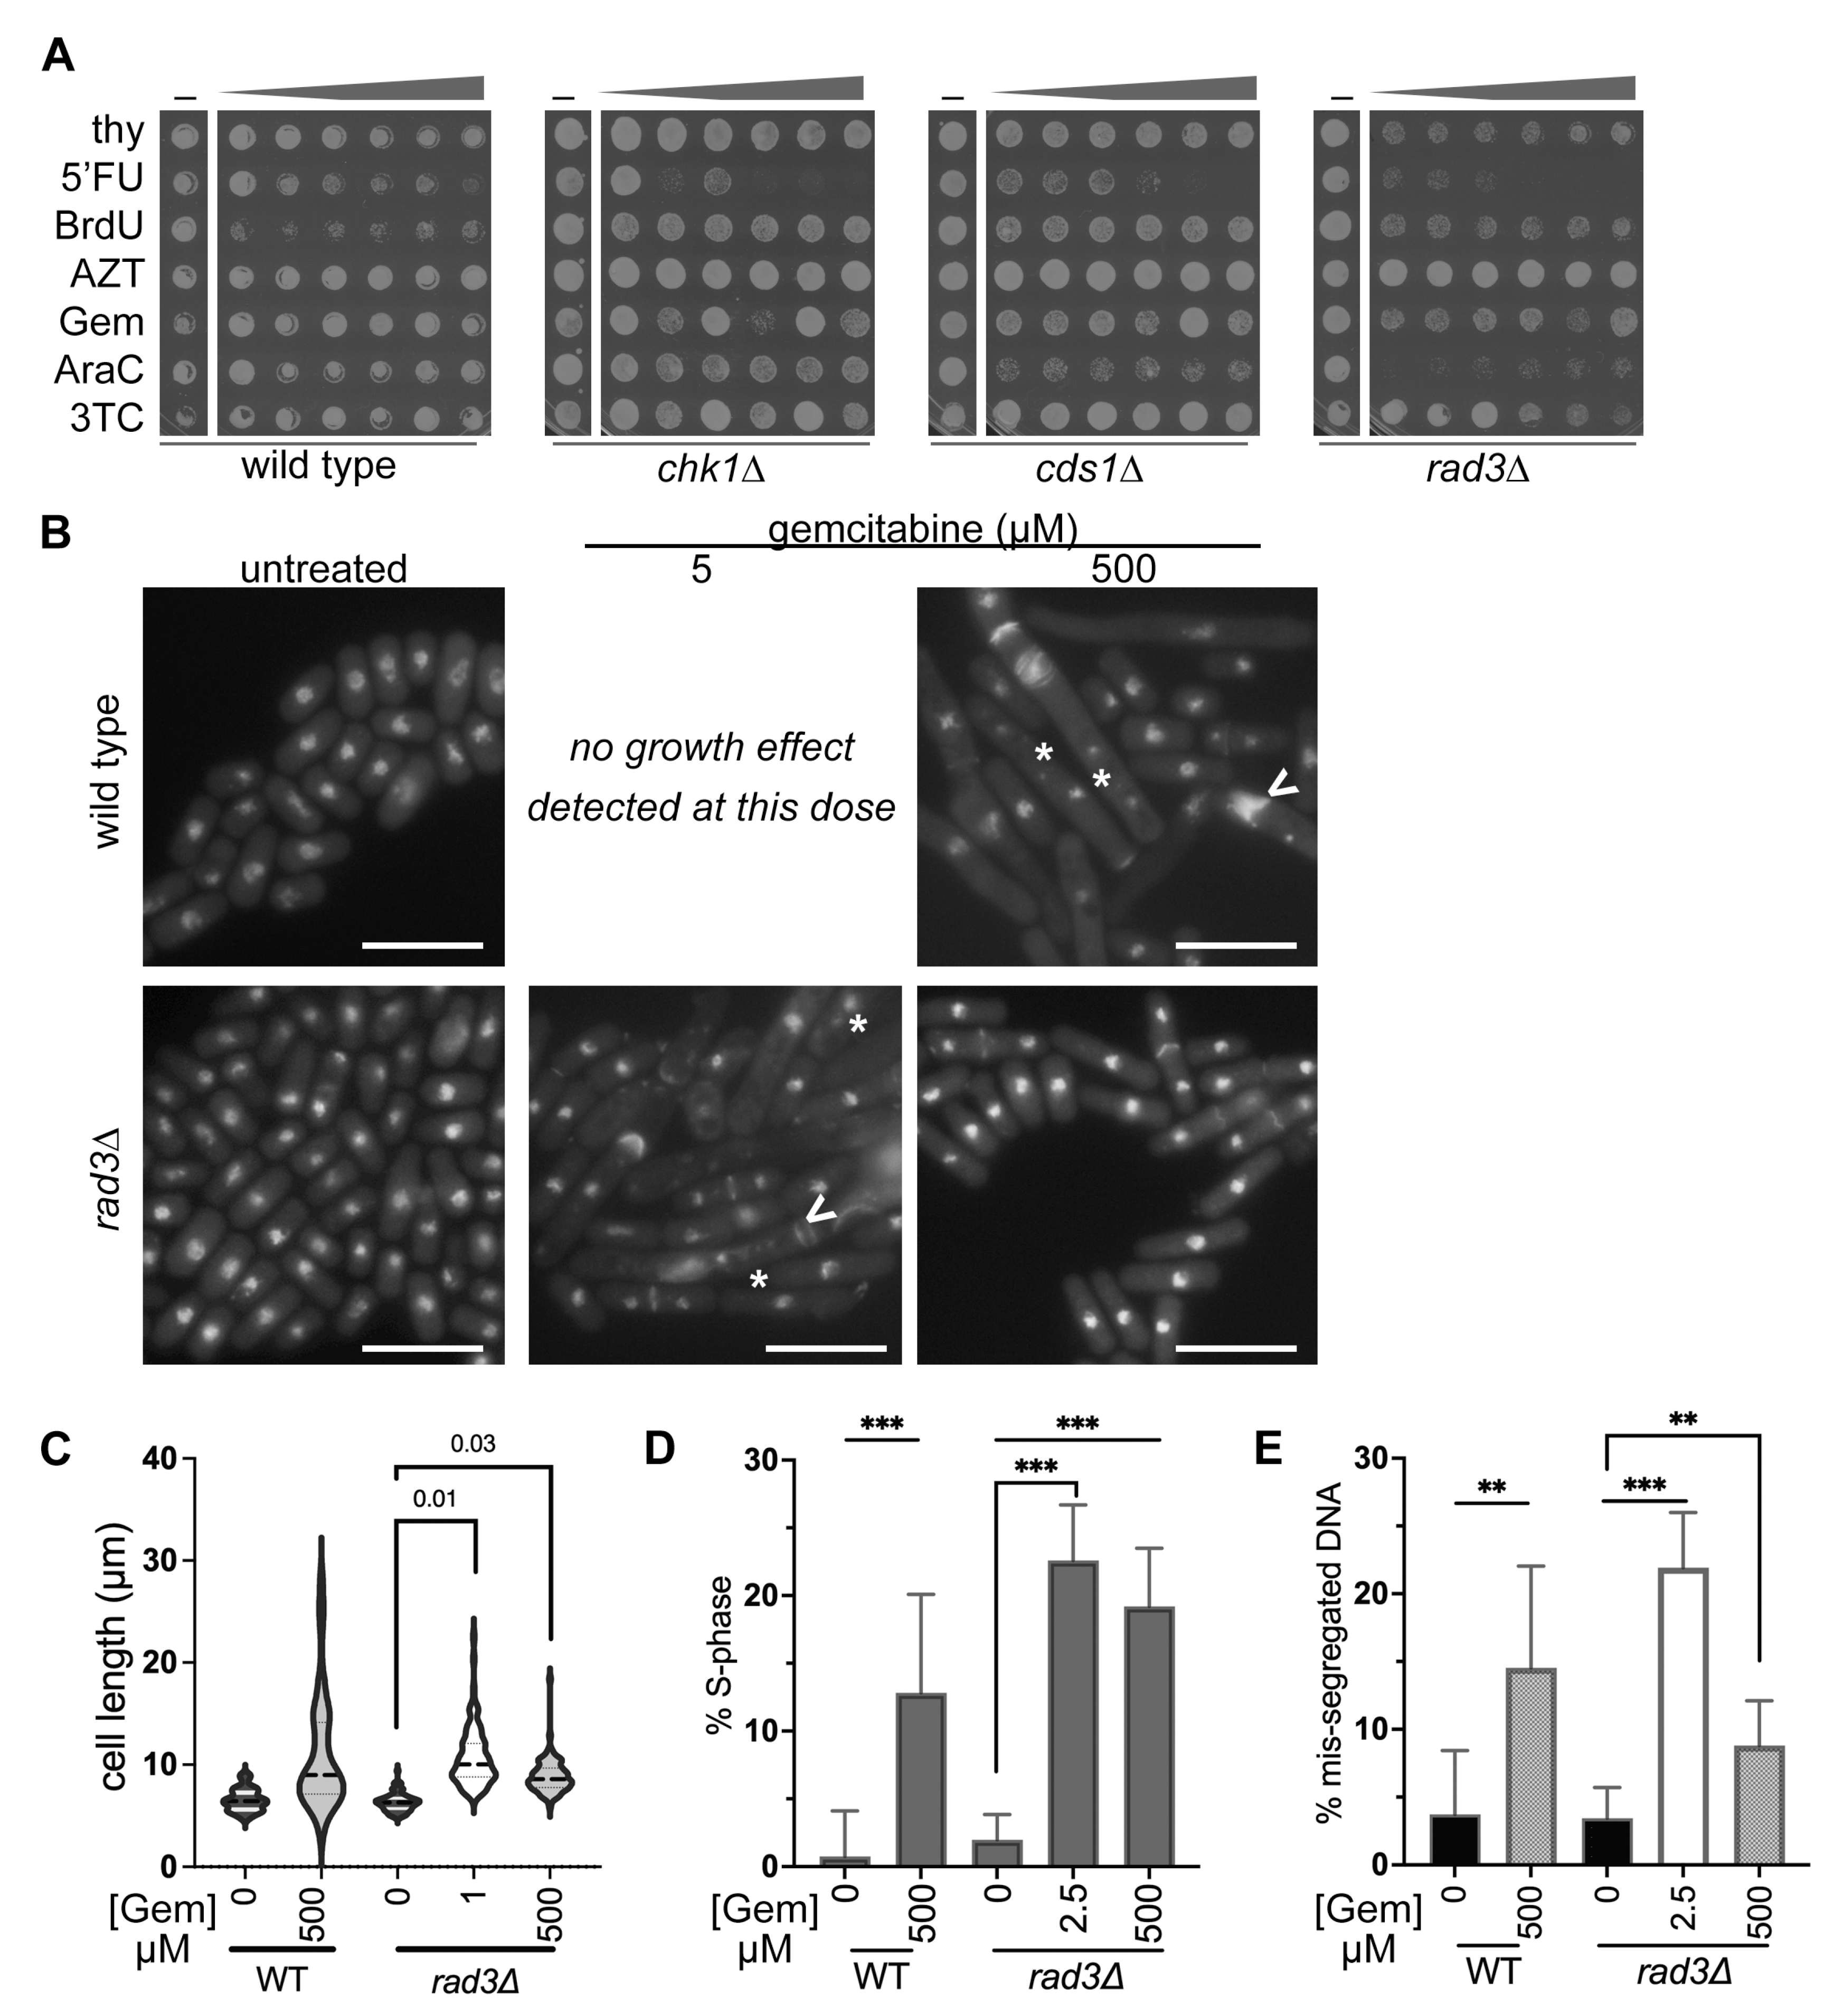
During IC50 assessment, we saw that 5FU, AraC, gemcitabine, and BrdU sometimes caused more growth in spots post-treatment and above the IC50 dose. We compared drug doses between each strain over 48 h, and then spotted for viability on the same plate to compare growth differences due to each drug within a strain (Figure 4A). Replication checkpoint mutant strains cds1∆ and rad3∆ showed a decrease in OD600 in nucleoside analogue around the IC50 dose. Yet, above the IC50 dose cds1∆ and rad3∆ cells often grew large and atypical colonies. Reminiscent of “suppressor” mutant colonies, these large colonies grew faster than surrounding cells on the spot background area above the IC50 dose.
The highest doses frequently allowed spot growth that resembled sub-IC50 treatment. Wild type and chk1∆ cultures rarely showed this pattern of more growth and suppressors higher doses. Our data suggested that nucleoside analogue IC50 exposure may cause a genomic instability “crisis” in replication-checkpoint defective cells. This IC50 crisis and outgrowth presented a potential model to explore drug resistance from nucleoside analogue exposure.
Because our data suggested that the maximally effective dose for a specific mutant strain–nucleoside analogue pairing is approximately the IC50 value, we predicted that cells exposed to an IC50 dose are more likely to die and show obvious signs of genome instability. In this hypothesis, most cells in the IC50-dose-treated culture die and cannot grow into spots. To compare morphology with spot results (Figure 4A), we used DNA and aniline blue septum staining [77,78]. We imaged cells and compared morphologies under three drug conditions: no drug, the IC50 dose, and the highest dose at 500 µM. We began with wild type and rad3∆ cells in gemcitabine because of the stark difference in IC50 response. Wild type and chk1∆ cultures did not generate a sigmoidal curve or IC50 value in gemcitabine using OD600; we inferred that DNA damage response is not essential to stopping growth. Because wild type cells were insensitive to gemcitabine and did not generate an IC50 value, lower-dose IC50-dose cells could be tested.
However, this did not mean that wild type cells were unaffected by gemcitabine treatment. We found that wild type cells in 500 µM gemcitabine were long and multi-septated, with clear DNA mis-segregation (Figure 4B). We compared wild type cell length in untreated and 500 µM gemcitabine and found that gemcitabine treatment caused cell elongation (Figure 4C). The number of anaphase and septated wild type cells was higher in 500 µM gemcitabine, showing that G1-S phase arrest occurs (Figure 4D). Nuclear mis-segregation was increased in wild type after 500 µM gemcitabine (Figure 4E). We conclude that wild type cells are sensitive to high-dose gemcitabine (Figure 3(Ai), black line), reflecting gemcitabine sensitivity, even though no lower-dose IC50 is calculated. Further, we infer that wild type DNA damage checkpoint prevents division in gemcitabine, correlated with cell elongation and septation phenotypes.
In contrast, rad3∆ cells had a gemcitabine IC50 value of approximately 1 µM (Table 2). rad3∆ cells at the IC50 dose showed multiple nuclei, cut DNA, elongation, and multiple septa (Figure 4B). This was consistent with IC50 doses of gemcitabine causing genomic instability in rad3∆ cells. At the highest 500 µM dose of gemcitabine, rad3∆ cells were more uniform in size, although longer than untreated (Figure 4C, Table 3); we attribute some of this difference to cell growth arrest in untreated cultures after 48 h static growth. More rad3∆ cells had septa or anaphase nuclei in either IC50 or 500 µM gemcitabine, indicating more cells were in G1-S phases (Figure 4E). Morphologically, rad3∆ cells in IC50 gemcitabine looked like wild type cells at the highest (500 µM) dose (Figure 4B). By counting abnormal nuclear segregation of DAPI, we found that rad3∆ cells at 500 µM gemcitabine had fewer obvious DNA mis-segregation events than at the IC50 dose (Figure 4D). Our data indicate that rad3∆ cells are most sensitive to gemcitabine at the IC50 dose where genome instability is obvious.
Because 500 µM gemcitabine doses impacted rad3∆ cells less, we hypothesized that other nucleoside analogues may arrest replication checkpoint mutant cells, but not kill at 500 µM doses. We tested BrdU, because all strains were sensitive to BrdU, and we calculated IC50 doses (Figure 2C, Table 2). We predicted that cds1∆ or rad3∆ cells at an IC50 dose would show more DNA mis-segregation and abnormal morphologies (i.e., longer cells or septated/anaphase cell accumulation) than at the highest dose. Instead, we found that all genotypes showed dramatic changes in morphology at their respective BrdU IC50 doses (Figure 5A), including elongation, abnormal septation, aneuploidy, and multinucleated cells. Intriguingly, cells that were treated with 500 µM BrdU had morphologies like untreated and cycling fission yeast.
Schizosaccharomyces pombe cells elongate during G2 arrest and in response to DNA damage and may show increased DNA mis-segregation as a symptom of chromosome instability. Elongation could also contribute to higher OD600 measurements, which might affect growth curves. To test for elongation, we measured cell lengths after IC50 and high-dose BrdU. We found that BrdU at low- or high-dose caused longer cells and more variation (Figure 5B). Wild type cells elongated in IC50 doses and remained longer at high dose (Table 4); this implies that there was a G2-arrest or block to cytokinesis. In contrast, checkpoint mutants showed longer cells at the IC50 dose, the populations were generally shorter at 500 µM (Table 4). BrdU increased the proportion of binucleate and septated cells at each dose (Figure 5C), indicating G1/S accumulation and arrest. DNA mis-segregation increased in all cells and at either IC50 or 500 µM doses. However, the IC50 dose of BrdU caused the highest frequency of mis-segregation in all cells (Figure 5D), showing that the dose of most sensitivity is correlated with the largest biological effect. Checkpoint mutants had less mis-segregation at 500 µM BrdU, with no significant difference between 500 µM and untreated.
Finally, we tested whether cells were still sensitive to nucleoside analogue treatment after BrdU (Figure 5E, Supplementary Figure S1). We spotted cultures onto 5-fluoro-2′-deoxyuridine (FUdR) to assess HSV-TK function. FUdR added to the medium detects the emergence of nucleoside analogue-resistant cells, because the analogue can no longer be phosphorylated [10,11]. We saw that wild type, cds1∆, and rad3∆ cells had few FUdR-resistant cells after incubation without BrdU. In contrast, chk1∆ cells have a higher frequency of FUdR resistance that may indicate general genome instability and HSV-TK loss even without BrdU. With increased BrdU dose the number of FUdR-resistant colonies within each spot increased. This occurred even as the overall number of cells per dot decreased with increasing FUdR doses (Figure 2(Civ)). We spotted onto canavanine to assess forward mutation of canavanine sensitivity. We found that cds1∆ and chk1∆ cells have more FUdR growth in lower-concentration spots, up to the IC50. Contrastingly, the rad3∆ cells have FUdR-resistant colonies that form in doses up to the IC50, and again at the highest doses of BrdU (Supplementary Figure S1).
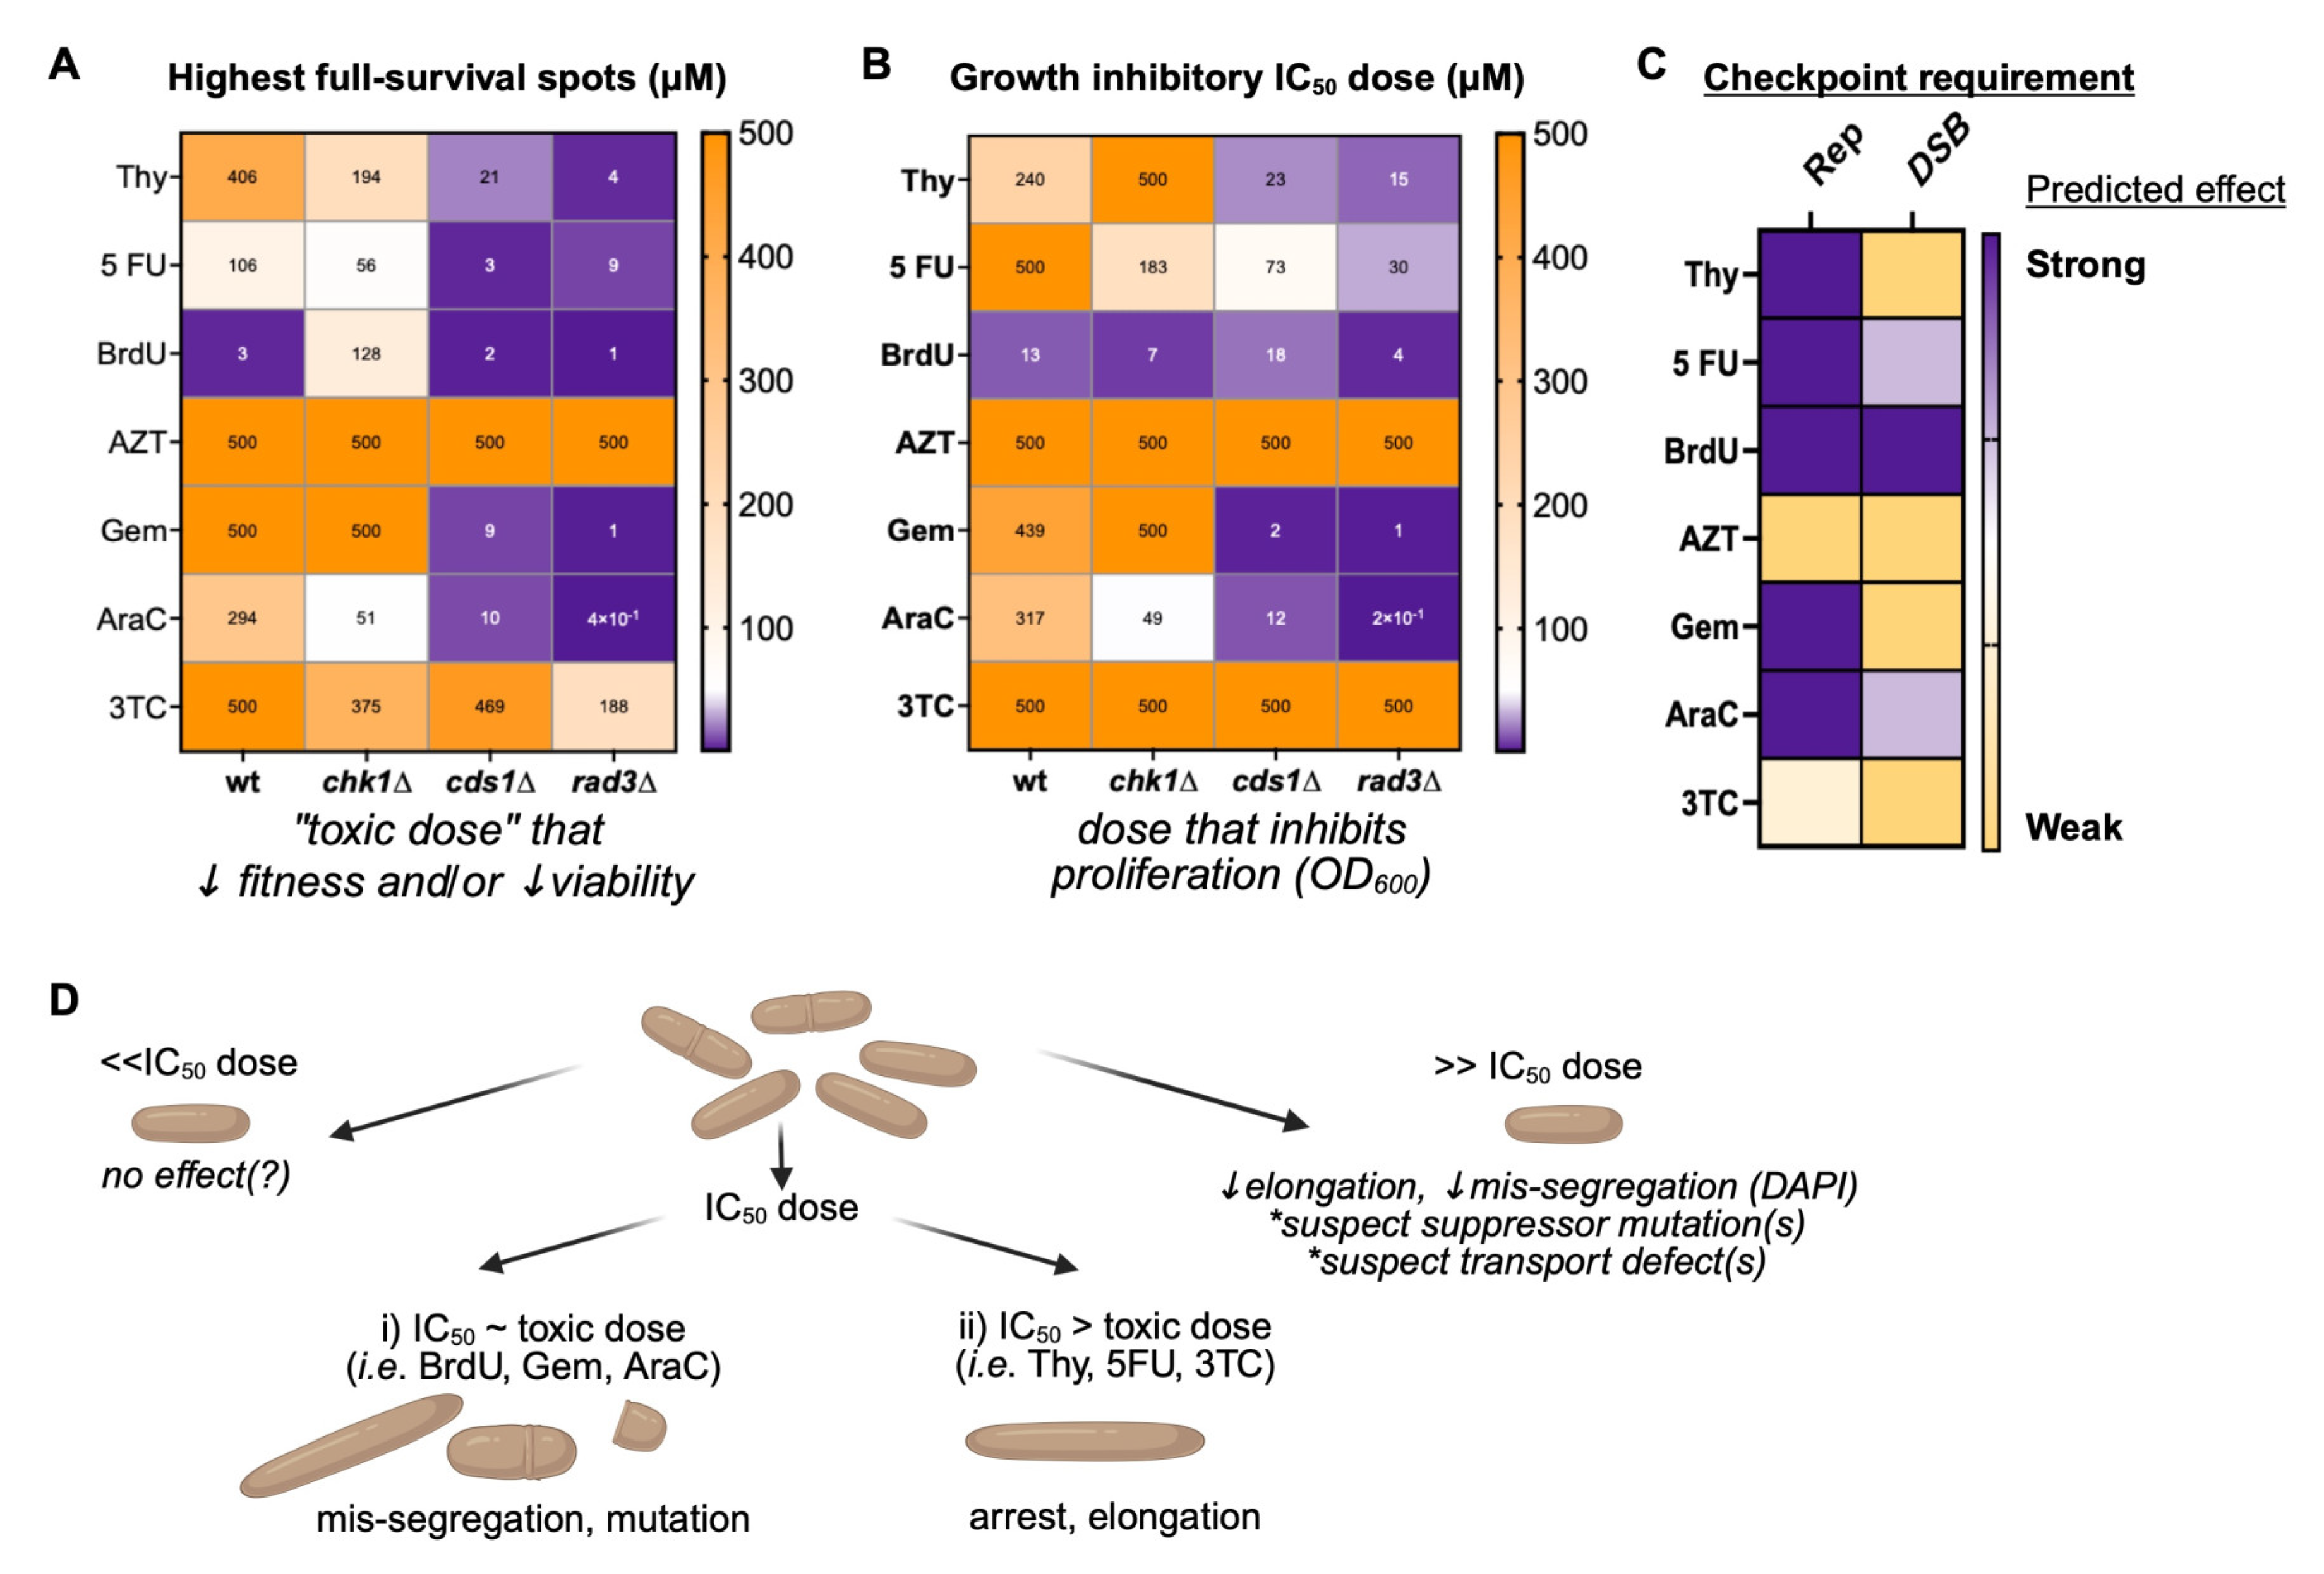
We conclude that lower-dose BrdU promotes DNA replication arrest and DNA damage induction (Figure 6). Generally, we found that an IC50 BrdU dose is often more toxic to cells (Figure 6A,B,D). These nucleoside analogue effects are distinctive from those caused by hydroxyurea (HU; Supplementary Figure S2A). HU depletes dNTP levels and causes DNA replication arrest through the S-phase checkpoints. Consequently, the IC50 values of HU are lowest in rad3∆ and cds1∆ (0.74 µM and 1.1 µM, respectively, in PMG medium), followed by chk1∆ (7.6 µM), and highest for wild type (14.6 µM). We saw that medium choice affects HU sensitivity (Supplementary Figure S2B). These HU results indicate that gemcitabine, BrdU, and AraC sensitivities in our system were more HU-like and replication-stress dependent. However, it is difficult to deconvolve effects of the analogues on ribonucleotide reductase inhibition versus direct polymerase inhibition, such as the masked chain termination of gemcitabine [79] or DNA damage induction of either BrdU or gemcitabine [80,81,82]. Further, the impact of nucleoside analogues on mRNA metabolism may impact DSBs, mutation, and genome stability, as reported for 5FU [5,8].
Intriguingly, high-dose BrdU above the IC50 dose generates a different spectrum of damage and/or mutation. Our FUdR tests show that the changes caused by BrdU may decrease nucleoside analogue sensitivity through altered HSV-TK function; this may promote cell survival and drug resistance. Because lower DNA mis-segregation was observed at the highest doses of BrdU (Figure 5D and Figure 6D), we propose that high-dose BrdU induces changes that promote survival, decrease nucleoside analogue toxic effects, and may promote downstream drug resistance.

4. Conclusions

Using a rapid synthetic biology method for S. pombe, we show that nucleoside analogue drug-dose outcome is influenced by cellular DNA replication (Cds1-dependent) or DSB repair (Chk1-dependent) checkpoints, consistent with the previous literature regarding other models and methods [63,81,83,84]. Thus, fission yeast liquid growth screens using OD600 can identify drug mechanisms [62] and mutational outcomes [84]. Capitalizing on the similarities of S. pombe and human checkpoint proteins and dNTP metabolism pathways [10,58], we show that the IC50 dose for cytotoxic nucleoside analogues is linked to checkpoint competency. IC50 is lowest with loss of the ATR-homologue Rad3. Drug mechanisms specific to each analogue may influence IC50 dose, treatment failure, or risk of resistance. An IC50 dose of nucleoside analogue causes DNA mis-segregation and G1/S-phase arrest. The relationship between genetic mutation background and the IC50 dose required to reduce cell growth (Figure 2 and Figure 3; Table 2) maximizes cell killing without off-target effects.
BrdU and gemcitabine doses above a strain specific IC50 dose allowed growth recovery and decreased FUdR sensitivity (Figure 4 and Figure 5). FUdR insensitivity implies that HSV-TK function was reduced. Doses above the IC50 dose also caused large colonies suggestive of suppressor mutations, and fewer morphological changes in cell length or DNA mis-segregation. Thus, nucleoside analogue doses that are too high may increase unanticipated drug insensitivity and risk of later resistance. Because gemcitabine sensitivity depends on checkpoint competency and growth medium [62,63,84], failing to consider genomics and outcome relative to dose may lead to incorrect dosing, drug insensitivity, and mutational changes within a once-sensitive population of cells.
A predictable relationship between a specific nucleoside analogue, an individual’s cellular genotype or phenotype, drug sensitivity range, and loss of sensitivity threshold may allow decreased drug use with synthetic lethality principles. Synthetic lethality uses two conditions that are non-lethal independently to cause better cell killing when both are combined [85,86]. In cancer, a synthetic lethality strategy could target tumour cells for nucleoside analogue effects, maximizing tumour death, minimizing risk of resistance, and sparing non-cancerous “bystander” cells. Homologous recombination pathway testing in this system may help to minimize the onset of mutations and drug resistance. This is similar to the strategic lethality principle of the drug Olaparib, e.g., [87,88,89]. Olaparib inhibits polyADP ribose polymerase (PARP), blocking repair and enhancing cell death in BRCA1- or BRCA2-deficient tumours [86,87,88,89].
Our method can be applied to find a specific IC50 dose that reduces cell growth (Figure 2 and Figure 3; Table 2) while minimizing the risk of failure or resistance above the IC50. This could be part of a path to uncover new genetic factors that increase nucleoside analogue efficacy. Testing for suppressor mutations that develop at the IC50 dose in checkpoint mutant cells (i.e., cds1∆, rad3∆) may improve treatments and predict causes of drug resistance. To this end, the emergence of suppressor-like colonies in 5-FU, BrdU, AraC, or gemcitabine treatment may reflect stable isolates that are less sensitive to subsequent doses of the drug. However, we see off-target effects in rad3∆ above the IC50 dose and loss of FUdR sensitivity. Because ATR is the homologue of S. pombe Rad3, the use of ATR inhibitors to increase nucleoside analogue effects (i.e., [90,91]) could confer a risk of mutation and later drug resistance. ATR inhibition may allow lower clinical drug doses; future work will determine whether these lower doses are due to enhanced cell killing or if there is a higher risk of analogue resistance.
Genotype–dose calculation for patients supports their quality of life during chronic HIV prophylaxis and cancer therapy. Because nucleoside analogues target proliferating cells such as hair follicles, intestinal epithelium, and bone marrow, drug side effects can include hair loss, nausea, anemia, and compromised immunity. Even antiretroviral drugs such as AZT and 3TC can cause these effects, and also lipodystrophy and metabolic diseases (e.g., hyperglycemia, hypercholesterolemia) [92,93]. AZT and 3TC do not typically target DNA polymerase, kill uninfected cells, or stop proliferation; our data indicate that higher 3TC doses change rad3∆ spot growth supports effects that are subtle and more mutation-based over long-term treatment [94]. Patient side-effects can cause therapy refusal leading to co-morbidities, disease progression, and accelerated drains on patient–caregiver–health networks, even if the drug is effective [95]. Using the lowest possible dose improves quality of life and may extend the window of specific nucleoside analogue use before a switch is required due to acquired drug resistance.
We conclude that personal genomics profiling ahead of treatment may predict outcomes. Schizosaccharomyces pombe screening using these methods could be used to amplify nucleoside analogue sensitivities and minimize the risk of resistance during long-term use. The S. pombe wee1∆ mutant led to the discovery of Wee1 inhibitor Adavosertib. Adavosertib is now in clinical trials targeting uterine, lung, ovarian, renal and refractory tumours [76,96,97]. Wee1 inhibition can synergistically enhance radiation and gemcitabine treatment in cancer [96,98,99,100]. Thus, targeting inhibitors of cell cycle and checkpoint kinases may improve nucleoside analogue drug use through synthetic lethality, while avoiding mutagenesis and risk of later insensitivity.

Supplementary Materials

The following supporting information can be downloaded at: https://www.mdpi.com/article/10.3390/cimb47090756/s1.

Author Contributions

Conceptualization, S.A.S.; methodology, Z.B.K., M.A.C., Z.K., E.K., S.P.M. and S.A.S.; formal analysis, Z.B.K., M.A.C. and S.A.S.; investigation, Z.B.K.; M.A.C., Z.K. and S.P.M.; resources, S.A.S.; data curation, S.A.S.; writing—original draft preparation, Z.K. and S.A.S.; writing—review and editing, M.A.C., Z.K., E.K., S.P.M. and S.A.S.; supervision, S.A.S.; project administration, S.A.S.; funding acquisition, S.A.S. All authors have read and agreed to the published version of the manuscript.

Funding

This work was funded by the Canadian Natural Science and Engineering Research Council (NSERC) to S.A.S. (RGPIN-2015-04405). E.K. and Z.K. were supported by Ontario Graduate Scholarships. This work was also supported by the TMU Faculty of Science NSERC Booster and Bridge Awards programs to S.A.S. This research was funded by the Toronto Metropolitan University Faculty of Science awards of start-up funding, Research Tools and Instrument support, NSERC Booster Award, and Dean’s Research Award Booster and Connector to S.A.S.

Institutional Review Board Statement

Not applicable.

Informed Consent Statement

Not applicable.

Data Availability Statement

Data supporting reported results are available upon request to Sarah Sabatinos (ssabatinos@torontomu.ca).

Acknowledgments

We thank Ella Hyatt and Salwa Saeed at Toronto Metropolitan University for their administrative and facility support that was critical to research productivity. We thank the University College London Pharmacy Program for their support and program/student support. We thank the members of the Sabatinos Laboratory for critical reading of this manuscript, and anonymous reviewers who made important suggestions.

Conflicts of Interest

The authors declare no conflicts of interest. The funders had no role in the design of the study; in the collection, analyses, or interpretation of data; in the writing of the manuscript; or in the decision to publish the results.

References

  1. Galmarini, C.M.; Mackey, J.R.; Dumontet, C. Nucleoside analogues and nucleobases in cancer treatment. Lancet Oncol. 2002, 3, 415–424. [Google Scholar] [CrossRef] [PubMed]
  2. Menéndez-Arias, L. Mechanisms of resistance to nucleoside analogue inhibitors of HIV-1 reverse transcriptase. Virus Res. 2008, 134, 124–146. [Google Scholar] [CrossRef]
  3. Tsesmetzis, N.; Paulin, C.B.J.; Rudd, S.G.; Herold, N. Nucleobase and Nucleoside Analogues: Resistance and Re-Sensitisation at the Level of Pharmacokinetics, Pharmacodynamics and Metabolism. Cancers 2018, 10, 240. [Google Scholar] [CrossRef]
  4. Peters, G.J. Novel Developments in the Use of Antimetabolites. Nucleosides Nucleotides Nucleic Acids 2014, 33, 358–374. [Google Scholar] [CrossRef]
  5. Dolnick, B.J.; Wu, X.P. Effects of 5-fluorouracil on mRNA. Adv. Exp. Med. Biol. 1993, 339, 57–63. [Google Scholar] [CrossRef]
  6. Silverstein, R.A.; de Valdivia, E.G.; Visa, N. The Incorporation of 5-Fluorouracil into RNA Affects the Ribonucleolytic Activity of the Exosome Subunit Rrp6. Mol. Cancer Res. 2011, 9, 332–340. [Google Scholar] [CrossRef]
  7. Chen, J.-K.; Merrick, K.A.; Kong, Y.W.; Izrael-Tomasevic, A.; Eng, G.; Handly, E.D.; Patterson, J.C.; Cannell, I.G.; Suarez-Lopez, L.; Hosios, A.M.; et al. An RNA damage response network mediates the lethality of 5-FU in colorectal cancer. Cell Rep. Med. 2024, 5, 101778. [Google Scholar] [CrossRef]
  8. Chalabi-Dchar, M.; Fenouil, T.; Machon, C.; Vincent, A.; Catez, F.; Marcel, V.; Mertani, H.C.; Saurin, J.-C.; Bouvet, P.; Guitton, J.; et al. A novel view on an old drug, 5-fluorouracil: An unexpected RNA modifier with intriguing impact on cancer cell fate. NAR Cancer 2021, 3, zcab032. [Google Scholar] [CrossRef]
  9. Mead, T.J.; Lefebvre, V. Proliferation assays (BrdU and EdU) on skeletal tissue sections. Methods Mol Biol. 2014, 1130, 233–243. [Google Scholar] [CrossRef] [PubMed]
  10. Sabatinos, S.A.; Mastro, T.L.; Green, M.D.; Forsburg, S.L. A Mammalian-Like DNA Damage Response of Fission Yeast to Nucleoside Analogs. Genetics 2013, 193, 143–157. [Google Scholar] [CrossRef] [PubMed]
  11. Sivakumar, S. In vivo labeling of fission yeast DNA with thymidine and thymidine analogs. Methods 2004, 33, 213–219. [Google Scholar] [CrossRef]
  12. Anderson, P.L.; Rower, J.E. Zidovudine and Lamivudine for HIV Infection. Clin. Med. Rev. Ther. 2010, 2, a2004. [Google Scholar] [CrossRef]
  13. Weinert, T. DNA damage and checkpoint pathways: Molecular anatomy and interactions with repair. Cell 1998, 94, 555–558. [Google Scholar] [CrossRef]
  14. Alcasabas, A.A.; Osborn, A.J.; Bachant, J.; Hu, F.; Werler, P.J.H.; Bousset, K.; Furuya, K.; Diffley, J.F.X.; Carr, A.M.; Elledge, S.J. Mrc1 transduces signals of DNA replication stress to activate Rad53. Nat. Cell Biol. 2001, 3, 958–965. [Google Scholar] [CrossRef]
  15. Enoch, T.; Carr, A.M.; Nurse, P. Fission yeast genes involved in coupling mitosis to completion of DNA replication. Genes Dev. 1992, 6, 2035–2046. [Google Scholar] [CrossRef] [PubMed]
  16. Lindsay, H.D.; Griffiths, D.J.; Edwards, R.J.; Christensen, P.U.; Murray, J.M.; Osman, F.; Walworth, N.; Carr, A.M. S-phase-specific activation of Cds1 kinase defines a subpathway of the checkpoint response in Schizosaccharomyces pombe. Genes Dev. 1998, 12, 382–395. [Google Scholar] [CrossRef]
  17. Boddy, M.N.; Furnari, B.; Mondesert, O.; Russell, P. Replication Checkpoint Enforced by Kinases Cds1 and Chk1. Science 1998, 280, 909–912. [Google Scholar] [CrossRef] [PubMed]
  18. Brondello, J.-M.; Boddy, M.N.; Furnari, B.; Russell, P. Basis for the Checkpoint Signal Specificity That Regulates Chk1 and Cds1 Protein Kinases. Mol. Cell. Biol. 1999, 19, 4262–4269. [Google Scholar] [CrossRef]
  19. Zeng, Y.; Forbes, K.C.; Wu, Z.; Moreno, S.; Piwnica-Worms, H.; Enoch, T. Replication checkpoint requires phosphorylation of the phosphatase Cdc25 by Cds1 or Chk1. Nature 1998, 395, 507–510. [Google Scholar] [CrossRef]
  20. Crasta, K.; Ganem, N.J.; Dagher, R.; Alexandra, B.L.; Elena, V.I.; Pan, Y.F.; Luigi, N.; Alexei, P.; Dipanjan, C.; David, P. DNA breaks and chromosome pulverization from errors in mitosis. Nature 2012, 482, 53–58. [Google Scholar] [CrossRef] [PubMed]
  21. Zhang, C.Z.; Spektor, A.; Cornils, H.; Francis, J.M.; Jackson, E.K.; Liu, S.; Meyerson, M.; Pellman, D. Chromothripsis from DNA damage in micronuclei. Nature 2015, 522, 179–184. [Google Scholar] [CrossRef]
  22. Zhang, F.; Carvalho, C.M.; Lupski, J.R. Complex human chromosomal and genomic rearrangements. Trends Genet. 2009, 25, 298–307. [Google Scholar] [CrossRef]
  23. Holland, A.J.; Cleveland, D.W. Chromoanagenesis and cancer: Mechanisms and consequences of localized, complex chromosomal rearrangements. Nat. Med. 2012, 18, 1630–1638. [Google Scholar] [CrossRef]
  24. Shoshani, O.; Bakker, B.; de Haan, L.; Tijhuis, A.E.; Wang, Y.; Kim, D.H.; Maldonado, M.; Demarest, M.A.; Artates, J.; Zhengyu, O.; et al. Transient genomic instability drives tumorigenesis through accelerated clonal evolution. Genes Dev. 2021, 35, 1093–1108. [Google Scholar] [CrossRef] [PubMed]
  25. Garcia-Closas, M.; Hall, P.; Nevanlinna, H.; Pooley, K.; Morrison, J.; Richesson, D.A.; Bojesen, S.E.; Nordestgaard, B.G.; Axelsson, C.K.; Arias, J.I.; et al. Heterogeneity of Breast Cancer Associations with Five Susceptibility Loci by Clinical and Pathological Characteristics. PLoS Genet. 2008, 4, e1000054. [Google Scholar] [CrossRef] [PubMed]
  26. Vargas-Rondón, N.; Villegas, V.E.; Rondón-Lagos, M. The Role of Chromosomal Instability in Cancer and Therapeutic Responses. Cancers 2017, 10, 4. [Google Scholar] [CrossRef]
  27. Lepage, C.C.; Morden, C.R.; Palmer, M.C.L.; Nachtigal, M.W.; McManus, K.J. Detecting Chromosome Instability in Cancer: Approaches to Resolve Cell-to-Cell Heterogeneity. Cancers 2019, 11, 226. [Google Scholar] [CrossRef]
  28. Sahin, I.H.; Lowery, M.A.; Stadler, Z.K.; Salo-Mullen, E.; Iacobuzio-Donahue, C.A.; Kelsen, D.P.; O’reilly, E.M. Genomic instability in pancreatic adenocarcinoma: A new step towards precision medicine and novel therapeutic approaches. Expert. Rev. Gastroenterol. Hepatol. 2016, 10, 893–905. [Google Scholar] [CrossRef] [PubMed]
  29. Mansoori, B.; Mohammadi, A.; Davudian, S.; Shirjang, S.; Baradaran, B. The Different Mechanisms of Cancer Drug Resistance: A Brief Review. Adv. Pharm. Bull. 2017, 7, 339–348. [Google Scholar] [CrossRef]
  30. Wu, L.; Tannock, I.F. Repopulation in murine breast tumors during and after sequential treatments with cyclophosphamide and 5-fluorouracil. Cancer Res. 2003, 63, 2134–2138. [Google Scholar]
  31. Davis, A.J.; Tannock, I.F. Tumor physiology and resistance to chemotherapy: Repopulation and drug penetration. Cancer Treat. Res. 2002, 112, 1–26. [Google Scholar]
  32. Vukovic, B.; Beheshti, B.; Park, P.; Lim, G.; Bayani, J.; Zielenska, M.; Squire, J. Correlating breakage-fusion-bridge events with the overall chromosomal instability and in vitro karyotype evolution in prostate cancer. Cytogenet. Genome Res. 2007, 116, 1–11. [Google Scholar] [CrossRef]
  33. Bianchi, V.; Pontis, E.; Reichard, P. Changes of deoxyribonucleoside triphosphate pools induced by hydroxyurea and their relation to DNA synthesis. J. Biol. Chem. 1986, 261, 16037–16042. [Google Scholar] [CrossRef]
  34. Alvino, G.M.; Collingwood, D.; Murphy, J.M.; Delrow, J.; Brewer, B.J.; Raghuraman, M.K. Replication in hydroxyurea: It’s a matter of time. Mol. Cell. Biol. 2007, 27, 6396–6406. [Google Scholar] [CrossRef]
  35. Errico, A.; Costanzo, V.; Hunt, T. Tipin is required for stalled replication forks to resume DNA replication after removal of aphidicolin in Xenopus egg extracts. Proc. Natl. Acad. Sci. USA 2007, 104, 14929–14934. [Google Scholar] [CrossRef]
  36. Kurose, A.; Tanaka, T.; Huang, X.; Traganos, F.; Dai, W.; Darzynkiewicz, Z. Effects of hydroxyurea and aphidicolin on phosphorylation of ataxia telangiectasia mutated on Ser. 1981 and histone H2AX on Ser. 139 in relation to cell cycle phase and induction of apoptosis. Cytom. Part A 2006, 69, 212–221. [Google Scholar] [CrossRef] [PubMed]
  37. Seifer, M.; Hamatake, R.K.; Colonno, R.J.; Standring, D.N. In Vitro Inhibition of Hepadnavirus Polymerases by the Triphosphates of BMS-200475 and Lobucavir. Antimicrob. Agents Chemother. 1998, 42, 3200–3208. [Google Scholar] [CrossRef] [PubMed]
  38. Rinaldi, C.; Pizzul, P.; Longhese, M.P.; Bonetti, D. Sensing R-Loop-Associated DNA Damage to Safeguard Genome Stability. Front. Cell Dev. Biol. 2021, 8, 618157. [Google Scholar] [CrossRef] [PubMed]
  39. Promonet, A.; Padioleau, I.; Liu, Y.; Sanz, L.; Biernacka, A.; Schmitz, A.-L.; Skrzypczak, M.; Sarrazin, A.; Mettling, C.; Rowicka, M.; et al. Topoisomerase 1 prevents replication stress at R-loop-enriched transcription termination sites. Nat. Commun. 2020, 11, 1–12. [Google Scholar] [CrossRef]
  40. Zimmer, J.; Tacconi, E.M.C.; Folio, C.; Badie, S.; Porru, M.; Klare, K.; Tumiati, M.; Markkanen, E.; Halder, S.; Ryan, A.; et al. Targeting BRCA1 and BRCA2 Deficiencies with G-Quadruplex-Interacting Compounds. Mol. Cell 2016, 61, 449–460. [Google Scholar] [CrossRef]
  41. Chang, E.Y.-C.; Tsai, S.; Aristizabal, M.J.; Wells, J.P.; Coulombe, Y.; Busatto, F.F.; Chan, Y.A.; Kumar, A.; Zhu, Y.D.; Wang, A.Y.-H.; et al. MRE11-RAD50-NBS1 promotes Fanconi Anemia R-loop suppression at transcription–replication conflicts. Nat. Commun. 2019, 10, 4265. [Google Scholar] [CrossRef]
  42. Lisby, M.; Barlow, J.H.; Burgess, R.C.; Rothstein, R. Choreography of the DNA damage response: Spatiotemporal relationships among checkpoint and repair proteins. Cell 2004, 118, 699–713. [Google Scholar] [CrossRef]
  43. Du, L.L.; Nakamura, T.M.; Russell, P. Histone modification-dependent and -independent pathways for recruitment of checkpoint protein Crb2 to double-strand breaks. Genes Dev. 2006, 20, 1583–1596. [Google Scholar] [CrossRef]
  44. Jazayeri, A.; Falck, J.; Lukas, C.; Bartek, J.; Smith, G.C.M.; Lukas, J.; Jackson, S.P. ATM- and cell cycle-dependent regulation of ATR in response to DNA double-strand breaks. Nat. Cell Biol. 2006, 8, 37–45. [Google Scholar] [CrossRef]
  45. Hicks, W.M.; Yamaguchi, M.; Haber, J.E. Real-time analysis of double-strand DNA break repair by homologous recombination. Proc. Natl. Acad. Sci. USA 2011, 108, 3108–3115. [Google Scholar] [CrossRef]
  46. Mehta, A.; Haber, J.E. Sources of DNA Double-Strand Breaks and Models of Recombinational DNA Repair. Cold Spring Harb. Perspect. Biol. 2014, 6, a016428. [Google Scholar] [CrossRef]
  47. Hsiang, Y.H.; Lihou, M.G.; Liu, L.F. Arrest of replication forks by drug-stabilized topoisomerase I-DNA cleavable complexes as a mechanism of cell killing by camptothecin. Cancer Res. 1989, 49, 5077–5082. [Google Scholar] [PubMed]
  48. Wan, S.; Capasso, H.; Walworth, N.C. The topoisomerase I poison camptothecin generates a Chk1-dependent DNA damage checkpoint signal in fission yeast. Yeast 1999, 15, 821–828. [Google Scholar] [CrossRef]
  49. Tsao, Y.P.; D’Arpa, P.; Liu, L.F. The involvement of active DNA synthesis in camptothecin-induced G2 arrest: Altered regulation of p34cdc2/cyclin B. Cancer Res. 1992, 52, 1823–1829. [Google Scholar] [PubMed]
  50. Acilan, C.; Potter, D.M.; Saunders, W.S. DNA repair pathways involved in anaphase bridge formation. Genes Chromosom. Cancer 2007, 46, 522–531. [Google Scholar] [CrossRef]
  51. Liu, Y.; Nielsen, C.F.; Yao, Q.; Hickson, I.D. The origins and processing of ultra fine anaphase DNA bridges. Curr. Opin. Genet. Dev. 2014, 26, 1–5. [Google Scholar] [CrossRef]
  52. Karpenshif, Y.; Bernstein, K.A. From yeast to mammals: Recent advances in genetic control of homologous recombination. DNA Repair. 2012, 11, 781–788. [Google Scholar] [CrossRef]
  53. Alabert, C.; Bianco, J.N.; Pasero, P. Differential regulation of homologous recombination at DNA breaks and replication forks by the Mrc1 branch of the S-phase checkpoint. EMBO J. 2009, 28, 1131–1141. [Google Scholar] [CrossRef]
  54. Aylon, Y.; Kupiec, M. New insights into the mechanism of homologous recombination in yeast. Mutat. Res. Mol. Mech. Mutagen. 2004, 566, 231–248. [Google Scholar] [CrossRef]
  55. Branzei, D.; Foiani, M. Interplay of replication checkpoints and repair proteins at stalled replication forks. DNA Repair. 2007, 6, 994–1003. [Google Scholar] [CrossRef] [PubMed]
  56. Sogo, J.M.; Lopes, M.; Foiani, M. Fork reversal and ssDNA accumulation at stalled replication forks owing to checkpoint defects. Science 2002, 297, 599–602. [Google Scholar] [CrossRef] [PubMed]
  57. Hu, J.; Sun, L.; Shen, F.; Chen, Y.; Hua, Y.; Liu, Y.; Zhang, M.; Hu, Y.; Wang, Q.; Xu, W.; et al. The intra-S phase checkpoint targets Dna2 to prevent stalled replication forks from reversing. Cell 2012, 149, 1221–1232. [Google Scholar] [CrossRef] [PubMed]
  58. Hoffman, C.S.; Wood, V.; Fantes, P.A. An Ancient Yeast for Young Geneticists: A Primer on the Schizosaccharomyces pombe Model System. Genetics 2015, 201, 403–423, Erratum in Genetics 2016, 202, 1241. [Google Scholar] [CrossRef]
  59. Sipiczki, M. Where does fission yeast sit on the tree of life? Genome Biol. 2000, 1, reviews1011.1. [Google Scholar] [CrossRef] [PubMed]
  60. Vyas, A.; Freitas, A.V.; Ralston, Z.A.; Tang, Z. Fission Yeast Schizosaccharomyces pombe: A Unicellular “Micromammal” Model Organism. Curr. Protoc. 2021, 1, e151, Erratum in Curr. Protoc. 2021, 1, e225. [Google Scholar] [CrossRef]
  61. Chhipa, M.A.; Sanayhie, S.A.; Sabatinos, S.A. Assessing Drug Sensitivity in Fission Yeast Using Half-Maximal Inhibitory Concentration (IC50) Assays. Methods Mol. Biol. 2025, 2862, 241–253. [Google Scholar] [CrossRef]
  62. Boeckemeier, L.; Kraehenbuehl, R.; Keszthelyi, A.; Gasasira, M.U.; Vernon, E.G.; Beardmore, R.; Vågbø, C.B.; Chaplin, D.; Gollins, S.; Krokan, H.E.; et al. Mre11 exonuclease activity removes the chain-terminating nucleoside analog gemcitabine from the nascent strand during DNA replication. Sci. Adv. 2020, 6, eaaz4126. [Google Scholar] [CrossRef]
  63. Alyahya, M.Y.; Khan, S.; Bhadra, S.; Samuel, R.E.; Xu, Y.-J. Replication stress induced by the ribonucleotide reductase inhibitor guanazole, triapine and gemcitabine in fission yeast. FEMS Yeast Res. 2022, 22, foac014. [Google Scholar] [CrossRef]
  64. Fleck, O.; Fahnøe, U.; Løvschal, K.V.; Gasasira, M.-F.U.; Marinova, I.N.; Kragelund, B.B.; Carr, A.M.; Hartsuiker, E.; Holmberg, C.; Nielsen, O. Deoxynucleoside Salvage in Fission Yeast Allows Rescue of Ribonucleotide Reductase Deficiency but Not Spd1-Mediated Inhibition of Replication. Genes 2017, 8, 128. [Google Scholar] [CrossRef]
  65. Hodson, J.A.; Bailis, J.M.; Forsburg, S.L. Efficient labeling of fission yeast Schizosaccharomyces pombe with thymidine and BUdR. Nucleic Acids Res. 2003, 31, 134e. [Google Scholar] [CrossRef]
  66. Sabatinos, S.A.; Forsburg, S.L. Molecular genetics of Schizosaccharomyces pombe. Methods Enzymol. 2010, 470, 759–795. [Google Scholar] [CrossRef] [PubMed]
  67. Petersen, J.; Russell, P. Growth and the Environment of Schizosaccharomyces pombe. Cold Spring Harb. Protoc. 2016, pdb.top079764, Erratum in Cold Spring Harb. Protoc. 2016, pdb.err093682. Erratum in Cold Spring Harb. Protoc. 2016. [Google Scholar] [CrossRef] [PubMed]
  68. Karam, E.; Sabatinos, S.A. Investigating Fission Yeast Mutagenesis Using Canavanine Sensitivity Assays. Methods Mol. Biol. 2025, 2862, 195–208. [Google Scholar] [CrossRef] [PubMed]
  69. Schindelin, J.; Arganda-Carreras, I.; Frise, E.; Kaynig, V.; Longair, M.; Pietzsch, T.; Preibisch, S.; Rueden, C.; Saalfeld, S.; Schmid, B.; et al. Fiji: An open-source platform for biological-image analysis. Nat. Methods 2012, 9, 676–682. [Google Scholar] [CrossRef]
  70. Rhind, N.; Russell, P. Chk1 and Cds1: Linchpins of the DNA damage and replication checkpoint pathways. J. Cell Sci. 2000, 113, 3889–3896. [Google Scholar] [CrossRef]
  71. Bentley, N.J.; Holtzman, D.A.; Flaggs, G.; Keegan, K.S.; DeMaggio, A.; Ford, J.C.; Hoekstra, M.; Carr, A.M. The Schizosaccharomyces pombe rad3 checkpoint gene. EMBO J. 1996, 15, 6641–6651. [Google Scholar] [CrossRef]
  72. Sabatinos, S.A.; Green, M.D.; Forsburg, S.L. Continued DNA Synthesis in Replication Checkpoint Mutants Leads to Fork Collapse. Mol. Cell. Biol. 2012, 32, 4986–4997. [Google Scholar] [CrossRef]
  73. Yanagida, M. Fission yeast cut mutations revisited: Control of anaphase. Trends Cell Biol. 1998, 8, 144–149. [Google Scholar] [CrossRef] [PubMed]
  74. Chen, G.; Deng, X. Cell Synchronization by Double Thymidine Block. Bio-Protocol 2018, 8, e2994. [Google Scholar] [CrossRef]
  75. Hung, C.-W.; Martínez-Márquez, J.Y.; Javed, F.T.; Duncan, M.C. A simple and inexpensive quantitative technique for determining chemical sensitivity in Saccharomyces cerevisiae. Sci. Rep. 2018, 8, 11919. [Google Scholar] [CrossRef]
  76. Alexandrov, L.B.; Kim, J.; Haradhvala, N.J.; Huang, M.N.; Alvin, W.T.-N.; Yang, W.; Arnoud, B.; Kyle, R.C.; Dmitry, A.G.; Erik, N.B.; et al. The repertoire of mutational signatures in human cancer. Nature 2020, 578, 94–101, Erratum in Nature. 2023, 614, E41. [Google Scholar] [CrossRef]
  77. Bohnert, K.A.; Gould, K.L. Cytokinesis-based constraints on polarized cell growth in fission yeast. PLoS Genet. 2012, 8, e1003004, Erratum in PLoS Genet. 2013, 9. [Google Scholar] [CrossRef]
  78. Kippert, F.; Lloyd, D. The aniline blue fluorochrome specifically stains the septum of both live and fixed Schizosaccharomyces pombe cells. FEMS Microbiol. Lett. 1995, 132, 215–219. [Google Scholar] [CrossRef] [PubMed]
  79. Heinemann, V. Gemcitabine: Progress in the Treatment of Pancreatic Cancer. Oncology 2000, 60, 8–18. [Google Scholar] [CrossRef] [PubMed]
  80. Jia, Y.; Xie, J. Promising molecular mechanisms responsible for gemcitabine resistance in cancer. Genes Dis. 2015, 2, 299–306. [Google Scholar] [CrossRef]
  81. Höfer, S.; Frasch, L.; Brajkovic, S.; Putzker, K.; Lewis, J.; Schürmann, H.; Leone, V.; Sakhteman, A.; The, M.; Bayer, F.P.; et al. Gemcitabine and ATR inhibitors synergize to kill PDAC cells by blocking DNA damage response. Mol. Syst. Biol. 2025, 21, 231–253. [Google Scholar] [CrossRef]
  82. Masterson, J.C.; O’DEa, S. 5-Bromo-2-deoxyuridine activates DNA damage signalling responses and induces a senescence-like phenotype in p16-null lung cancer cells. Anti-Cancer Drugs 2007, 18, 1053–1068. [Google Scholar] [CrossRef]
  83. Duong, H.; Bin Hong, Y.; Kim, J.S.; Lee, H.; Yi, Y.W.; Kim, Y.J.; Wang, A.; Zhao, W.; Cho, C.H.; Seong, Y.; et al. Inhibition of checkpoint kinase 2 (CHK2) enhances sensitivity of pancreatic adenocarcinoma cells to gemcitabine. J. Cell. Mol. Med. 2013, 17, 1261–1270. [Google Scholar] [CrossRef] [PubMed]
  84. Kianfard, Z.; Chhipa, M.A.; Kianfard, Z.; Karam, E.; Magalage, S.P.; Sabatinos, S.A. Genetic profiles of gemcitabine sensitivity in Schizosaccharomyces pombe. bioRxiv 2025. [CrossRef]
  85. Dixon, S.J.; Andrews, B.; Boone, C. Exploring the conservation of synthetic lethal genetic interaction networks. Commun. Integr. Biol. 2009, 2, 78–81. [Google Scholar] [CrossRef] [PubMed]
  86. Brown, J.S.; O’CArrigan, B.; Jackson, S.P.; Yap, T.A. Targeting DNA Repair in Cancer: Beyond PARP Inhibitors. Cancer Discov. 2017, 7, 20–37. [Google Scholar] [CrossRef]
  87. Turk, A.A.; Wisinski, K.B. PARP inhibitors in breast cancer: Bringing synthetic lethality to the bedside. Cancer 2018, 124, 2498–2506. [Google Scholar] [CrossRef] [PubMed]
  88. Min, A.; Im, S.-A.; Yoon, Y.-K.; Song, S.-H.; Nam, H.-J.; Hur, H.-S.; Kim, H.-P.; Lee, K.-H.; Han, S.-W.; Oh, D.-Y.; et al. RAD51C-Deficient Cancer Cells Are Highly Sensitive to the PARP Inhibitor Olaparib. Mol. Cancer Ther. 2013, 12, 865–877. [Google Scholar] [CrossRef]
  89. Zhao, L.; So, C.W.E. PARP-inhibitor-induced synthetic lethality for acute myeloid leukemia treatment. Exp. Hematol. 2016, 44, 902–907. [Google Scholar] [CrossRef]
  90. Fordham, S.E.; Blair, H.J.; Elstob, C.J.; Plummer, R.; Drew, Y.; Curtin, N.J.; Heidenreich, O.; Pal, D.; Jamieson, D.; Park, C.; et al. Inhibition of ATR acutely sensitizes acute myeloid leukemia cells to nucleoside analogs that target ribonucleotide reductase. Blood Adv. 2018, 2, 1157–1169. [Google Scholar] [CrossRef]
  91. Bradbury, A.; Hall, S.; Curtin, N.; Drew, Y. Targeting ATR as Cancer Therapy: A new era for synthetic lethality and synergistic combinations? Pharmacol. Ther. 2020, 207, 107450. [Google Scholar] [CrossRef] [PubMed]
  92. Lynx, M.D.; Bentley, A.T.; McKee, E.E. 3′-Azido-3′-deoxythymidine (AZT) inhibits thymidine phosphorylation in isolated rat liver mitochondria: A possible mechanism of AZT hepatotoxicity. Biochem. Pharmacol. 2006, 71, 1342–1348. [Google Scholar] [CrossRef][Green Version]
  93. Francisco, B.; García-Benayas, T.; Juan, J.d.l.C.; Juan, G.-L.; Vincent, S. First-Line Therapy and Mitochondrial Damage: Different Nucleosides, Different Findings. HIV Clin. Trials 2003, 4, 11–19. [Google Scholar] [CrossRef] [PubMed]
  94. Sutera, V.A.; Lovett, S.T. The role of replication initiation control in promoting survival of replication fork damage. Mol. Microbiol. 2006, 60, 229–239. [Google Scholar] [CrossRef]
  95. Canadian Cancer Statistics Advisory in collaboration with, the Canadian Cancer Society, Statistics Canada and the, Public Health Agency of Canada. Canadian Cancer Statistics: A 2022 Special Report on Cancer Prevalence. 2022. Available online: https://cdn.cancer.ca/-/media/files/research/cancer-statistics/2022-statistics/2022-special-report/2022_prevalence_report_final_en.pdf?rev=7755f9f350e845d58e268a59e3be608e&hash=3F3F30CADD8CAF0049636B5A41EDBB13&_gl=1*21rw8e*_ga*MTI5OTE3MTQ0Ni4xNjQzMzA0MDMz*_ga_23YMKBE2C3*MTY2NzkxMDY0My4zMTcuMS4xNjY3OTEwNjQ2LjU3LjAuMA (accessed on 1 July 2023).
  96. Bukhari, A.B.; Chan, G.K.; Gamper, A.M. Targeting the DNA Damage Response for Cancer Therapy by Inhibiting the Kinase Wee1. Front. Oncol. 2022, 12, 828684. [Google Scholar] [CrossRef]
  97. Fu, S.; Yao, S.; Previs, R.A.; Elias, A.D.; Carvajal, R.D.; George, T.J.; Yuan, Y.; Yu, L.; Westin, S.N.; Xing, Y.; et al. Multicenter Phase II Trial of the WEE1 Inhibitor Adavosertib in Refractory Solid Tumors Harboring CCNE1 Amplification. J. Clin. Oncol. 2023, 41, 1725–1734. [Google Scholar] [CrossRef]
  98. Cuneo, K.C.; Morgan, M.A.; Sahai, V.; Schipper, M.J.; Parsels, L.A.; Parsels, J.D.; Devasia, T.; Al-Hawaray, M.; Cho, C.S.; Nathan, H.; et al. Dose Escalation Trial of the Wee1 Inhibitor Adavosertib (AZD1775) in Combination with Gemcitabine and Radiation for Patients with Locally Advanced Pancreatic Cancer. J. Clin. Oncol. Off. J. Am. Soc. Clin. Oncol. 2019, 37, 2643–2650. [Google Scholar] [CrossRef] [PubMed]
  99. Mueller, S.; Cooney, T.; Yang, X.; Pal, S.; Ermoian, R.; Gajjar, A.; Liu, X.; Prem, K.; Minard, C.G.; Reid, J.M.; et al. Wee1 kinase inhibitor adavosertib with radiation in newly diagnosed diffuse intrinsic pontine glioma: A Children’s Oncology Group phase I consortium study. Neuro-Oncol. Adv. 2022, 4, vdac073. [Google Scholar] [CrossRef] [PubMed]
  100. Zhang, C.; Peng, K.; Liu, Q.; Huang, Q.; Liu, T. Adavosertib and beyond: Biomarkers, drug combination and toxicity of WEE1 inhibitors. Crit. Rev. Oncol. 2023, 193, 104233. [Google Scholar] [CrossRef]
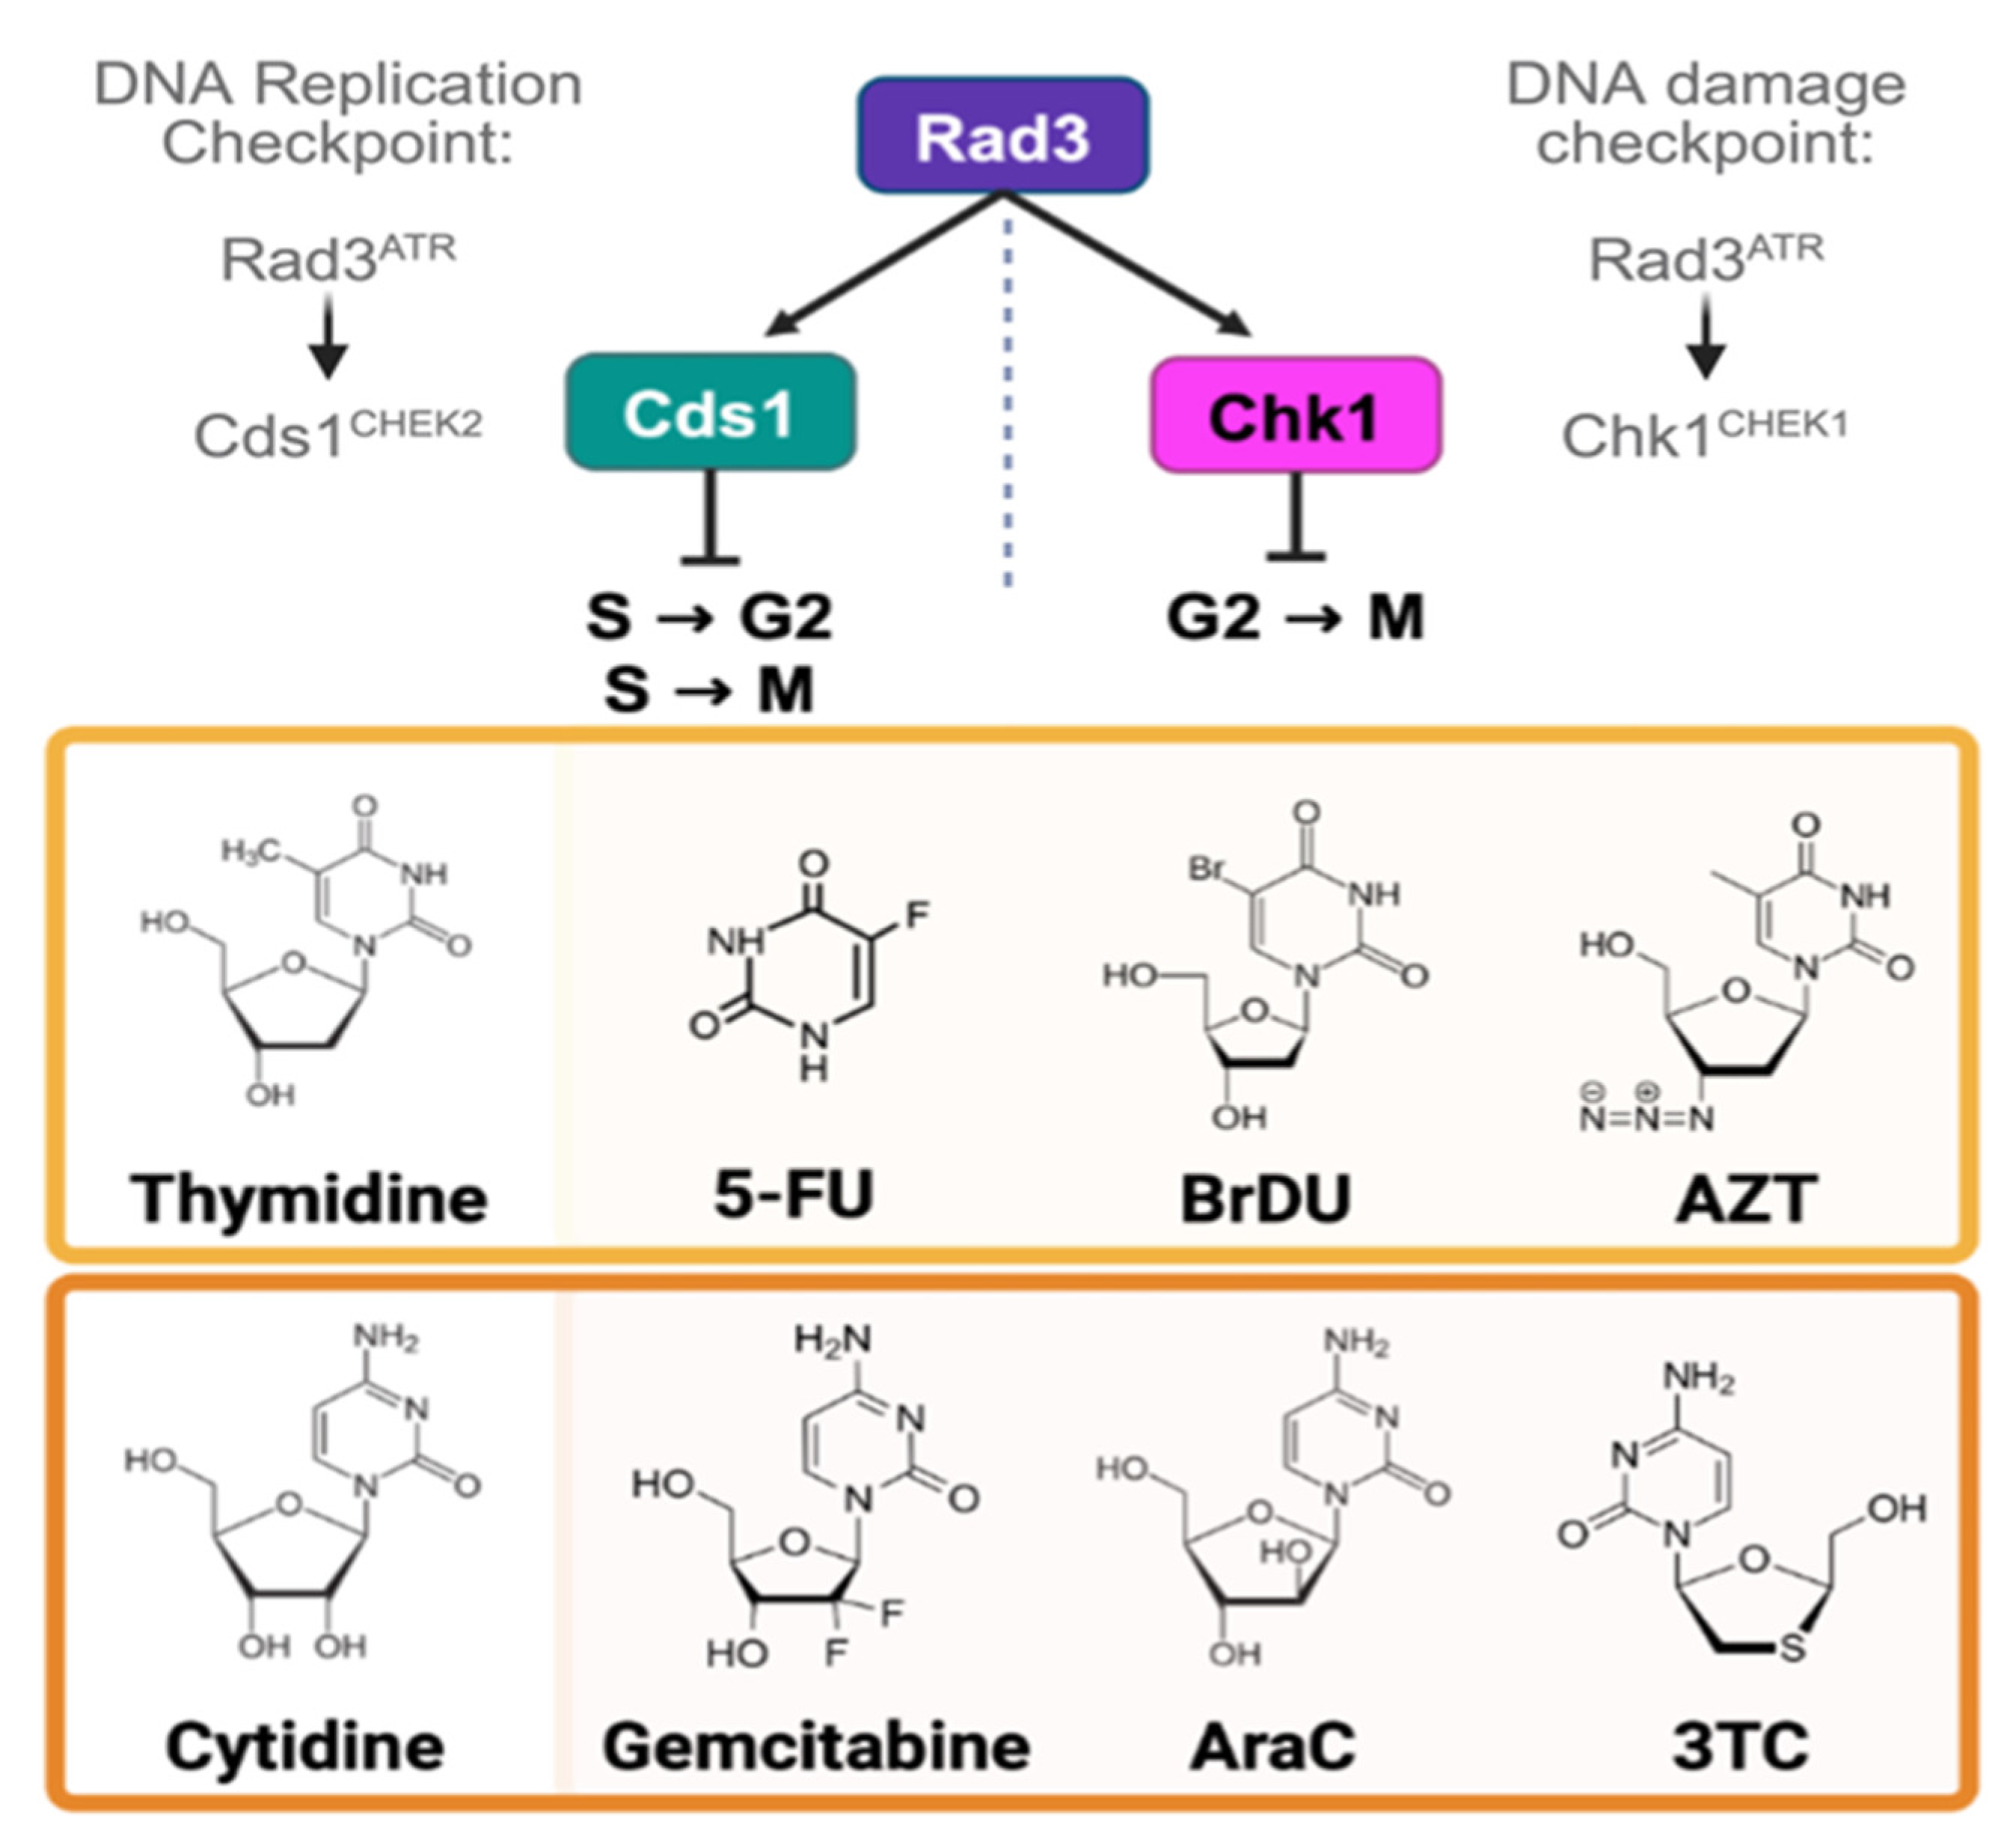
Figure 1. Checkpoint pathways and nucleoside analogues. A flow chart of the DNA replication (left) and DNA damage checkpoint pathways in S. pombe. Rad3, homologue of human ATR, is an upstream kinase that is activated in response to both DNA replication instability and DNA damage, primarily DNA double strand breaks (DSBs). During replication stress, Rad3 phosporylates Cds1 kinase, homologue of human CHEK2. In G2 response to DSBs, Rad3 phosphorylates Chk1 kinase, homologue of human CHEK1. Below, chemical structures of nucleoside analogues are shown. In the middle, thymidine is compared to its analogues 5′fluorouracil (5′FU), bromodeoxyuridine (BrdU), and zidovudine (AZT). The bottom row shows a chemical structure of cytidine and its analogues gemcitabine, cytarabine (AraC), and lamivudine (3TC). Created in BioRender. Sabatinos, S. (2025) https://BioRender.com/39ftplw (accessed on 10 August 2025).
Cimb 47 00756 g001
Figure 2. DNA replication checkpoint activity protects cells from thymidine analogue toxicity in fission yeast. (AD). Dose–response curves of S. pombe liquid culture growth. Optical density at 600 nm was used to measure proliferation. Shown are average points/curves with standard deviation from a minimum of 4 experimental replicates in (A) thymidine (Thy), (B) 5 fluorouracil (5FU), (C) bromodeoxyuridine (BrdU), and (D) zidovudine (AZT). In (i) average plots were used to model growth at doses of the analogue and calculate half-maximal growth-inhibition (IC50) doses for each strain. In (ii) he average IC50 value in µM is shown for each checkpoint mutant strain. Strains that were not sensitive have an IC50 value above 500 µM (>500, charts), which was the highest dose used. A 95% confidence interval and R2 value from 4 experimental replicates were calculated around the IC50 dose. In (iii), the area under the curve (AUC) was calculated from a minimum of 4 experimental replicates and is plotted with standard deviation. One-way ANOVA was used to compare AUC for each strain in each analogue (* p < 0.05). (iv) Cultures were pinned onto the growth medium after 48 h exposure to the analogue. Plates were grown and photographed to detect whether an analogue caused growth arrest or cell death.
Cimb 47 00756 g002
Figure 3. Cytidine analogues gemcitabine and AraC decrease S. pombe proliferation. As in Figure 2, cytidine analogues were tested in wild type (WT), chk1∆, cds1∆, and rad3∆ strains. (A) Gemcitabine (Gem), (B) cytarabine (AraC), and (C) lamivudine (3TC) were assessed in a minimum of 4 experimental replicates of dose–response curves. An average curve of each strain/drug is presented in panel (i). Standard deviation is shown around each average point. The calculated curve was used to generate an IC50 value in µM; strains that did not show growth inhibition by OD600 were described as having an IC50 above 500 µM (ii). The area under the curve (AUC), * p < 0.05, (iii) describes differences in OD600 response curves. AUC values from 4 experimental replicates were plotted and are shown with standard deviation. One-way ANOVA was used to detect differences in AUC (** p < 0.01; **** p < 0.0001). Absence of connecting line and asterisk indicates that there was no significant difference. In (iv), cells were spotted after the 48 h drug incubation onto solid media, and grown in the absence of the drug for 24 h at 30 °C. Pinned spots describe whether a strain is killed by the nucleoside analogue at a given dose.
Cimb 47 00756 g003
Figure 4. IC50 doses of BrdU and gemcitabine induce DNA mis-segregation, whilst higher doses promote drug-resistant morphologies. (A) Cells after 48 h analogue exposure were spotted onto plain YES medium and grown for 48 h at 30 °C. All analogues were grown and compared within the same plate to assess differences caused by each analogue, and different doses. Untreated cells are the left-most column for each strain (wild type, chk1∆, cds1∆, rad3∆); the triangle shows increasing dose from 25 µM dose (left) to 500 µM. We found that strains that are sensitive to analogue and generate an IC50 value (Figure 2 and Figure 3) tended to generate less spot density/cell growth near the IC50 dose. The cds1∆ and rad3∆ strains frequently grew better after high-dose exposure (500 µM) spots, and often generated large single colonies on small background growth (seen in this cds1∆ image for AraC and BrdU). (B) Wild type and rad3∆ cells exposed to gemcitabine were fixed and stained to detect DNA and septum morphologies with no drug, IC50 (rad3∆~1 µM), and 500 µM. Wild type cells do not show decreased growth by OD600 and no IC50 sample was possible. Large cells, DNA mis-segregation, and septum abnormalities are seen in rad3∆ around the IC50 dose, like what is seen in wild type at a 500 µM dose. Scale bars 10 µm. (C) Cell lengths were measured and are presented in different gemcitabine doses from 3 experimental replicates. Repeated measures ANOVA was used to compare cell lengths, and calculated statistical p-values are shown above brackets. (D) Binucleate (G1) and septated (S-phase) cells were counted as a proportion of the total population from BrdU treated images. A Z-test with Yates’ continuity correction was used to compare each set of untreated (no drug ND) to treated (*** p < 0.001). Gemcitabine causes G1/S accumulation at both doses in rad3∆, and at 500 µM in wild type. (E) Gemcitabine causes mis-segregation in rad3∆ cells at the IC50 dose, or in wild type at 500 µM. Cells with anucleate, multiple nuclei (*), or mis-segregated DNA (<) are presented as a fraction of the total number of cells. A Z-test with Yates’ continuity correction was used to compare within each set, ** p < 0.01, *** p < 0.001.
Cimb 47 00756 g004
Figure 5. IC50 doses of BrdU cause elongation, G1/S accumulation, and DNA mis-segregation that alter nucleoside analogue resistance. (A) Microscopic images after 48 h BrdU treatment, scale bars 10 µm. DNA mis-segregation events including additional nuclei (*) or septation errors (<) were observed in all cells at the IC50 dose of 5–25 µM BrdU or 500 µM. (B) Tip-to-tip cell length increases in BrdU and is longest at the IC50 dose. Three (3) experimental replicates were assessed using a violin plot showing the mean and 25%/75% quartiles (note: population averages and SD reported in Table 4). The difference between no BrdU and treatments in each strain was calculated using repeated measures ANOVA with correction (* p < 0.05; *** p < 0.001, ns—not significant). (C) Binucleate (G1) and septated (S-phase) cells were counted as a proportion of the total cell population. A Z-test with Yates’ continuity correction was used to compare each set. Each strain has a statistically significant increase in G1/S-% with both BrdU doses, compared to no BrdU. In chk1∆, the proportion of G1/S cells is increased at the 5 µM IC50 dose compared to 500 µM. (D) Nuclear mis-segregation is increased in BrdU at an IC50 dose (5 µM) in all strains. Cells with atypical DNA segregation, including anucleate, cut, multiple nuclei, or lagging chromosomes, were counted as a proportion of the total number of cells. A Z-test with Yates’ continuity correction was used to compare within each strain, ns—not significant, ** p < 0.01, *** p < 0.001. Wild type cells show more mis-segregation at 500 µM compared to no BrdU. All other strains did not have a statistically different proportion of mis-segregation at 500 µM. (E) After 48 h BrdU exposure, cultures were spotted onto FUdR to test for hsv-tk+ function. Nucleoside analogue-sensitive cells require hsv-tk+ for sensitivity to BrdU (0 µM dose column). With increasing BrdU, spots acquire additional FUdR-insensitive cells, even as the number of viable cells decreases (compare to Figure 2(Civ)).
Cimb 47 00756 g005
Figure 6. Summary of mechanisms and effects from nucleoside analogue dose and cellular checkpoint status. (A). The highest dose of fully surviving spots on YES pinned plates was recorded (n = 4) as the highest dose of each analogue that did not decrease subsequent spot growth on YES. This “toxic dose” was the point above which growth of surviving cells was compromised. (B). The IC50 dose inhibited proliferation in the OD600 assay. Replicate IC50 values (n = 4) were compared in a heat map. Compounds without an effect or a calculated IC50 above 500 were reported as 500. (C). Summary of the checkpoint-dependent importance of the replication checkpoint (Rep) or DNA damage checkpoint (DSB) importance on nucleoside analogue sensitivities. A low-dose IC50 or toxic dose (<50 µM) affecting cds1∆ or rad3∆ mutants was scored as Rep “Strong” (score of 3, scale 0 to 3); if chk1∆ was impacted then DSB was scored. (D). A model of nucleoside analogue dose-dependent effects. Below a strain specific IC50 dose of each analogue, no effect is seen. Yet, the wide-ranging of nucleoside analogues suggests that absence of effect may not indicate no effect at all, symbolized by the question mark (?). At the IC50 dose, some analogues caused toxicity, mis-segregation, and likely mutation (i), including BrdU, gemcitabine, and AraC. A second group of analogues ((ii) Thy, 5FU, 3TC) had an IC50 dose that was higher than the dose which caused toxicity; we predict that these analogues promote cell elongation and cell cycle arrest. There is a potential for mutation caused by skewed dNTP pools. At high doses above the IC50 (right), nucleoside analogues may suppress outwardly toxic effects. Cells do not elongate or show DNA mis-segregation. Predictions are denoted by *. We predict that high-dose nucleoside analogues impact nucleoside transporter functions and promote suppressor mutations that could cause drug resistance. Created in BioRender. Sabatinos, S. (2025) https://BioRender.com/c4gjg0s (accessed on 10 August 2025).
Cimb 47 00756 g006
Table 1. Fission yeast strains.
StrainIDGenotypeSource [Ref]
wild type (WT)SY 17h+ leu1–32::hENT1-leu1+ (pJAH29) his7–366::hsv-tk-his7+ (pJAH31) ura4-D18 ade6-M210Susan Forsburg [38]
cds1∆SY 91h+ cds1Δ::ura4+ leu1–32::hENT1-leu+ (pJAH29) his7–366::hsv-tk-his7+ (pJAH31) ura4-D18 ade6-M210Susan Forsburg [39]
chk1∆SY 92h+ chk1Δ::ura4+ leu1–32::hENT1-leu1+ (pJAH29) his7–366::hsv-tk-his7+ (pJAH31) ura4-D18 ade6-M210Susan Forsburg [39]
rad3∆SY 93h+ rad3∆::ura4+ leu1–32::hENT1-leu1+ (pJAH29) his7–366::hsv-tk-his7+ (pJAH31) ura4-D18 ade6-M210Susan Forsburg [39]
Table 2. IC50 values calculated from independent replicates, with standard deviation.
Calculated IC50 ± SD (n)
StrainThy5FUBrdUGemAraC
wild type (WT)>500 a (5)383 ± 458 (5)11.9 ± 4.2 (6)>500 (4)>500 (4)
chk1∆>500 a (4)>500 (4)7.7 ± 2.7 (4)>500 (4)37.9 ± 35.8 (4)
cds1∆21.6 ± 5.8 (3)73.6 ± 30.6 (4)15.9 ± 7.1 (4)2.2 ± 0.4 (4)13.6 ± 9.3 (3)
rad3∆14.9 ± 1.1 (4)36.1 ± 16.2 (4)3.6 ± 1.3 (4)1.1 ± 0.1 (4)0.15 ± 0.05 (4)
In contrast to aggregate IC50 values presented in Figure 2 and Figure 3, this average is from non-normalized data. a: No IC50 value was calculated, and the IC50 value is reported as greater than the 500 µM highest dose used.
Table 3. Cells are longest in gemcitabine concentration near the IC50 dose for rad3∆.
GemGem Dose (µM)Mean Length ± SD (µm)Number of Cells (n)p-Value (Untreated Compared to Treated)
Wild type06.5 (1.1)100
50010.9 (5.5)1050.005
rad3∆06.3 (0.1)301 (3)
IC5010.7 (0.7)312 (3)0.01
5008.8 (0.5)304 (3)0.03
The rad3∆ cells are affected by either 1 µm or 500 µM gemcitabine. Despite no obvious gemcitabine sensitivity, wild type cells are longer at 500 µM gemcitabine dose. Tip-to-tip or tip-to-septum mean cell lengths are shown in µm ± standard deviation. The p value indicates if there is a statistically significant difference between the cell lengths at each dose of drug relative to no treatment. A repeated measures one-way ANOVA test was used, assuming Gaussian distribution and the Geisser–Greenhouse correction for matched data sets. Tukey’s multiple comparisons correction was applied.
Table 4. All strains elongate in BrdU at an IC50 dose.
BrdUBrdU Dose (µM)Mean Length (±SD, µm)Number of Cells (n)p Value (Significance)
Wild type06.5 (0.9)289
515.9 (1.9)3170.05 (*)
50011.1 (1.1)2820.10 (ns)
cds1∆06.3 (0.4)282
512.5 (2.1)2240.05 (*)
5006.9 (0.3)2080.12 (ns)
chk1∆06.7 (0.5)287
512.3 (0.7)2690.02 (*)
5007.6 (1.3)3060.60 (ns)
rad3∆06.5 (0.4)306
510.1 (0.3)292<0.0001 (***)
5008.7 (0.3)308<0.04 (*)
Cell lengths were measured without BrdU (0 µM), in an IC50 dose (used 5 µM as an average of IC50 values), or in 500 µM BrdU. Cells were measured tip-to-tip or septum to tip. Three (3) experimental populations were measured, and N used in statistics was 3; the total number of cells within these replicates is reported (n). Average cell length per strain is compared between no treatment and each dose. A repeated measure one-way ANOVA test was used with Tukey’s correction. Each p-value indicates whether the difference between untreated or BrdU treatment is significantly different (* p < 0.01; *** p < 0.001; not significant, ns).
Disclaimer/Publisher’s Note: The statements, opinions and data contained in all publications are solely those of the individual author(s) and contributor(s) and not of MDPI and/or the editor(s). MDPI and/or the editor(s) disclaim responsibility for any injury to people or property resulting from any ideas, methods, instructions or products referred to in the content.