Article

The Interaction of DMRTA2 with HSP90β Inhibits p53 Ubiquitination and Activates the p53 Pathway to Suppress the Malignant Progression of Non-Small-Cell Lung Cancer

Department of Pathology, The First Affiliated Hospital of China Medical University, 155 Nanjing Street, Heping District, Shenyang 110001, China
*
Author to whom correspondence should be addressed.
Curr. Issues Mol. Biol. 2025, 47(7), 497; https://doi.org/10.3390/cimb47070497
Submission received: 10 June 2025 / Revised: 21 June 2025 / Accepted: 26 June 2025 / Published: 28 June 2025

Abstract

Background: Lung cancer, predominantly NSCLC (80%), has a poor prognosis due to late diagnosis and limited treatment efficacy. DMRTA2 (DMRT5), a transcription factor linked to neural/germ cell development, is overexpressed in NSCLC per TCGA data, indicating its potential role in tumorigenesis and as a therapeutic target. Methods: Conduct a comprehensive search of the relevant theoretical foundations. Based on this, differential expression analysis will be performed using the DESeq2 package in R on RNA-seq data from lung adenocarcinoma and lung squamous cell carcinoma in the TCGA database. The research will then employ various methods, including CRISPR genome editing, MTS assay, flow cytometry, Western blot, co-immunoprecipitation, immunofluorescence, and qRT-PCR. Results: Through experimental validation, we found that DMRTA2 mRNA is highly expressed in non-small-cell lung cancer (NSCLC) tissues and is negatively correlated with poor prognosis. DMRTA2 binds to HSP90β, inhibiting the interaction between HSP90β and p53, thereby suppressing p53 ubiquitination and nuclear export. This activates the p53 pathway, inhibiting the proliferation and invasion of lung cancer cells. Conclusions: In NSCLC, DMRTA2 acts as a context-dependent regulator, stabilizing wild-type p53 through competitive HSP90β binding to suppress tumors, while in p53-compromised cells, potentially engaging HSP90β or alternative pathways to promote malignancy. Its dual localization and transport interactions reveal multifunctional, stress-responsive roles beyond transcription.

1. Introduction

Lung cancer is a complex, multi-step disease with various histological subtypes, and is a leading cause of cancer-related deaths in China. In recent years, both the incidence and mortality rates of lung cancer have sharply risen, driven by factors such as smoking, air pollution, and occupational exposure [1,2,3]. Histologically, lung cancer is classified into two main categories: non-small-cell lung cancer (NSCLC) and small-cell lung cancer (SCLC). NSCLC [4,5], which comprises adenocarcinoma, squamous cell carcinoma, and large cell carcinoma, accounts for approximately 80% of all lung cancer cases. Most NSCLC patients are diagnosed at advanced stages, where treatment options are limited, resulting in a five-year survival rate of less than 20% [5,6,7]. Currently, the main treatment modalities for advanced lung cancer are chemotherapy and radiotherapy [8,9]; however, drug resistance to chemotherapy and resistance to radiotherapy have become major obstacles in the treatment of lung cancer.
The TP53 gene is located at 17p13.1 in humans and encodes the p53 protein, which consists of 393 amino acids with a molecular weight of approximately 53 kDa. p53 is an essential transcription factor that contains a transcriptional activation domain at its N-terminus, a DNA-binding domain (DBD) in the central region, and a nuclear localization sequence along with a tetramerization domain at its C-terminus [10,11,12]. As the most common tumor suppressor, p53 inhibits tumor cell proliferation by inducing cell cycle arrest and promoting apoptosis [13,14]. The half-life of wild-type p53 is only 15–30 min. Upon DNA damage, oncogene activation, loss of cell contact, or hypoxia, p53 is activated to regulate the transcription of downstream genes and halt cell proliferation [15,16,17]. The inactivation of p53 promotes cancer development [18]. The main mechanisms include mutations in the TP53 gene or post-translational modifications and degradation of the p53 protein [19]. TP53 mutations may lead to a loss of p53 function or the acquisition of new functions by mutant p53. The primary reason for the inactivation of wild-type p53 is MDM2-mediated ubiquitination. MDM2 acts as a negative regulator of p53, degrading it via the ubiquitin–proteasome pathway [20]. MDM2 cooperates with the E2 ubiquitin-conjugating enzyme UBC5 to ubiquitinate p53 at six lysine residues in the C-terminus (K370, K372, K373, K381, K382, K386) [21], promoting its degradation or nuclear export. Low levels of MDM2 induce mono-ubiquitination, leading to the nuclear export of p53, whereas high levels induce poly-ubiquitination, promoting the nuclear degradation of p53. Studies have shown that p53 degradation can occur in both the nucleus and cytoplasm, and the nucleocytoplasmic shuttling of p53 and its co-localization with MDM2 are crucial for its degradation process [22,23,24].
Heat shock protein 90 (HSP90) is an important molecular chaperone responsible for assisting the folding, maturation, and stabilization of a large number of client proteins. HSP90β is a cytoplasmic isoform of HSP90, consisting of 724 amino acids and containing three conserved domains: the N-terminal domain, the C-terminal domain, and the middle domain. The N-terminal domain possesses ATP-binding activity, which is crucial for the conformational changes of HSP90β. In the cytoplasm, HSP90β typically exists as a homodimer, cycling between closed and open conformations through ATP binding and hydrolysis, thereby facilitating the proper folding of client proteins or participating in other processes [25].
The DMRTA2 gene is located at 1p32 and encodes the protein DMRTA2, a member of the DMRT family, which contains a DM domain that binds DNA and a DMA domain of yet an undefined function. The DM domain is a novel zinc finger structure composed of an α-helix and two antiparallel β-strands, with the α-recognition helix at the carboxy terminus capable of specifically recognizing DNA sequences and binding in the minor groove of the DNA double helix without inducing DNA bending [26]. Studies have shown that DMRTA2, as a transcription factor, participates in various biological processes, including the maintenance of neural progenitor cells [27], forebrain neurogenesis [28], and the development of germ cells [29,30,31,32]. However, the role of DMRTA2 in cancer remains unclear, particularly regarding its expression pattern and biological function in lung cancer. To clarify the function of DMRTA2 in NSCLC, we employed bioinformatics tools combined with a series of cell experiments to preliminarily investigate the impact of DMRTA2 on the malignant phenotype of NSCLC and its potential molecular mechanisms.

2. Methods and Materials

2.1. Bioinformatics

RNA sequencing data for lung adenocarcinoma and lung squamous cell carcinoma were obtained from The Cancer Genome Atlas (TCGA) database, and differential gene expression analysis was performed using the R (4.4.3) package DESeq2. The Gene Expression Omnibus (GEO) database was used to acquire the GSE176348 dataset, and differential analysis was conducted using the GEO2R online tool. The BioGRID ORCs database provided two CRISPR screen datasets related to cell proliferation: 209-PMID29083409 and 334-PMID29083409. The TIMER2.0 database was utilized for the expression analysis of DMRTA2 across various cancers.

2.2. Cell Culture

Human bronchial epithelial (HBE) cells and non-small-cell lung cancer cell lines H1975, HCC827, LK2, A549, SK-MES-1, and H1299 were obtained from the American Type Culture Collection (ATCC, Manassas, VA, USA), while the human large-cell lung cancer cell line H460 was purchased from the Shanghai Cell Bank, Shanghai, China. H1299, A549, H1975, and HCC827 cells were cultured in RPIM-1640 medium containing 10% fetal bovine serum (FBS) and 1% penicillin–streptomycin mixed antibiotics. HBE, LK2, and SK-MES-1 cells were cultured in high-glucose DMEM medium with 10% FBS and 1% antibiotics (a mixture of penicillin and streptomycin). All cells were maintained in a 37 °C incubator with 5% CO2 and humidity.

2.3. Cell Transfection

The pCMV6-Flag-DMRTA2 plasmid (EX-H2136-M35) and the control empty pCMV6-Flag plasmid were purchased from GeneCopoeia. PLentiCRISPRV2-U6-DMRTA2 (human)-sgRNA-1~2-EF1a-Cas9-P2A-GFP-puro and PLentiCRISPRV2-GFP were obtained from Miaoling Biotechnology, Wuhan, China. Transfection was performed using Lipo8000™ (Beyotime Biotechnology Co., Ltd., Shanghai, China) according to the manufacturer’s instructions when the cell density reached 70–80%. After 6 h, fresh culture medium was added, and subsequent experiments were conducted 24–48 h post-transfection. All transfections were compared against the control group transfected with the empty plasmid.

2.4. CRISPR Genome Editing

Using the online tool CHOPCHOP (http://chopchop.cbu.uib.no/, accessed on 6 April 2024), we designed the knockout sequences for the DMRTA2 gene. The selected sgRNA sequences were ACGCGTGTCAAGATATCCAGCGC and CTAAAGGCGTAGTCCATGGGTGG. These two sgRNA sequences were then separately cloned into the PLentiCRISPRV2-GFP vector.

2.5. MTS Experiment

After 24 h of transfection, digest the cells with 0.25% trypsin and resuspend them in 1 mL of complete culture medium. Collect the cell suspension into a 1.5 mL centrifuge. Gently pipette to mix the cell suspension, then take 10 μL of the cell suspension and add it to a centrifuge tube containing 90 μL of PBS for dilution. Wipe the cell counting plate and coverslip with alcohol. After mixing the diluted cell suspension, add 10 μL of the dilution to each side of the counting plate and count under a microscope. Based on the average count, calculate the total volume of the cell suspension and culture medium needed to seed 3000 cells per well in a 96-well plate. Incubate the cells in a 37 °C, 5% CO2 incubator for 6 h, then add 20 μL of MTS solution to each well. Continue incubating in the dark for 2–4 h and measure the absorbance at 490 nm using a microplate reader to obtain the data for day 1. The same method was used to measure absorbance on days 2–5 at the same time points. The obtained data were statistically analyzed using GraphPad Prism 10.2.1 software, with each experimental group repeated more than three times.

2.6. Colony Formation Experiment

Cells transfected for 24–48 h were digested with 0.25% trypsin to prepare a 1 mL cell suspension for counting. In a six-well plate, 2 mL of complete culture medium was added, followed by the addition of 1000 cells, which were gently mixed. The cells were then incubated at 37 °C with 5% CO2 for 7–14 days, with medium changes during this period until visible colonies formed. The cells were washed three times with PBS, and 1 mL of ice-cold methanol was added to each well and fixed at −20 °C for 15–20 min. After removing the methanol, the cells were washed three times with PBS, and 1 mL of crystal violet staining solution was added for 15–30 min, followed by rinsing with tap water. After drying the six-well plate, images were captured using an ECL bioimaging system, processed with ImageJ 1.8.0, and statistically analyzed using GraphPad Prism software. Each experimental group was repeated more than three times.

2.7. Transwell Experiment

Cells transfected for 24–48 h were digested with 0.25% trypsin to prepare a 1 mL cell suspension for counting. Each chamber was filled with 20,000 cells, with the lower chamber containing 20% FBS medium and the upper chamber containing 2% FBS medium. After incubating the cells at 37 °C with 5% CO2 for 24–48 h, they were washed three times with PBS. The cells were then fixed with ice-cold methanol for 15–20 min, washed three times with PBS, and stained with crystal violet for 15–30 min, followed by rinsing with tap water. Using a moist cotton swab, the cells on the inner side of the chamber were wiped away, and after drying, images were captured under an inverted microscope. Statistical analysis was performed using GraphPad Prism software, with each experimental group repeated more than three times.

2.8. Flow Cytometry

Following 24–48h transfection, cells were digested with 0.25% trypsin and transferred to 1.5 mL centrifuge tubes. After centrifugation at 1000 rpm for 5 min, the supernatant was discarded. Cells were washed with PBS, centrifuged at 2000 rpm for 5 min, and the supernatant removed. Ice-cold 70% ethanol was added for fixation (2 h overnight at 4 °C). After PBS washing, 500 μL PI/RNaseA staining solution was added per tube. Samples were protected from light for 30–60 min of room-temperature incubation before cell cycle analysis using a BD FACSCalibur flow cytometer (BD Biosciences, San Jose, CA, USA). All experiments included ≥3 biological replicates.

2.9. Western Blot Experiment

Lyse the cell pellet with NP40 lysis buffer containing 1% PMSF and phosphatase inhibitors on ice for 30 min, vortexing for 10 s every 10 min. After lysis, centrifuge at 12,000 rpm for 20 min at 4 °C. Collect the supernatant. Quantify the protein using the BCA method, then add SDS-PAGE loading buffer to prepare equal amounts of protein samples. Denature the samples at 95 °C for 5–7 min. The protein samples can be directly used for Western blot experiments or stored at −80 °C. Prepare 7.5%, 10%, and 15% SDS-PAGE gels and run the electrophoresis for 50–70 min, monitoring the position of the samples. After electrophoresis, transfer at a constant voltage of 100 V for 70 min (adjustable). After transfer, block the PVDF membrane in 5% non-fat milk for 2 h. Wash with TBST, then incubate with the primary antibody overnight. The next day, wash with TBST again and incubate with HRP-conjugated secondary antibody for 2 h. Finally, use ECL detection reagents for imaging.

2.10. Immunoprecipitation Experiment

A portion from within the protein extract was used as INPUT, added to SDS-PAGE protein upload buffer, heated and stored at −80 °C. After removing the non-specific binding using Protein A + GAgarose (Beyotime, Shanghai, China), centrifuge at 4 °C, 1500 rpm for 5 min, and take the supernatant to a new centrifuge tube. The target antibody and anti-mouse/rabbit IgG (Beyotime) were added separately, and then another 50 μL of Protein A + G Agarose was added to each tube and incubated overnight at 4 °C on a shaker. On the next day, the agarose beads were washed three times with NP40 buffer containing 1% PMSF and phosphatase inhibitor, SDS-PAGE protein uploading buffer was added, and the samples were cooked at 100 °C for 5–10 min, and finally, the immunoblotting experiments were carried out.

2.11. Immunofluorescence

Cells were digested with 0.25% trypsin and spread on cell crawlers for overnight incubation. On the next day, the medium was removed and washed with PBS, then 500 uL of 4% paraformaldehyde was added to each well and fixed for 15 min. After fixation, the wells were washed with PBS, punched with 0.1% Triton for 10–15 min, washed with PBS for three times, and closed in PBS with 3% BSA for 2 h. The cells were incubated with a 1:50 dilution of DMRTA2 Rabbit Antibody overnight at 4 °C. The next day, the cells were washed three times with PBS, diluted at 1:200 in Goat Anti-Rabbit Antibody. On the next day, PBS was washed three times, and a 1:200 dilution of Goat Anti-Rabbit IgG (H + L) was incubated away from light for 1.5–2 h. After PBS washing, the nuclei were stained with DAPI for 10 min, and after washing with PBS three times, the slices were sealed with anti-fluorescence quenching sealer and visualized for imaging in a confocal microscope.

2.12. qRT-PCR

The collected cell precipitates were lysed and total RNA was extracted, and the quality and concentration of RNA were detected by a microspectrophotometer. Reverse transcription was performed and qPCR experiments were carried out.

2.13. Statistical Analysis

All experimental data were statistically analyzed using GraphPad Prism 10.2.1 and SPSS24.0 software, and the results are expressed as mean ± standard deviation (x ± s), and each test was repeated at least three times. Statistical analyses were performed using Student’s test or ANOVA, and the χ2 test was used to assess the correlation between clinicopathological factors and DMRTA2 expression. Differences were considered statistically significant when p < 0.05.

3. Results

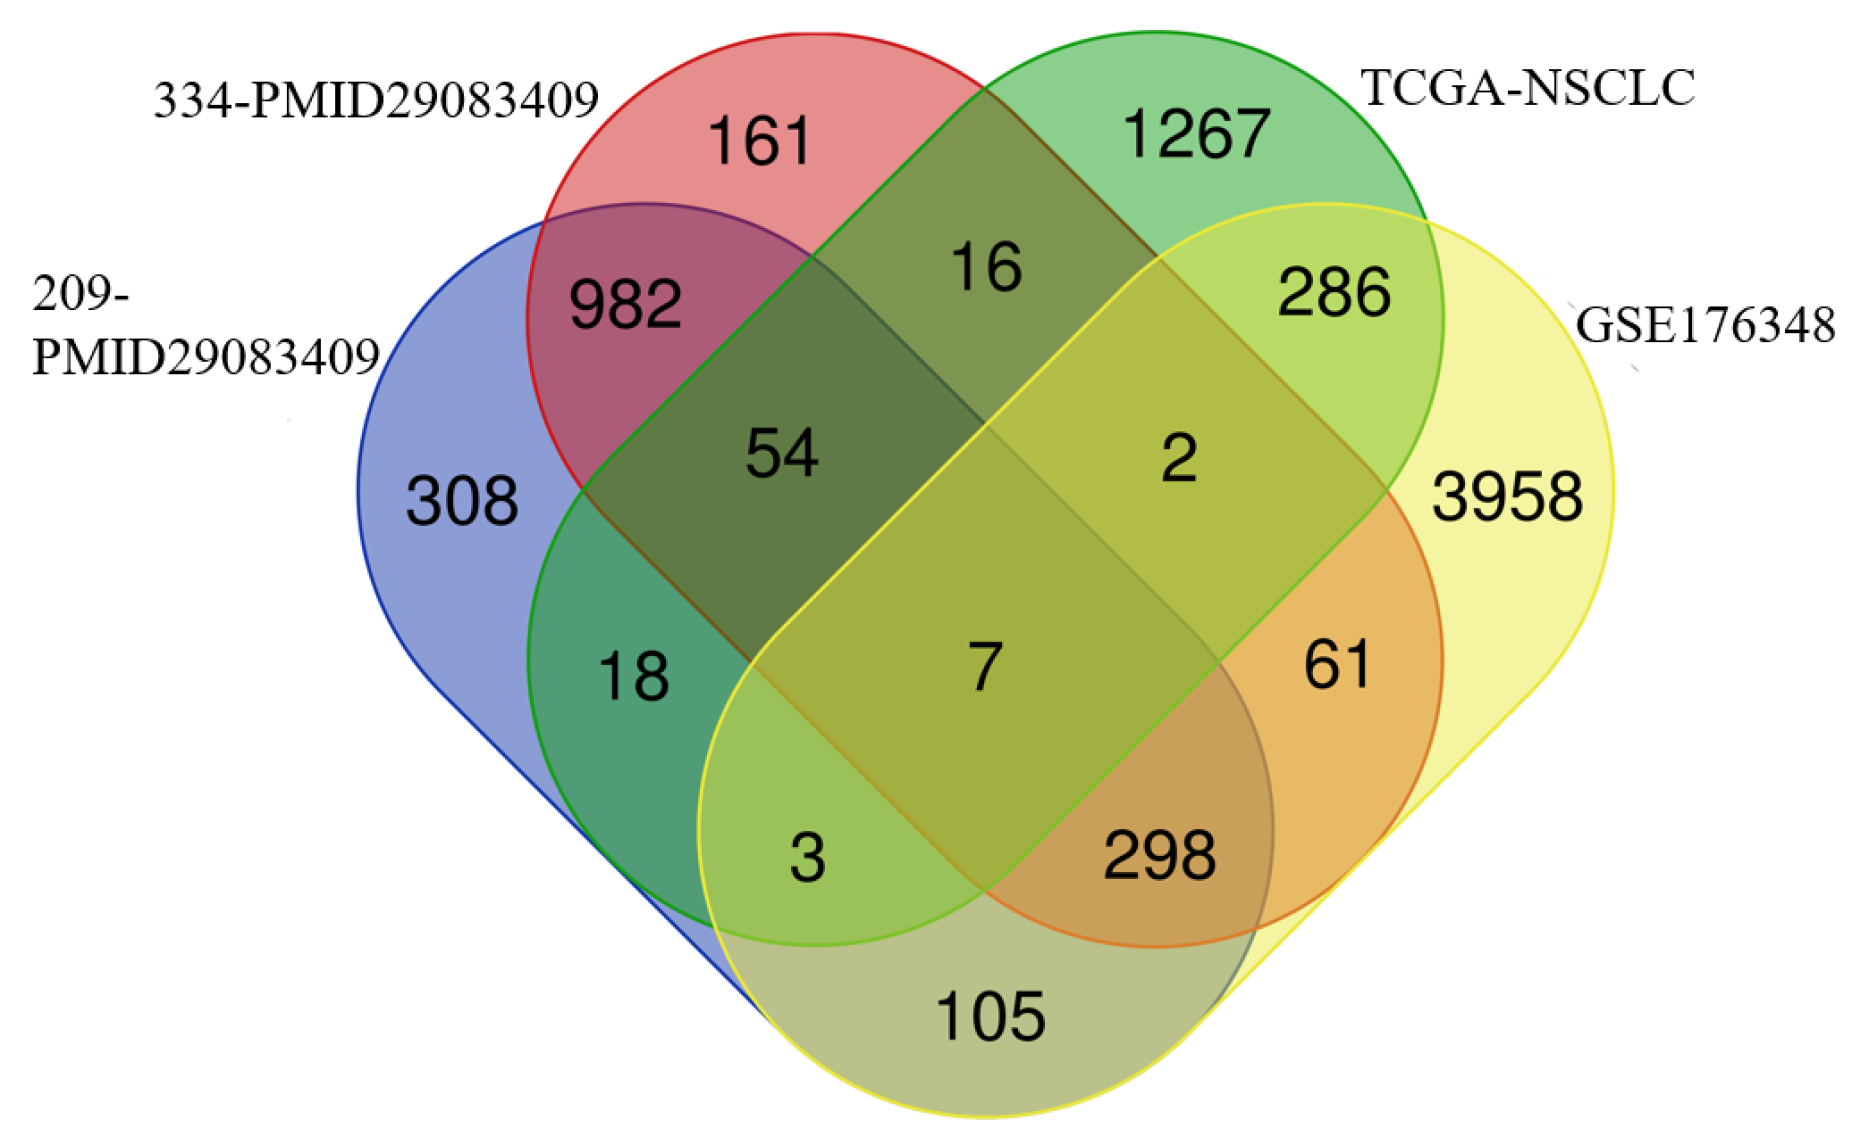
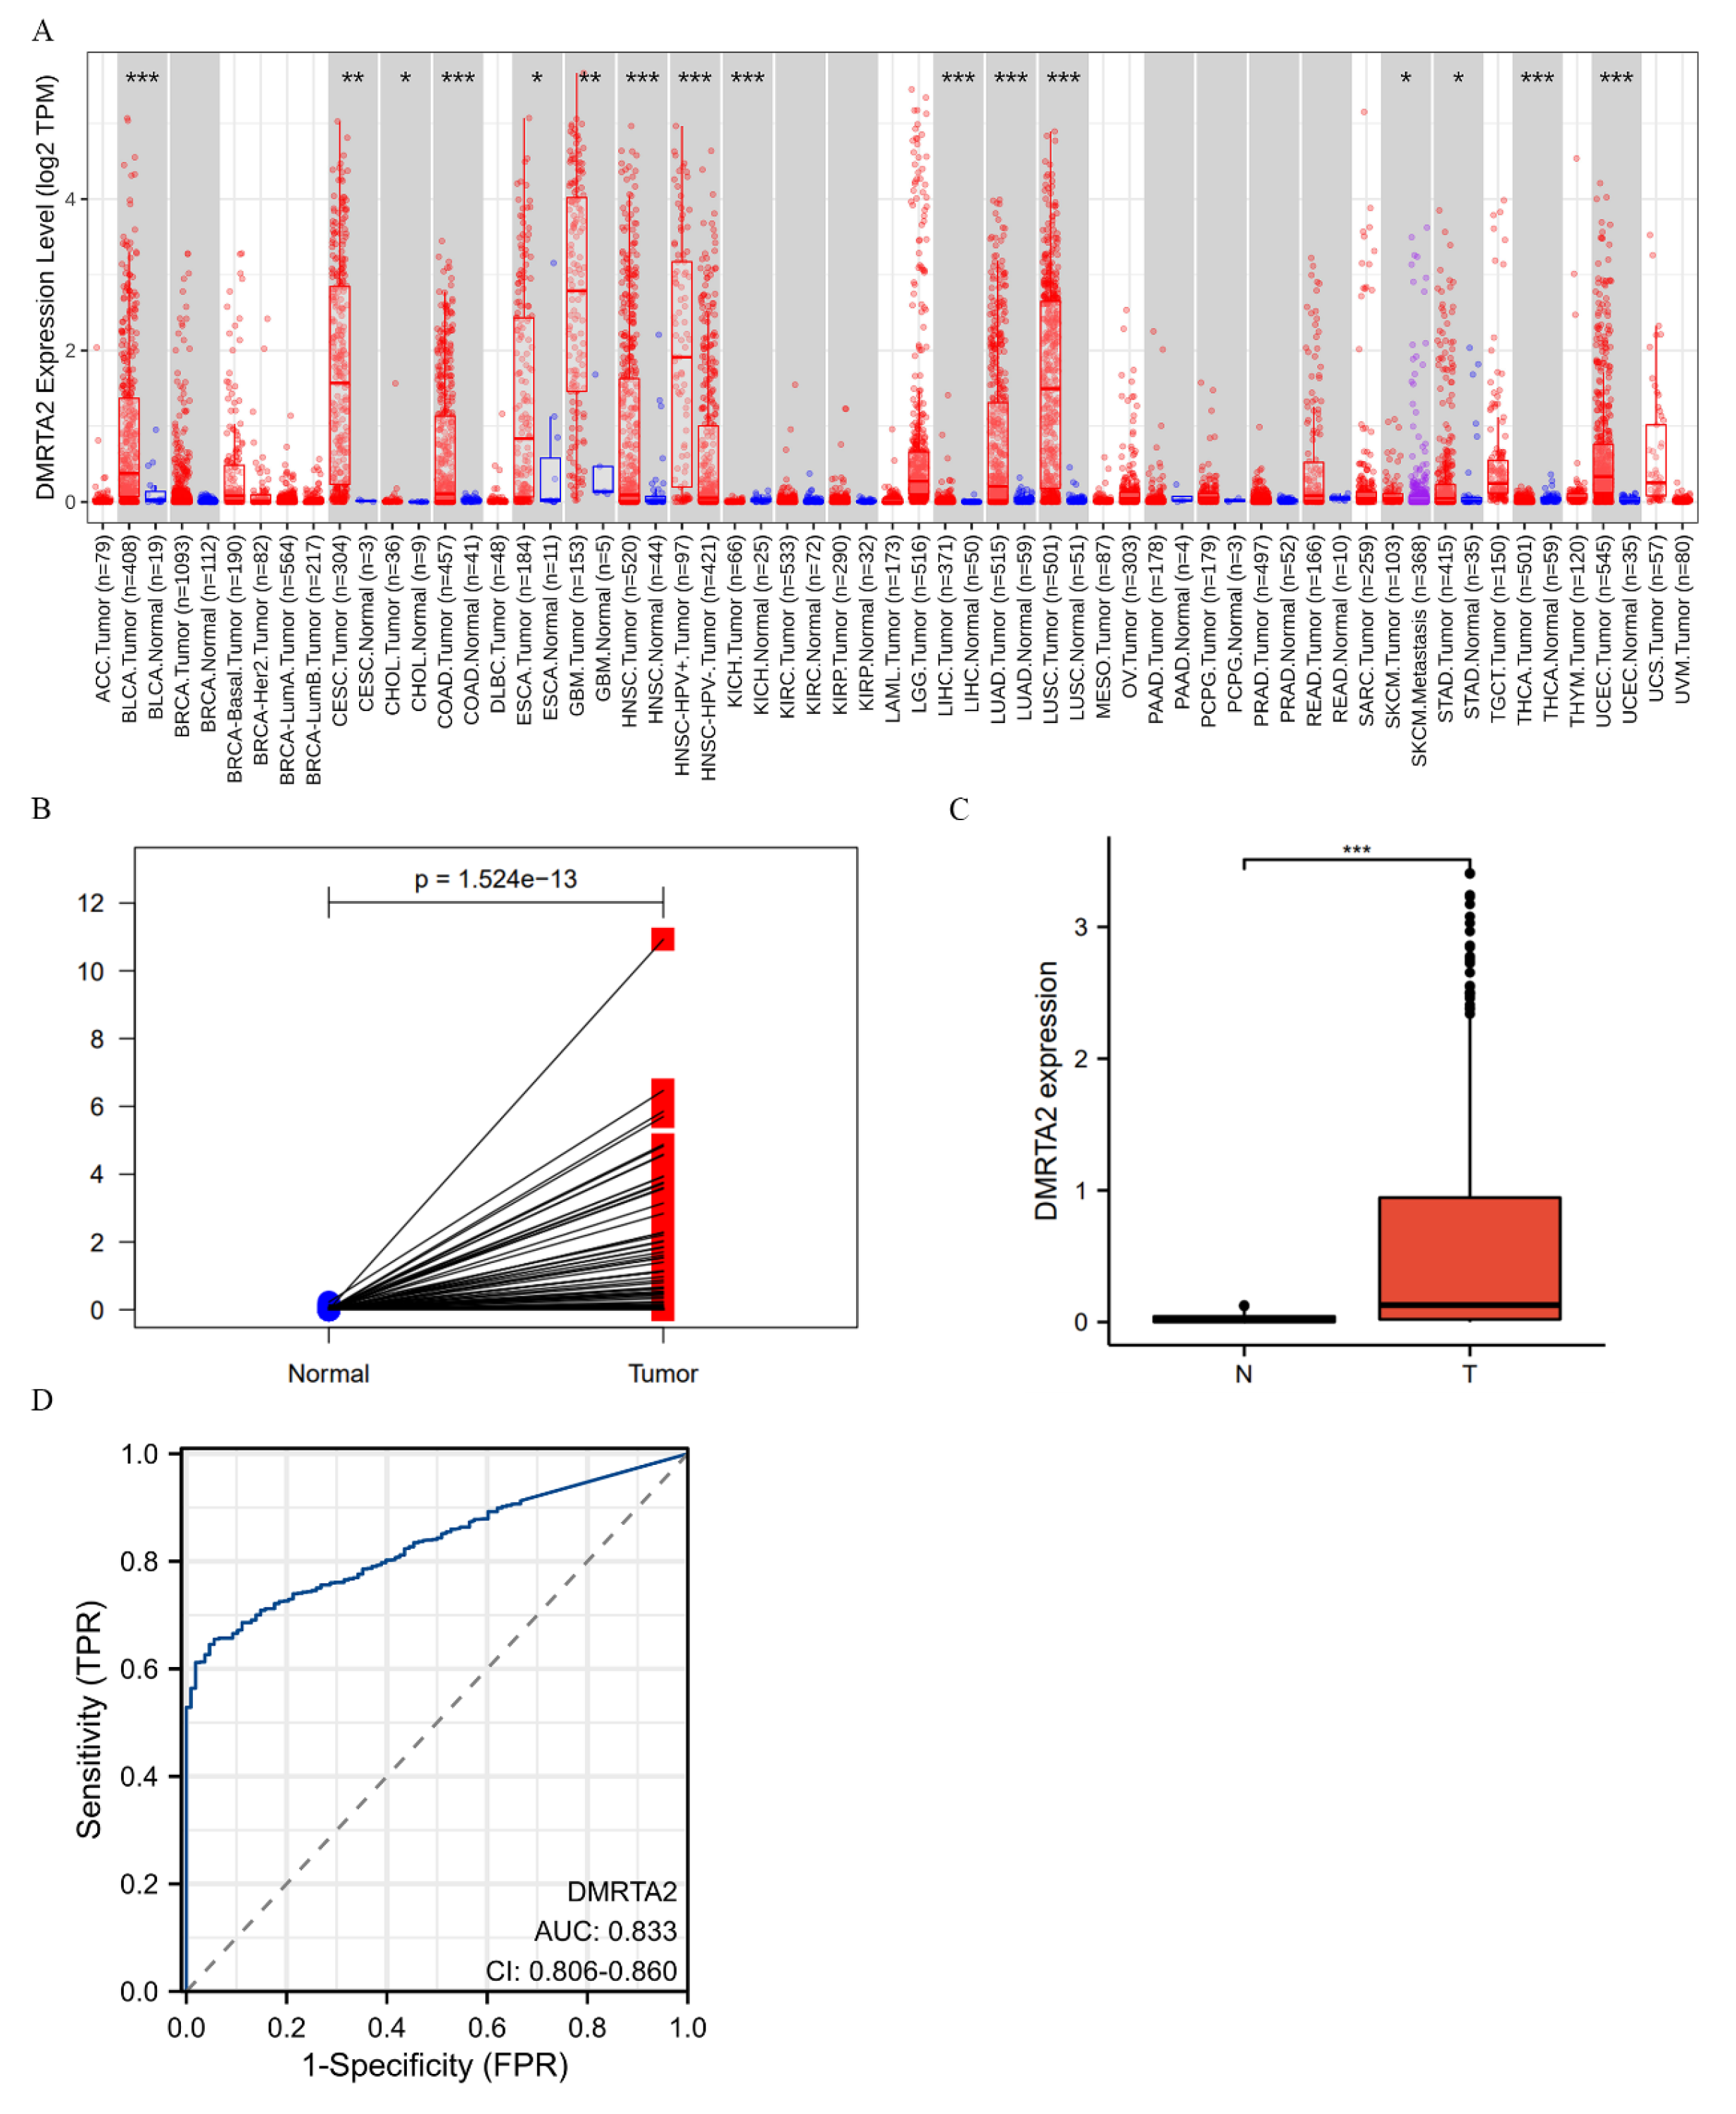
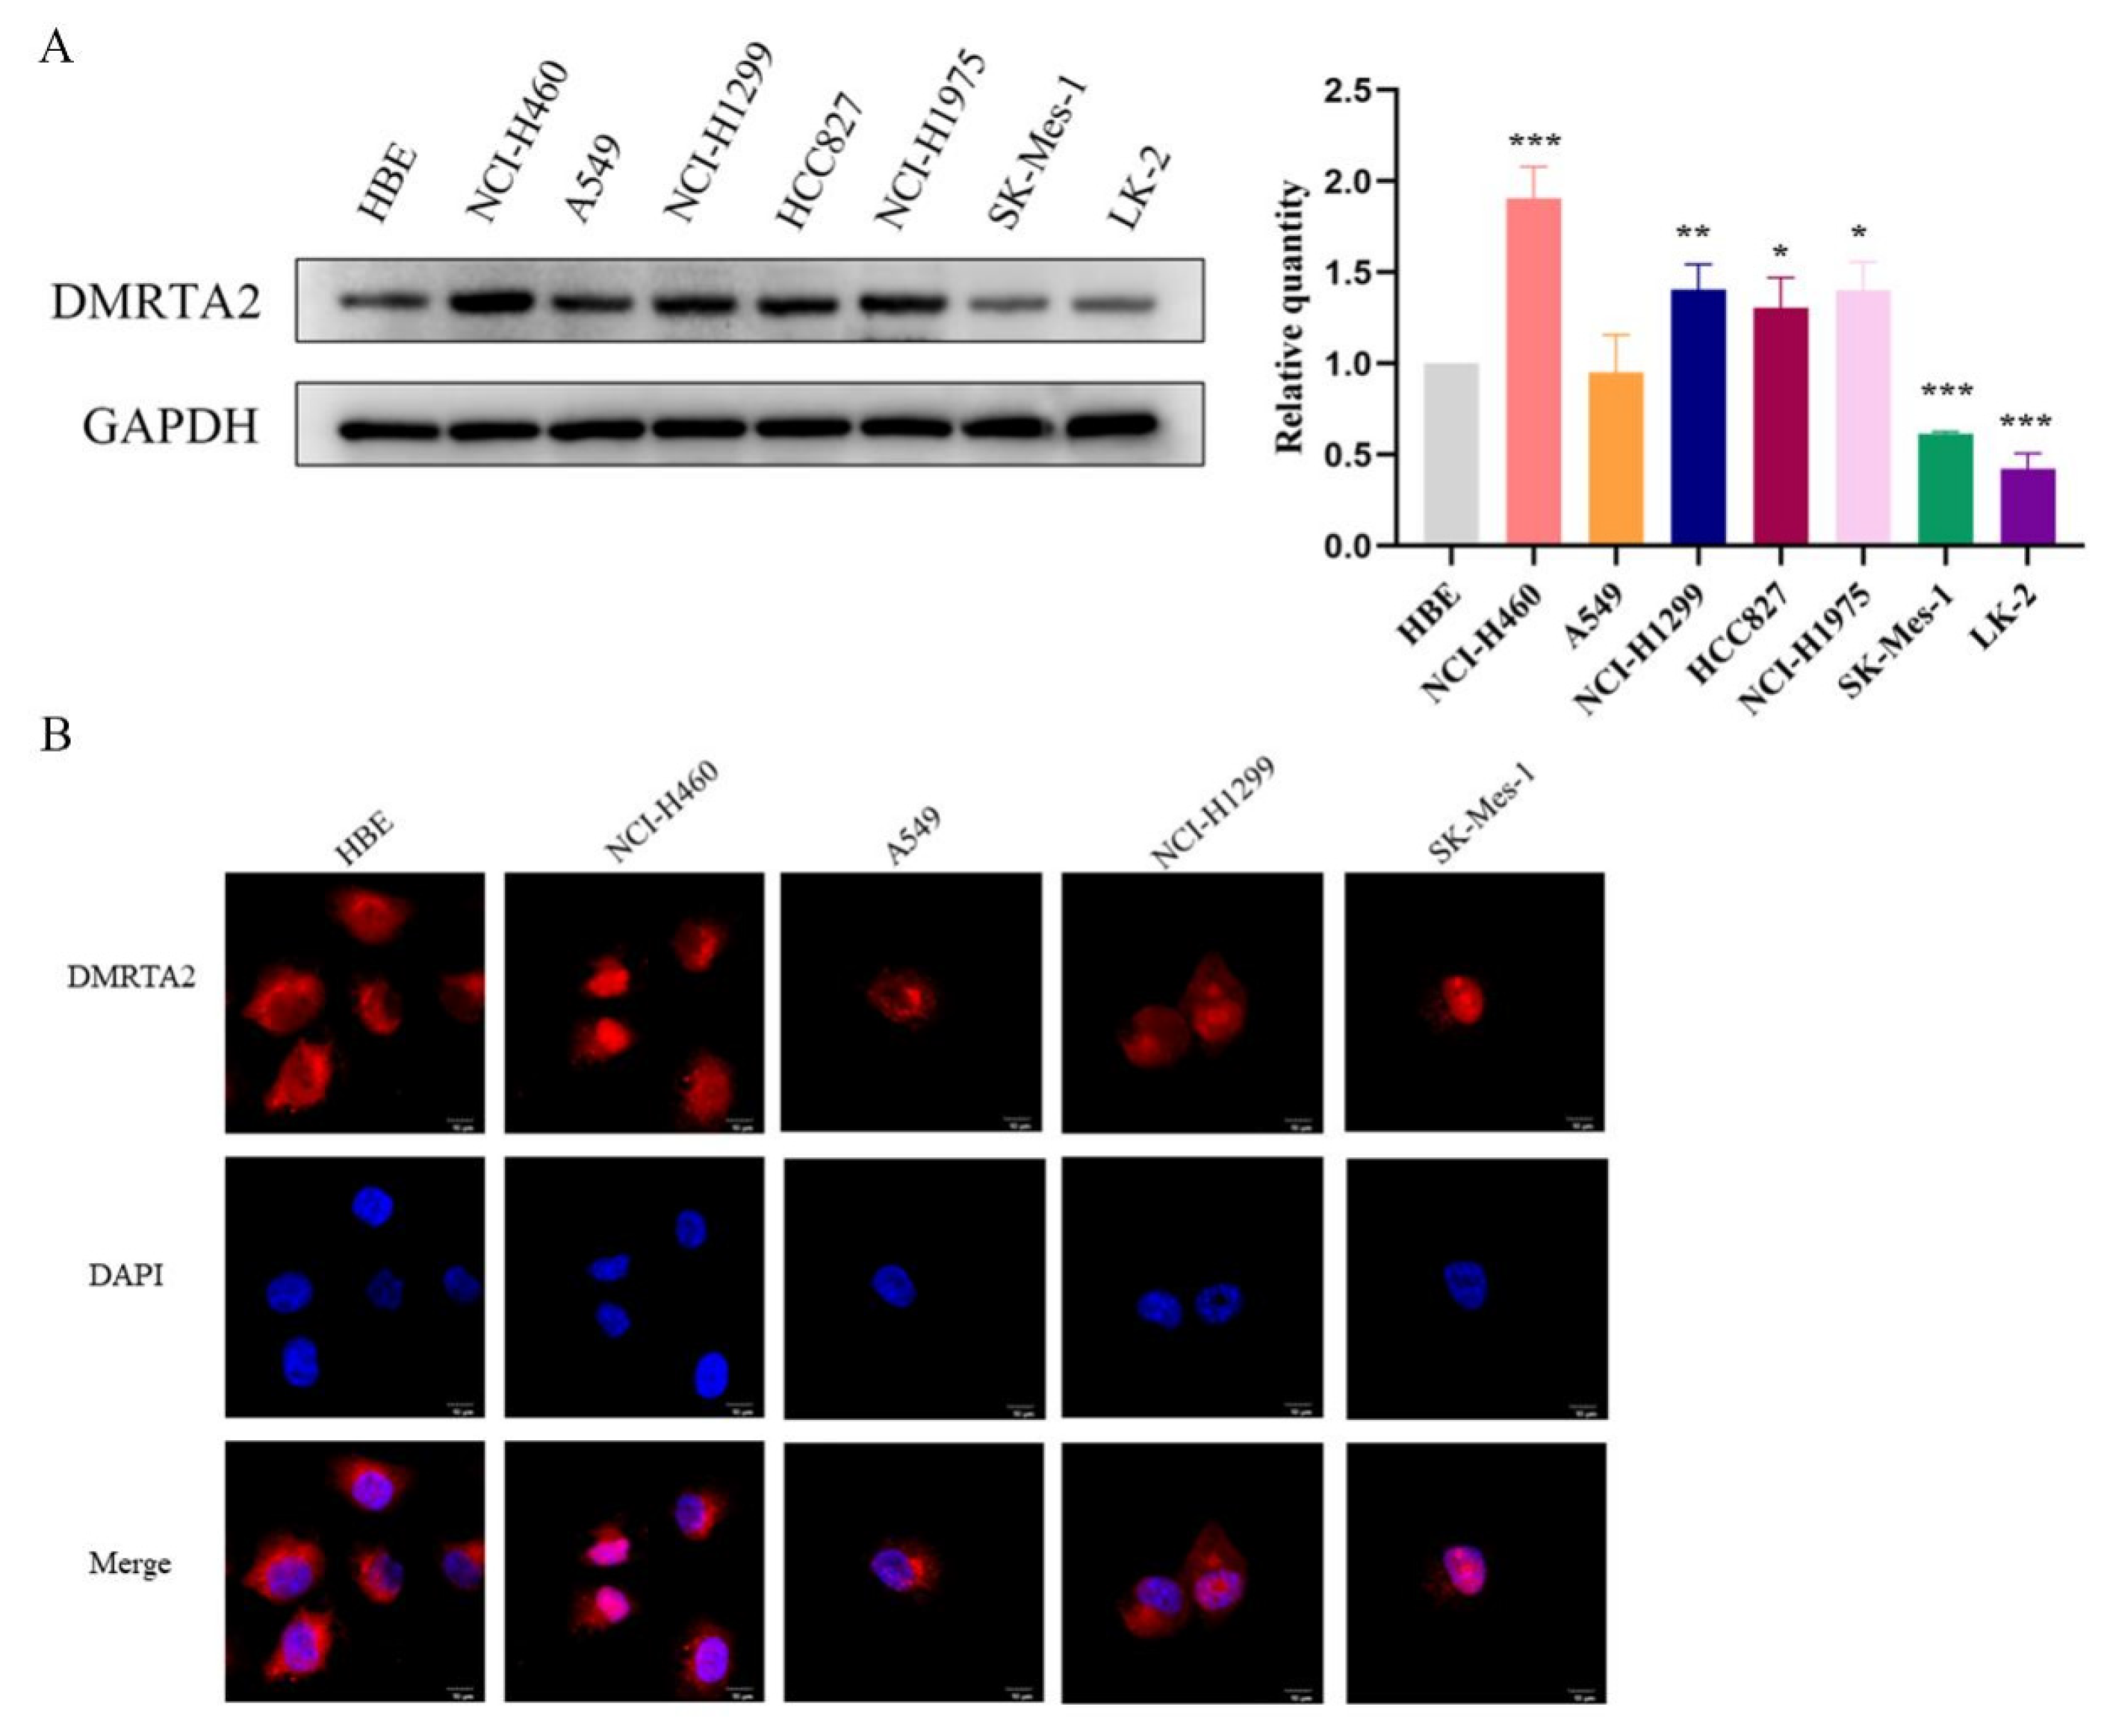
3.1. DMRTA2 Is Highly Expressed in NSCLC and Negatively Associated with Poor Prognosis

To identify genes associated with NSCLC proliferation, we intersected differentially expressed genes from the TCGA database for lung adenocarcinoma and squamous cell carcinoma, as well as those from the GSE176348 dataset and the CRISPR screens dataset (209-PMID29083409 and 334-PMID29083409), resulting in seven core genes. Among these, DMRTA2, which has not been studied in lung cancer, captured our attention (Figure 1).
We assessed the expression and characteristics of DMRTA2 across various databases. TIMER2.0 results indicate that DMRTA2 is highly expressed in lung adenocarcinoma, lung squamous carcinoma, liver cancer, and colon cancer (Figure 2A). TCGA data reveal that its mRNA levels are elevated in paired and non-paired lung cancer tissues compared to adjacent normal tissues (Figure 2B,C). ROC curve analysis demonstrated the potential of DMRTA2 to discriminate lung cancer, with an AUC of 0.833 (Figure 2D). Kaplan–Meier analysis showed that high DMRTA2 expression is associated with better survival rates (Figure 3A–C). Additionally, DMRTA2 expression correlated with T stage, smoking history, and TP53 expression. Western blot analysis indicated that DMRTA2 levels are higher in H1299, HCC827, H1975, and H460 cells compared to normal lung cells (HBEs), while lower in SK-MES-1 and LK2 cells (Figure 4A). Immunofluorescence experiments demonstrated its localization in the nucleus and cytoplasm, with some cells showing nucleolar localization (Figure 4B).

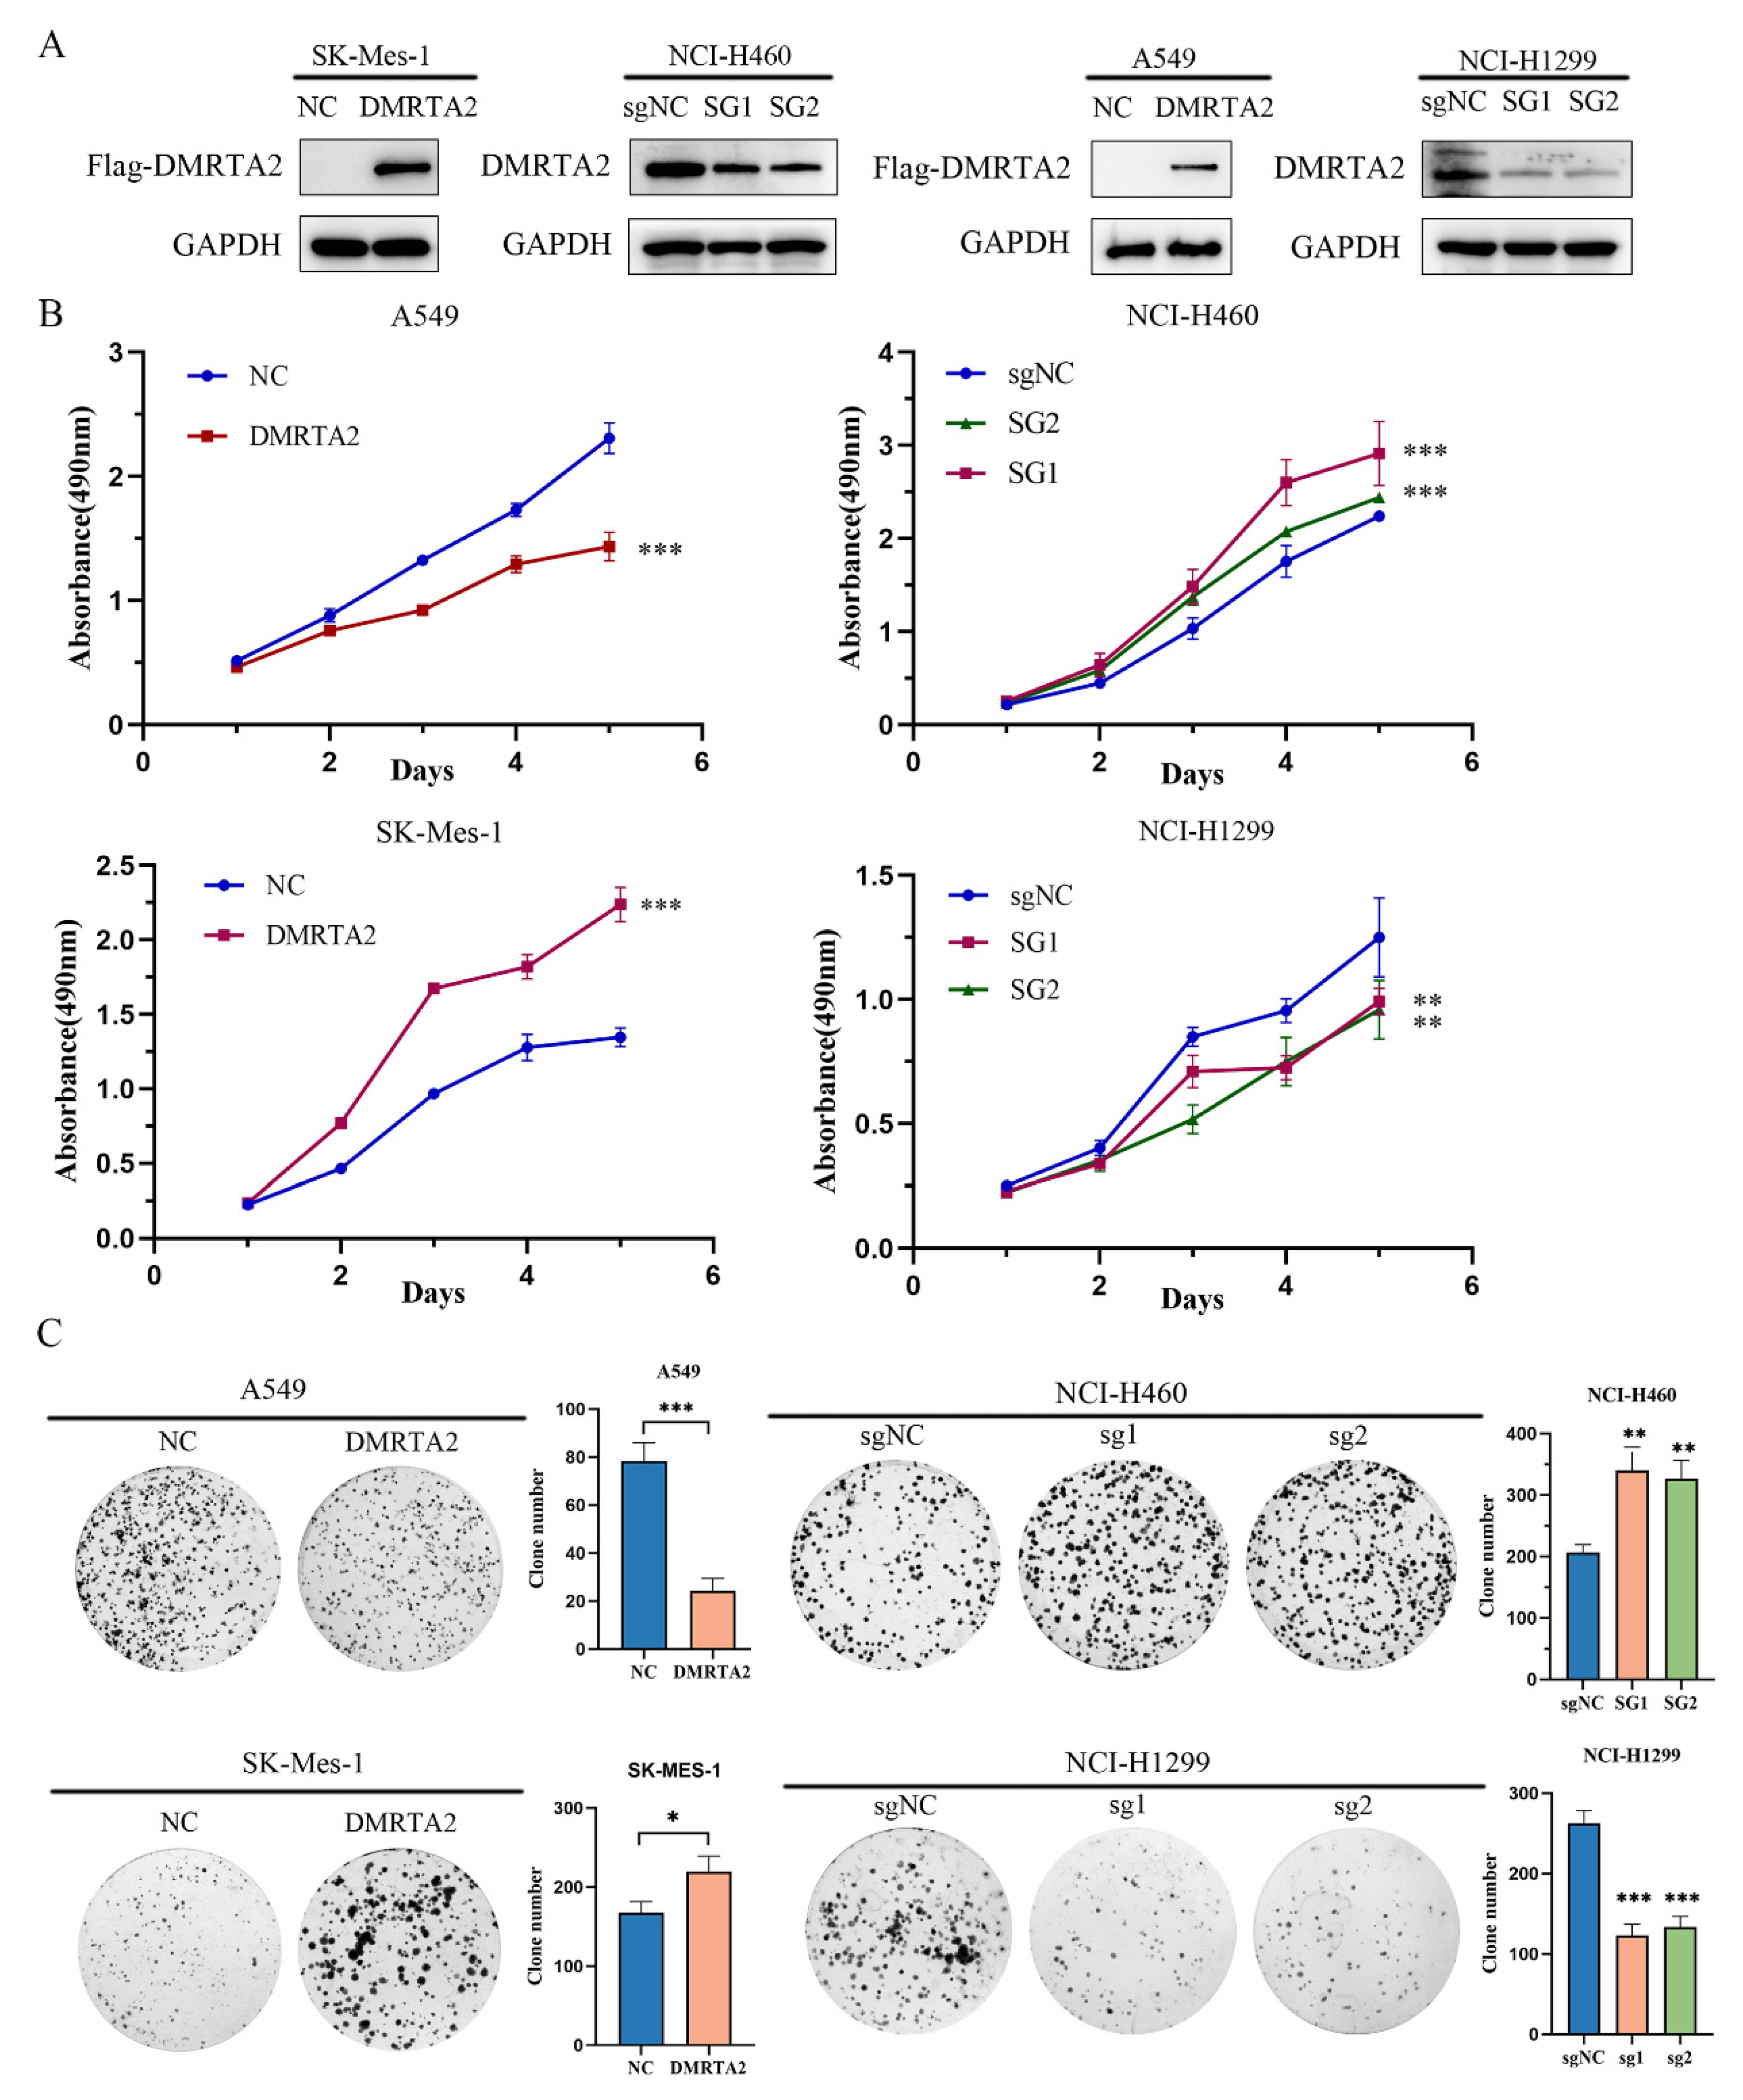
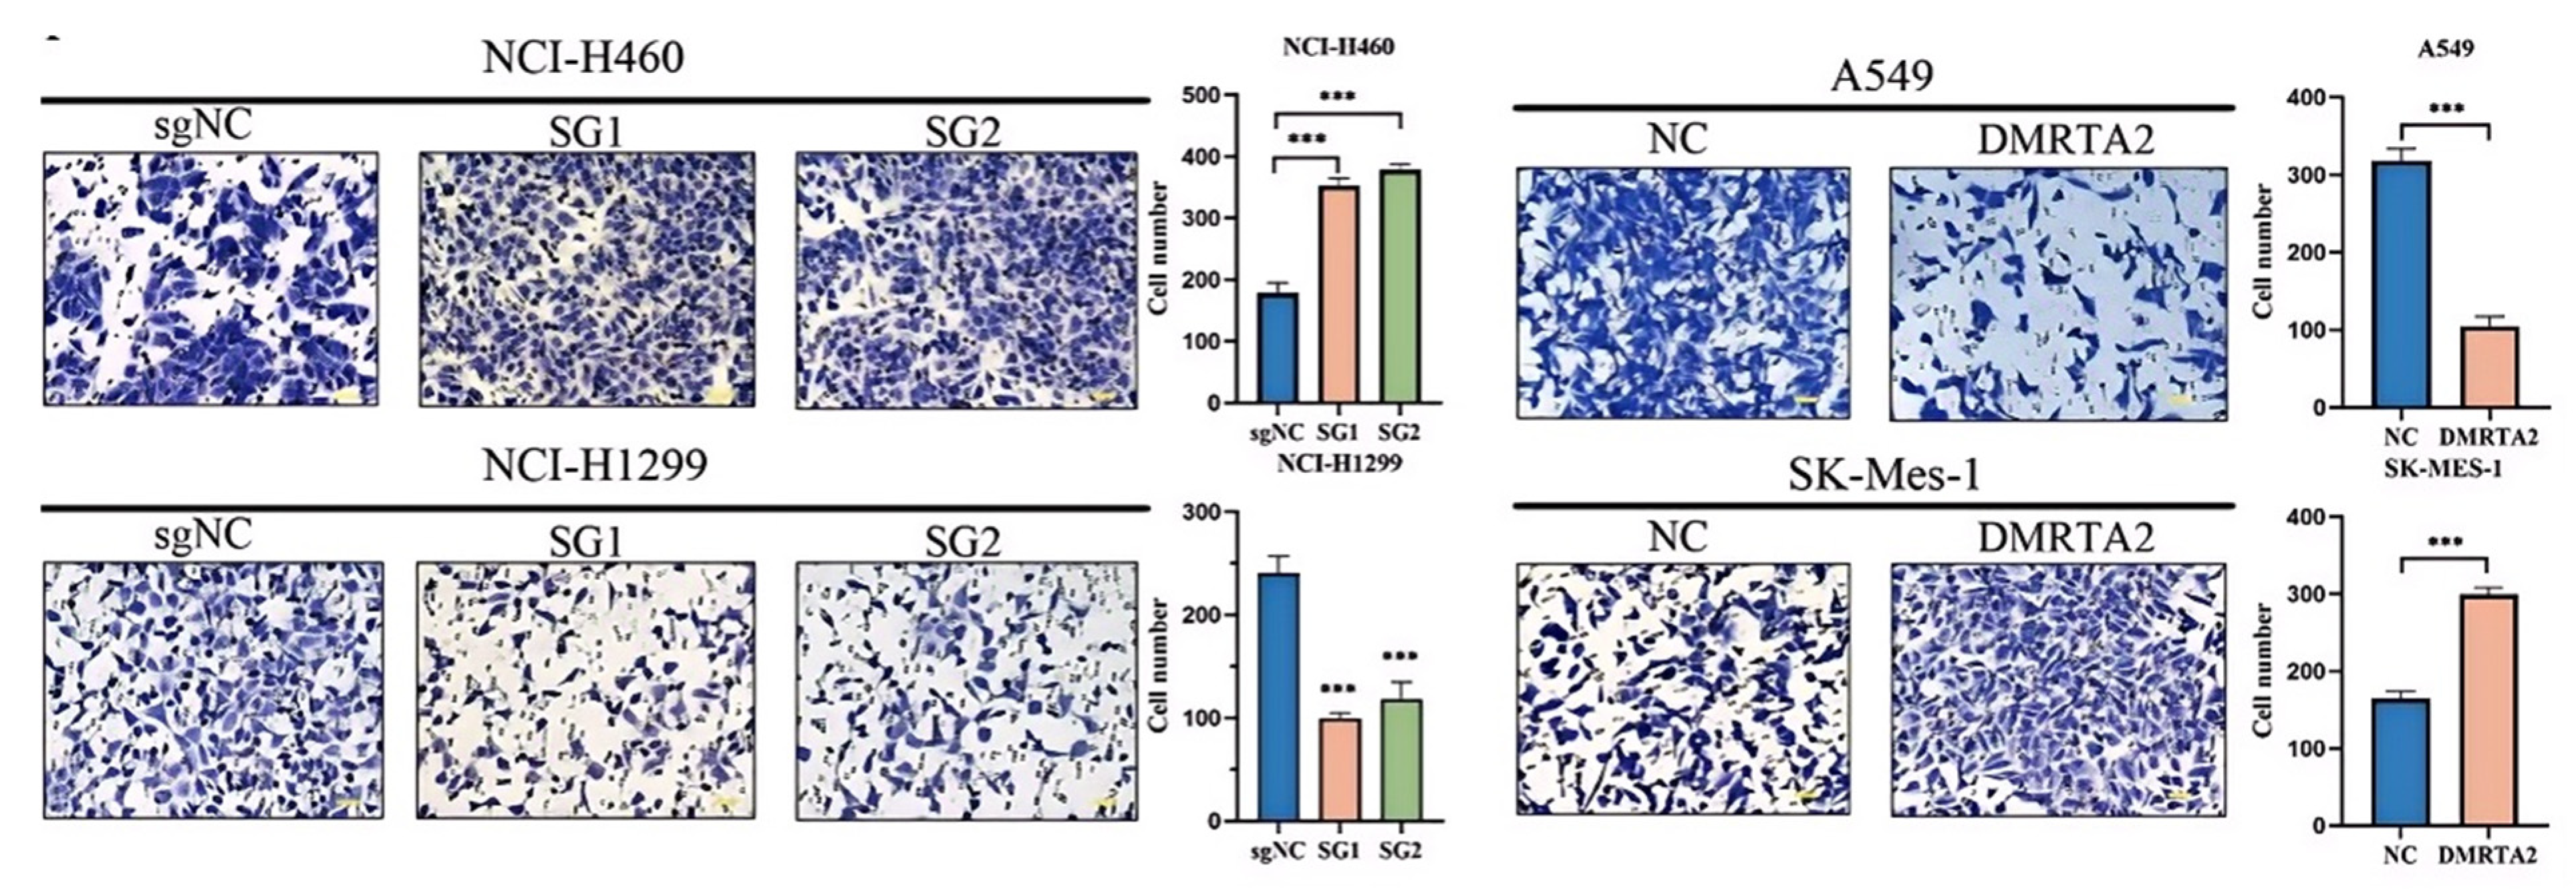
3.2. DMRTA2 Affects the Malignant Phenotype of Lung Cancer Cells

To investigate the function of DMRTA2 in lung cancer, we overexpressed DMRTA2 in SK-MES-1 and A549 cells, while knocking it out in H460 and H1299 cells (Figure 5A). We evaluated its effects on proliferation and invasion using MTS assays (Figure 5B), colony formation assays (Figure 5C), and Transwell experiments (Figure 6). The results indicate that DMRTA2 inhibits cell proliferation and invasion in A549 and H460 cells, whereas it promotes these functions in SK-MES-1 and H1299 cells. GSEA analysis suggested that DMRTA2 is associated with cell cycle pathways, and flow cytometry and Western blot results confirm that DMRTA2 has distinct regulatory effects on the cell cycle across different cell lines. These findings suggest that DMRTA2 plays a significant role in lung cancer progression.

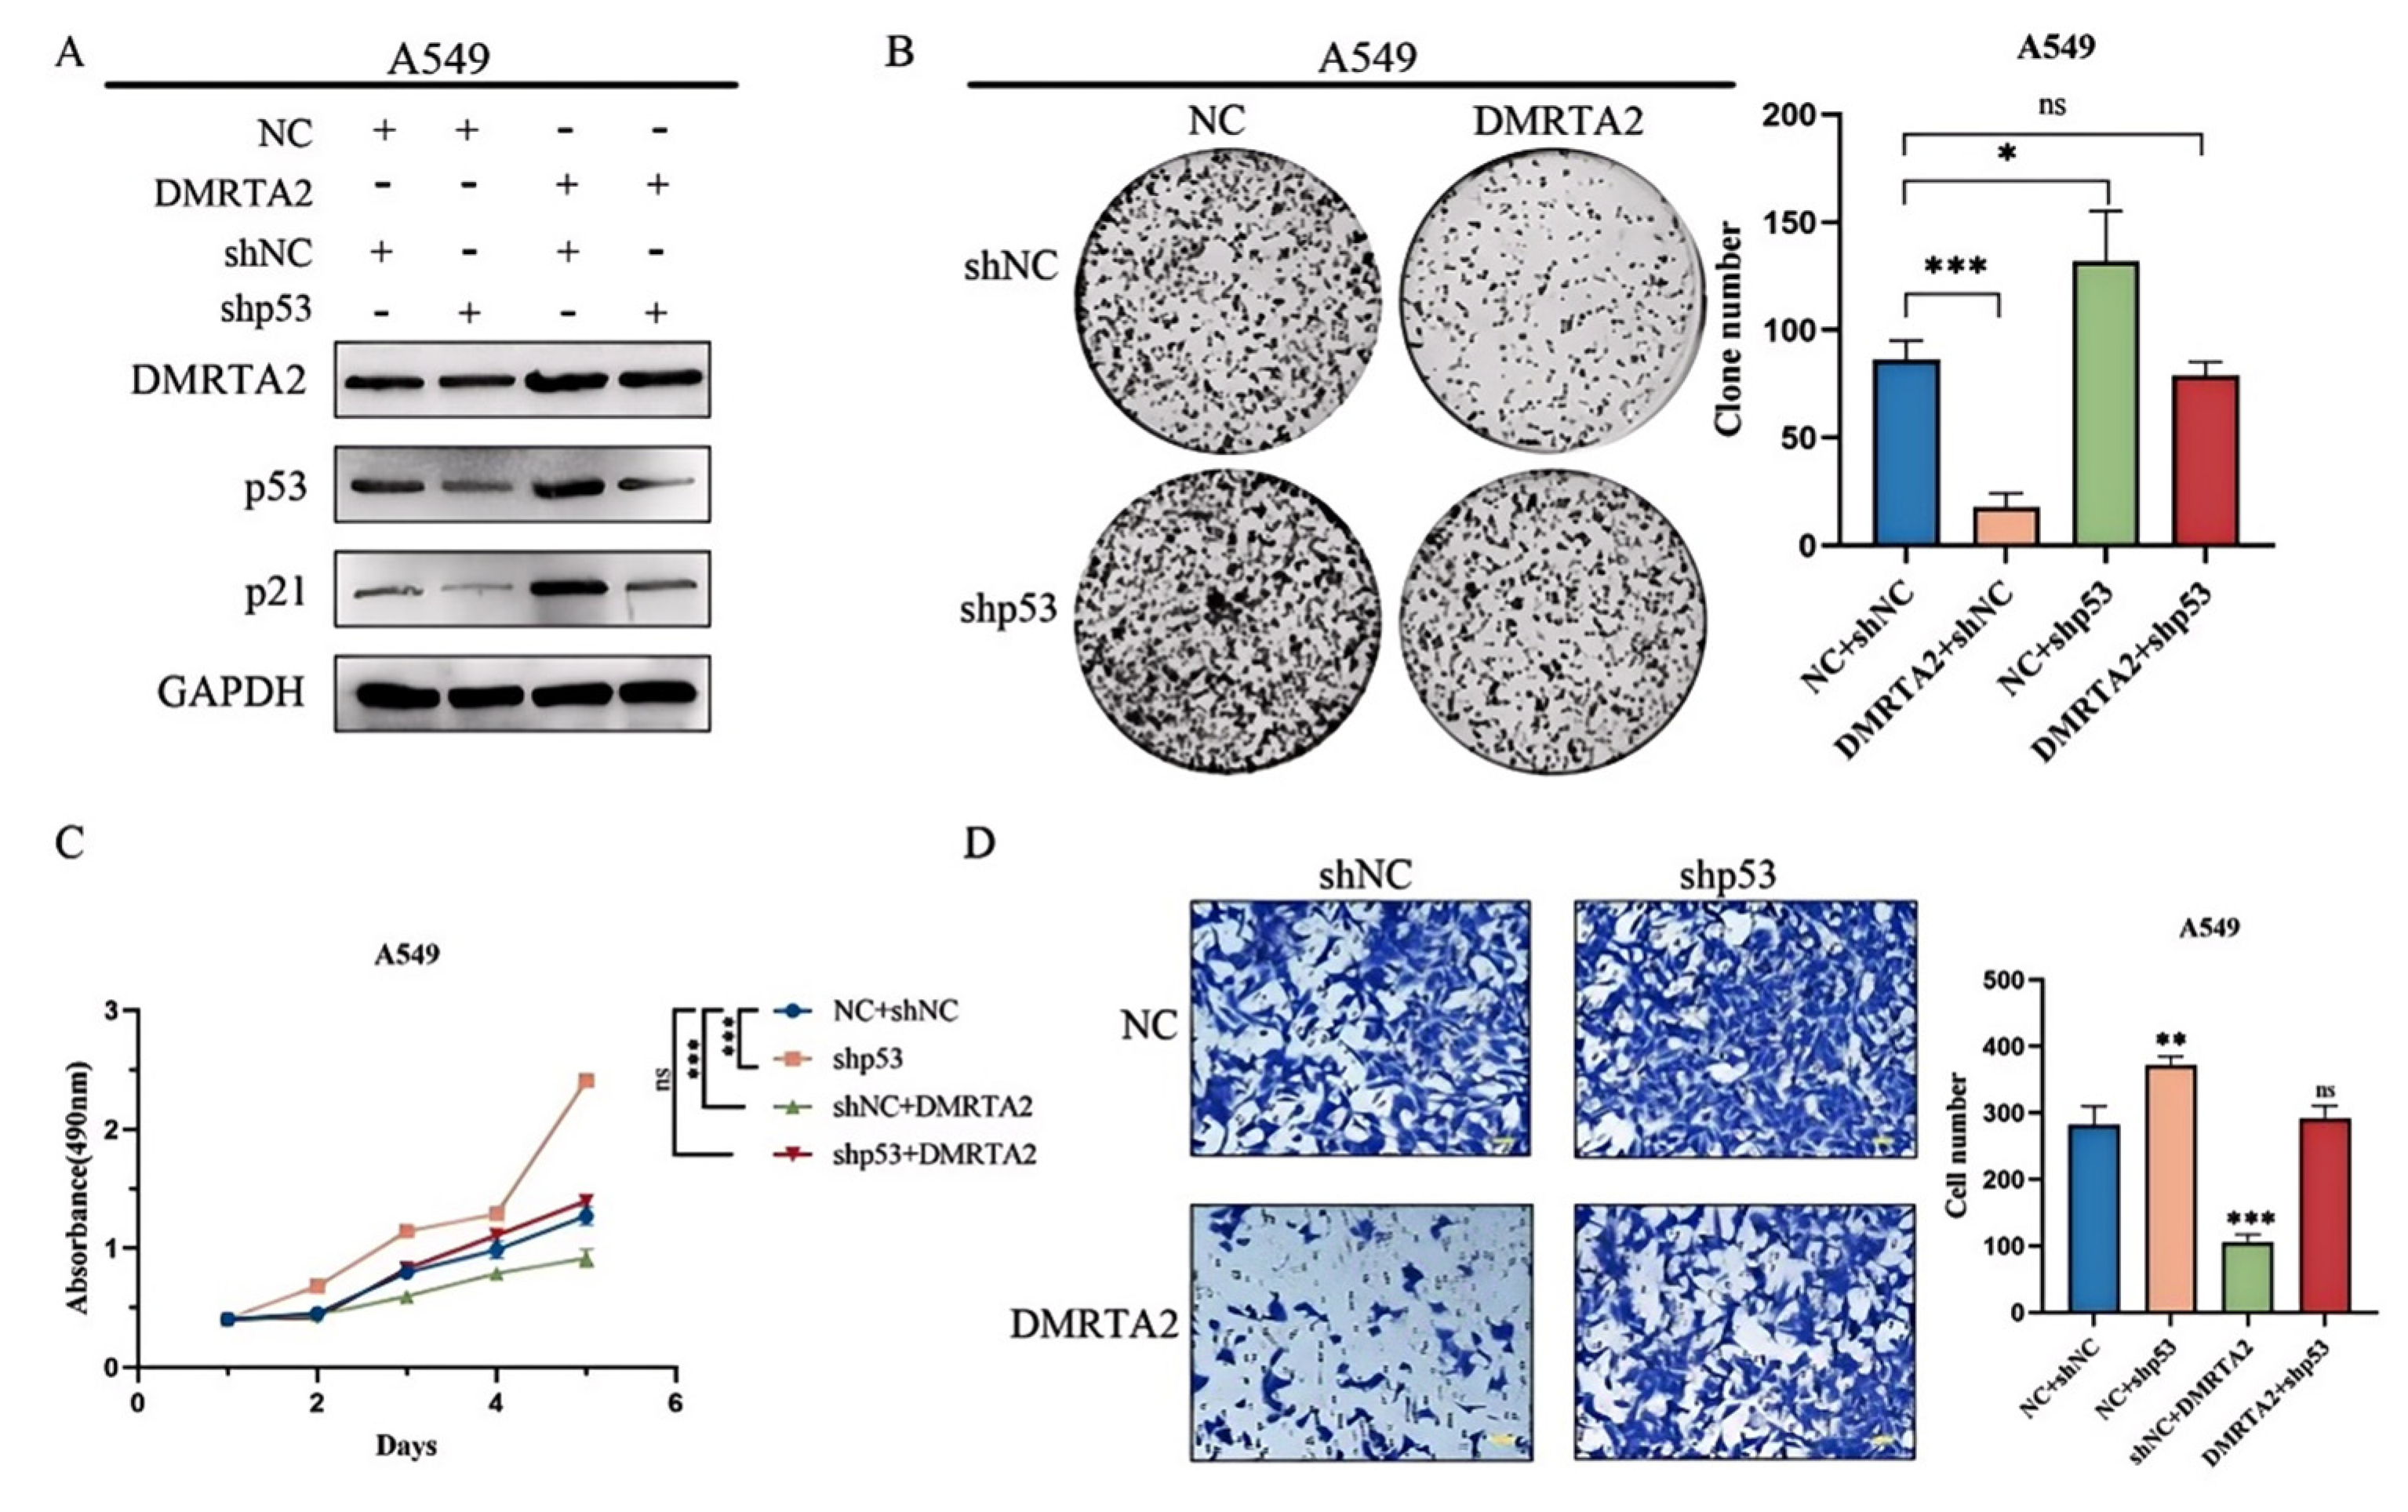
3.3. DMRTA2 Inhibits Lung Cancer Cell Proliferation and Invasion by Regulating the p53 Signaling Pathway

To investigate the reasons for the differential expression of DMRTA2 in various cell lines, we first considered the genotypic differences among the cell lines. According to the Cellosaurus database, both A549 and H460 cells are p53 wild-type cells with KRAS and STK11 mutations, while SK-MES-1 has a p53 mutation, and H1299 is p53-null with an NRAS mutation. GSEA analysis indicated that DMRTA2 is associated with the p53 pathway (Figure 7A). Western blot analysis revealed that in A549 cells, the overexpression of DMRTA2 upregulated p53 and its downstream proteins (such as p21, BAX, Cleaved Caspase 3, etc.) while inhibiting Bcl-2. In contrast, in H460 cells, the knockout of DMRTA2 yielded opposite results (Figure 7B). Further functional experiments demonstrated that the knockdown of p53 could reverse the inhibitory effect of DMRTA2 on the proliferation and invasion of A549 cells, suggesting that DMRTA2 suppresses tumor malignant phenotypes through the p53 pathway in p53 wild-type cells (Figure 8A–D). However, in p53 mutant or null SK-MES-1 and H1299 cells, the trends of downstream protein changes in the p53 pathway were inconsistent (Figure 9), indicating the possibility of other mechanisms regulating the function of DMRTA2.

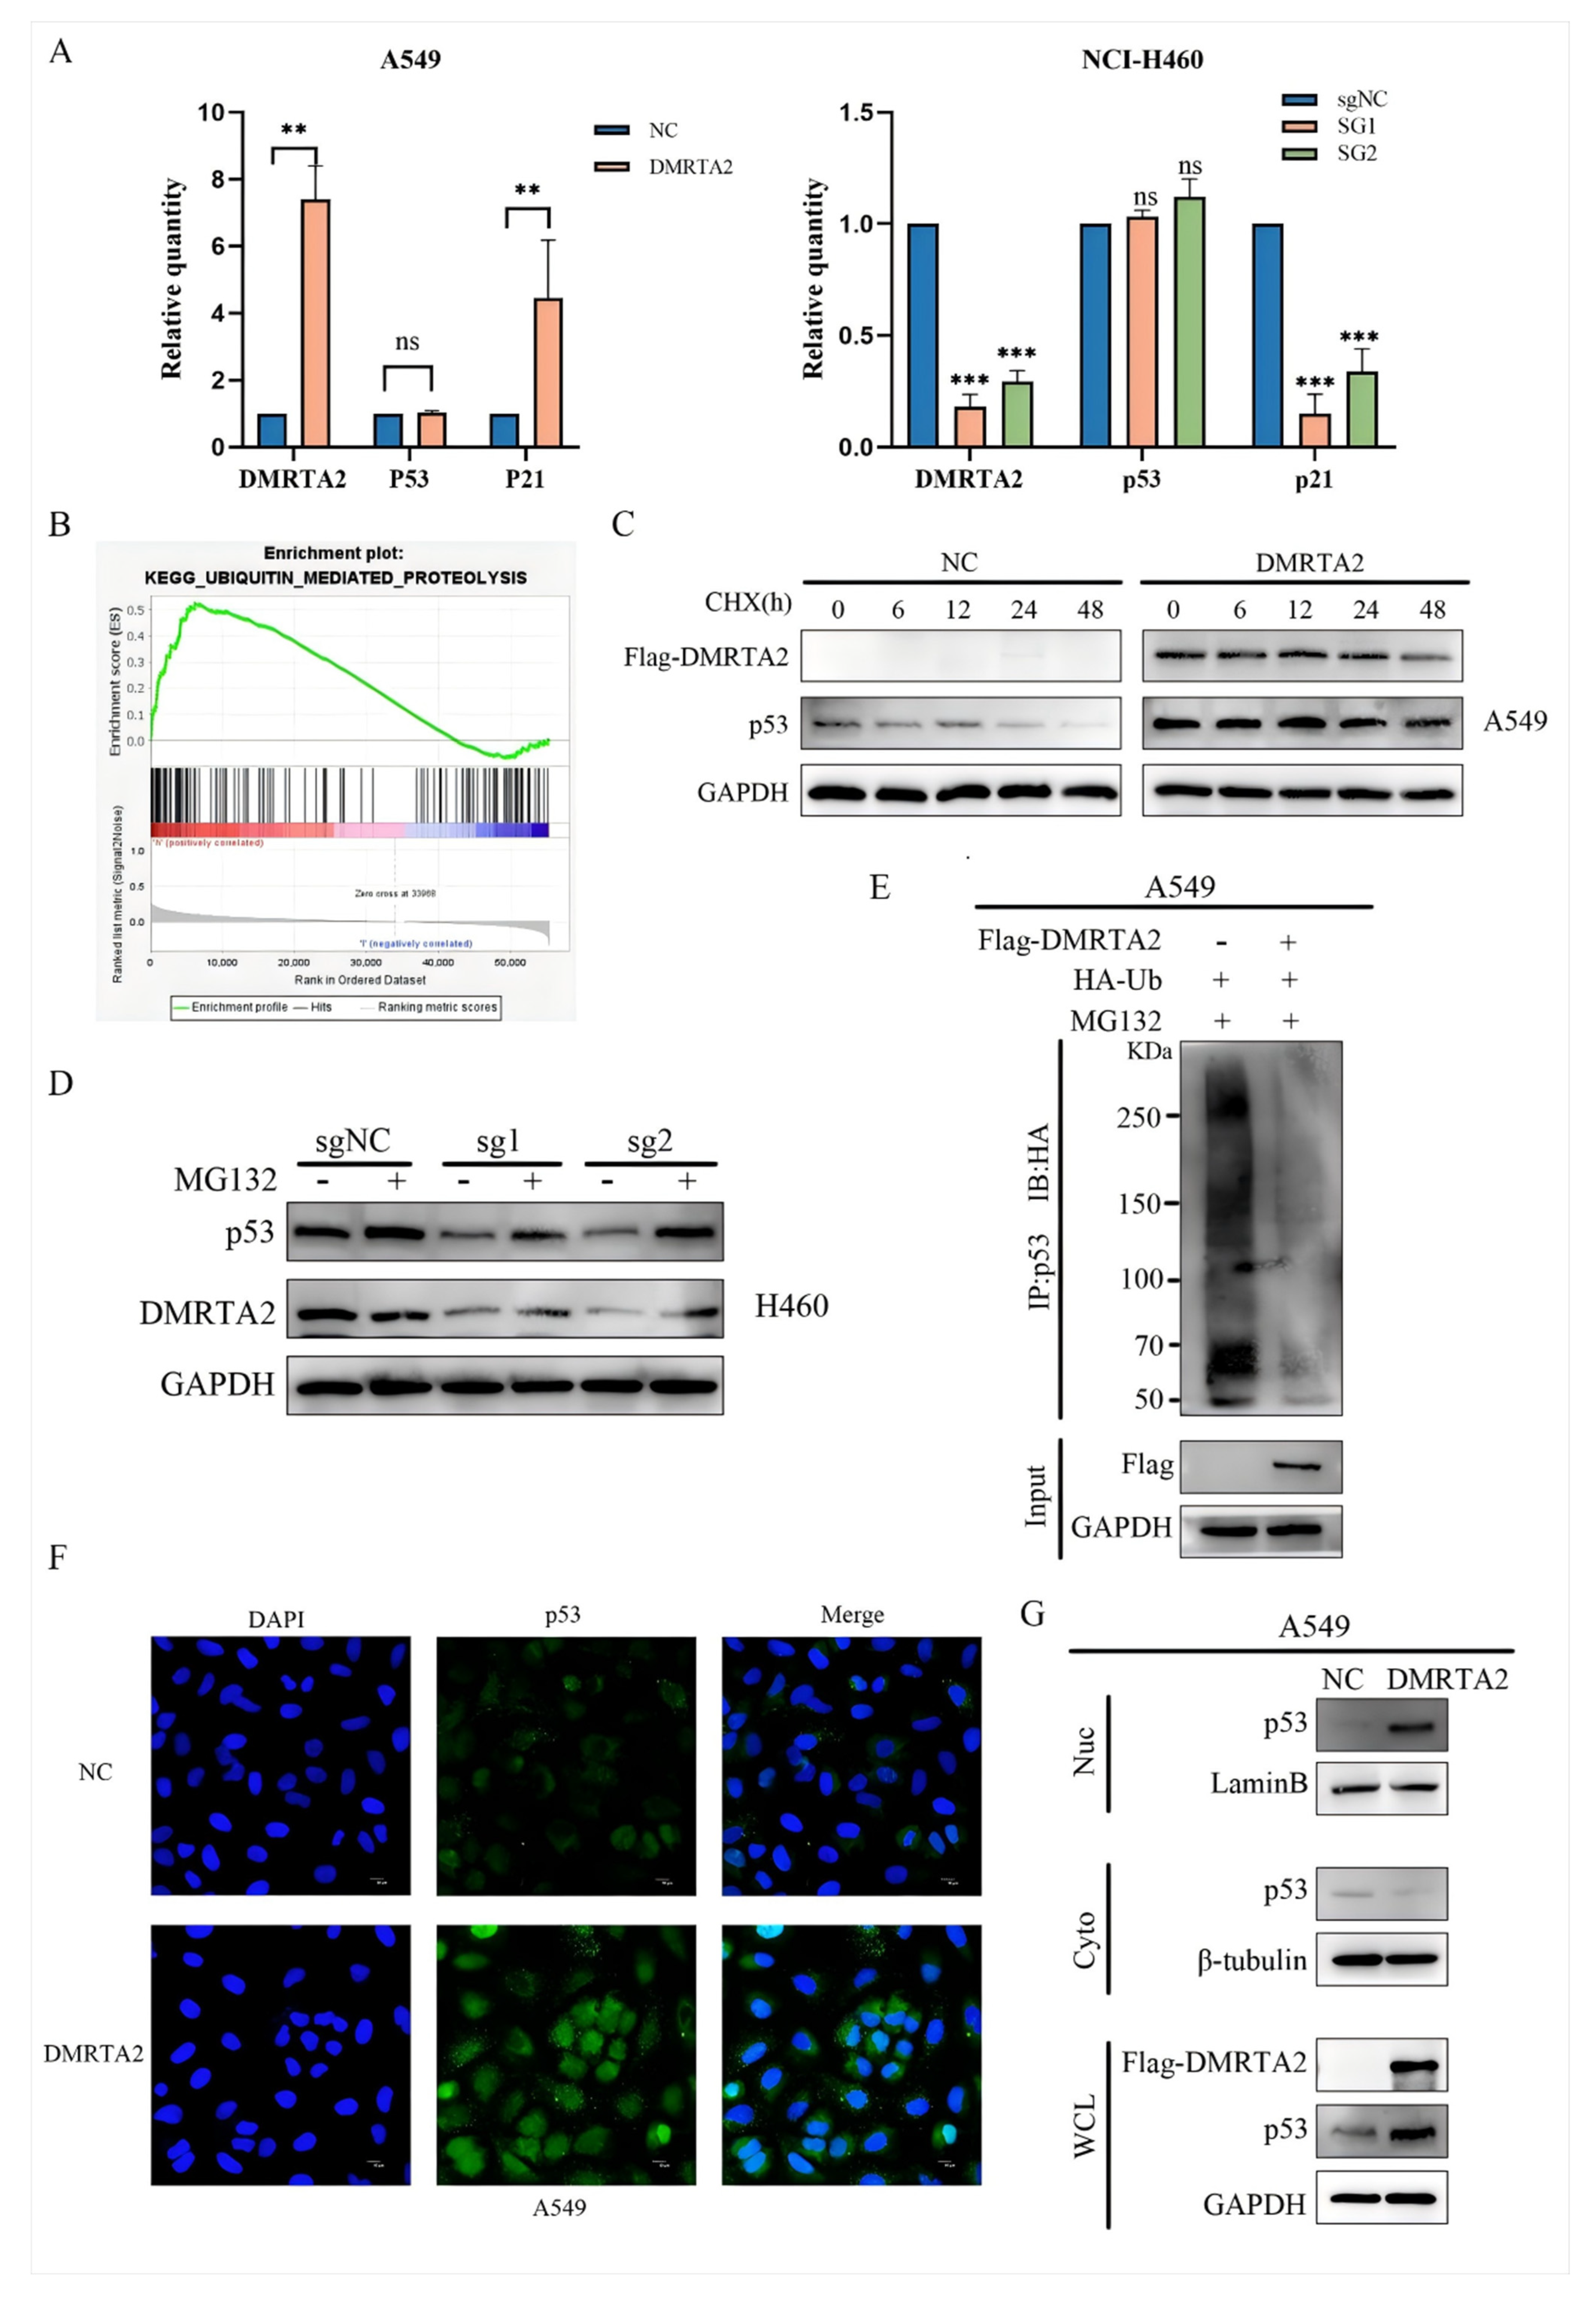
3.4. DMRTA2 Inhibits p53 Ubiquitination and Affects p53 Entry and Exit from the Nucleus

The results indicate that DMRTA2 can regulate wild-type p53 protein levels, but it remains unclear whether this occurs at the mRNA level. Since DMRTA2 is a transcription factor, qPCR analysis revealed that DMRTA2 does not affect p53 transcription but significantly regulates the mRNA expression of its target gene, p21 (Figure 10A). GSEA analysis suggested a link between DMRTA2 and ubiquitin-mediated protein degradation (Figure 10B), prompting us to investigate p53 protein stability. CHX experiments demonstrated that p53 degradation was slowed in A549 cells overexpressing DMRTA2 (Figure 10C). Additionally, treatment with MG132 in H460 cells reversed the downregulation of p53 caused by DMRTA2 knockout (Figure 10D). Further experiments indicated that DMRTA2 inhibits p53 ubiquitination (Figure 10E), and immunofluorescence and nuclear–cytoplasmic separation assays showed an increase in nuclear p53 levels following DMRTA2 overexpression (Figure 10F,G), suggesting that DMRTA2 influences p53 stability and subcellular localization.

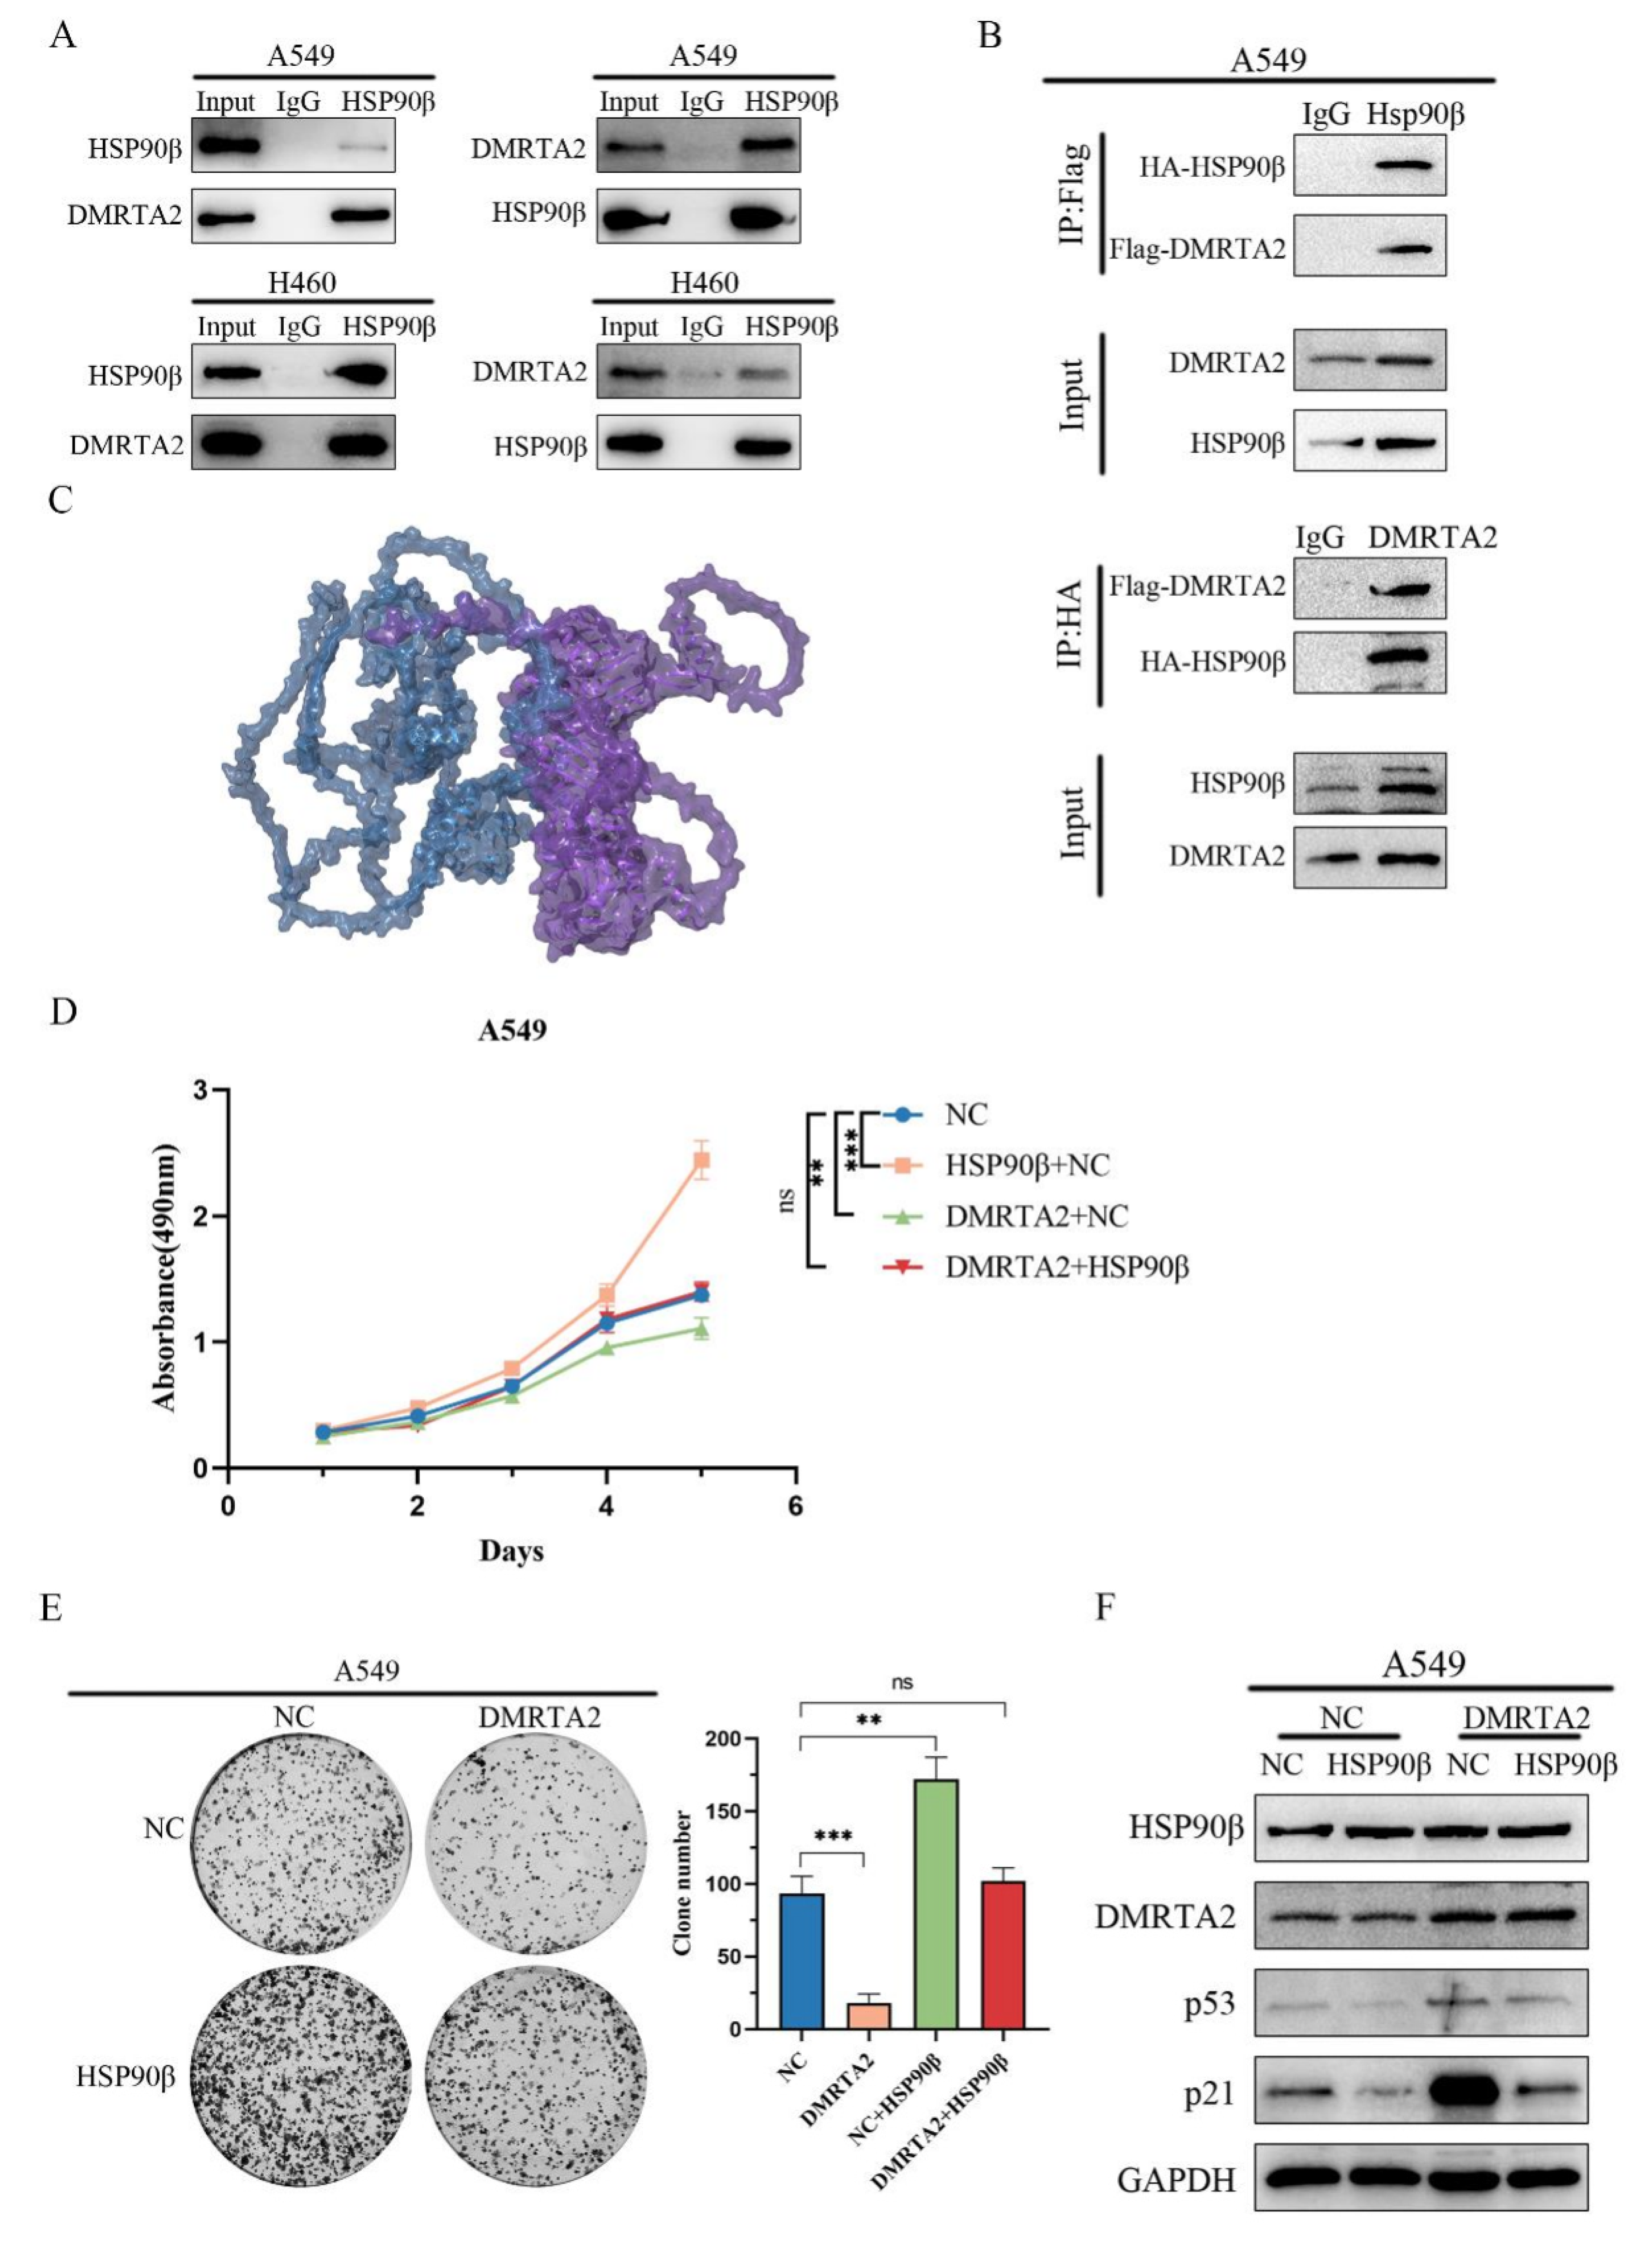
3.5. DMRTA2 Binding to HSP90β Inhibits p53 Degradation

To clarify the mechanism by which DMRTA2 affects p53, we performed mass spectrometry analysis after overexpressing DMRTA2 in A549 cells (Figure 11A), which identified HSP90β as one of the significantly interacting proteins. The literature reports indicate that HSP90β preferentially binds to wild-type p53, promoting its ubiquitin-mediated degradation and nuclear export. Knockdown of HSP90β resulted in the significantly inhibited proliferation of lung cancer cells in MTS and colony formation assays (Figure 11B,C), and Western blot analysis showed increased levels of p53 and p21 proteins (Figure 11D). Immunofluorescence and ubiquitination assays demonstrated reduced p53 ubiquitination and increased nuclear p53 levels (Figure 11E,F). Co-immunoprecipitation experiments confirmed the interaction between DMRTA2 and HSP90β (Figure 12A,B), and protein–protein interaction simulation results indicate that DMRTA2 can form a stable complex with HSP90β (Figure 12C). Given that DMRTA2 and HSP90β exert opposite effects on p53 and that DMRTA2 does not affect HSP90β expression, we hypothesized that DMRTA2 inhibits the binding of HSP90β to p53 by binding to HSP90β, thereby suppressing p53 ubiquitination. MTS and colony formation assays showed that the overexpression of DMRTA2 could reverse the pro-proliferative effect of HSP90β on lung cancer cells (Figure 12D,E), and Western blot results also restore the expression of p53 and p21 (Figure 12F). Finally, immunoprecipitation experiments with a gradient overexpression of DMRTA2 indicated that as DMRTA2 expression increased, the binding of HSP90β to p53 decreased (Figure 13A,B). In conclusion, DMRTA2 activates the p53 pathway by binding to HSP90β, inhibiting its ubiquitination and nuclear export of p53, and suppressing the proliferation and invasion of lung cancer cells (Figure 13C).

4. Discussion

Our study establishes DMRTA2 as a context-dependent regulator in NSCLC with dual functionality dictated by p53 status. While highly expressed in NSCLC and associated with better survival rates, DMRTA2 demonstrates tumor-suppressive activity in wild-type p53 cells by competitively binding HSP90β at its N-terminal ATP-binding and middle domains, thereby inhibiting HSP90β-p53 interaction. This molecular sequestration suppresses p53 ubiquitination and nuclear export, leading to p53/p21 pathway activation, cell cycle arrest, and the inhibition of proliferation/invasion (Figure 13C). The specificity of this mechanism is evidenced by DMRTA2’s exclusive interaction with HSP90β (not HSP90α) in p53 wild-type environments, consistent with HSP90β’s role in stabilizing wild-type p53 versus HSP90α’s preference for mutant p53 [31,32].
Paradoxically, DMRTA2 exhibits pro-tumorigenic properties in p53-mutant/null cells (e.g., SK-MES-1, H1299), promoting proliferation and invasion through two non-mutually exclusive mechanisms: First, potential complex formation with HSP90α may stabilize oncogenic mutant p53—a hypothesis supported by DMRTA2’s nucleolar localization (Figure 4B), which correlates with stress-responsive protein stabilization. Second, GSEA analysis reveals DMRTA2’s association with DNA damage repair pathways (nucleotide/base excision repair, mismatch repair, homologous recombination) and survival cascades (MAPK/NF-κB), suggesting alternative pathway activation when p53 is compromised.
This functional duality is further illuminated by DMRTA2’s non-canonical characteristics: (1) Despite being a transcription factor, it minimally affects p53 mRNA levels while significantly regulating p21 expression; (2) Its nucleocytoplasmic shuttling, mediated by the interaction with nuclear transport protein IPO7, facilitates extranuclear functions; and (3) Multiple phosphorylation sites indicate post-translational regulation potential. Structural modeling reveals that DMRTA2-HSP90β binding occurs primarily in unstructured regions, with HSP90β’s critical functional domains being occupied, providing a mechanistic insight into how it disrupts HSP90β’s chaperone activity.
The clinical implications are twofold: First, DMRTA2’s association with DNA repair pathways suggests the possible modulation of radiotherapy/chemotherapy sensitivity. Second, its context-dependent functionality presents opportunities for p53-status-stratified therapies. Future studies should validate DMRTA2-HSP90α interactions in p53-mutant systems, characterize phosphorylation-dependent regulation, and explore its DNA damage response role—critical steps toward leveraging this multifaceted target for precision oncology.

Author Contributions

Conceptualization, S.D. and L.L.; methodology, S.D.; formal analysis, L.L.; investigation, S.D.; funding acquisition, J.D. All authors have read and agreed to the published version of the manuscript.

Funding

This study was supported by the Liaoning Provincial Science and Technology Fund Project (No.2023JH2/20200114).

Institutional Review Board Statement

Not applicable.

Informed Consent Statement

Not applicable.

Data Availability Statement

All the databases we used are openly available in TCGA at https://portal.gdc.cancer.gov/ (accessed on 6 April 2024), GEO at https://www.ncbi.nlm.nih.gov/geo/ (accessed on 6 April 2024), and BioGRID ORCs at https://orcs.thebiogrid.org/ (accessed on 6 April 2024).

Conflicts of Interest

The authors declare no conflict of interest.

References

  1. Sung, H.; Ferlay, J.; Siegel, R.L.; Laversanne, M.; Soerjomataram, I.; Jemal, A.; Bray, F. Global Cancer Statistics 2020: GLOBOCAN Estimates of Incidence and Mortality Worldwide for 36 Cancers in 185 Countries. CA Cancer J. Clin. 2021, 71, 209–249. [Google Scholar] [CrossRef] [PubMed]
  2. Siegel, R.L.; Miller, K.D.; Wagle, N.S.; Jemal, A. Cancer Statistics, 2023. CA Cancer J. Clin. 2023, 73, 17–48. [Google Scholar] [CrossRef] [PubMed]
  3. Siegel, R.L.; Miller, K.D.; Fuchs, H.E.; Jemal, A. Cancer Statistics, 2022. CA Cancer J. Clin. 2022, 72, 7–33. [Google Scholar] [CrossRef]
  4. Cao, M.; Chen, W. Epidemiology of Lung Cancer in China. Thorac. Cancer 2019, 10, 3–7. [Google Scholar] [CrossRef]
  5. Zeng, H.; Chen, W.; Zheng, R.; Zhang, S.; Ji, J.S.; Zou, X.; Xia, C.; Sun, K.; Yang, Z.; Li, H.; et al. Changing Cancer Survival in China during 2003–15: A Pooled Analysis of 17 Population-Based Cancer Registries. Lancet Glob. Health. 2018, 6, e555–e567. [Google Scholar] [CrossRef]
  6. Ottolenghi, C.; Fellous, M.; Barbieri, M.; McElreavey, K. Novel Paralogy Relations among Human Chromosomes Support a Link between the Phylogeny of Doublesex-Related Genes and the Evolution of Sex Determination. Genomics 2002, 79, 333–343. [Google Scholar] [CrossRef] [PubMed]
  7. Allemani, C.; Matsuda, T.; Di Carlo, V.; Harewood, R.; Matz, M.; Nikšić, M.; Bonaventure, A.; Valkov, M.; Johnson, C.J.; Estève, J.; et al. Global Surveillance of Trends in Cancer Survival 2000–14 (CONCORD-3): Analysis of Individual Records for 37 513 025 Patients Diagnosed with One of 18 Cancers from 322 Population-Based Registries in 71 Countries. Lancet 2018, 391, 1023–1075. [Google Scholar] [CrossRef]
  8. Wang, F.; Yu, Y.; Ji, D.; Li, H. The DMRT Gene Family in Amphioxus. J. Biomol. Struct. Dyn. 2012, 30, 191–200. [Google Scholar] [CrossRef]
  9. Matson, C.K.; Zarkower, D. Sex and the Singular DM Domain: Insights into Sexual Regulation, Evolution and Plasticity. Nat. Rev. Genet. 2012, 13, 163–174. [Google Scholar] [CrossRef]
  10. Erdman, S.E.; Burtis, K.C. The Drosophila Doublesex Proteins Share a Novel Zinc Finger Related DNA Binding Domain. EMBO J. 1993, 12, 527–535. [Google Scholar] [CrossRef]
  11. Zhu, L.; Wilken, J.; Phillips, N.B.; Narendra, U.; Chan, G.; Stratton, S.M.; Kent, S.B.; Weiss, M.A. Sexual Dimorphism in Diverse Metazoans Is Regulated by a Novel Class of Intertwined Zinc Fingers. Genes Dev. 2000, 14, 1750–1764. [Google Scholar] [CrossRef] [PubMed]
  12. Raymond, C.S.; Shamu, C.E.; Shen, M.M.; Seifert, K.J.; Hirsch, B.; Hodgkin, J.; Zarkower, D. Evidence for Evolutionary Conservation of Sex-Determining Genes. Nature 1998, 391, 691–695. [Google Scholar] [CrossRef]
  13. Bellefroid, E.J.; Leclère, L.; Saulnier, A.; Keruzore, M.; Sirakov, M.; Vervoort, M.; De Clercq, S. Expanding Roles for the Evolutionarily Conserved Dmrt Sex Transcriptional Regulators during Embryogenesis. Cell. Mol. Life Sci. 2013, 70, 3829–3845. [Google Scholar] [CrossRef]
  14. Murphy, M.W.; Lee, J.K.; Rojo, S.; Gearhart, M.D.; Kurahashi, K.; Banerjee, S.; Loeuille, G.-A.; Bashamboo, A.; McElreavey, K.; Zarkower, D.; et al. An Ancient Protein-DNA Interaction Underlying Metazoan Sex Determination. Nat. Struct. Mol. Biol. 2015, 22, 442–451. [Google Scholar] [CrossRef] [PubMed]
  15. Murphy, M.W.; Sarver, A.L.; Rice, D.; Hatzi, K.; Ye, K.; Melnick, A.; Heckert, L.L.; Zarkower, D.; Bardwell, V.J. Genome-Wide Analysis of DNA Binding and Transcriptional Regulation by the Mammalian Doublesex Homolog DMRT1 in the Juvenile Testis. Proc. Natl. Acad. Sci. USA 2010, 107, 13360–13365. [Google Scholar] [CrossRef]
  16. Murphy, M.W.; Zarkower, D.; Bardwell, V.J. Vertebrate DM Domain Proteins Bind Similar DNA Sequences and Can Heterodimerize on DNA. BMC Mol. Biol. 2007, 8, 58. [Google Scholar] [CrossRef] [PubMed]
  17. Shirak, A.; Seroussi, E.; Cnaani, A.; E Howe, A.; Domokhovsky, R.; Zilberman, N.; Kocher, T.D.; Hulata, G.; Ron, M. Amh and Dmrta2 Genes Map to Tilapia (Oreochromis spp.) Linkage Group 23 within Quantitative Trait Locus Regions for Sex Determination. Genetics 2006, 174, 1573–1581. [Google Scholar] [CrossRef]
  18. Parlier, D.; Moers, V.; Van Campenhout, C.; Preillon, J.; Leclère, L.; Saulnier, A.; Sirakov, M.; Busengdal, H.; Kricha, S.; Marine, J.-C.; et al. The Xenopus Doublesex-Related Gene Dmrt5 Is Required for Olfactory Placode Neurogenesis. Dev. Biol. 2013, 373, 39–52. [Google Scholar] [CrossRef]
  19. Yoshizawa, A.; Nakahara, Y.; Izawa, T.; Ishitani, T.; Tsutsumi, M.; Kuroiwa, A.; Itoh, M.; Kikuchi, Y. Zebrafish Dmrta2 Regulates Neurogenesis in the Telencephalon. Genes Cells 2011, 16, 1097–1109. [Google Scholar] [CrossRef]
  20. Xu, S.; Xia, W.; Zohar, Y.; Gui, J.-F. Zebrafish Dmrta2 Regulates the Expression of Cdkn2c in Spermatogenesis in the Adult Testis. Biol. Reprod. 2013, 88, 14. [Google Scholar] [CrossRef]
  21. Young, F.I.; Keruzore, M.; Nan, X.; Gennet, N.; Bellefroid, E.J.; Li, M. The Doublesex-Related Dmrta2 Safeguards Neural Progenitor Maintenance Involving Transcriptional Regulation of Hes1. Proc. Natl. Acad. Sci. USA 2017, 114, E5599–E5607. [Google Scholar] [CrossRef] [PubMed]
  22. Urquhart, J.E.; Beaman, G.; Byers, H.; Roberts, N.A.; Chervinsky, E.; O’Sullivan, J.; Pilz, D.; Fry, A.; Williams, S.G.; Bhaskar, S.S.; et al. DMRTA2 (DMRT5) Is Mutated in a Novel Cortical Brain Malformation. Clin. Genet. 2016, 89, 724–727. [Google Scholar] [CrossRef] [PubMed]
  23. Desmaris, E.; Keruzore, M.; Saulnier, A.; Ratié, L.; Assimacopoulos, S.; De Clercq, S.; Nan, X.; Roychoudhury, K.; Qin, S.; Kricha, S.; et al. DMRT5, DMRT3, and EMX2 Cooperatively Repress Gsx2 at the Pallium-Subpallium Boundary to Maintain Cortical Identity in Dorsal Telencephalic Progenitors. J. Neurosci. 2018, 38, 9105–9121. [Google Scholar] [CrossRef]
  24. Lee, C.-M.; Zhou, L.; Liu, J.; Shi, J.; Geng, Y.; Liu, M.; Wang, J.; Su, X.; Barad, N.; Wang, J.; et al. Single-Cell RNA-Seq Analysis Revealed Long-Lasting Adverse Effects of Tamoxifen on Neurogenesis in Prenatal and Adult Brains. Proc. Natl. Acad. Sci. USA 2020, 117, 19578–19589. [Google Scholar] [CrossRef] [PubMed]
  25. Jin, Y.; Qin, X. Significance of TP53 Mutation in Treatment and Prognosis in Head and Neck Squamous Cell Carcinoma. Biomark. Med. 2021, 15, 15–28. [Google Scholar] [CrossRef]
  26. Hassin, O.; Oren, M. Drugging P53 in Cancer: One Protein, Many Targets. Nat. Rev. Drug Discov. 2023, 22, 127–144. [Google Scholar] [CrossRef]
  27. Liebl, M.C.; Hofmann, T.G. The Role of P53 Signaling in Colorectal Cancer. Cancers 2021, 13, 2125. [Google Scholar] [CrossRef]
  28. Sullivan, K.D.; Galbraith, M.D.; Andrysik, Z.; Espinosa, J.M. Mechanisms of Transcriptional Regulation by P53. Cell Death Differ. 2018, 25, 133–143. [Google Scholar] [CrossRef]
  29. Kung, C.-P.; Weber, J.D. It’s Getting Complicated—A Fresh Look at P53-MDM2-ARF Triangle in Tumorigenesis and Cancer Therapy. Front. Cell Dev. Biol. 2022, 10, 818744. [Google Scholar] [CrossRef]
  30. Deng, L.; Meng, T.; Chen, L.; Wei, W.; Wang, P. The Role of Ubiquitination in Tumorigenesis and Targeted Drug Discovery. Signal Transduct. Target. Ther. 2020, 5, 11. [Google Scholar] [CrossRef]
  31. Cockram, P.E.; Kist, M.; Prakash, S.; Chen, S.-H.; Wertz, I.E.; Vucic, D. Ubiquitination in the Regulation of Inflammatory Cell Death and Cancer. Cell Death Differ. 2021, 28, 591–605. [Google Scholar] [CrossRef] [PubMed]
  32. Chen, Y.; Ren, W.; Wang, Q.; He, Y.; Ma, D.; Cai, Z. The Regulation of Necroptosis by Ubiquitylation. Apoptosis 2022, 27, 668–684. [Google Scholar] [CrossRef] [PubMed]
Figure 1. The intersection of four datasets was used to obtain the core genes.
Cimb 47 00497 g001
Figure 2. Expression of DMRTA2 in lung cancer and adjacent normal lung tissues. (A) The mRNA level of DMRTA2 in various cancer tissues is higher than that in para-cancer tissues. (B) The expression of DMRTA2 in unmatched lung cancer and adjacent tissues was detected by the TCGA database, and the mRNA level of DMRTA2 was highly expressed in lung cancer tissues. (C) The mRNA expression of DMRTA in paired lung cancer and adjacent tissues was detected by the TCGA database, and DMRTA2 was highly expressed in paired lung cancer tissues. (D) The ROC curve of DMRTA2 in NSCLC was plotted using the TCGA database, and the AUC was 0.833 (95%CI, 0.806–0.860). p < 0.05 is statistically significant; * p < 0.05, ** p < 0.01, and *** p < 0.001.
Cimb 47 00497 g002
Figure 3. Kaplan–Meier prognostic analysis of DMRTA2 in NSCLC. (A) Disease-specific survival. (B) Progression-free survival. (C) Overall survival. p < 0.05 was statistically significant.
Cimb 47 00497 g003
Figure 4. Protein expression and localization of DMRTA2 in lung cancer cell lines. (A) Western blot showed that DMRTA2 was highly expressed in H460, H1299, HCC827, and H1975 cells, and had a low expression in SK-MES-1 and LK-2 cells. (B) Immunofluorescence results show that DMRTA2 is mainly expressed in the cytoplasm and nucleus. p < 0.05 was statistically significant; * p < 0.05, ** p < 0.01, and *** p < 0.001. scale bar: 20 μm.
Cimb 47 00497 g004
Figure 5. Effect of DMRTA2 expression on the proliferation of NSCLC cells. (A) Detection of DMRTA2 overexpression in A549 and SK-MES-1 cells and knockout efficiency in H1299 and H460 cells. (B) MTS assay was used to detect cell proliferation after the overexpression of DMRTA2 in A549 and SK-MES-1 cells, and after the knockout of DMRTA2 in H1299 and H460 cells. (C) Colony formation assay was performed to detect the colony formation ability of cells after the overexpression of DMRTA2 in A549 and SK-MES-1 cells, and after the knockout of DMRTA2 in H1299 and H460 cells. * p < 0.05, ** p < 0.01, and *** p < 0.001.
Cimb 47 00497 g005
Figure 6. Effect of DMRTA2 expression on the invasion ability of NSCLC cells. Transwell assay detected the invasion ability of cells after the overexpression and knockout of DMRTA2 in A549, SK-MES-1, H1299, and H460 cells. *** p < 0.001. scale bar: 50 μm.
Cimb 47 00497 g006
Figure 7. DMRTA2 inhibits the malignant phenotype of p53 wild-type lung cancer cells by regulating the p53 pathway. (A) GSEA enrichment analysis showed that the expression of DMRTA2 was correlated with the p53 pathway (FDR q-value= 0.018, p < 0.05). (B) Western blot analysis of the effects of overexpression of DMRTA2 in A549 and the knockout of DMRTA2 in H460 on p53 pathway-associated proteins. p < 0.05 was statistically significant; ** p < 0.01, and *** p < 0.001, ns means not significant.
Cimb 47 00497 g007
Figure 8. DMRTA2 inhibits the p53 malignant phenotype of wild-type lung cancer cells by regulating the p53 pathway. (A) Effects of the overexpression of DMRTA2 on p53 and p21 proteins after p53 knockdown by Western blot analysis. (B) Colony formation experiment was conducted to detect the effect of the overexpression of DMRTA2 on cell clonogenesis after p53 knockdown. (C) The effect of the overexpression of DMRTA2 on cell proliferation after the p53 knockdown was detected by MTS assay. (D) Effect of the overexpression of DMRTA2 on cell invasion ability after p53 knockout. p < 0.05 was statistically significant; * p < 0.05, ** p < 0.01, and *** p < 0.001, ns means not significant. scale bar: 50 μm.
Cimb 47 00497 g008
Figure 9. Effect of DMRTA2 on downstream proteins of the p53 pathway in p53 mutant and p53-deficient cells. Western blot analysis of the effects of the overexpression of DMRTA2 in SK-MES-1 and the knockout of DMRTA2 in H1299 on p53 pathway-related proteins. p < 0.05 was statistically significant; ** p < 0.01, and *** p < 0.001.
Cimb 47 00497 g009
Figure 10. DMRTA affects the stability of the p53 protein and inhibits p53 ubiquitination. (A) qRT-PCR assay was used to detect the effect of the overexpression or DMRTA2 knockout on p53 transcription level. (B) GSEA results show that DMRTA2 is associated with ubiquitin-mediated protein degradation (FDR q-value= 0.007, p < 0.05). (C) A549 cells were cultured for different times after adding actinomycosterone, and the influence of the overexpression of DMRTA2 on the stability of p53 protein was detected by Western blot. (D) MG132 was added into H460 cells, and the effect of the DMRTA2 knockout on the proteasome degradation pathway of p53 was detected by Western blot. (E) A549 cells were simultaneously transfected with DMRTA2 plasmid and Ub plasmid to detect the effect of the overexpression of DMRTA2 on the degree of p53 ubiquitination. (F) The effect of the overexpression of DMRTA2 on the subcellular localization of p53 was detected by immunofluorescence assay. (G) After the overexpression of DMRTA2 in A549 cells, a nuclear plasma separation experiment was conducted, and the influence of the overexpression of DMRTA2 on the entry and exit of p53 in the nucleus was detected by Western blot. p < 0.05 was statistically significant; ** p < 0.01, and *** p < 0.001, ns means not significant. scale bar: 10 μm.
Cimb 47 00497 g010
Figure 11. Knockdown of HSP90β, inhibition of p53 ubiquitination, and inhibition of lung cancer cell proliferation. (A) Protein mass spectrometry for proteins that may interact with DMRTA2. (B) MTS assay was used to detect the effect of HSP90β knockdown on cell proliferation in A549. (C) Colony formation assay to detect the effect of knocking down HSP90β in A549 on cell clonogenesis. (D) Western blot analysis of the effect of knocking down HSP90β on p53 protein expression in A549. (E) The effect of HSP90β knockdown on p53 subcellular localization was detected by immunofluorescence assay. (F) Western blot analysis of the effect of knocking down HSP90β on p53 ubiquitination. p < 0.05 was statistically significant; *** p < 0.001.
Cimb 47 00497 g011
Figure 12. Binding of DMRTA2 to HSP90β and inhibition of p53 degradation. (A) Exogenous immunoprecipitation experiment verified the binding of DMRTA2 to HSP90β. (B) Computer simulations of protein–protein interactions show that DMRTA2 binds stably to HSP90β. (C) Endogenous immunoprecipitation assay verified the binding of DMRTA2 and HSP90β. (D) MTS assay examined the effect of the overexpression of DMRTA2 on cell proliferation after the overexpression of HSP90β in A549 cells. (E) Colony formation assay to determine the effect of the overexpression of DMRTA2 on cell clonogenesis after the overexpression of HSP90β in A549 cells. (F) Western blot analysis of the effect of the overexpression of DMRTA2 on p53 protein expression after the overexpression of HSP90β in A549 cells. p < 0.05 was statistically significant; ** p < 0.01, and *** p < 0.001, ns means not significant.
Cimb 47 00497 g012
Figure 13. DMRTA2 binds to HSP90β and competitively inhibits the binding of p53 to HSP90β. (A) Gradient overexpression of DMRTA2 in A549 was performed to detect changes in p53 bound to HSP90β. (B) HSP90β and p53 were co-transfected in A549 cells at the same time, and gradient overexpression of DMRTA2 was performed to detect the changes in p53 bound to HSP90β. (C) Schematic diagram of the action pathway of DMRTA2 in lung cancer cells.
Cimb 47 00497 g013
Disclaimer/Publisher’s Note: The statements, opinions and data contained in all publications are solely those of the individual author(s) and contributor(s) and not of MDPI and/or the editor(s). MDPI and/or the editor(s) disclaim responsibility for any injury to people or property resulting from any ideas, methods, instructions or products referred to in the content.

