Article

Comparative Analysis of the Complete Chloroplast Genomes of Eight Salvia Medicinal Species: Insights into the Deep Phylogeny of Salvia in East Asia

1
Baotou Medical College, Baotou 014040, China
2
Kunming Institute of Botany, Chinese Academy of Sciences, Kunming 650201, China
*
Author to whom correspondence should be addressed.
These authors contributed equally to this work.
Curr. Issues Mol. Biol. 2025, 47(7), 493; https://doi.org/10.3390/cimb47070493 (registering DOI)
Submission received: 27 May 2025 / Revised: 23 June 2025 / Accepted: 24 June 2025 / Published: 27 June 2025

Abstract

Salvia, a medicinally and economically important genus, is widely used in traditional medicine, agriculture, and horticulture. This study compares the chloroplast genomes of eight East Asian Salvia species to assess genetic diversity, structural features, and evolutionary relationships. Complete chloroplast genomes were sequenced, annotated, and analyzed for gene content, codon usage, and repetitive sequences. Phylogenetic relationships were reconstructed using Maximum Likelihood, Maximum Parsimony and Bayesian inference. The genomes exhibited a conserved quadripartite structure (151,081–152,678 bp, GC content 37.9–38.1%), containing 114 unique genes with consistent arrangement. Codon usage favored A/T endings, with leucine (Leu) most frequent and cysteine (Cys) least. We identified 281 long sequence repeats (LSRs) and 345 simple sequence repeats (SSRs), mostly in non-coding regions. Comparative analysis revealed five hypervariable regions (trnH-psbA, rbcL-accD, petA-psbJ, rpl32-trnL, ycf1) as potential molecular markers. Phylogenetic analysis confirmed the monophyly of East Asian Salvia, dividing them into five clades, with Sect. Sonchifoliae basal. While G1, G3, and G8 were monophyletic, G5 and G6 were paraphyletic, and the G7-G8 relationship challenged traditional classifications. The genomic evidence provides crucial insights for resolving long-standing taxonomic uncertainties and refining the classification system of Salvia. These findings suggest a complex evolutionary history involving hybridization and incomplete lineage sorting, providing valuable genomic insights for Salvia phylogeny, taxonomy, and conservation.

1. Introduction

Chloroplasts are vital organelles responsible for photosynthesis in plants, converting solar energy into carbohydrates essential for plant growth and development [1]. The chloroplast (cp) genome typically comprises a single circular DNA molecule with a highly conserved quadripartite structure, including a large single-copy (LSC) region, a small single-copy (SSC), and two inverted repeat (IR) regions, which contribute to genome size variation. The chloroplast genome of higher plants is generally between 120 and 160 kb in length, which is highly conserved in gene structure and order, encoding approximately 110–130 genes. According to the function of genes, we can roughly classify them into two categories: central cellular process genes including those involved in photosynthesis, transcription, and translation, along with specialized functional genes such as matK (RNA processing), cemA (membrane transport), accD (lipid biosynthesis), and ccsA (cytochrome assembly) [2,3]. The chloroplast genome is generally more tractable for comparative analyses than the mitochondrial genome due to its structural stability (conserved quadripartite architecture), higher sequence conservation, and absence of RNA editing, in addition to advantages over nuclear genomes such as moderate size, maternal inheritance, and strong collinearity across species [4]. With the advent of high-throughput sequencing technologies, research on chloroplast genome evolution has expanded rapidly [5], establishing chloroplast genomes as valuable resources for phylogenetic and evolutionary studies.
The genus Salvia L. (Lamiaceae), the largest genus in the mint family, comprises nearly 1000 species of annual or perennial herbs or small shrubs distributed across tropical and temperate regions of the world [6]. The genus holds significant cultural, medicinal, and economic importance. In China, Salvia species have been traditionally used to treat hepatic, renal, cardiovascular, and immune-related diseases [7]. In Europe and America, they serve primarily as flavoring agents, while in Africa, some species are used to treat conditions such as malaria and cancer [8]. Additionally, Salvia species are ornamental plants with fragrance, used not only for the processing of spices but also cultivated as ornamental plants and used in cosmetics, perfumery, landscaping, and aromatherapy [9]. China is the diversity center of Salvia in East Asia, harboring approximately 82 species out of the ~100 species in the region [10]. However, the taxonomic classification of Salvia species remains challenging due to extensive morphological variation and overlapping traits. Traditionally, Salvia was divided into three subgenera based on floral and stamen morphology: subg. Salvia (bilabiate flowers and glandular structures), subg. Sclarea (unique stamen structure, floral morphology, and herbaceous habit) and subg. Allagospadonopsis (distinct stamen morphology) [11]. Recent molecular phylogenetic studies using chloroplast gene fragments (e.g., rbcL, matK, ycf1) and nuclear markers (e.g., ITS), have led to a reassessment of the classification of Salvia in China [12]. The subsequent studies (psbA–trnH, ycf1–rps15, trnL–trnF, rbcL, ITS and ETS) have revealed complex evolutionary patterns and led to the proposal of new subgenera such as subgenus Glutinaria, which comprises all East Asian species [13], along with others like Calosphace in the Americas [14]. East Asian Salvia, once assigned to subg. Salvia, is now recognized as a distinct monophyletic group containing eight subclades (G1–G8) [13]. Despite this reclassification, phylogenetic relationships among these subclades remain ambiguous, often due to limited sampling and insufficient resolution from conventional DNA markers [15].
Complete chloroplast genome sequencing offers higher resolution for reconstructing phylogenies and identifying molecular markers than single or multi-locus datasets [16]. In this study, we sequenced and assembled the chloroplast genomes of eight East Asian Salvia species (Salvia sonchifolia C. Y. Wu, Salvia wardii Stib., Salvia roborowskii Maxim., Salvia przewalskii Maxim., Salvia plebeia R. Br., Salvia kiangsiensis C. Y. Wu, Salvia trijuga Diels, and Salvia chienii Stib through the Illumina sequencing platform. Our specific aims were to (1) characterize their chloroplast genome structures and genetic features, (2) identify potential molecular markers for species delimitation and phylogenetic studies, and (3) reconstruct a high-resolution phylogeny of East Asian Salvia. These findings enhance our understanding of chloroplast genome evolution and provide critical data for taxonomic, evolutionary, and conservation research in this medicinally and ecologically significant genus.

2. Materials and Methods

2.1. Plant Material, DNA Extraction, and Sequencing

Fresh leaves of eight Salvia species (S. sonchifolia, S. wardii, S. roborowskii, S. przewalskii, S. plebeia, S. kiangsiensis, S. trijuga, and S. chienii) were collected from different localities (Table 1) and immediately dried using silica gel to preserve DNA integrity. Voucher specimens were deposited at the herbarium of the Kunming Institute of Botany (KUN), Chinese Academy of Sciences. Total genomic DNA was extracted using the modified cetyltrimethylammonium bromide (CTAB) method described by Doyle (1987) [17] and quantified using a NanoDrop spectrophotometer (Thermo Fisher Scientific, Wilmington, DE, USA) to ensure appropriate quality and concentration. Sequencing libraries were constructed and sequenced on the Illumina HiSeq X Ten platform, producing 150 bp paired-end reads. Sequencing was performed by Novogene (Beijing, China). The resulting chloroplast genome sequences were deposited in GenBank under the accession numbers listed in Table 1. The species highlighted in bold constitute the primary focus of this study.

2.2. Chloroplast Genome Assembly and Annotation

Raw sequencing reads were first processed using Fastp (v 0.23.1) to perform quality control, including adapter removal, trimming of low-quality bases (<Q15), and discarding short reads (<15 bp). High-quality sequencing reads were assembled into complete chloroplast genomes using the GetOrganelle pipeline [18], which is optimized for accurate de novo assembly of organellar genomes. Assemblies were generated using default parameters, with the Salvia miltiorrhiza chloroplast genome (GenBank accession: JX312195) serving as a reference. Circularity and assembly completeness were validated via BLAST (https://blast.ncbi.nlm.nih.gov/, accessed on 1 May 2022), confirming structural integrity and high similarity to the reference genome.
Manual curation and visualization were conducted using Geneious v10.2.2 (Biomatters Ltd., Auckland, New Zealand), ensuring accurate genome annotation and boundary definitions. Genome annotation was performed using the Plastid Genome Annotator (PGA; https://github.com/quxiaojian/PGA, accessed on 15 May 2022) [19], with start/stop codons and intron-exon boundaries manually verified in Geneious v10.2.2. tRNA genes were further confirmed using tRNAscan-SE v2.0 [20]. Circular genome maps were generated using OGDRAW v1.2 [21] (https://chlorobox.mpimp-golm.mpg.de/OGDraw.html, accessed on 1 June 2022), displaying gene arrangement and GC content.

2.3. Genome Structure and Codon Usage Analysis

Chloroplast genome structures, including the large single-copy (LSC), small single-copy (SSC), and inverted repeat (IR) regions, were analyzed using Repeat Finder in Geneious v10.2.2. Basic genomic features such as genome length, GC content, and region sizes were compared across species. To evaluate codon usage bias, Relative synonymous codon usage (RSCU) values for protein-coding regions were calculated using MEGA X v10.0.5. RSCU measures the normalized usage frequency of a specific codon relative to other synonymous codons encoding the same amino acid. An RSCU value > 1 indicates that the codon is used more frequently than expected, suggesting a strong preferential usage in the species. Conversely, an RSCU value < 1 implies that the codon is used less frequently, reflecting weaker preference or avoidance. When RSCU = 1, the codon is used at the expected frequency with no apparent bias.

2.4. Long and Simple Sequence Repeats Analyses

Long sequence repeats (LSRs), including palindromic, reverse, forward, and tandem repeats, were identified using REPuter [22] with a minimum repeat size of 30 bp and a sequence identity threshold of ≥90% (i.e., Hamming distance was 3). Meanwhile, tandem repeats were further validated using Tandem Repeats Finder v4.07b [23]. The analysis was performed using default parameters with alignment scores weighted at match = 2, mismatch = 7, and indels = 7, a minimum alignment score threshold of 50 for reporting repeats, and a maximum period size of 500 bp.
Simple Sequence Repeats (SSR) were predicted with MISA v2.1 (http://pgrc.ipk-gatersleben.de/misa/misa.html, accessed on 8 October 2022) [24] under the following thresholds: mononucleotide repeats ≥ 10, dinucleotide repeats ≥ 5, trinucleotide repeats ≥ 4, tetranucleotide repeats ≥ 3, pentanucleotide repeats ≥ 3, and hexanucleotide repeats ≥ 3. Finally, all repeat sequence prediction results were manually corrected to remove redundant parts. Specifically, the raw output from MISA was subjected to manual curation to eliminate redundancy and false positives. We visually inspected the results in a genome browser to verify the repeat structures. Redundant results were handled by merging compound SSRs (i.e., two or more SSRs adjacent to each other with a spacing of <100 bp) into a single complex SSR locus for statistical purposes. For example, an (AT)6 motif immediately followed by a (GT) 5 motif was treated as one compound SSR, not two separate SSRs. This manual verification and correction step ensured an accurate and non-redundant dataset for all subsequent comparative analyses.

2.5. Comparative Genomic Analysis

Comparative analysis of the eight Salvia chloroplast genomes was conducted using the mVISTA tool with the Shuffle-LAGAN alignment mode [25], using S. roborowskii as the reference. Alignments were visualized to assess sequence conservation and divergence. The boundaries of LSC, SSC, and IR regions were compared to detect structural variation due to IR expansion and contraction. Focus was placed on genes often affected by IR shifts, including rps19, ndhF, and ycf1 [26].
Sliding window analysis was performed using DnaSP v5 [27] to compute nucleotide diversity (Pi) values across the chloroplast genomes. The analysis employed a window size of 600 bp and a step size of 200 bp, enabling the identification of highly variable regions. These regions were evaluated for their potential as molecular markers for phylogenetic studies.

2.6. Phylogenetic Analyses

Complete chloroplast genome sequences of 39 Salvia species, including the eight newly sequenced species, were used for phylogenetic reconstruction. Additional sequences were retrieved from GenBank, as listed in Table 1. The sequences were aligned using MAFFT v1.5.0 with the alignment strategy set to “Auto”, followed by visual inspection of the alignments in Geneious Prime. To ensure data quality, only terminal sequencing artifacts—approximately 50 base pairs from both the 5′ and 3′ ends of each sequencewere removed. Phylogenetic analyses were subsequently conducted on the whole cp genome. Phylogenetic trees were constructed using maximum parsimony (MP) in PAUP* v.4.0b10 [28], maximum likelihood (ML) in RAxML-HPC BlackBox on the CIPRES Science Gateway [29], and Bayesian inference (BI) in MrBayes v3.2.7 [30]. For MP analysis, all characters were treated as unordered and equally weighted, with gaps coded as missing. A heuristic search was implemented with tree-bisection-reconnection (TBR) branch swapping and 1000 random addition sequence replicates. Clade support values were assessed by performing 1000 bootstrap replicates. The nucleotide substitution models for both ML and BI analyses were selected through rigorous statistical evaluation using ModelFinder as implemented in IQ-TREE 2 (v2.2.0). The best-fitting model of molecular evolution (GTR + GAMMA) was determined using the Akaike Information Criterion (AIC). For ML analysis, we set a bootstrap of 1000 replicates. For BI analysis, the MCMC analysis included four chains (one cold and three heated) running for 1,000,000 generations, with trees sampled every 1000 generations. Convergence was monitored through the average standard deviation of split frequencies (<0.01). The first 25% of sampled trees were discarded as burn-in, and the remaining trees were used to construct a majority-rule consensus tree.

3. Results

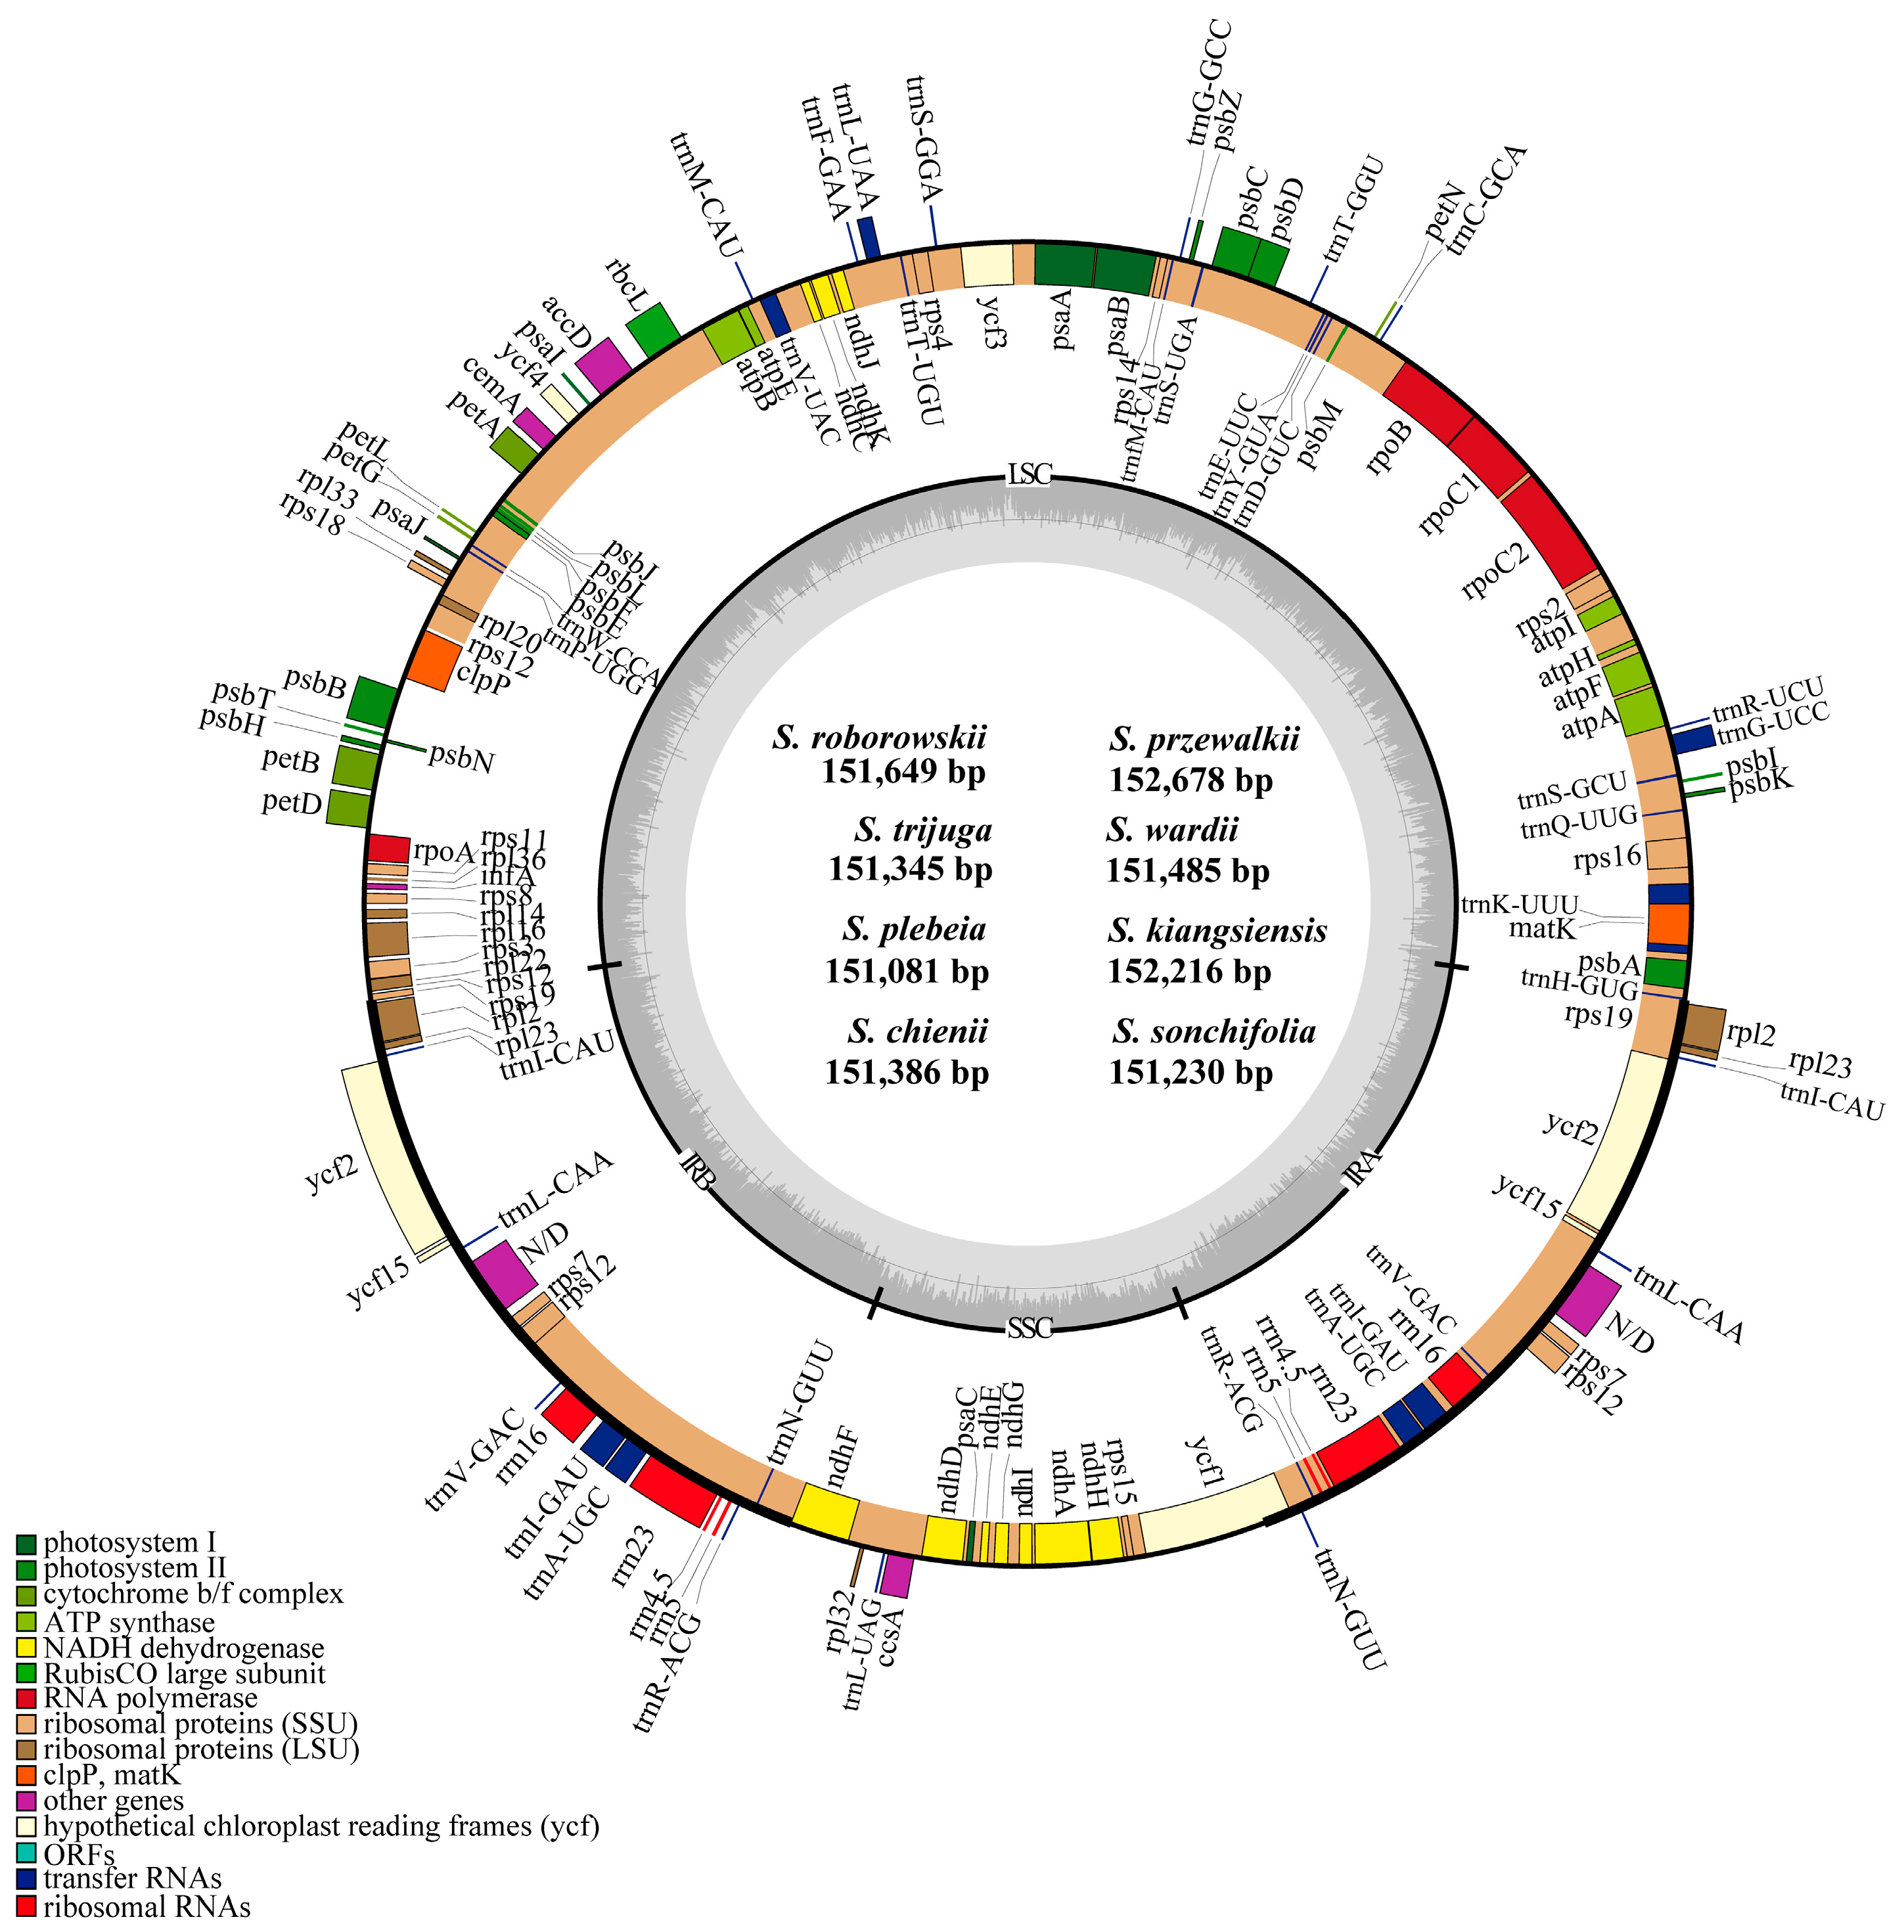
3.1. Size and Structure of Chloroplast Genomes

The chloroplast genomes of the eight Salvia species exhibited a conserved quadripartite structure, comprising a large single-copy (LSC) region (82,464–83,912 bp), a small single-copy (SSC) region (17,493–17,638 bp), and two inverted repeat (IR) regions (25,321–25,596 bp each). Genome sizes ranged from 151,081 bp (S. plebeia) to 152,678 bp (S. przewalskii), with overall GC content ranging from 37.9% to 38.1% (Figure 1). Among the three regions, the IR regions exhibited the highest GC content (43.1–43.2%) due to the presence of rRNA genes, while the LSC (36.0–36.3%) and SSC (31.7–32.0%) regions had lower GC content. The chloroplast genomes of all eight Salvia species contained 132 unique genes including 80 protein-coding regions (CDS), 30 tRNA genes, four rRNA genes, and 18 genes duplicated within the IR regions. These duplicated genes included seven protein-coding genes (rpl2, rpl23, ycf2, ycf15, ndhB, rps7, and rps12), seven tRNA genes (trnI-CAU, trnL-CAA, trnV-GAC, trnI-GAU, trnA-UGC, trnR-ACG, and trnN-GUU), and all four rRNA genes (rrna16, rrna23, rrna4.5, and rrna5). There were 18 intron-containing genes, of which 15 genes (atpF, rpoC1, ndhB, petB, petD, rpl2, rpl16, rps16, ndhA, trnA-UGC, trnI-GAU, trnK-UUU, trnL-UAA, trnG-UCC, and trnV-UAC) had a single intron, while the other three (clpP, ycf3, and rps12) contained two introns (Table 2 and Table 3).

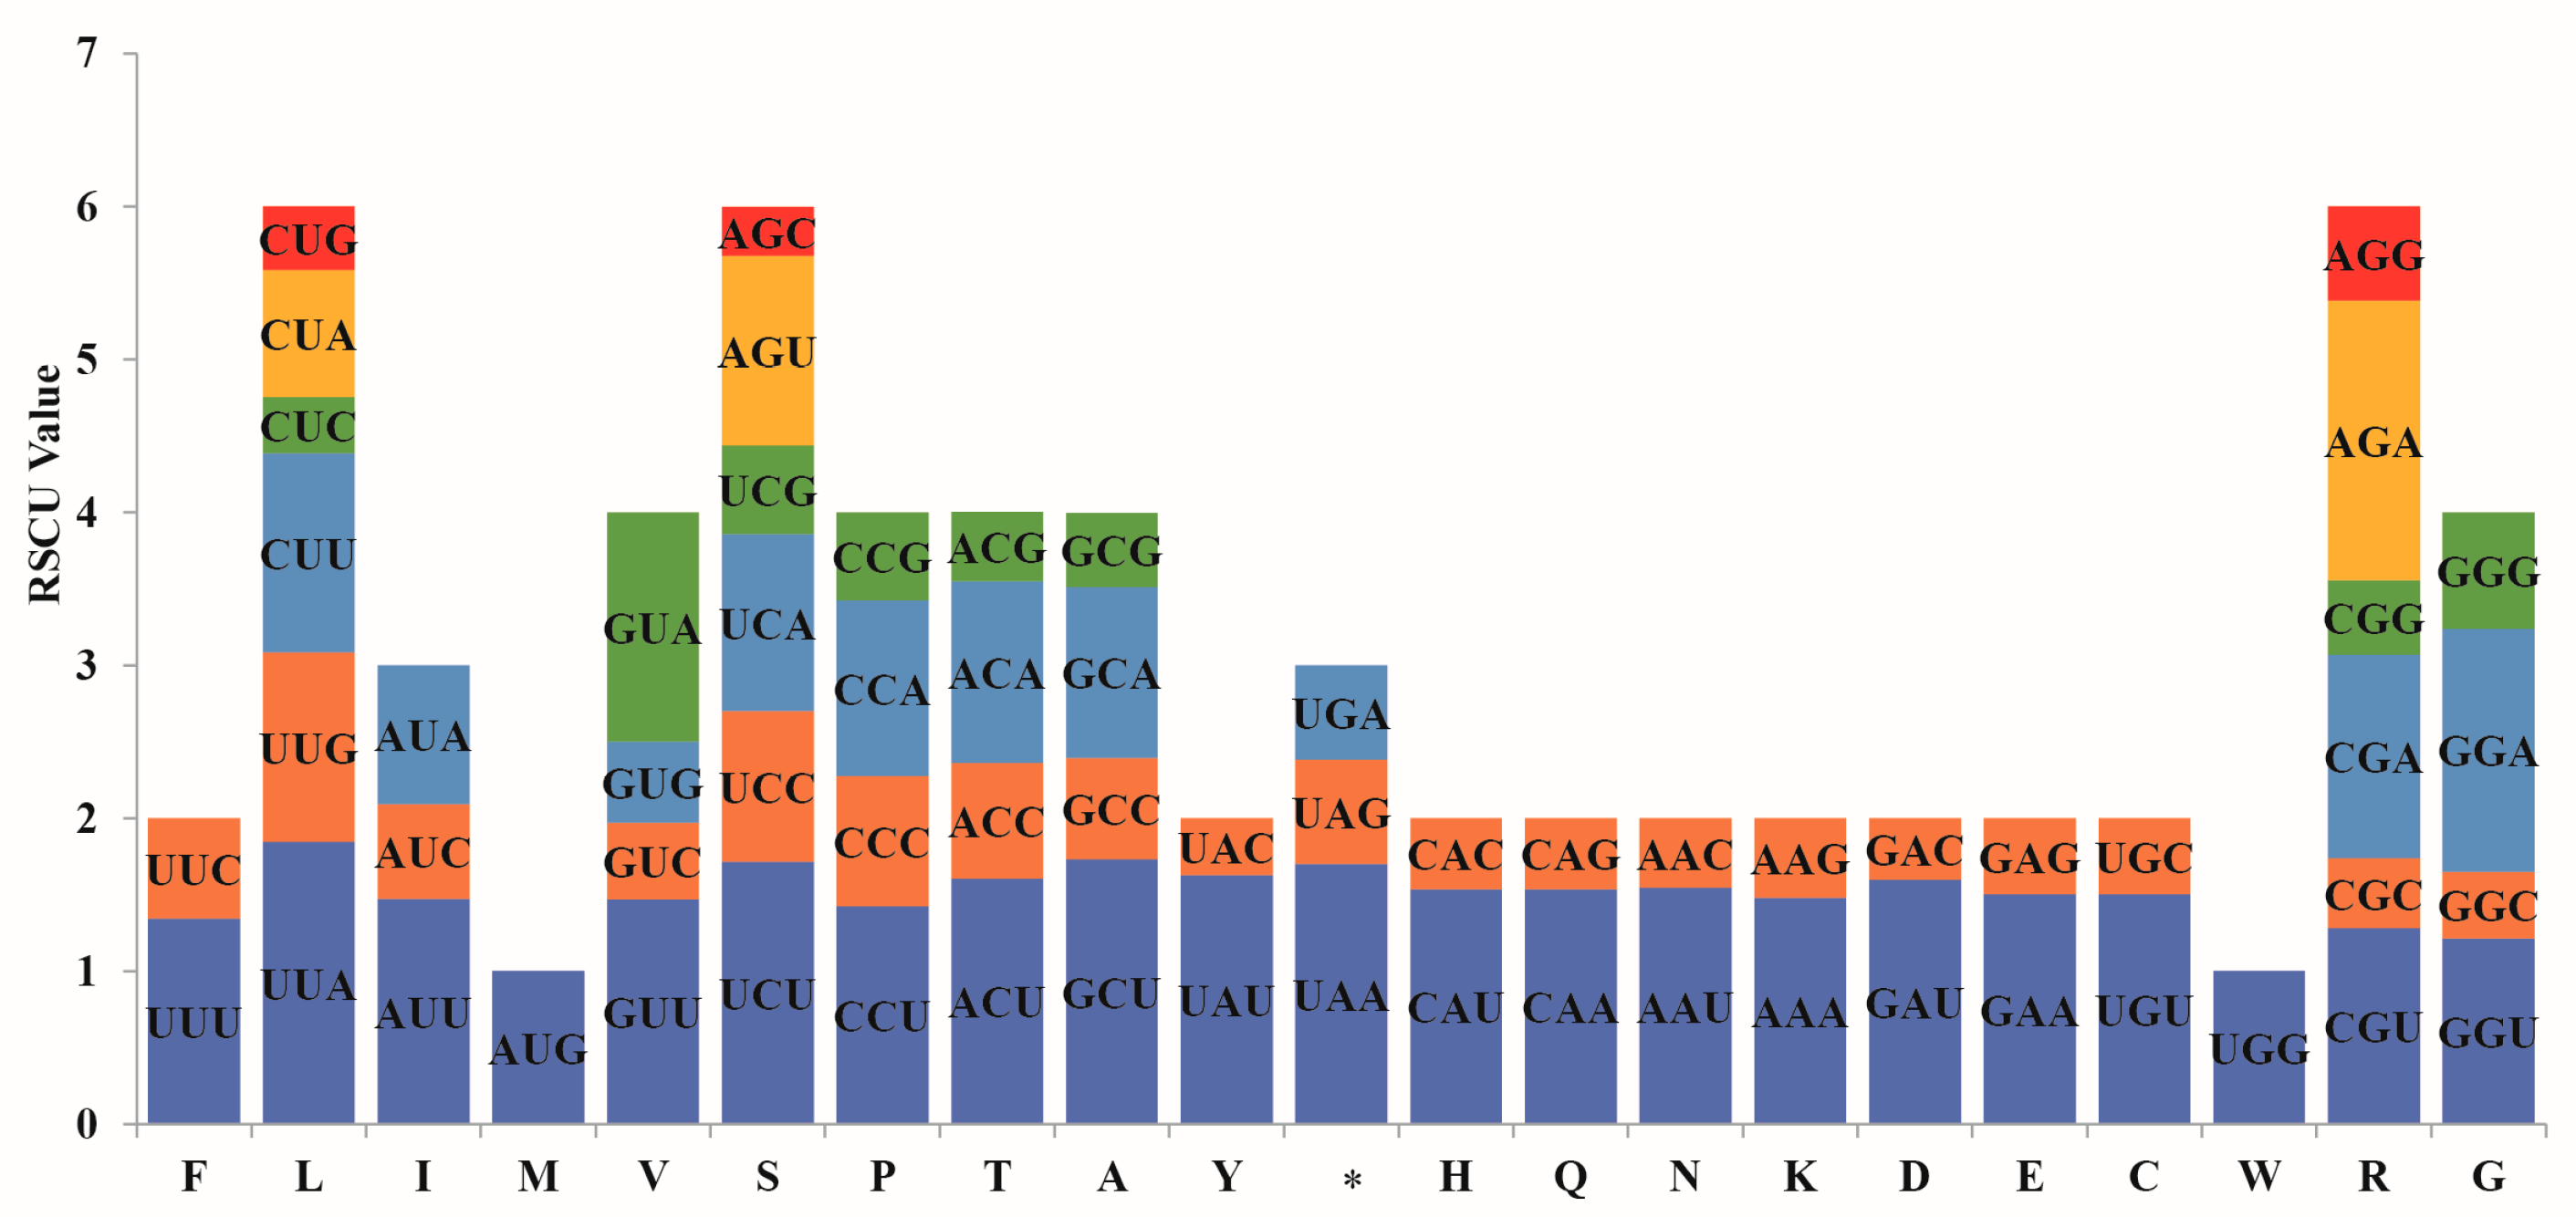
3.2. Codon Usage Preference Analysis

The codon usage patterns among the eight Salvia species were highly conserved, exhibiting only minor variations in absolute codon counts, see Table S1. Across all chloroplast genomes, a total of 64 codons were identified, of which 61 encoded amino acids and three represented stop codons. Among these, UGG (Trp) and AUG (Met) exhibited no usage bias, while the remaining 62 codons displayed consistent preferences across species. Thirty codons were used more frequently (RSCU > 1), including UUU, UUG, CUU, AUU, GUU, GUA, UCU, UCA, CCU, CCA, ACU, ACA, GCU, GCA, UAU, UAA, CAU, CAA, AAU, AAA, GAU, GAA, UGU, CGU, CGA, AGU, GGU, GGA, UUA, and AGA. Notably, UUA (Leu) and AGA (Arg) were among the most preferred codons. In contrast, 32 codons were used less frequently (RSCU < 1), including UUC, CUC, CUA, CUG, AUC, AUA, GUC, GUG, UCC, UCG, CCC, CCG, ACC, ACG, GCC, GCG, UAC, UAG, CAC, CAG, AAC, AAG, GAC, GAG, UGC, UGA, CGC, CGG, AGC, AGG, GGC, GGG. Among preferred codons, 13 codons ended with adenine (A), 16 with uracil (U), whereas only one ended with guanine (G), and none with cytosine (C) (Figure 2). This strong preference for A/U at the third codon position (96.7% of preferred codons) reflects the overall AT-rich composition of Salvia chloroplast genomes and is consistent with codon usage patterns observed in other angiosperms [31].
Taking Salvia sonchifolia as a representative example, the total number of codons in protein-coding genes was 22,716. The most frequently used codon was AUU (Ile, 956 occurrences; RSCU = 1.49), whereas UGC (Cys, 55 occurrences; RSCU = 0.45) was the least used. Among amino acids, leucine showed the highest occurrence (2401 codons; 10.6%), with a strong preference for AT-ending codons such as UUA (31.9%) and CUU (21.7%). In contrast, cysteine was the least represented amino acid (1.08%). This conserved codon usage pattern was consistent across all seven other species, with leucine maintaining remarkably consistent representation (10.3–10.6% in S. roborowalskii, S. przewalskii, S. trijuga, S. wardii, S. plebeia, S. kiangsiensis, and S. chienii) and cysteine remaining the least (1.1%).

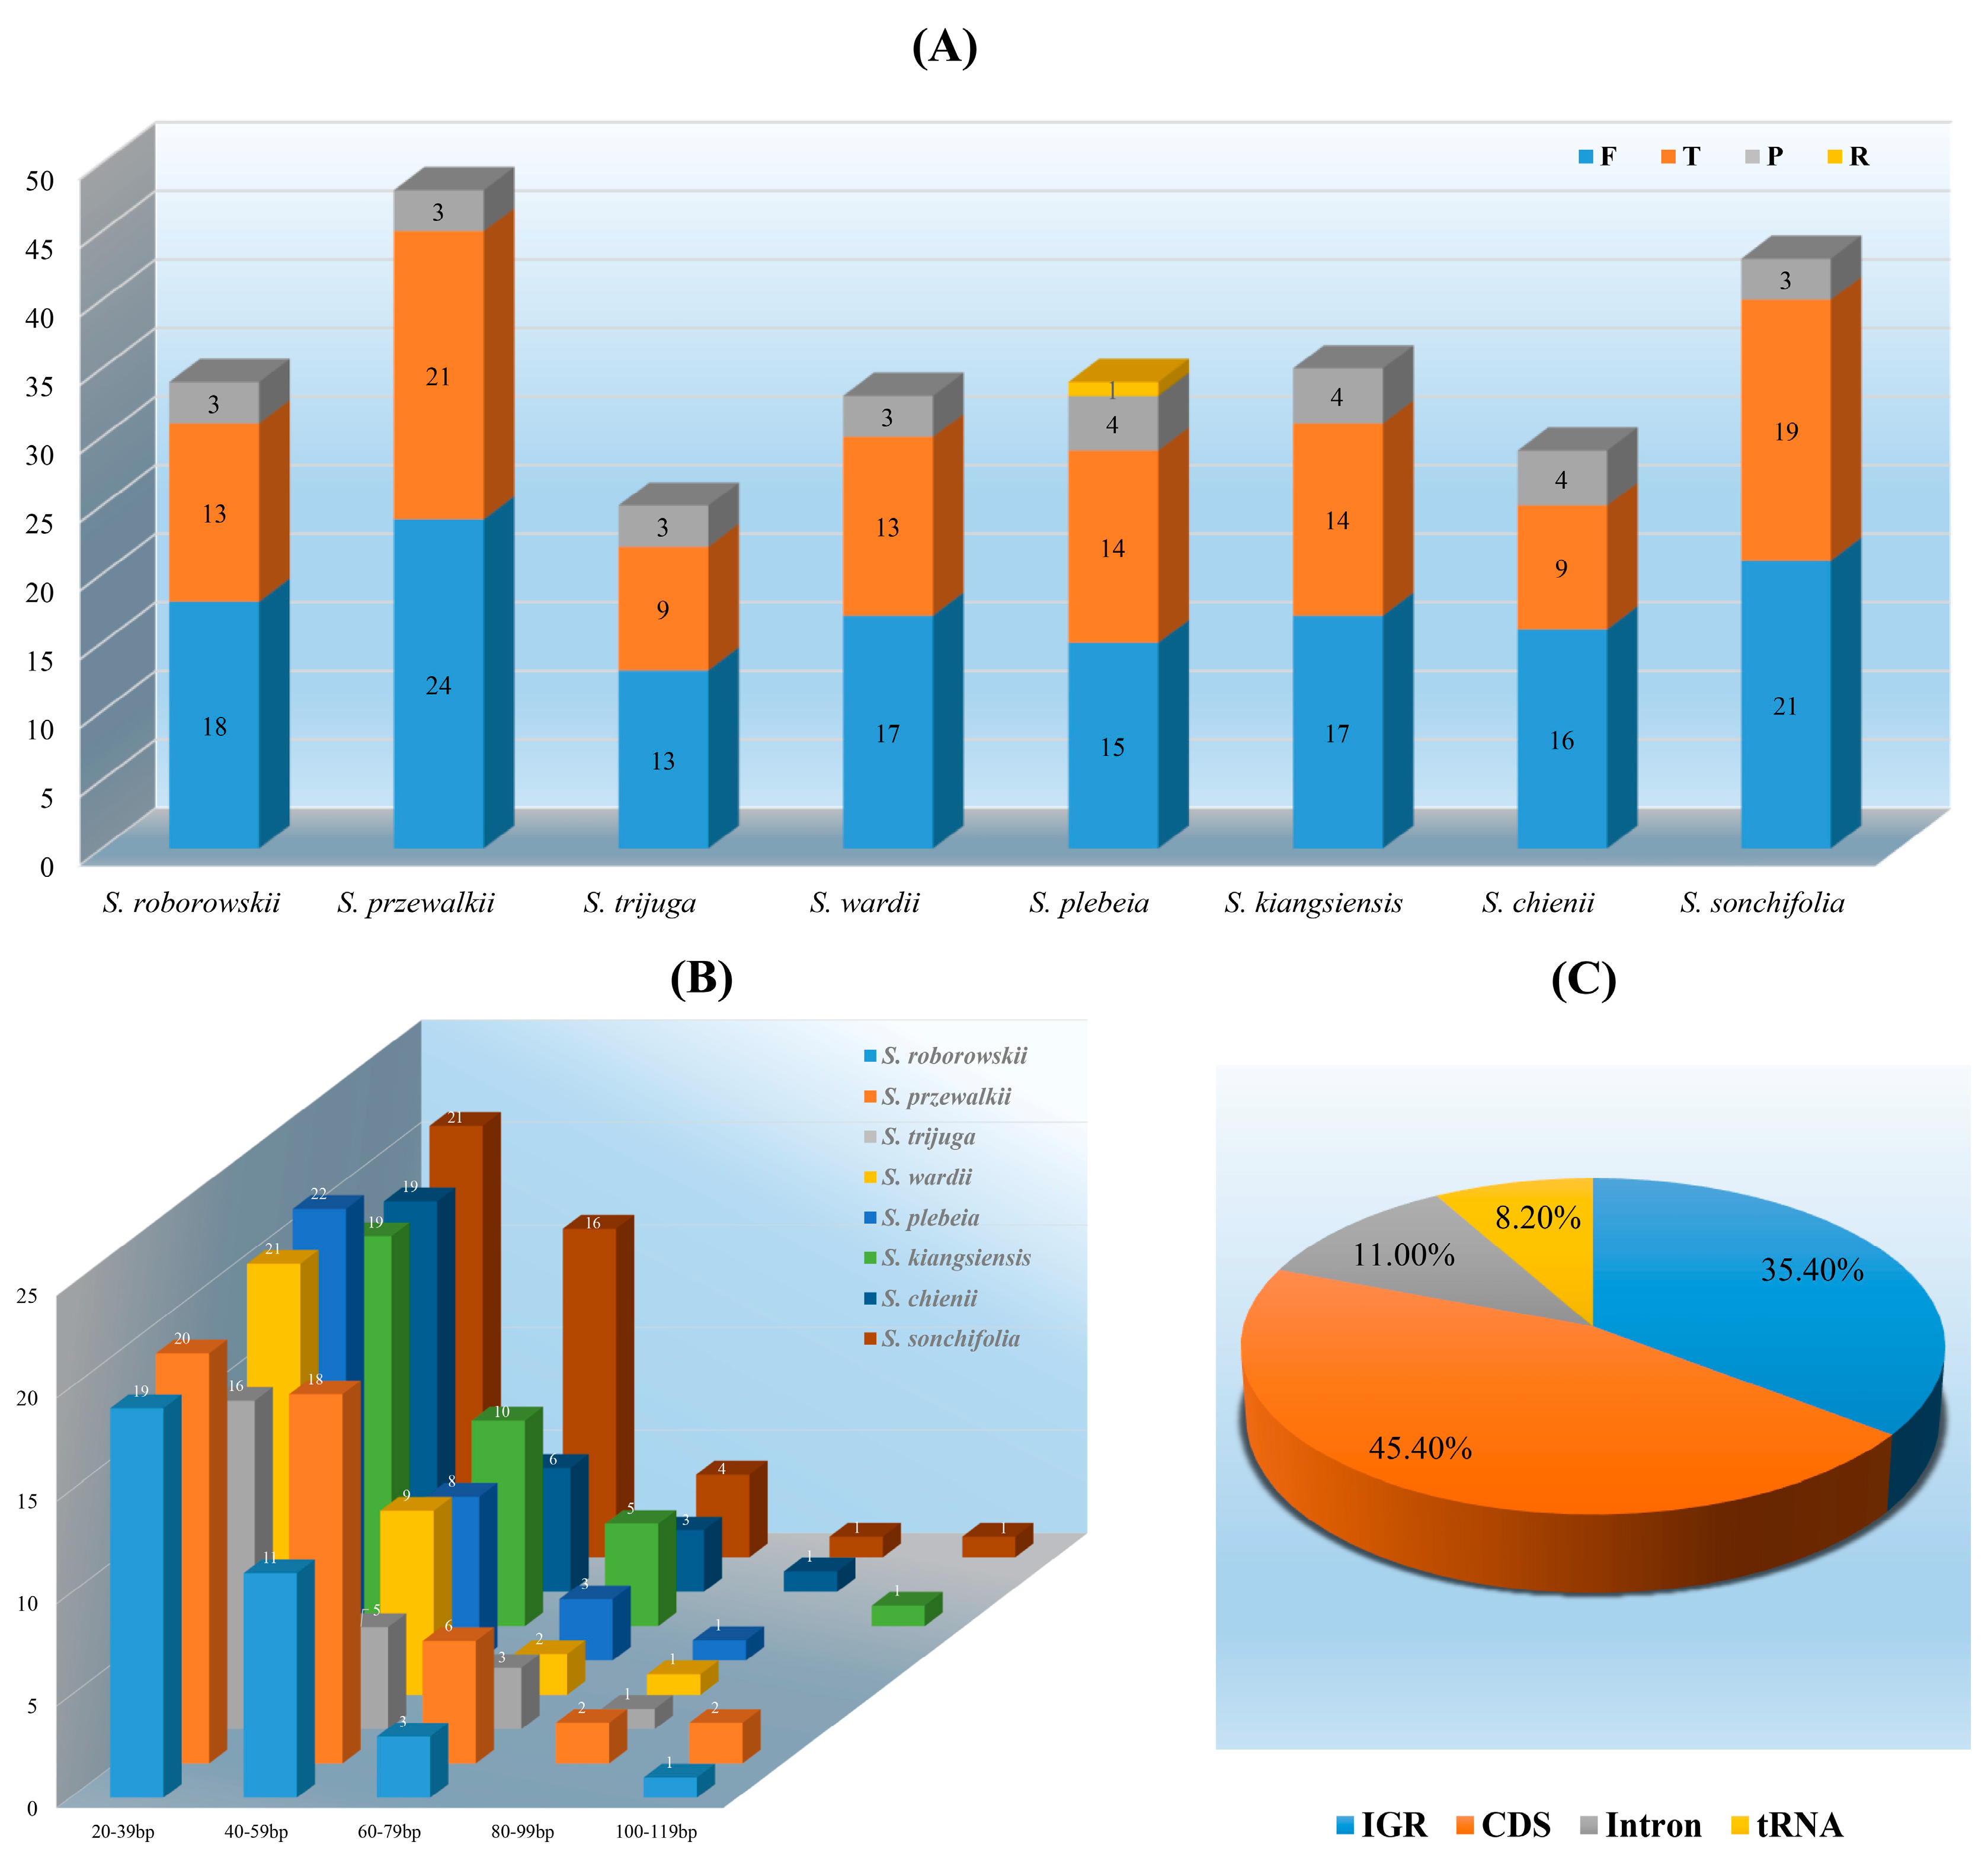
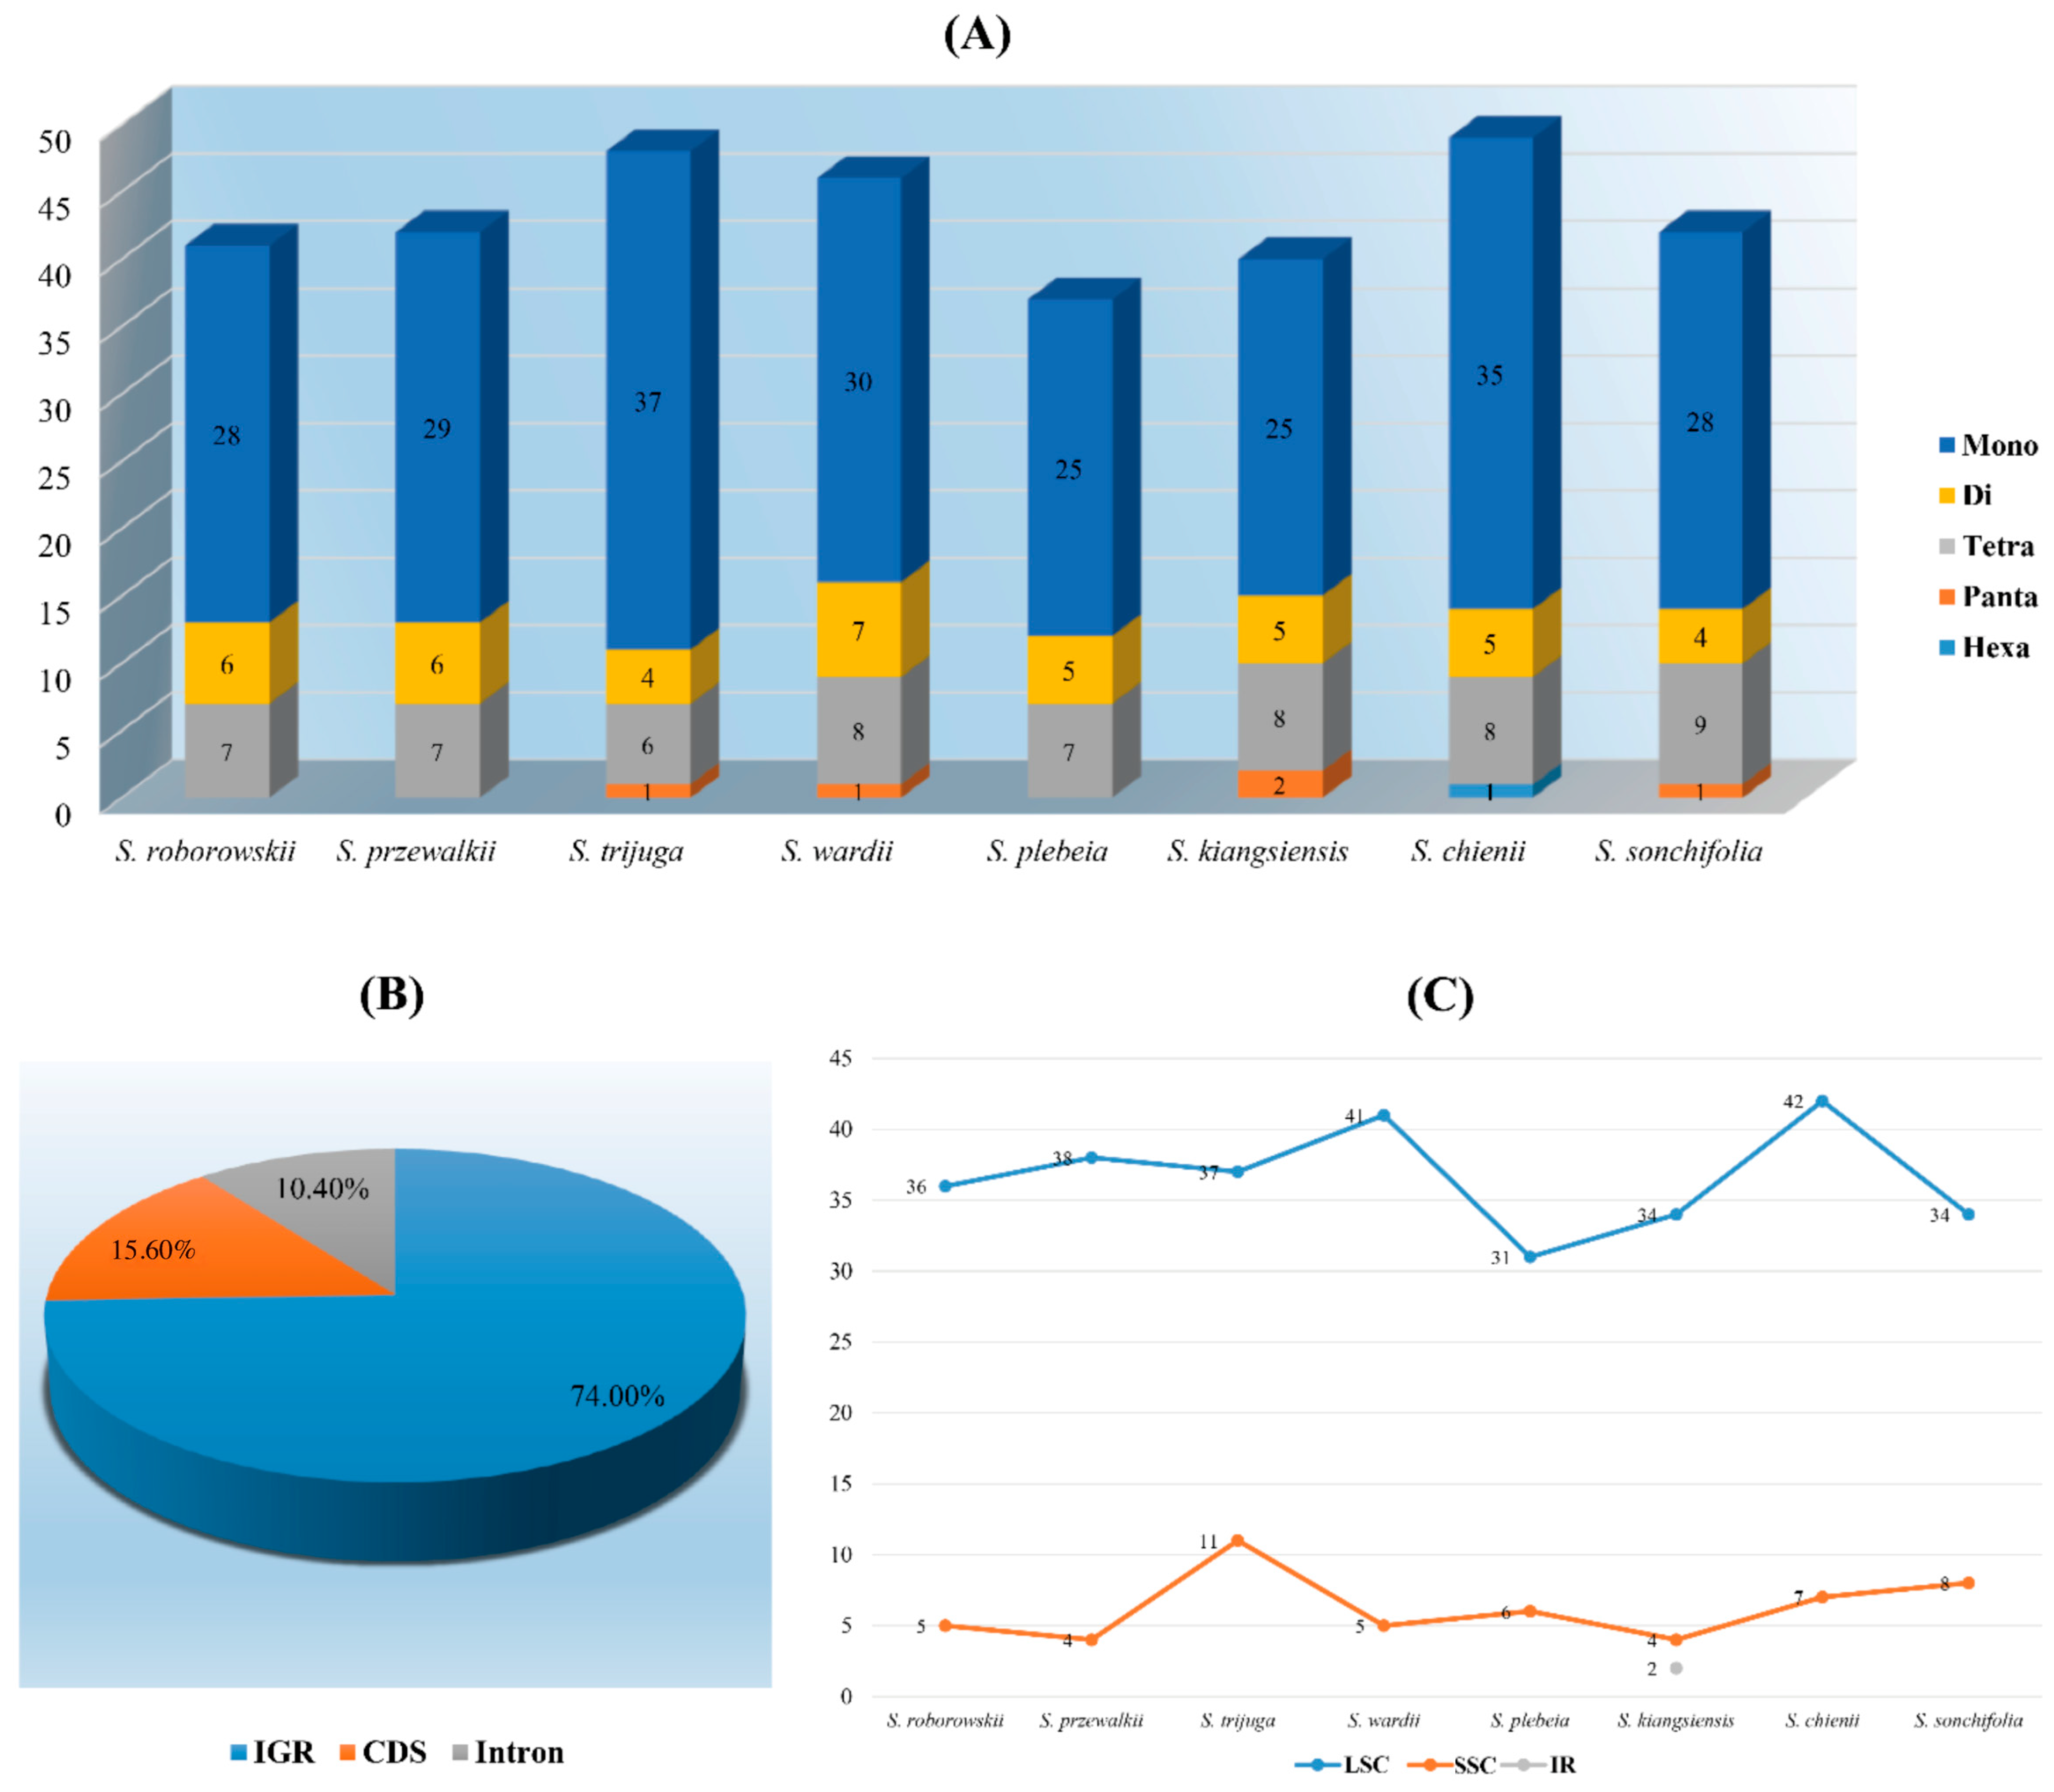
3.3. Long and Simple Sequence Repeats Analyses

Long sequence repeats (LSRs) play a critical role in chloroplast genome evolution contributing to structural rearrangements, genome expansion, and recombination events. [32]. Across the eight Salvia species examined, a total of 281 LSRs were identified including 141 forward repeats, 27 palindromic repeats, 112 tandem repeats, and one reverse repeat. S. przewalskii contained the highest number of repeats (48), while S. trijuga had the fewest (25) (Figure 3A). The majority of LSRs (85.4%) were shorter than 60 bp, while repeats longer than 100 bp accounted for only 1.8% (Figure 3B). Regionally, LSRs were predominantly located in protein-coding regions (CDS; 45.4%), followed by intergenic regions (IGR; 35.4%) and intron regions (8.2%) (Figure 3C). Shared repeat sequences were identified in various genomic regions, including IGR (rps12-trnV-GAC and rrn4.5-rrn5), tRNA genes (trnG-GCC, trnG-GGA, trnS-GC, and trnS-GGA), the ndhA intron, and coding regions (ycf1 and ycf2) (Table 4). Most of these repeats were forward or tandem types and are likely involved in maintaining chloroplast genome structure and facilitating evolutionary conservation.
In addition to LSRs, simple sequence repeats (SSRs), also known as microsatellites, were analyzed for their potential utility as genetic markers. Across the eight Salvia species examined, a total of 345 SSRs were identified, with the number ranging from 37 in S. plebeia to 49 in S. chienii. Mononucleotide repeats dominated the SSR profiles (>68.7%), with counts ranging from 25 to 37 (Figure 4A). The majority of mononucleotide repeats were polyadenine (polyA) and polythymine (polyT), making up 42.2% and 56.1%, respectively, while ployguanine (polyG) or polycytosine (polyC) repeats were relatively rare. Hexanucleotide repeats were only detected in S. chienii, and no trinucleotide repeats were observed in any species. The majority of SSRs were located in intergenic regions (IGR, 74.0%), followed by protein-coding regions (CDS, 15.6%) and intron regions (10.4%) (Figure 4B). Regional distribution analysis revealed that the LSC region harbored the highest proportion of SSRs (84.9%), whereas the SSC and IR regions contained relatively fewer repeats (Figure 4C).

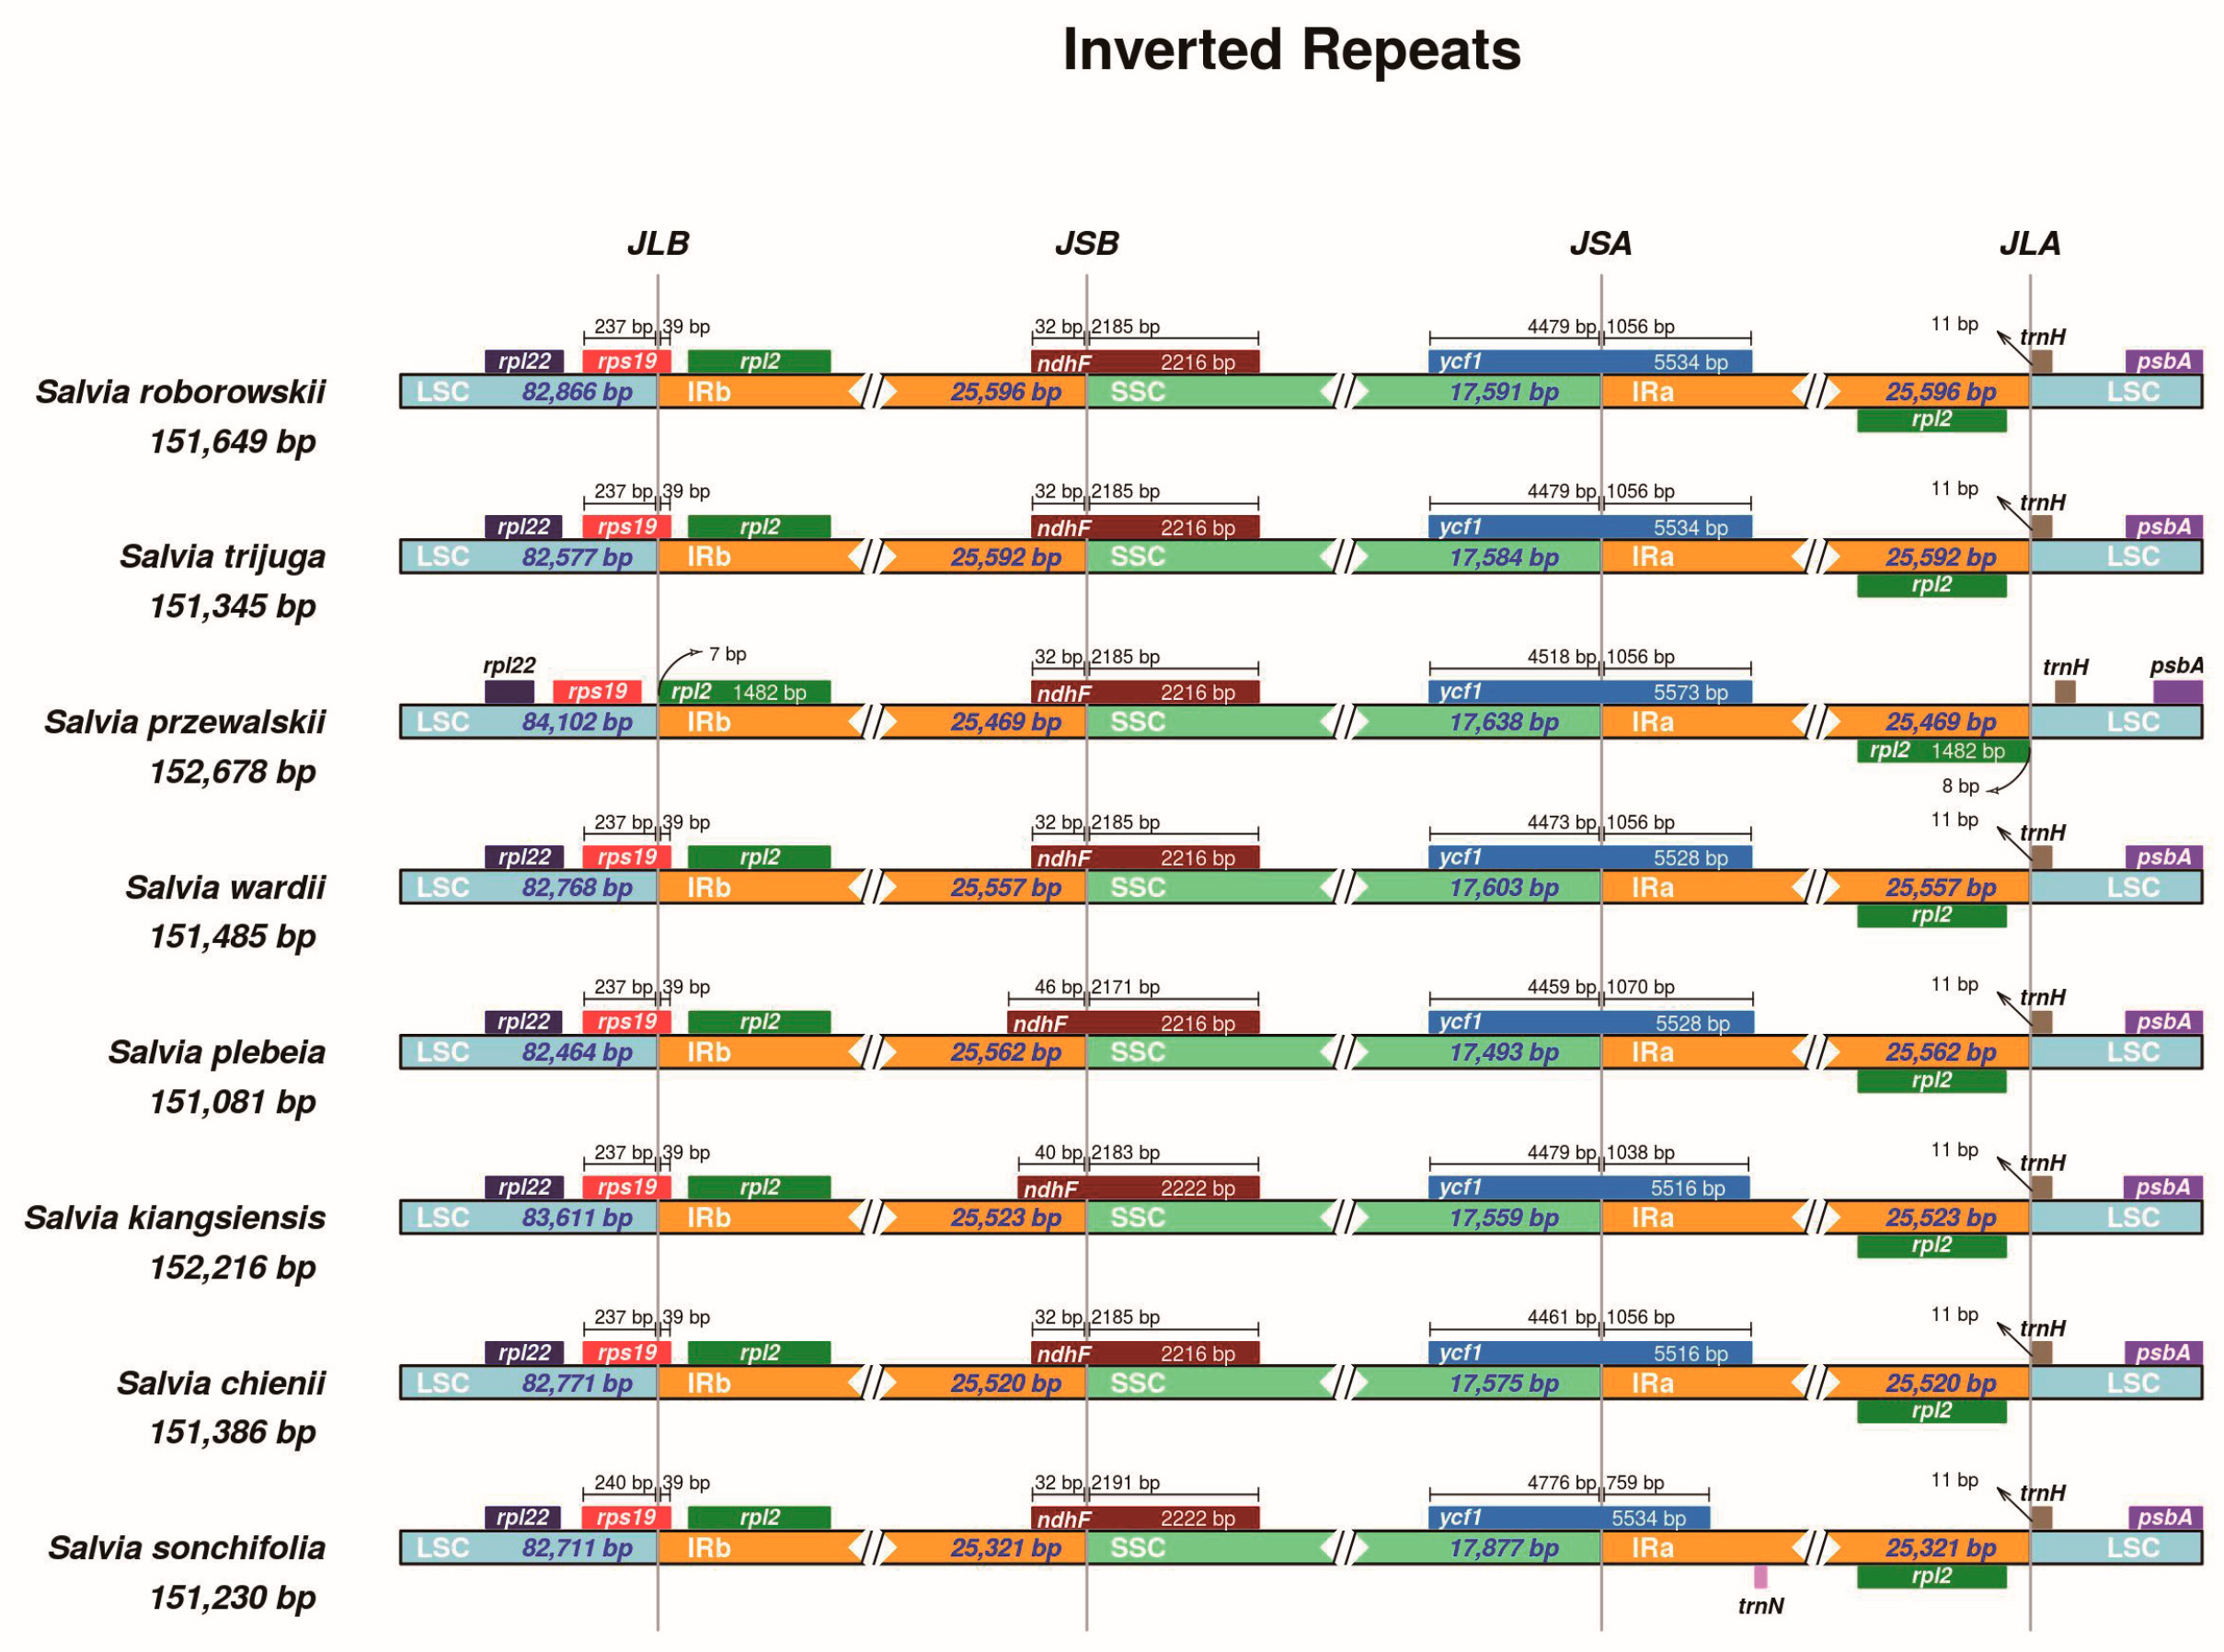
3.4. Inverted Repeat Expansion and Contraction

The expansion and contraction of inverted repeat (IR) regions are common evolutionary events in chloroplast genomes that contribute to variations in genome size and gene content. To investigate these structural changes, we compared the boundaries of the LSC, SSC, and IR regions across the eight Salvia species. The IR regions in all species were relatively conserved in length, ranging from 25,321 bp to 25,596 bp (Figure 5). Minor variations were observed in the positioning of several genes at the junctions. The rps19 gene spanned the LSC/IRb (JLB) boundary in all species except S. przewalskii, where it was entirely located in the LSC region. In most species, rps19 had approximately 237–240 bp in the LSC and extended 39 bp into the IRb, forming a partial duplication (ψrps19) at the IRa/LSC (JLA) junction. At the SSC/IRa (JSA) boundary, the ycf1 gene crossed into the IRa, resulting in a truncated pseudogene (ψycf1) in the IRb region. The length of ψycf1 varied slightly among species, ranging from 1038 bp in S. kiangsiensis, 10,56 bp in S. roborowskii, S. przewalskii, S. trijuga, S. wardii, and S. chienii, to 1070 bp in S. plebeia, and was as short as 759 bp in S. sonchifolia. Similarly, the ndhF gene overlapped the IRb/SSC (JSB) boundary, with 32–46 bp extending into the IRb region and the remainder (2171–2191 bp) located in the SSC. The trnH-GUG gene, located near the IRa/LSC (JLA) junction, was positioned 11 bp away from the IR boundary in all species except S. przewalskii, indicating a subtle but unique boundary shift in this species.

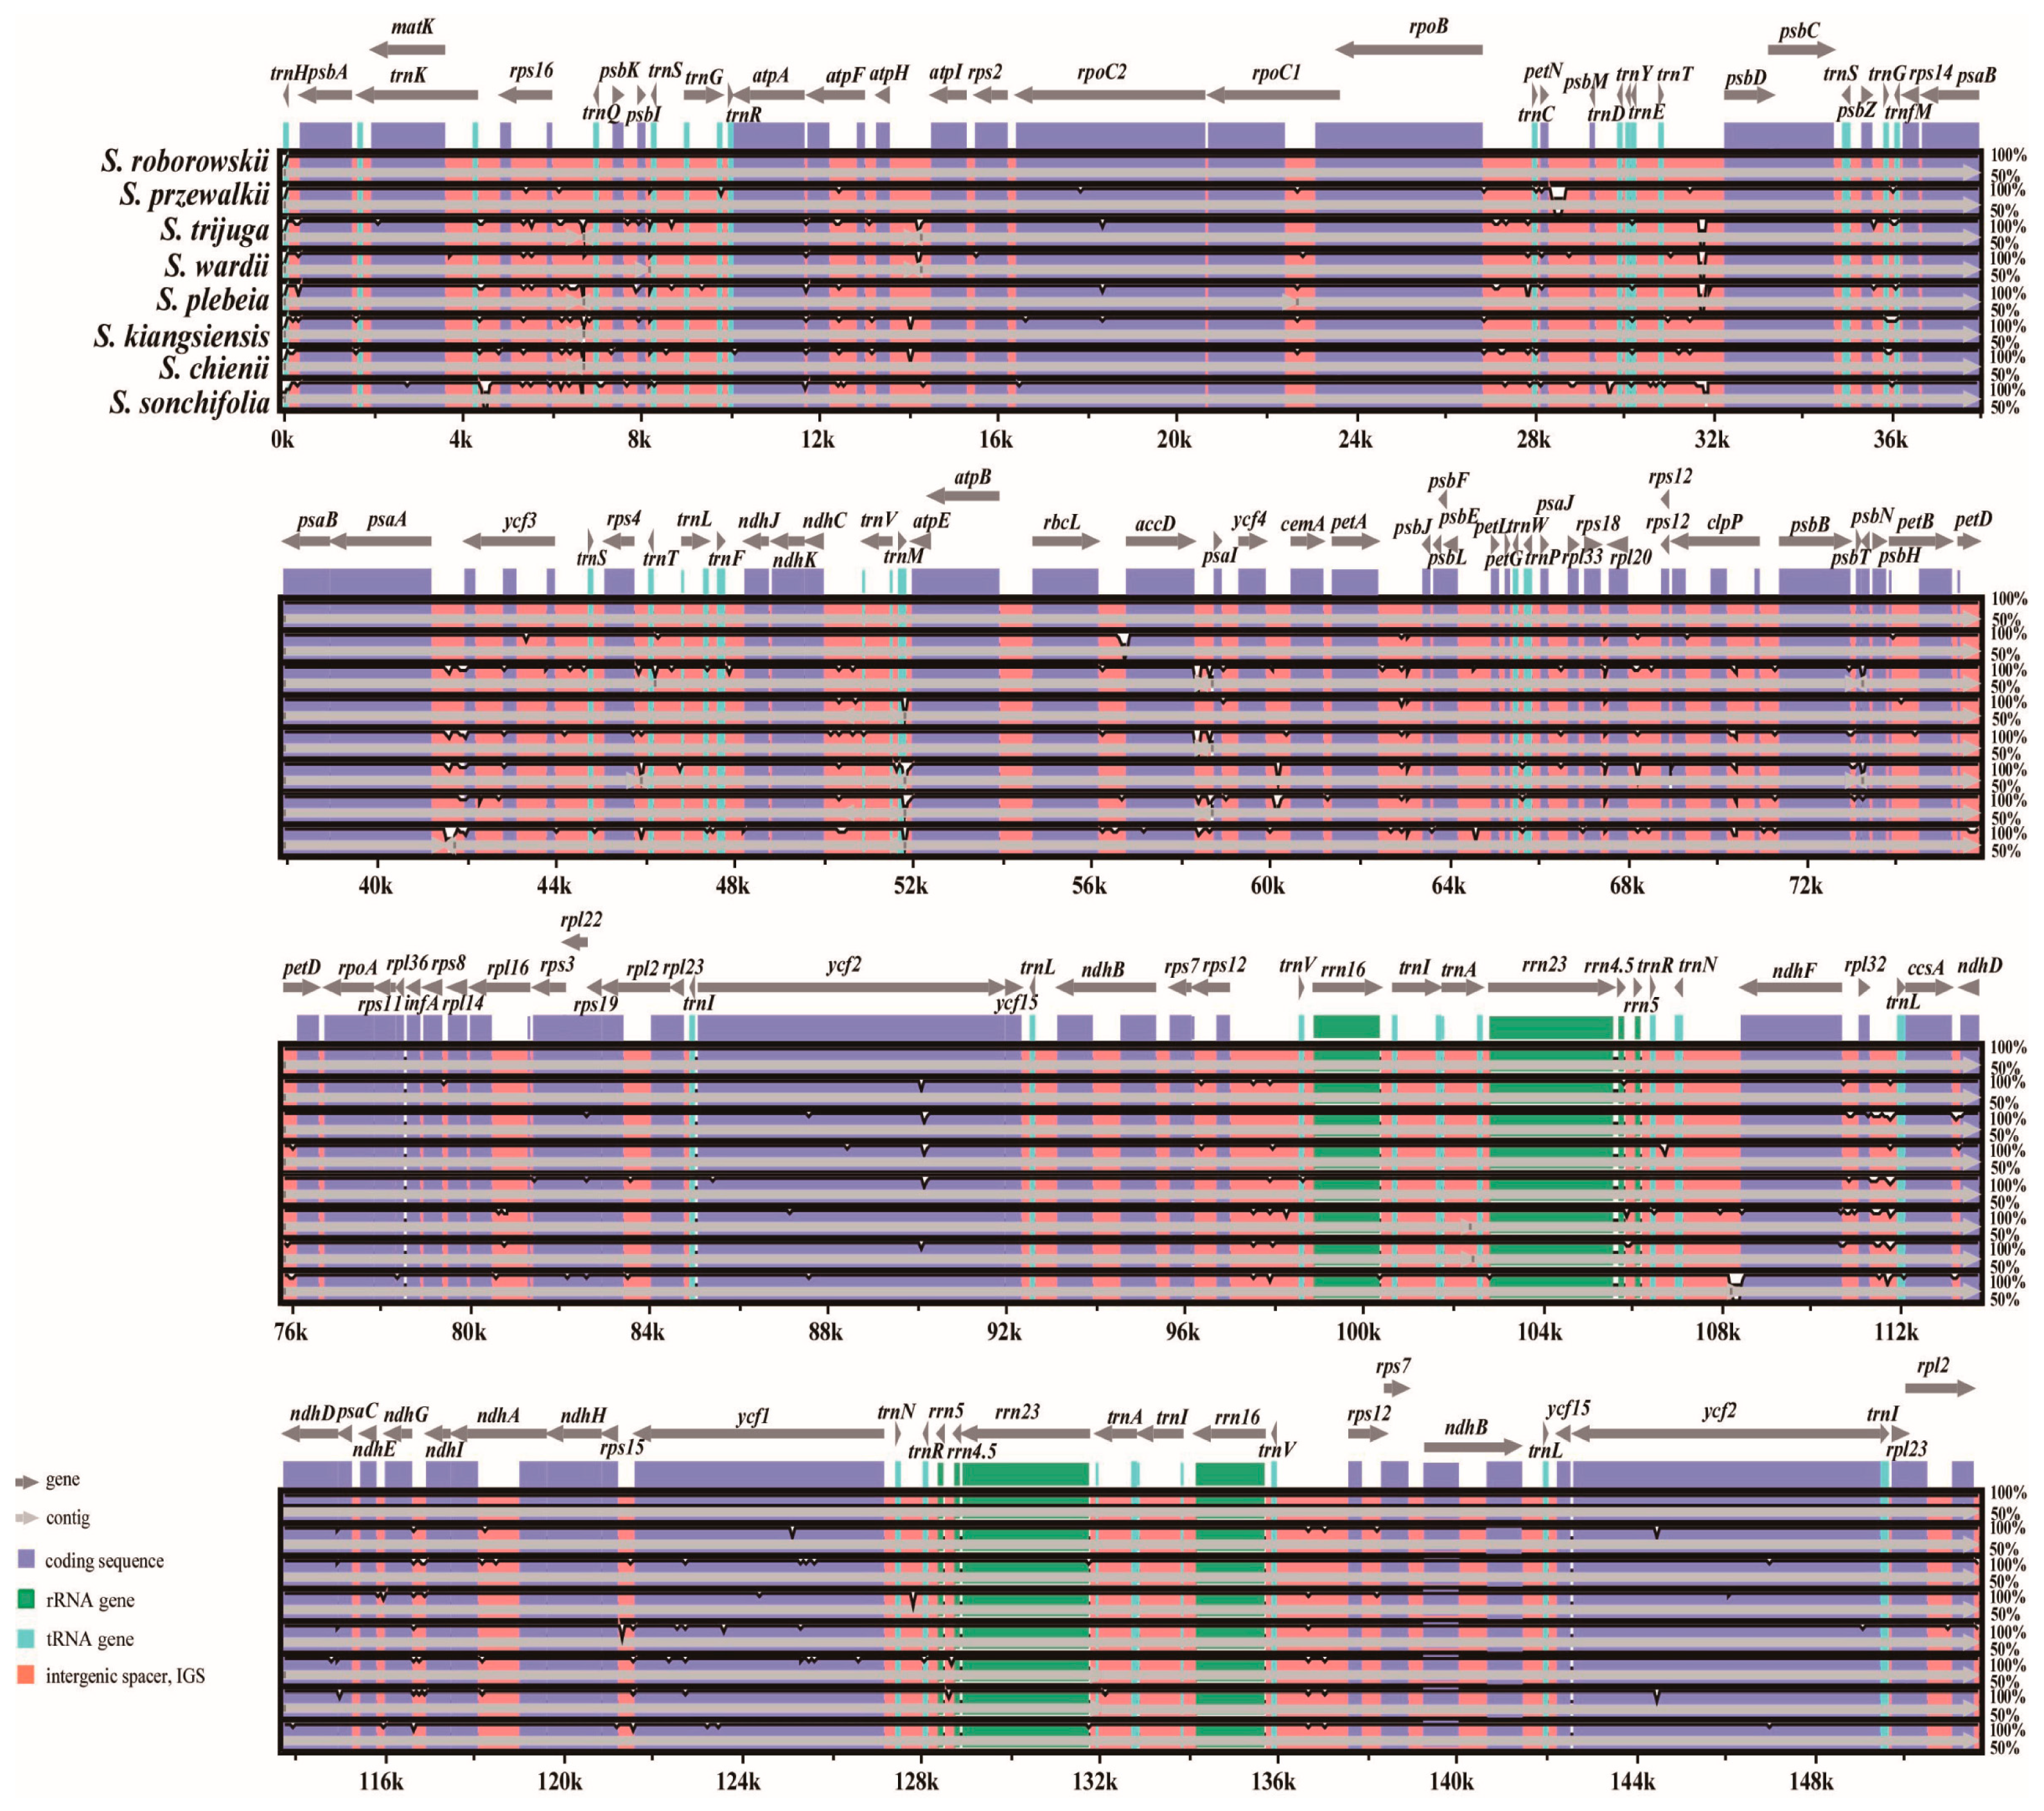
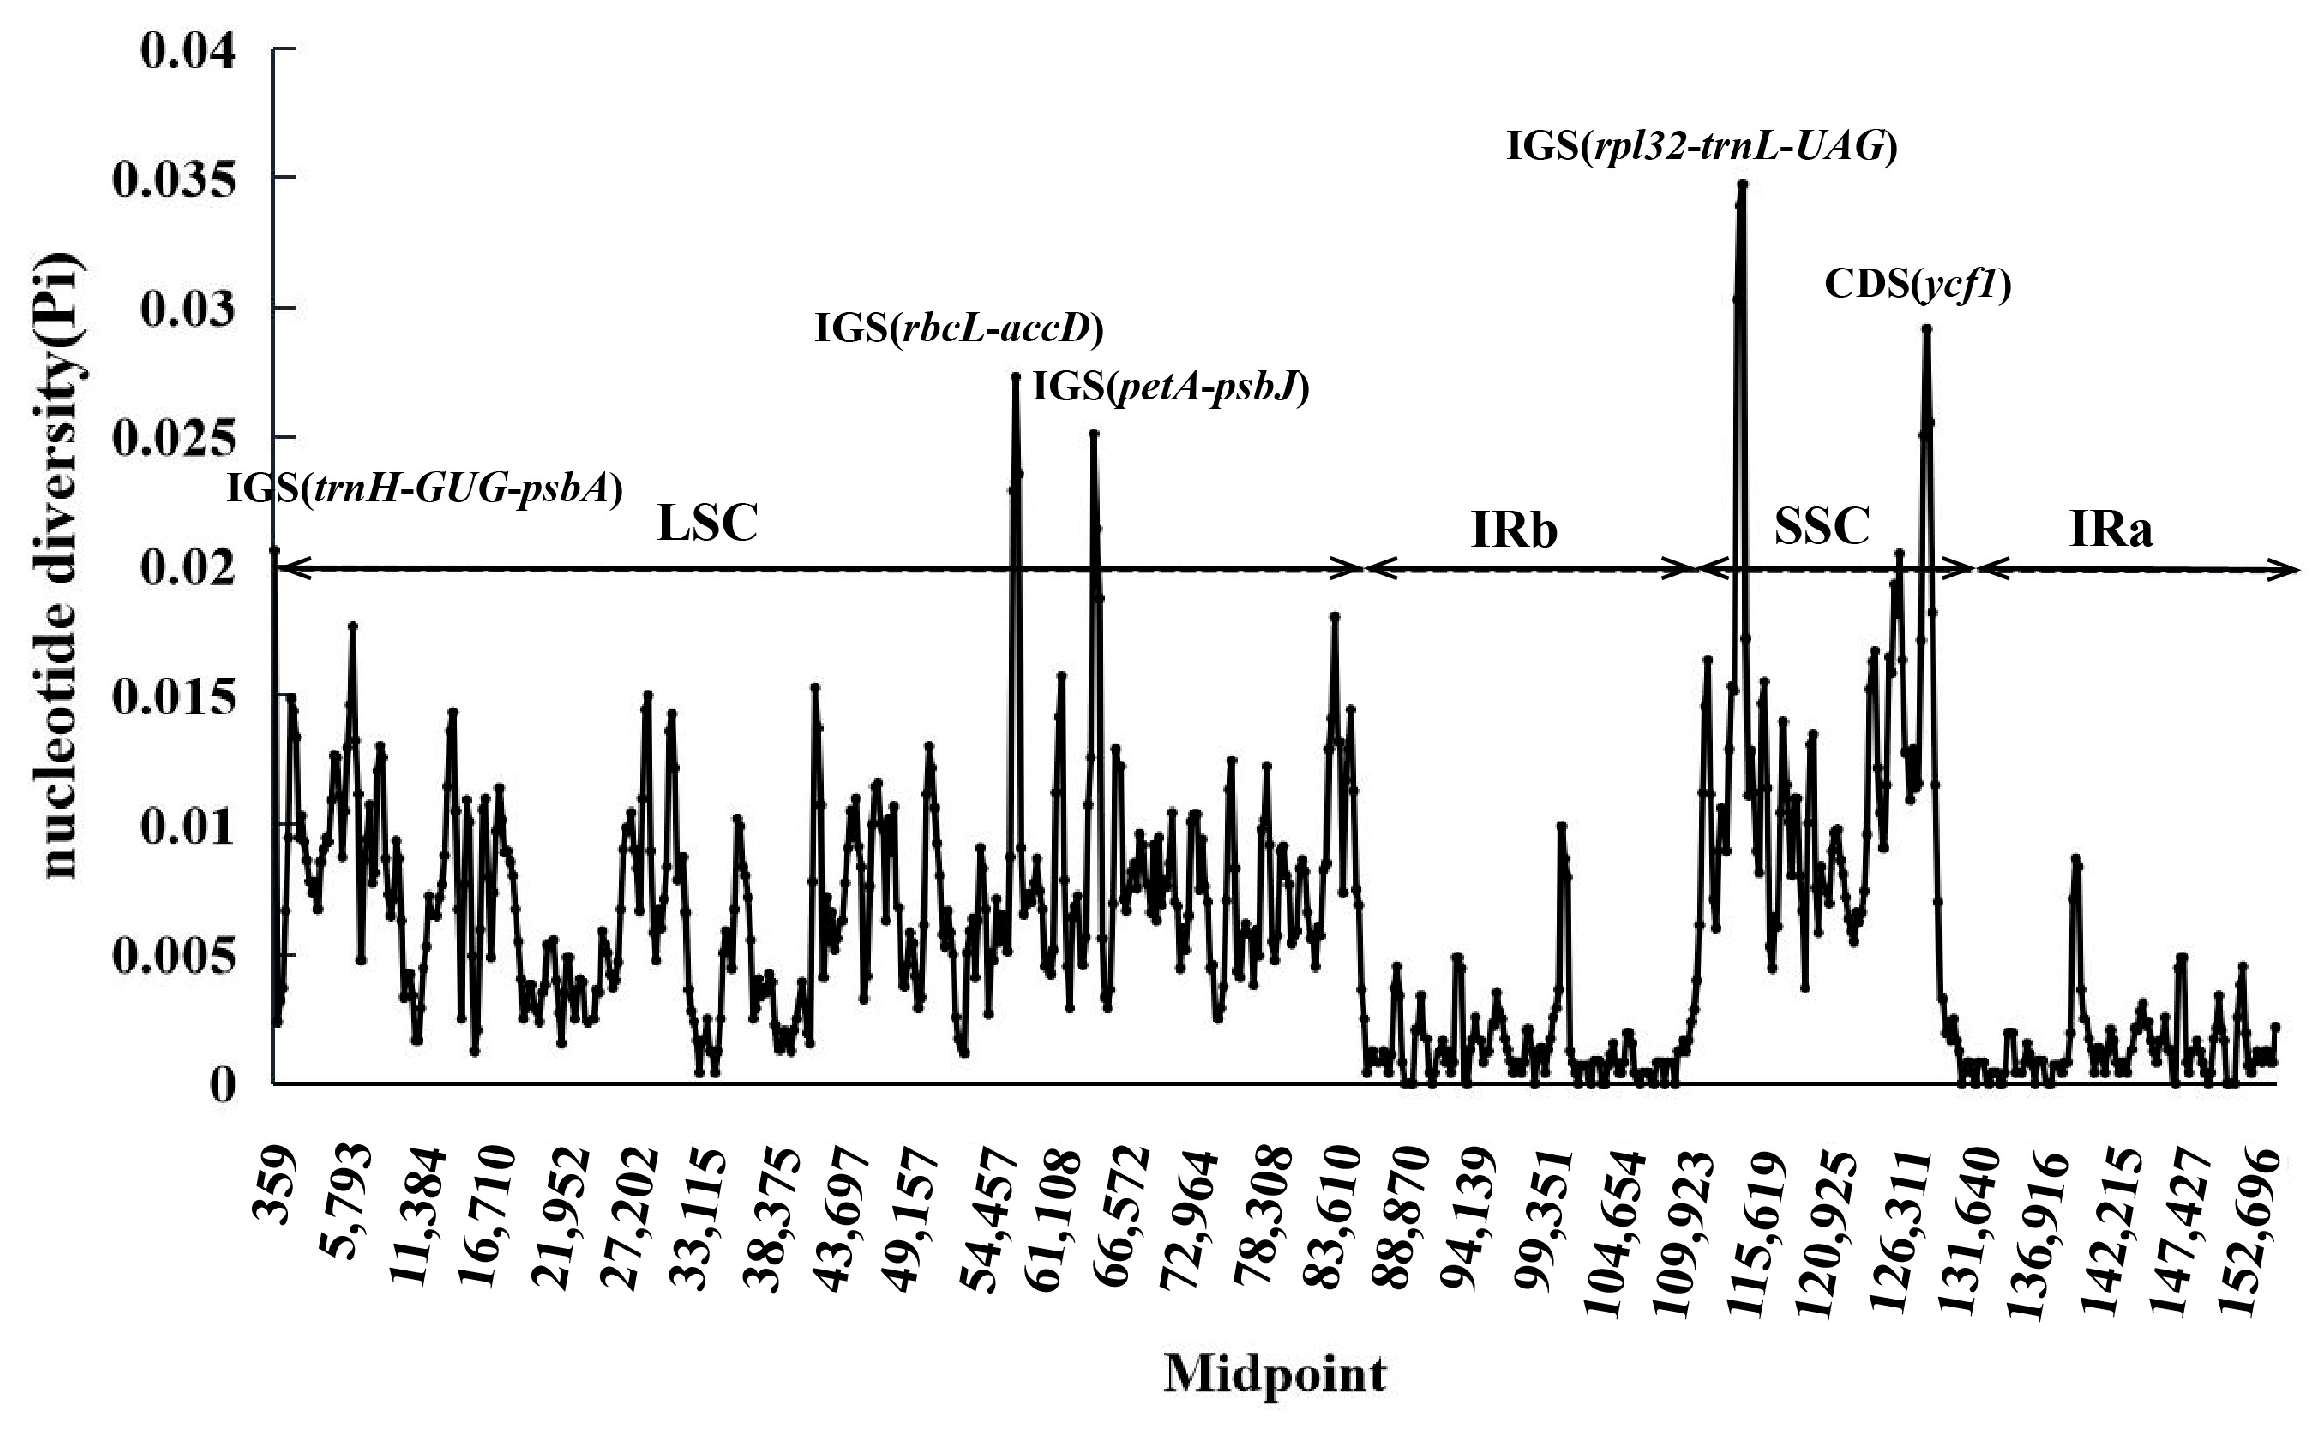
3.5. Comparative Chloroplast Genomic Analysis

To assess sequence divergence and structural conservation among the eight chloroplast genomes, a comparative analysis was performed using mVISTA with S. roborowskii as the reference (Figure 6). The results revealed a high degree of sequence similarity across the genomes. As expected, the inverted repeat (IR) regions were more conserved than the large single-copy (LSC) and small single-copy (SSC) regions. Additionally, non-coding regions displayed higher sequence variability than coding regions. Several highly variable regions were identified, primarily in intergenic regions (IGR), including trnH-psbA, rps16-trnQ, atpI-atpII, trnT-psbD, psaA-ycf3, accD-psaI, petA-psbJ, rpl32-trnL) as well as in the trnM gene region. To quantify sequence divergence, nucleotide diversity (Pi) values were calculated using a sliding window analysis of DNA polymorphism (Figure 7). The Pi values ranged from 0 to 0.03476, with an overall average of 0.00589. Specifically, nucleotide diversity was highest in the SSC region (0.00369–0.03476; mean = 0.01219), followed by the LSC region (0.00042–0.02732; mean = 0.00727), and lowest in the IR regions (0–0.00994; mean = 0.00149). Five hypervariable loci with Pi values greater than 0.025 were identified: trnH-psbA (0.0256), rbcL-accD (0.02732), petA-psbJ (0.02512), rpl32-trnL (0.03476), and ycf1 (0.02917). Three of these loci were located in the LSC region and two in the SSC, while no highly variable loci were detected in the IR regions, reflecting their structural stability.

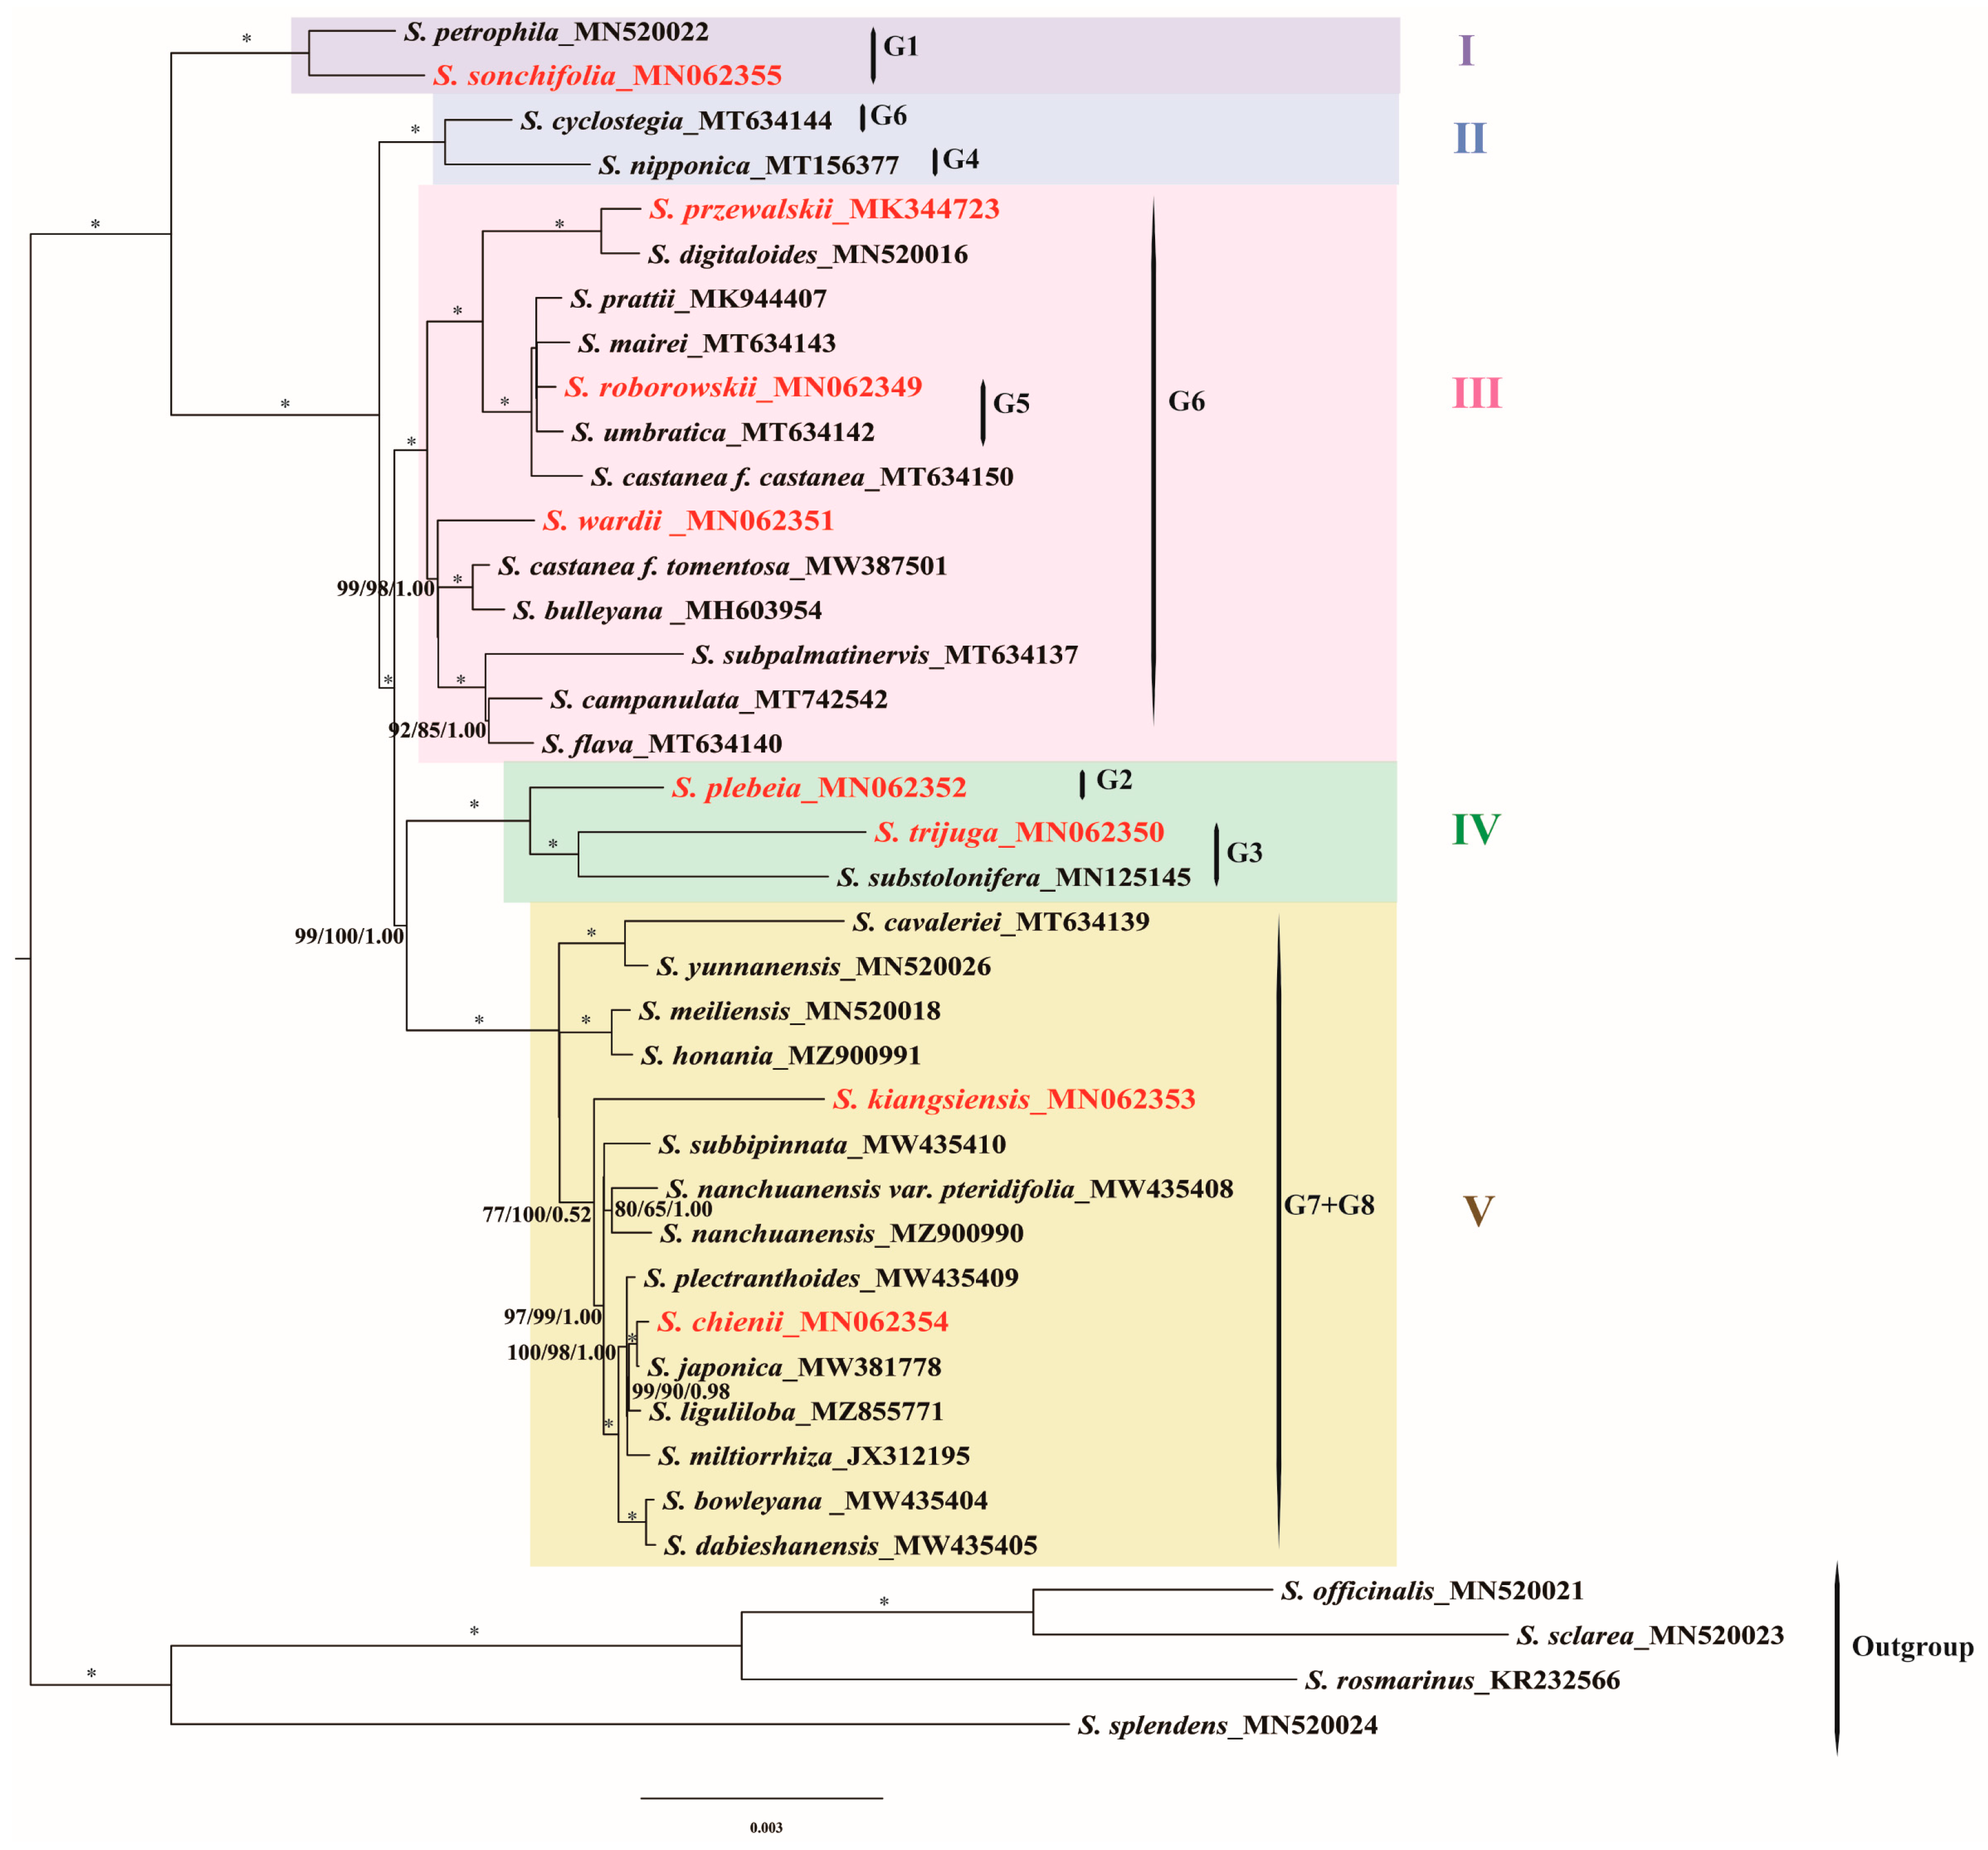
3.6. Phylogenetic Analyses

The phylogenetic relationships among East Asian Salvia species were reconstructed based on complete chloroplast genome sequences using three inference methods: Maximum Parsimony (MP), Maximum Likelihood (ML), and Bayesian Inference (BI). All three methods produced highly congruent topologies with strong statistical support at most nodes. The analyses confirmed the monophyly of East Asian Salvia (MLBS = 100%; PP = 1.00; MPBS = 100%) and resolved them into five strongly supported clades (Clades I–V), reflecting distinct evolutionary lineages within the genus (Figure 8). Clade I comprised S. petrophila and S. sonchifolia, representing a basal lineage sister to the remaining East Asian Salvia. These species are limestone endemics sharing unique staminal structures, and S. sonchifolia notably retains the ancestral stamen type (Type A) within this group. Clade II contained S. cyclostegia (previously identified as the G6 subclade) and S. nipponica (previously identified as the G4 clade), grouped together with strong support (MLBS = 100%; PP = 1.00; MPBS = 100%). Both species belonged to the Subg. Salvia, sect. Eurysphace, and subsect. Perennes C. Y. Wu characterized by perennial habits, solitary stems, basal leaves, and corollas typically ranging from 1.5 to 5 cm in length. Clade III encompassed the majority of G6 subclade species (S. przewalskii, S. wardii, and so on), with two G5 subclade species (S. roborowskii and S. umbratica) nested within it, reflecting genetic divergence within the clade. Both S. roborowskii and S. umbratica were classified under the Subg. Salvia, sect. Eurysphace, and subsect. Annuae. They shared characteristics as annual or biennial plants, with stems that were typically much-branched. The leaves were almost entirely cauline and sagittate in shape. The lower portion of the corolla tube was cylindrical and extended beyond the calyx, bending upwards at nearly a right angle. Clade IV grouped S. plebeia (previously identified as the G2 subclade) with S. substolonifera and S. trijuga (previously identified as the G3 subclade), reflecting overlapping geographic distributions and potential evolutionary relationships. Their clustering supports hypotheses of interspecific hybridization and complex divergence in this region. Clade V, the largest and most diverse, included all species from the G7 and G8 subclades (S. kiangsiensis, S. chinenis, S. plectranthoides, and so on). Neither G7 nor G8 formed monophyletic groups independently, but together they represented a distinct clade with high statistical support.

4. Discussion

4.1. Size and Structure of Chloroplast Genomes

The chloroplast genomes of the eight Salvia species examined displayed a typical quadripartite structure, consisting of a large single-copy (LSC) region, a small single-copy (SSC) region, and two inverted repeat (IR) regions. These structural features are consistent with the typical configuration seen in angiosperms and closely align with the average size of land plant chloroplast genomes (151 kb) [1,32]. The GC content ranged from 37.9% to 38.1%, slightly exceeding the average GC content (36.3%) reported in land plant chloroplast genomes [33]. This elevated GC content may enhance genome stability, as GC pairs form three hydrogen bonds (versus two in AT pairs), conferring greater resistance to thermal denaturation and environmental stress [34]. Notably, GC content varied significantly across regions, with the IR region displaying the highest values, likely due to the presence of rRNA genes with reduced AT nucleotide frequency [35,36].
The gene composition, arrangement, and quantity identified within the examined Salvia species exhibited a high degree of similarity to the chloroplast genome patterns commonly observed in most angiosperms, as reported in previous studies [37,38]. All eight Salvia species examined contained 114 unique chloroplast genes, with no losses in gene content or intron sequences, in agreement with findings in previous studies on other Salvia species [16,39,40]. Notably, certain genes, such as ycf15, have been reported as absent in Salvia species like S. hispanica, S. tiliifolia, and S. chanryoenica, while rpl32 was found to be absent in S. splendens [41]. However, these gene absences were not observed in the eight species of East Asian Salvia examined, suggesting potential regional variability in chloroplast gene content. Further investigation is needed to explore the functional and evolutionary roles of the ycf15 and rpl32 genes in Salvia.

4.2. Codon Usage Bias

Codon usage analysis of eight Salvia chloroplast genomes revealed a pronounced bias toward A/T-ending codons, in line with the generally AT-rich composition of angiosperm chloroplast genomes [42]. This codon preference was consistent across all species examined, reflecting both evolutionary constraints and potential adaptive roles in chloroplast genome evolution. Notably, a high frequency of A/T-ending codons at the third codon position was observed, particularly for amino acids such as leucine (e.g., UUA and UUG), suggesting a selective advantage for translational efficiency and genome stability, likely shaped by the combined effects of mutation pressure and natural selection. Leucine emerged as the most abundant amino acid in all eight Salvia species, while cysteine was the least abundant. Such trends are consistent with findings in other plant families, where codon usage bias not only reflects nucleotide composition but also correlates with protein translation demands. For instance, studies on Hevea Aublet and wax gourd chloroplast genomes similarly report an overrepresentation of A/T-ending codons, shaped by a balance of natural selection and mutation pressure to optimize translational accuracy and efficiency [43,44]. Minor interspecies variations, such as the slightly lower leucine codon frequency in S. sonchifolia, may indicate subtle adaptations to species-specific environmental or functional demands. Functionally, codon usage bias plays a crucial role in regulating the efficiency and accuracy of protein biosynthesis in chloroplasts. A/T-ending codons are generally associated with higher translational efficiency due to their compatibility with abundant chloroplast tRNA pools, which is especially important under environmental fluctuations that demand rapid protein turnover to maintain photosynthetic performance. Moreover, a bias toward A/T-ending codons can contribute to chloroplast genome stability by minimizing the formation of stable mRNA secondary structures, thus facilitating efficient transcription and translation processes. Comparative analyses in other plant lineages also suggest that codon usage differences can provide insights into evolutionary divergence and adaptation processes [45,46].

4.3. LSRs and SSRs Analyses

Long sequence repeats (LSRs) are vital for understanding genome organization, evolutionary dynamics, and structural variations in chloroplast genomes. The identification of 281 LSRs in the eight Salvia species, comprising forward, palindromic, tandem, and reverse repeats, highlights their functional diversity. The predominance of forward and tandem repeats is consistent with findings in other Salvia chloroplast genomes [47,48], where these repeats contribute significantly to genome rearrangement and mutation hotspots. Most LSRs (85.4%) were shorter than 60 bp, reflecting a preference for smaller repeats that promote recombination while minimizing the risk of deleterious genomic rearrangements. However, the presence of longer repeats (>100 bp, 1.8%) may contribute to structural variations such as inversions, duplications, and deletions, which can increase genome plasticity and provide a substrate for evolutionary innovation under environmental stress. The high concentration of repeats in coding sequences (45.4%) suggests their potential involvement in regulating gene expression, maintaining genome stability, and mediating structural variations within functional genes. Their localization in intergenic (35.4%) and intron regions (8.2%) further underscores their influence on non-coding DNA evolution and possible roles in regulating transcription and RNA splicing efficiency. Conserved repeats in regions such as rps12-trnV-GAC, the ndhA intron, and ycf2 likely play a stabilizing role in maintaining genome integrity and facilitating evolutionary conservation across species. Similar conserved repeat elements in Solanum and Mammillaria chloroplast genomes have been associated with genome stability and phylogenetic signal, acting as indicators of evolutionary processes and divergence history [49,50].
Simple sequence repeats (SSRs), or microsatellites, are critical molecular markers for population genetics, providing insights into genetic diversity, phylogenetic relationships, and genome evolution. In this study, 345 SSRs were identified across the chloroplast genomes of Salvia species, with the counts ranging from 37 in S. plebeia to 49 in S. chienii. Mononucleotide repeats, predominantly polyadenine (polyA) and polythymine (polyT), constituted the majority (>68.7%), reflecting the AT-rich nature of chloroplast genomes, a trend widely observed in angiosperms [51,52]. Hexanucleotide repeats were rare and detected only in S. chienii, while trinucleotide repeats were absent in all species, highlighting species-specific SSR patterns. The concentration of most SSRs in intergenic regions (74.0%) aligns with their role in non-coding DNA evolution, potentially affecting regulatory sequences and contributing to genome size variation. SSR loci were predominantly localized in the large single-copy (LSC) region, consistent with observations in Actinidiaceae and Hamamelidaceae, where SSRs serve as evolutionary hotspots and valuable molecular markers for species delimitation, phylogeography, and chloroplast genome structural evolution [53,54].

4.4. Inverted Repeat Expansion and Contraction

The expansion and contraction of inverted repeat (IR) boundaries play a pivotal role in the evolution and structural diversity of chloroplast genomes, often resulting in genome rearrangements and gene duplications, or pseudogenization. In Salvia, the boundaries of the LSC, SSC, and IR regions exhibit minor expansions and contractions, with conserved features such as the pseudogenization of rps19 and ycf1. These findings align with studies in Ligusticum L. and Primulina Hance, which reported similar dynamics at IR boundaries, indicating the conservation of such features across angiosperms [55,56]. The overlap between ψycf1 and ndhF and the stable positioning of trnH-GUG suggest functional constraints that preserve chloroplast genome integrity. Comparative analyses reveal that variations in IR boundaries, such as those observed in Ficus and Paeoniaceae, are often linked to adaptation to environmental or evolutionary pressures, underscoring their phylogenetic significance [57,58]. The conserved yet flexible nature of IR boundaries in Salvia highlights their dual role in maintaining genomic stability while accommodating evolutionary diversification, offering robust markers for phylogenetic studies.

4.5. Sequence Divergence and Hypervariable Regions

The comparative analysis of chloroplast genomes in eight Salvia species underscores the conserved nature of these genomes while also revealing regions of significant polymorphism that offer insights into evolutionary and phylogenetic dynamics. Consistent with previous studies, our findings confirm that inverted repeat (IR) regions exhibit greater conservation compared to large single-copy (LSC) and small single-copy (SSC) regions, likely due to their structural stability and lower mutation rates [59,60]. The higher variability observed in non-coding regions, particularly in intergenic regions such as trnH -psbA, rbcL-accD, petA-psbJ, and rpl32-trnL, aligns with studies on other angiosperms that highlight these regions as hotspots for sequence divergence and potential molecular marker development [61,62]. Our sliding window analysis revealed average nucleotide diversity (Pi) values comparable to those reported in related genera, further substantiating the utility of Pi analysis in pinpointing mutation hotspots for taxonomic resolution [63].
Of particular interest are the loci ycf1 and the identified intergenic regions, which exhibited Pi values exceeding 0.025, making them prime candidates for barcoding and phylogenetic studies. These loci have been similarly identified in other plant lineages, where they have proven effective in species-level discrimination [64]. Functionally, hypervariable regions may contribute to chloroplast genome adaptability by generating regulatory and coding sequence variation that facilitates responses to environmental pressures. Notably, the absence of significant polymorphism in IR regions corroborates findings in other dicot families [65], where single-copy regions typically harbor the majority of sequence variation. The identification of conserved and highly divergent loci provides a dual advantage: ensuring the stability of broader phylogenetic frameworks while enabling precise species differentiation. Thus, the five hotspots identified here not only advance our understanding of Salvia genomic evolution but also hold practical utility in taxonomic classification and evolutionary studies.

4.6. Phylogenetic Insights into East Asian Salvia

East Asian Salvia species have formally been classified under the subgenus Glutinaria, encompassing eight sections (G1–G8), based on molecular analysis (utilizing two nuclear ribosomal spacers and four plastid markers) and morphological investigations [13]. Our results confirm that subgenus Glutinaria represents a monophyletic group, strongly supported across three analytical methods. This finding aligns with a series of subsequent studies employing chloroplast genome data [15,16,32]. However, the phylogenetic relationships among the eight sections within subgenus Glutinaria remained unresolved. For instance, G1 was identified as the earliest-diverging lineage, followed by the independent divergence of G2. However, the relationships among G3, G4, G5, and G6 remained unclear, while G7 and G8 were identified as sister groups. Later studies identified divergent evolutionary patterns but suffered from limited sampling, representing only a subset of sections (e.g., G1, G4, G6, and G7 in 2020 [15]; G1, G6, G7, and G8 in 2021 [16]; G1, G4, and G6 in 2022 [66]). In this study, we sampled 39 species covering all eight sections of East Asian Salvia. The monophyly of G5, G6, and G7 was not supported. Specifically, two species within G5 (S. roborowskii and S. umbratica) did not cluster together but were embedded within the G6 clade. Similarly, S. cyclostegia (G6) and S. nipponica (G4) grouped together. Furthermore, three species from G8 were nested within the G7 clade. Monophyly was supported for G1, G3, and G8 but may reflect limited sampling (1–3 species per group).
The basal position of Sect. Sonchifoliae (Clade I) within subgenus Glutinaria was confirmed, consistent with previous studies [13,32]. This group shares similar leaf morphology and habitats. Notably, stamen type A is found exclusively in Salvia sonchifolia. The G2 clade (S. plebeia), which was identified as a distinct lineage in Hu et al., 2018, formed a sister group with G3 here (Clade IV), hinting at potential hybridization between these geographically overlapping species, causing discordance between plastid and nuclear phylogenies [13]. G4, G5, and G6 formed Clade II and Clade III; however, their phylogenetic relationships remain unresolved, suggesting that these groups have undergone a relatively complex evolutionary history. The close phylogenetic relationship between G7 and G8 was supported, forming Clade V, encompassing most species traditionally classified under the subgenera Allagospadonopsis and Sclarea [12]. The observed paraphyly (G7 and G8; G5, and G6) and unresolved relationships may reflect a shared evolutionary history possibly shaped by rapid divergence or recent secondary contact and hybridization. Incomplete lineage sorting remains a plausible explanation as well, especially considering the frequent morphological convergence and overlapping habitats among East Asian Salvia species. In summary, our findings suggest that the current sectional classification within East Asian Salvia does not fully reflect phylogenetic relationships, and targeted taxonomic revisions are necessary, particularly for G5, G6, G7, and G8. Future studies incorporating nuclear genomic data and morphological reassessment are essential to refine the classification of these groups.

5. Conclusions

This study presents a comprehensive comparative analysis of the complete chloroplast genomes of eight East Asian Salvia species, providing critical insights into their genetic structure, sequence diversity, and phylogenetic relationships. The chloroplast genomes exhibited a conserved quadripartite structure with genome sizes ranging from 151,081 to 152,678 bp and GC contents from 37.9% to 38.1%. A total of 114 unique genes were consistently identified across all species, reflecting the genomic stability within the genus. Codon usage analysis revealed a pronounced bias toward A/U-ending codons, with leucine as the most frequently encoded amino acid, in line with patterns observed in other angiosperm plastomes. The identification of abundant LSRs and SSRs, predominantly located in non-coding regions, provides a rich resource for developing molecular markers and studying population genetics. Comparative analyses revealed five highly variable regions (trnH-psbA, rbcL-accD, petA-psbJ, rpl32-trnL, and ycf1), which hold promise as candidate barcodes and molecular markers for phylogenetic, taxonomic, and conservation studies. The phylogenetic analyses supported the monophyly of East Asian Salvia, resolving five well-supported clades and confirming the basal position of Sect. Sonchifoliae. However, the paraphyly of G5 and G6 and the close relationship between G7 and G8 challenge existing morphological classifications and suggest a complex evolutionary history shaped by hybridization and incomplete lineage sorting. These findings enhance our understanding of chloroplast genome evolution and species relationships within Salvia, providing a robust framework for future taxonomic, phylogenetic, and ecological studies. Further research incorporating expanded sampling, nuclear genomic data, and transcriptomic analyses will be essential to fully resolve the evolutionary history of this diverse and economically important genus.

Supplementary Materials

The following supporting information can be downloaded at https://www.mdpi.com/article/10.3390/cimb47070493/s1.

Author Contributions

Resources, C.X.; data curation, Y.W. and J.L.; writing—original draft preparation, Y.D.; writing—review and editing, Y.L.; supervision, M.Y.; funding acquisition, Y.L. and M.Y. All authors have read and agreed to the published version of the manuscript.

Funding

This research was funded by Yunnan Fundamental Research Projects (202201AT070135); Inner Mongolia Autonomous Region Higher Education Research Projects (NJZY16214); and the Natural Science Foundation of Inner Mongolia (2025LHMS08077).

Institutional Review Board Statement

Not applicable.

Informed Consent Statement

Not applicable.

Data Availability Statement

The assembled chloroplast genomes of eight Salvia species were deposited in GenBank with the accession numbers of MN062354, MN062353, MN062352, MK344723, MN062349, MN062355, MN062350, MN062351.

Acknowledgments

We are grateful to all lab members for their suggestions, support, and encouragement.

Conflicts of Interest

The authors declare no conflicts of interest.

Abbreviations

The following abbreviations are used in this manuscript:
LSCLarge single-copy
SSCSmall single-copy
IRInverted repeat sequence
GCGuanine/cytosine content
PCGProtein-coding gene
SSRsSimple sequence repeats
LSRsLong sequence repeats
BIBayesian inference
MLMaximum likelihood
MPMaximum Parsimony
CPChloroplast
IGRIntergenic regions
PPPosterior probability

References

  1. Daniell, H.; Lin, C.S.; Yu, M.; Chang, W.J. Chloroplast genomes: Diversity, evolution, and applications in genetic engineering. Genome Biol. 2016, 17, 134–163. [Google Scholar] [CrossRef] [PubMed]
  2. Wicke, S.; Schneeweiss, G.M.; Depamphilis, C.W.; Müller, K.F.; Quandt, D. The evolution of the plastid chromosome in land plants: Gene content, gene order, gene function. Plant Mol. Biol. 2011, 76, 273–297. [Google Scholar] [CrossRef]
  3. Jansen, R.K.; Cai, Z.; Raubeson, L.A.; Daniell, H.; dePamphilis, C.W.; Leebens-Mack, J.; Müller, K.F.; Guisinger-Bellian, M.; Haberle, R.C.; Hansen, A.K.; et al. Analysis of 81 genes from 64 plastid genomes resolves relationships in angiosperms and identifies genome-scale evolutionary patterns. Proc. Natl. Acad. Sci. USA 2007, 104, 19369–19374. [Google Scholar] [CrossRef]
  4. Palmer, J.D.; Stein, D.B. Conservation of chloroplast genome structure among vascular plants. Curr. Genet. 1986, 10, 823–833. [Google Scholar] [CrossRef]
  5. Moore, M.J.; Dhingra, A.; Soltis, P.S.; Shaw, R.; Farmerie, W.G.; Folta, K.M.; Soltis, D.E. Rapid and accurate pyrosequencing of angiosperm plastid genomes for phylogenetic analyses. Am. J. Bot. 2010, 97, 1062–1078. [Google Scholar] [CrossRef]
  6. Walker, J.B.; Sytsma, K.J.; Treutlein, J.; Wink, M. Salvia (Lamiaceae) is not monophyletic: Implications for the systematics, radiation, and ecological specialization of Salvia and tribe Mentheae. Am. J. Bot. 2004, 91, 1115–1125. [Google Scholar] [CrossRef] [PubMed]
  7. Chen, W.; Bian, Z.; Zhang, Y.; Guo, Y. Danshen (Salvia miltiorrhiza Bunge): A prospective healing sage for cardiovascular diseases. Curr. Pharm. Des. 2017, 23, 512–520. [Google Scholar] [CrossRef]
  8. Zhumaliyeva, G.; Zhussupova, A.; Zhusupova, G.E.; Błońska-Sikora, E.; Cerreto, A.; Omirbekova, N.; Zhunusbayeva, Z.; Gemejiyeva, N.; Ramazanova, M.; Wrzosek, M.; et al. Natural compounds of Salvia L. genus and molecular mechanism of their biological activity. Biomedicines 2023, 11, 3151. [Google Scholar] [CrossRef]
  9. Uysal, I.; Mohammed, F.S.; Lekesiz, Ö.; Sevindik, E.; Özbas Gerçeker, F.; Sevindik, M. Pharmacological and nutritional properties: Genus Salvia. Adv. Pharmacol. Pharm. 2023, 11, 140–155. [Google Scholar] [CrossRef]
  10. Wu, C.Y. Salvia. In Flora Reipublicae Popularis Sinicae; Wu, C.Y., Ed.; Science Press: Beijing, China, 1977; Volume 66, pp. 70–196. [Google Scholar]
  11. Murata, G.; Yamazaki, T. Salvia. In Flora of Japan; Kodansha: Tokyo, Japan, 1993; Volume IIIa, pp. 302–307. [Google Scholar]
  12. Li, Q.; Li, M.; Yuan, Q.; Cui, Z.; Huang, L.; Xiao, P. Phylogenetic relationships of Salvia (Lamiaceae) in China: Evidence from DNA sequence datasets. J. Syst. Evol. 2013, 51, 184–195. [Google Scholar] [CrossRef]
  13. Hu, G.X.; Atsuko, T.; Drew, B.T.; Soltis, D.E.; Soltis, P.S.; Peng, H.; Xiang, C.L. Phylogeny and staminal evolution of Salvia (Lamiaceae, Nepetoideae) in East Asia. Ann. Bot. 2018, 122, 497–511. [Google Scholar] [CrossRef]
  14. Jenks, A.A.; Walker, J.B.; Kim, S.C. Phylogeny of New World Salvia subgenus Calosphace (Lamiaceae) based on cpDNA (psbA-trnH) and nrDNA (ITS) sequence data. J. Plant Res. 2013, 14, 483–496. [Google Scholar] [CrossRef] [PubMed]
  15. Zhao, F.; Drew, B.T.; Chen, Y.; Hu, G.; Li, B.; Xiang, C. The chloroplast genome of Salvia: Genomic characterization and phylogenetic analysis. Int. J. Plant Sci. 2020, 181, 812–830. [Google Scholar] [CrossRef]
  16. Wu, H.; Ma, P.F.; Li, H.T.; Hu, G.X.; Li, D.Z. Comparative plastomic analysis and insights into the phylogeny of Salvia (Lamiaceae). Plant Divers. 2021, 43, 15–26. [Google Scholar] [CrossRef]
  17. Doyle, J.J. A rapid DNA isolation procedure for small quantities of fresh leaf tissue. Phytochem. Bull. 1987, 19, 11–15. [Google Scholar]
  18. Jin, J.J.; Yu, W.B.; Yang, J.B.; Song, Y.; de Pamphilis, C.W.; Yi, T.S.; Li, D.Z. GetOrganelle: A fast and versatile toolkit for accurate de novo assembly of organelle genomes. Genome Biol. 2020, 21, 241–272. [Google Scholar] [CrossRef] [PubMed]
  19. Qu, X.J.; Moore, M.J.; Li, D.Z.; Yi T., S. PGA: A software package for rapid, accurate, and flexible batch annotation of plastomes. Plant Methods 2019, 15, 50–62. [Google Scholar] [CrossRef]
  20. Lowe, T.M.; Eddy, S.R. tRNAscan-SE: A program for improved detection of transfer RNA genes in genomic sequence. Nucleic. Acids Res. 1997, 25, 955–964. [Google Scholar] [CrossRef]
  21. Lohse, M.; Drechsel, O.; Kahlau, S.; Bock, R. OrganellarGenomeDRAW (OGDRAW): A suite of tools for generating physical maps of plastid and mitochondrial genomes and visualizing expression data sets. Nucleic. Acids Res. 2013, 41, W575–W581. [Google Scholar] [CrossRef]
  22. Kurtz, S.; Choudhuri, J.V.; Ohlebusch, E.; Schleiermacher, C.; Stoye, J.; Giegerich, R. REPuter: The manifold applications of repeat analysis on a genomic scale. Nucleic. Acids Res. 2001, 29, 4633_4642. [Google Scholar] [CrossRef]
  23. Benson, G. Tandem repeats finder: A program to analyze DNA sequences. Nucleic. Acids Res. 1999, 27, 573–580. [Google Scholar] [CrossRef]
  24. Beier, S.; Thiel, T.; Münch, T.; Scholz, U.; Mascher, M. MISA-web: A web server for microsatellite prediction. Bioinformatics 2017, 33, 2583–2585. [Google Scholar] [CrossRef] [PubMed]
  25. Frazer, K.A.; Pachter, L.; Poliakov, A.; Rubin, E.M.; Dubchak, I. VISTA: Computational tools for comparative genomics. Nucleic Acids Res. 2004, 32, W273–W279. [Google Scholar] [CrossRef]
  26. Hong, S.; Cheon, K.; Yoo, K.; Lee, H.; Cho, K.; Suh, J.; Kim, S.; Nam, J.; Sohn, H.; Kim, Y. Complete chloroplast genome sequences and comparative analysis of Chenopodium quinoa and C. album. Front. Plant Sci. 2017, 8, 1696–1708. [Google Scholar] [CrossRef]
  27. Librado, P.; Rozas, J. DnaSP v5: A software for comprehensive analysis of DNA polymorphism data. Bioinformatics 2009, 25, 1451–1452. [Google Scholar] [CrossRef] [PubMed]
  28. Swofford, D.L. PAUP*: Phylogenetic Analysis Using Parsimony (and Other Methods), Version 4.0b10; Sinauer Associates: Sunderland, MA, USA, 2002. [Google Scholar]
  29. Stamatakis, A. RAxML version 8: A tool for phylogenetic analysis and post-analysis of large phylogenies. Bioinformatics 2014, 30, 1312–1313. [Google Scholar] [CrossRef]
  30. Ronquist, F.; Teslenko, M.; van der Mark, P.; Ayres, D.L.; Darling, A.; Höhna, S.; Larget, B.; Liu, L.; Suchard, M.A.; Huelsenbeck, J.P. MrBayes 3.2: Efficient Bayesian phylogenetic inference and model choice across a large model space. Syst. Biol. 2012, 61, 539–542. [Google Scholar] [CrossRef] [PubMed]
  31. Hu, X.; Li, Y.; Meng, F.; Duan, Y.; Sun, M.; Yang, S.; Liu, H. Analysis of chloroplast genome characteristics and codon usage bias in 14 species of Annonaceae. Funct. Integr. Genom. 2024, 24, 109–127. [Google Scholar] [CrossRef]
  32. Yu, D.; Pei, Y.; Cui, N.; Zhao, G.P.; Hou, M.M.; Chen, Y.Y.; Li, X.W. Comparative and phylogenetic analysis of complete chloroplast genome sequences of Salvia regarding its worldwide distribution. Sci. Rep. 2023, 13, 14268–14282. [Google Scholar] [CrossRef]
  33. Guo, Y.Y.; Yang, J.X.; Li, H.K.; Zhao, H.S. Chloroplast genomes of two species of Cypripedium: Expanded genome size and proliferation of AT-biased repeat sequences. Front. Plant Sci. 2021, 12, 609729. [Google Scholar] [CrossRef]
  34. Gao, R.; Wang, W.; Huang, Q.; Fan, R.; Wang, X.; Feng, P.; Zhao, G.; Bian, S.; Ren, H.; Chang, Y. Complete chloroplast genome sequence of Dryopteris fragrans (L.) Schott and the repeat structures against the thermal environment. Sci. Rep. 2018, 8, 166351–166362. [Google Scholar] [CrossRef] [PubMed]
  35. Cao, Z.; Zhao, W.; Xin, Y.; Shen, W.; Wang, F.; Li, Q.; Tu, Y.; Zhang, H.; Dong, Z.; Xin, P. Characteristics of the complete chloroplast genome of Pourthiaea (Rosaceae) and its comparative analysis. Horticulturae 2022, 8, 1144. [Google Scholar] [CrossRef]
  36. Li, G.; Liu, G.; Liu, C. Comparative genomics of Eight complete chloroplast genomes of Phyllostachys species. Forests 2024, 15, 1785. [Google Scholar] [CrossRef]
  37. Hou, Z.; Wang, Z.S.; Zhang, J.G. The complete chloroplast genomic landscape and phylogenetic analyses of Populus alba L. J. For. Res. 2020, 31, 1875–1879. [Google Scholar] [CrossRef]
  38. Xiao, Y.; Zhang, W.; Sun, Y.; Li, Z.L.; Yu, J.J.; Zhang, C.Y.; Wang, S.Z. The complete chloroplast genome sequence of Rhododendron fortunei: Structural comparative and phylogenetic analysis in the Ericaceae family. Bot. Serbica 2023, 47, 279–290. [Google Scholar] [CrossRef]
  39. Qian, J.; Song, J.; Gao, H.; Zhu, Y.; Xu, J.; Pang, X.; Yao, H.; Sun, C.; Li, X.; Li, C.; et al. The Complete Chloroplast Genome Sequence of the Medicinal Plant Salvia miltiorrhiza. PLoS ONE 2013, 8, e57607. [Google Scholar] [CrossRef] [PubMed]
  40. Zhou, Y.; Zhang, H.; Ping, H.; Ding, Y.; Hu, S.; Bi, G.; Li, C.; Li, H.; Huang, Y.; Guo, L.; et al. Characterization of the complete chloroplast genome of Salvia leucantha (Lamiaceae). Mitochondrial DNA B Resour. 2021, 6, 3406–3408. [Google Scholar] [CrossRef]
  41. Du, Q.; Yang, H.; Zeng, J.; Chen, Z.; Zhou, J.; Sun, S.; Wang, B.; Liu, C. Comparative genomics and phylogenetic analysis of the chloroplast genomes in three medicinal Salvia species for bioexploration. Int. J. Mol. Sci. 2022, 23, 12080. [Google Scholar] [CrossRef]
  42. Zhang, J.; Feng, M. Analysis of the codon usage bias pattern in the chloroplast genomes of Chloranthus species (Chloranthaceae). Genes 2025, 16, 186. [Google Scholar] [CrossRef]
  43. Yang, Y.; Liu, X.; He, L.; Li, Z.; Yuan, B.; Fang, F.; Wang, M.; Li, A.; Liu, C.; He, M.; et al. Comparative chloroplast genomics and codon usage bias analysis in Hevea Genus. Genes 2025, 16, 201. [Google Scholar] [CrossRef]
  44. Song, W.; Chen, Z.; He, L.; Feng, Q.; Zhang, H.; Du, G.; Shi, C.; Wang, S. Comparative chloroplast genome analysis of wax gourd (Benincasa hispida) with three Benincaseae species, revealing evolutionary dynamic patterns and phylogenetic implications. Genes 2022, 13, 461. [Google Scholar] [CrossRef] [PubMed]
  45. Yang, X.; Wang, Y.; Gong, W.; Li, Y. Comparative analysis of the codon usage pattern in the chloroplast genomes of Gnetales species. Int. J. Mol. Sci. 2024, 25, 10622. [Google Scholar] [CrossRef] [PubMed]
  46. Hu, Q.; Wu, J.; Fan, C.; Luo, Y.; Liu, J.; Deng, Z.J.; Li, Q. Comparative analysis of codon usage bias in the chloroplast genomes of eighteen Ampelopsideae species (Vitaceae). BMC Genom. Data 2024, 25, 1–13. [Google Scholar] [CrossRef]
  47. Liang, C.; Wang, L.; Ma, W.; Xu, J. A comparative study of complete chloroplast genome for the genus Salvia. J. Plant Biochem. Biotechnol. 2020, 30, 117–125. [Google Scholar] [CrossRef]
  48. Liang, C.; Wang, L.; Lei, J.; Duan, B.; Ma, W.; Xiao, S.; Qi, H.; Wang, Z.; Liu, Y.; Shen, X.; et al. A comparative analysis of the chloroplast genomes of Four Salvia medicinal plants. Engineering 2019, 5, 907–915. [Google Scholar] [CrossRef]
  49. Daniell, H.; Lee, S.; Grevich, J.; Saski, C.; Quesada-Vargas, T.; Guda, C.; Tomkins, J.; Jansen, R. Complete chloroplast genome sequences of Solanum bulbocastanum, Solanum lycopersicum and comparative analyses with other Solanaceae genomes. Theor. Appl. Genet. 2006, 112, 1503–1518. [Google Scholar] [CrossRef] [PubMed]
  50. Solórzano, S.; Chincoya, D.A.; Sanchez-Flores, A.; Estrada, K.; Díaz-Velásquez, C.E.; González-Rodríguez, A.; Vaca-Paniagua, F.; Dávila, P.; Arias, S. De Novo assembly discovered novel structures in genome of plastids and revealed divergent inverted repeats in Mammillaria (Cactaceae, Caryophyllales). Plants 2019, 8, 392. [Google Scholar] [CrossRef]
  51. Srivastava, D.; Shanker, A. Identification of simple sequence repeats in chloroplast genomes of Magnoliids through bioinformatics approach. Interdiscip. Sci. Comput. Life Sci. 2016, 8, 327–336. [Google Scholar] [CrossRef] [PubMed]
  52. Ma, Q.; Li, S.; Bi, C.; Hao, Z.; Sun, C.; Ye, N. Complete chloroplast genome sequence of a major economic species, Ziziphus jujuba (Rhamnaceae). Curr. Genet. 2017, 63, 117–129. [Google Scholar] [CrossRef]
  53. Yao, X.; Tang, P.; Li, Z.; Li, D.; Liu, Y.; Huang, H. The first complete chloroplast genome sequences in Actinidiaceae: Genome structure and comparative analysis. PLoS ONE 2015, 10, e0129347. [Google Scholar] [CrossRef]
  54. Wang, N.J.; Chen, S.F.; Xie, L.; Wang, L.; Feng, Y.Y.; Lv, T.; Fang, Y.M.; Ding, H. The complete chloroplast genomes of three hamamelidaceae species: Comparative and phylogenetic analyses. Ecol. Evol. 2022, 12, e8637. [Google Scholar] [CrossRef]
  55. Ren, T.; Li, Z.; Xie, D.; Gui, L.; Peng, C.; Wen, J.; He, X. Plastomes of eight Ligusticum species: Characterization, genome evolution, and phylogenetic relationships. BMC Plant Biol. 2020, 20, 519–533. [Google Scholar] [CrossRef] [PubMed]
  56. Gu, J.M.; Li, M.J.; He, S.T.; Li, Z.; Wen, F.; Tan, K.; Bai, X.X.; Hu, G.X. Comparative chloroplast genomes analysis of nine Primulina (Gesneriaceae) rare species, from karst region of southwest China. Sci. Rep. 2024, 14, 30256–30272. [Google Scholar] [CrossRef] [PubMed]
  57. Zhang, Z.; Zhang, D.; Zou, L.; Yao, C. Comparison of chloroplast genomes and phylogenomics in the Ficus sarmentosa complex (Moraceae). PLoS ONE 2022, 17, e0279849. [Google Scholar] [CrossRef] [PubMed]
  58. Wu, L.W.; Nie, L.P.; Wang, Q.; Xu, Z.C.; Wang, Y.; He, C.N.; Song, J.Y.; Yao, H. Comparative and phylogenetic analyses of the chloroplast genomes of species of Paeoniaceae. Sci. Rep. 2021, 11, 14643–14659. [Google Scholar] [CrossRef]
  59. Liang, D.; Wang, H.; Zhang, J.; Zhao, Y.; Wu, F. Complete chloroplast genome sequence of Fagus longipetiolata Seemen (Fagaceae): Genome structure, adaptive evolution, and phylogenetic relationships. Life 2022, 12, 92. [Google Scholar] [CrossRef]
  60. Alzahrani, D.; Yaradua, S.; Albokhari, E.; Abba, A. Complete chloroplast genome sequence of Barleria prionitis, comparative chloroplast genomics and phylogenetic relationships among Acanthoideae. BMC Genom. 2020, 21, 393. [Google Scholar] [CrossRef]
  61. Shaw, J.; Lickey, E.; Schilling, E.; Small, R. Comparison of whole chloroplast genome sequences to choose noncoding regions for phylogenetic studies in angiosperms: The tortoise and the hare III. Am. J. Bot. 2007, 94, 275–288. [Google Scholar] [CrossRef]
  62. Shaw, J.; Shaw, J.; Shafer, H.; Leonard, O.; Kovach, M.; Schorr, M.; Morris, A. Chloroplast DNA sequence utility for the lowest phylogenetic and phylogeographic inferences in angiosperms: The tortoise and the hare IV. Am. J. Bot. 2014, 101, 1987–2004. [Google Scholar] [CrossRef]
  63. Shi, W.; Song, W.; Zhao, Y.; Shi, C.; Wang, S. Complete chloroplast genomes of four Atalantia (Rutaceae) species: Insights into comparative analysis, phylogenetic relationships, and divergence time estimation. Plant Syst. Evol. 2023, 309, 31–48. [Google Scholar] [CrossRef]
  64. Cui, M.; Liu, C.; Yang, X.; Li, M.; Liu, L.; Jia, K.; Li, W. Comparative and phylogenetic analysis of the chloroplast genomes of four wild species of the genus Prunus. Genes 2025, 16, 239. [Google Scholar] [CrossRef] [PubMed]
  65. Zhang, X.; Landis, J.; Wang, H.; Zhu, Z.; Wang, H. Comparative analysis of chloroplast genome structure and molecular dating in Myrtales. BMC Plant Biol. 2021, 21, 219–238. [Google Scholar] [CrossRef] [PubMed]
  66. Su, T.; Geng, Y.F.; Xiang, C.L.; Zhao, F.; Wang, M.; Gu, L.; Hu, G.X. Chloroplast genome of Salvia Sect. Drymosphace: Comparative and phylogenetic analysis. Diversity 2022, 14, 324. [Google Scholar] [CrossRef]
Figure 1. Chloroplast genome map of eight Salvia species. The circular map depicts a representative plastome (Salvia roborowskii). Thick lines on the outer complete circle represent the inverted repeat regions (IRa and IRb). The innermost track of the plastome shows the GC content. Genes on the outside of the map are transcribed in a clockwise direction, and genes on the inside of the map are transcribed in a counterclockwise direction. IR, inverted repeats; LSC, large single-copy; SSC, small single-copy.
Cimb 47 00493 g001
Figure 2. Relative synonymous codon usage (RSCU) values in the genus Salvia, taking S. sonchifolia as an example. F: phenylalanine; L: leucine; I: isoleucine; M: methionine; V: valine; S: serine; P: proline; T: threonine; A: alanine; Y: tyrosine; *: stop; H: histidine; Q: glutamine; N: asparagine; K: lysine; D: aspartic acid; E: glutamic acid; C: cysteine; W: tryptophan; R: arginine; G: glycine.
Cimb 47 00493 g002
Figure 3. Types, lengths, and distributions of long sequence repeats in the eight Salvia chloroplast genomes. (A) Number of different repeat types: F, forward; P, palindromic; R, reverse; T, tandem; (B) Number of different repeat lengths; (C) Proportion of repeats in LSC, SSC, and IR regions.
Cimb 47 00493 g003
Figure 4. The number and distribution of SSRs in the chloroplast genomes of eight Salvia species. (A) Total number of repeats; (B) Proportion of repeats in IGR, CDS, or Intron regions; (C) Number of repeats in LSC, SSC, and IR.
Cimb 47 00493 g004
Figure 5. The comparison of the junction positions of LSC, IR, and SSC regions in the chloroplast genomes of the eight Salvia species. Genes are annotated in assorted colors and labeled with their distances from the boundaries and the lengths of these distances. JLB, JSB, JSA, and JLA denote the boundaries of the four regions (LSC/IRb, IRb/SSC, SSC/IRa, and IRa/LSC, respectively).
Cimb 47 00493 g005
Figure 6. Alignment visualization of the eight Salvia cp genomes using S. roborowskii annotation as a reference. The horizontal axis indicates the coordinates within the chloroplast genome, and the vertical scale indicates the percentage of identity, ranging from 50% to 100%. Arrows indicate the annotated genes and their transcriptional direction. Genome regions are color-coded as protein coding (purple bars), rRNA coding (green bars), tRNA coding (sky-blue bars), or intergenic regions (IGR, red bars).
Cimb 47 00493 g006
Figure 7. Sliding window analysis of the whole chloroplast genomes of the eight Salvia species (window length: 600 bp, step size: 200 bp). X-axis: position of the midpoint of a window; Y-axis: nucleotide diversity (Pi) in each window.
Cimb 47 00493 g007
Figure 8. Phylogenetic relationships of the 39 Salvia species based on the whole cp genome inferred from maximum likelihood (ML) analyses. The bootstrap support values of ML and MP, and PP values from the BI analysis are listed above the clades, respectively. An asterisk (*) denotes nodes with full support (100% bootstrap/1.00 PP) across all three methods. G1–G8 represent subclades within subgenus Glutinaria, as defined by previous taxonomic classifications. Clades I–V represent subclades within subgenus Glutinaria, as defined by this study.
Cimb 47 00493 g008
Table 1. Information for sampled sequences.
SpeciesSample LocalityVoucherGenbank Accession
Salvia bowleyanaFujian131MW435404
Salvia bulleyanananaMH603954
Salvia campanulatananaMT742542
Salvia castanea f. castaneana11CS3534MT634150
Salvia castanea f.tomentosananaMW387501
Salvia cavalerieina10CS1700MT634139
Salvia chieniiAnhuiHu0071MN062354
Salvia cyclostegianaHP8813MT634144
Salvia dabieshanensisAnhui165MW435405
Salvia digitaloidesYunnan1292MN520016
Salvia flavana11CS3465MT634140
Salvia honaniananaMZ900991
Salvia japonicananaMW381778
Salvia kiangsiensisJiangxiHu0062MN062353
Salvia ligulilobananaMZ855771
Salvia maireinaHP8366MT634143
Salvia meiliensisAnhuiGX Hu 0089MN520018
Salvia miltiorrhizananaJX312195
Salvia nanchuanensisnanaMZ900990
Salvia nanchuanensis var. pteridifoliaGuangxi615MW435408
Salvia nipponicananaMT156377
Salvia petrophilaGuizhouGX Hu 0292MN520022
Salvia plebeiaGuangxiHu0024MN062352
Salvia plectranthoidesYunnan6MW435409
Salvia prattiinanaMK944407
Salvia przewalskiiYunnanHGW-00807MK344723
Salvia roborowskiiGansuFW11193MN062349
Salvia sonchifoliaYunnan269MN062355
Salvia subbipinnataZhejiangYJX-04MW435410
Salvia subpalmatinervisnaYangQE1866MT634137
Salvia substoloniferananaMN125145
Salvia trijugaYunnanD576MN062350
Salvia umbraticana10CS2479MT634142
Salvia wardiiTibet3270MN062351
Salvia yunnanensisYunnanGX Hu QT001MN520026
Salvia officinalisnanaMN520021
Salvia sclareananaMN520023
Salvia splendensnanaMN520024
Salvia rosmarinusnanaKR232566
Notes: na = not available.
Table 2. Basic characteristics of the chloroplast genomes of eight Salvia species.
CharacteristicsSalvia 
roborowskii
Salvia 
przewalskii
Salvia 
trijuga
SalviawardiiSalvia 
plebeia
Salvia 
kiangsiensis
SalviachieniiSalvia
sonchifolia
Genome size (bp)151,649152,678151,345151,485151,081152,216151,386151,230
LSC size (bp)82,86683,91282,57782,76882,46483,61182,77182,711
IR size (bp)25,59625,56425,59225,55725,56225,52325,52025,321
SSC size (bp)17,59117,63817,58417,60317,49317,55917,57517,877
Total number of genes132132132132132132132132
Protein encoding8080808080808080
tRNA genes3030303030303030
rRNA genes44444444
duplicated genes1818181818181818
pseudogenes33333333
GC content (%)38.038.037.938.038.038.138.038.1
GC content of LSC (%)36.136.236.036.136.136.336.136.2
GC content of IR (%)43.143.143.143.143.143.143.143.2
GC content of SSC (%)31.931.931.731.932.032.032.032.0
Table 3. A list of genes identified in the chloroplast genomes of eight Salvia species.
CategoryGene TypeGene
Self-replicationrRNA rrn16(2×), rrn23(2×), rrn4.5(2×), rrn5(2×)
tRNAtrnI-CAU(2×), trnL-CAA(2×), trnV-GAC(2×), * trnI-GAU(2×), * trnA-UGC(2×), trnR-ACG(2×), trnN-GUU(2×), trnL-UAG, trnP-UGG, trnW-CCA, trnM-CAU, * trnV-UAC, trnF-GAA, * trnL-UAA, trnT-UGU, trnS-GGA, trnfM-CAU, trnG-GCC, trnS-UGA, trnT-GGU, trnE-UUC, trnY-GUA, trnD-GUC, trnC-GCA, trnR-UCU, * trnG-UCC, trnS-GCU, trnQ-UUG, * trnK-UUU, trnH-GUG
Small subunit of ribosomerps2, rps3, rps4, rps7(2×), rps8, rps11, ** rps12(2×), rps14, rps15, * rps16, rps18, rps19
Large subunit of ribosome* rpl2(2×), rpl14, * rpl16, rpl20, rpl22, rpl23(2×), rpl32, rpl33, rpl36
DNA-dependent RNA polymeraserpoA, rpoB, * rpoC1, rpoC2
Genes for photosynthesisNADH dehydrogenase* ndhA, * ndhB(2×), ndhC, ndhD, ndhE, ndhF, ndhG, ndhH, ndhI, ndhJ, ndhK
Photosystem IpsaA, psaB, psaC, psaI, psaJ
Photosystem IIpsbA, psbB, psbC, psbD, psbE, psbF, psbH, psbI, psbJ, psbK, psbL, psbM, psbN, psbT, psbZ
Cytochrome b/f complexpetA, * petB, * petD, petG, petL, petN
ATP synthaseatpA, atpB, atpE, * atpF, atpH, atpI
Large subunit of rubiscorbcL
Other genesMaturasematK
Translational initiation factorinfA
Protease** clpP
Envelope membrane proteincemA
Acetyl-CoA-carboxylase subunitaccD
c-type cytochrome synthesisccsA
Component of TIC complexycf1
UnknownOpen reading frame (ORF, ycf)ycf2(2×), ** ycf3, ycf4, ycf15(2×)
Notes: 2× Genes located in IR region, * Genes with a single intron, ** Genes with two introns.
Table 4. The shared repeats of eight Salvia species.
No.Size (bp)UnitsTypeLocation Region
141TACAGAACCGTACATGAGATTTTCACCTCATACGGCTCCTCFIGR (rps12, trnV-GAC), ndhA (intron)
230A(G)CGGAAAGAGAGGGATTCGAACCCTCGGTAPtrnS-GCU (tRNA), trnS-GGA (tRNA)
330CATTGTTCAAA(C)TCTTTGACAACAC(T)GAAAAAFIGR (rrn4.5, rrn5)
430AC(A)GATGCGGGTTCGATTCCCGCTAC(T)CCGCT(C)FtrnG-UCC (tRNA), trnG-GCC (tRNA)
530TTTCTTTTTGTCC(G)AAG(C)TCACTTCT(C)TTTTTTFycf2 (CDS)
655TTTGTCTAAGCCACTTCGTTTCTTTTTGTCCAAGTCACTTCTTTTTTTGTCCAAGTycf2 (CDS)
768TTTTTGTCCAAGTCACTTCTTTTTTTGTCCAAGTTGCTTTTCTTTTTGTCGAACTCACTTCCTTTTTTTycf2 (CDS)
Disclaimer/Publisher’s Note: The statements, opinions and data contained in all publications are solely those of the individual author(s) and contributor(s) and not of MDPI and/or the editor(s). MDPI and/or the editor(s) disclaim responsibility for any injury to people or property resulting from any ideas, methods, instructions or products referred to in the content.

