
Brain Tumor-Induced Changes in Routine Parameters of the Lipid Spectrum of Blood Plasma and Its Short-Chain Fatty Acids

 , ,
, ,
Abstract
1. Introduction
2. Materials and Methods
2.1. Materials
2.2. Measurement of Tumor Markers
2.3. Analysis of the Biochemical Parameters of Lipid Metabolism
2.4. Measurement of Levels of Short-Chain Fatty Acids in Blood Samples
2.5. Statistical Analysis
3. Results
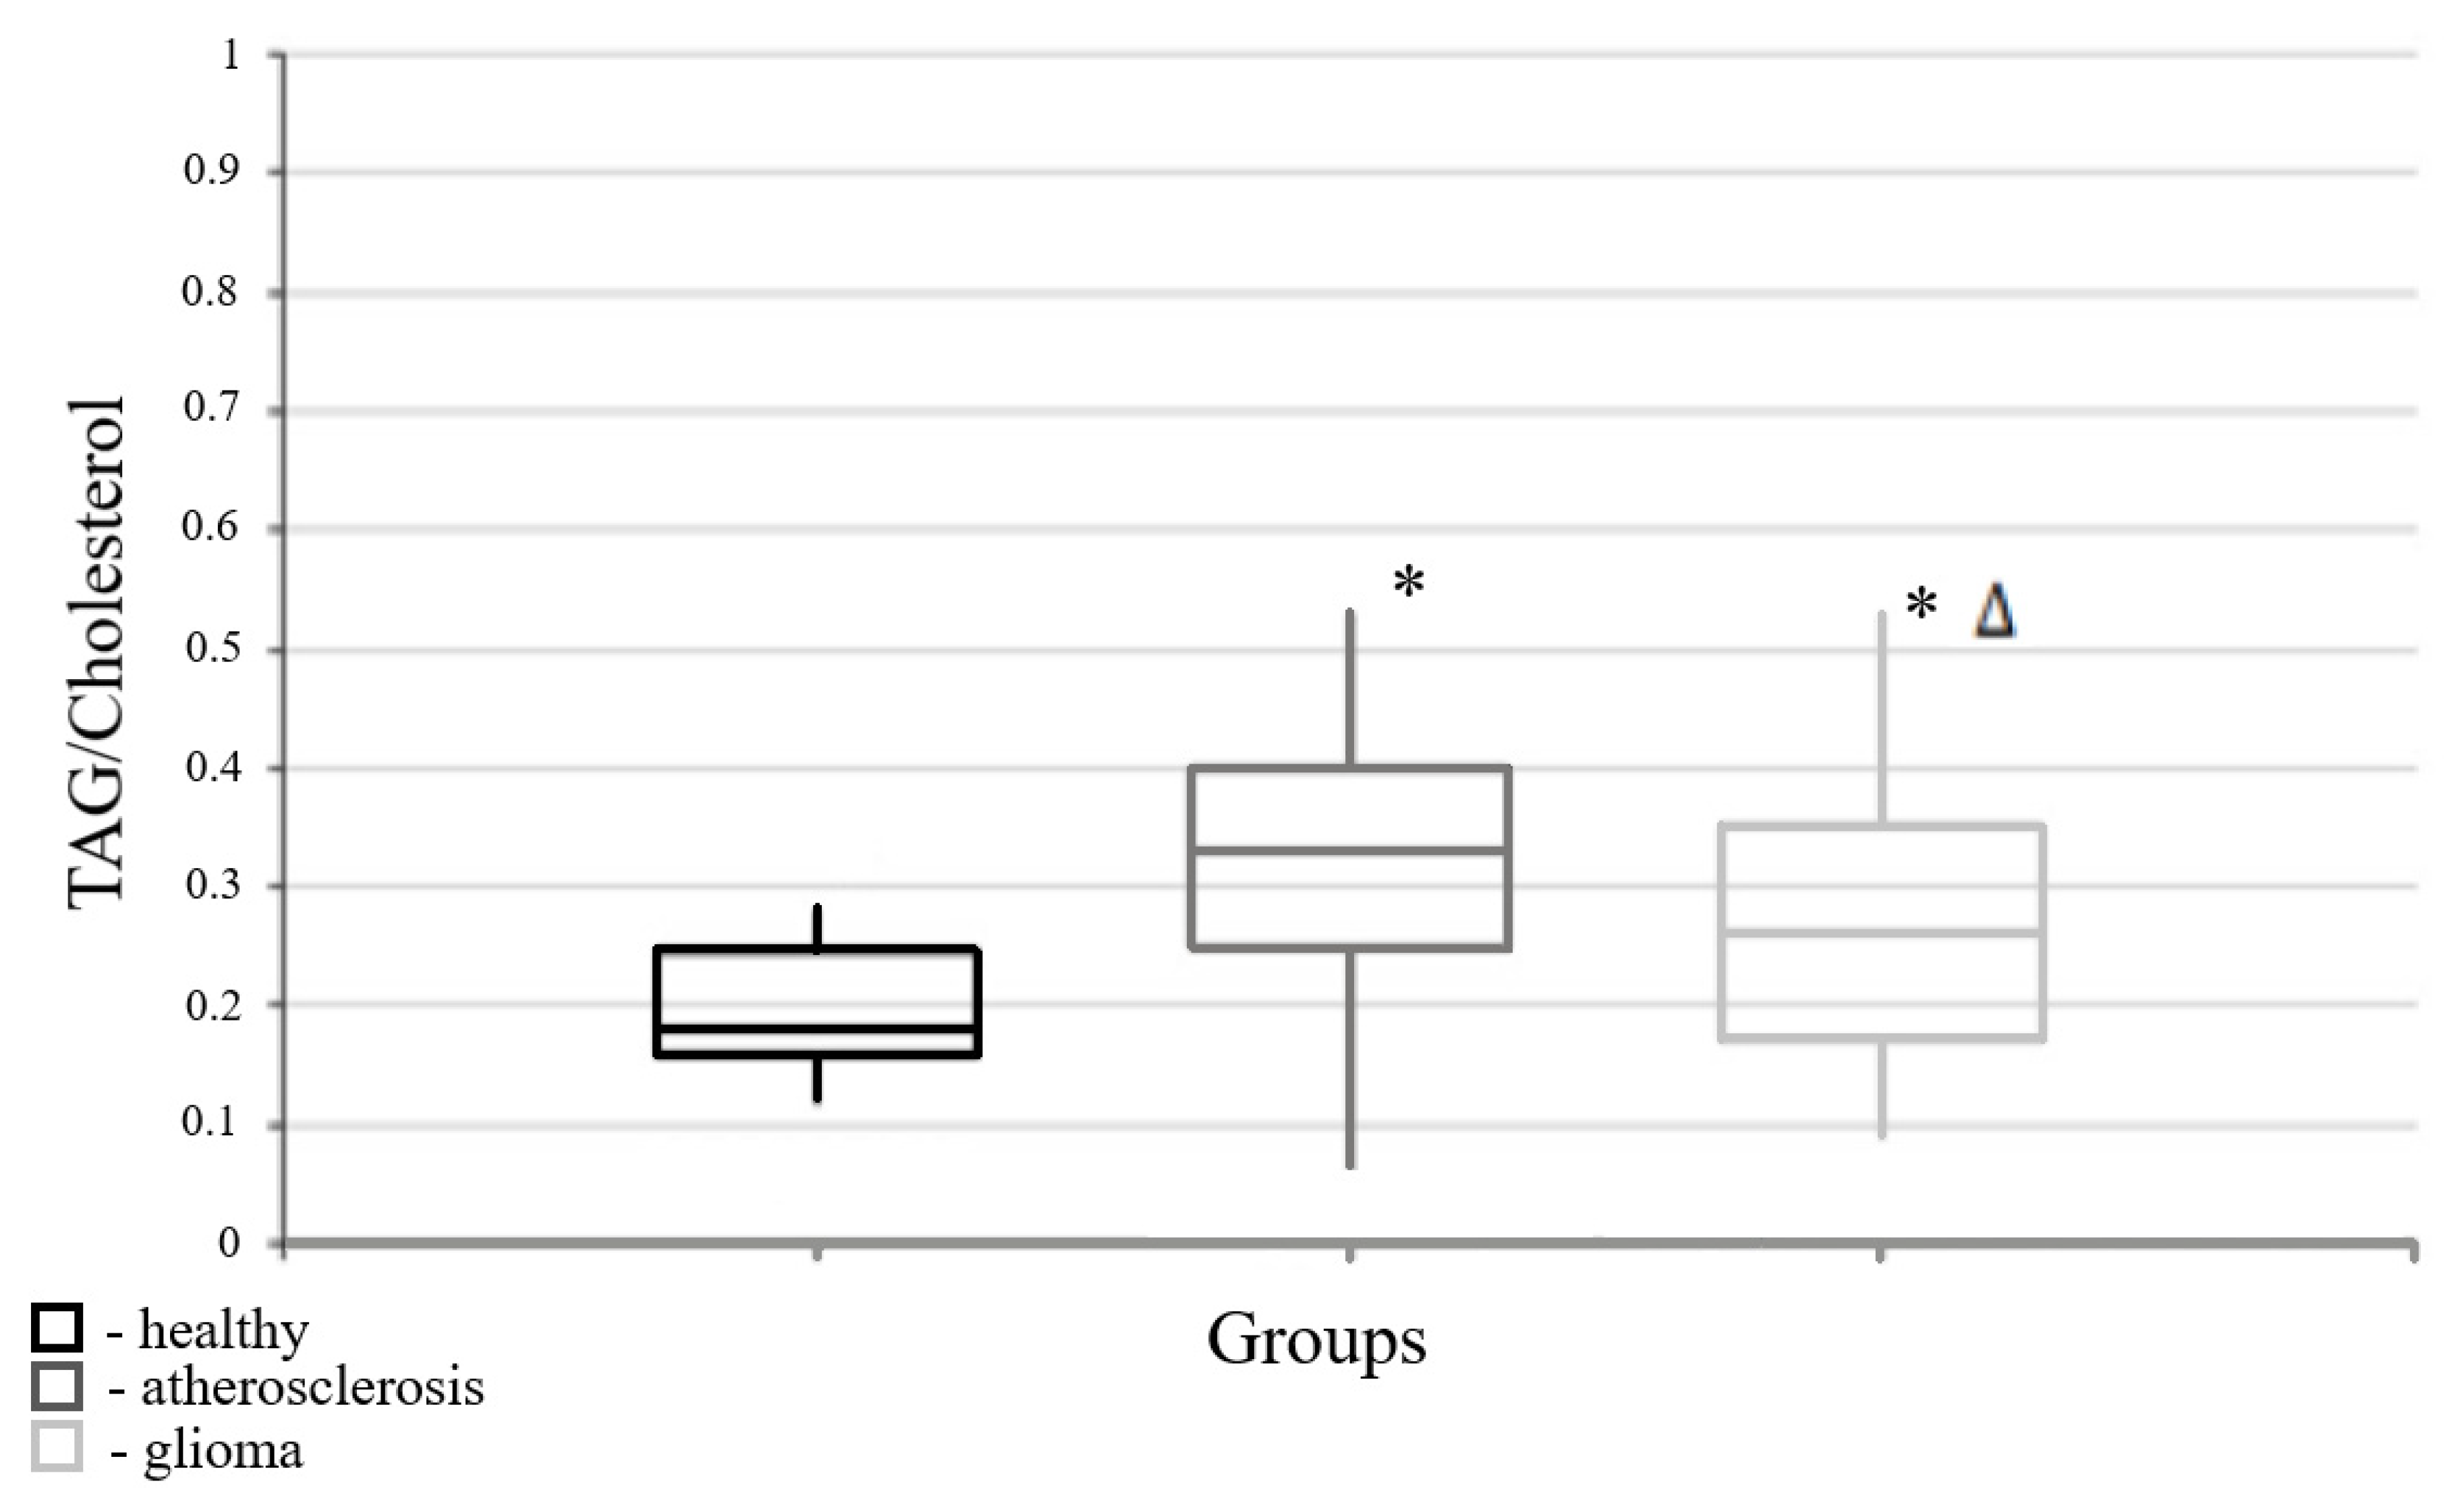
3.1. Parameters of Lipid Metabolism Corresponding to Different Pathologies
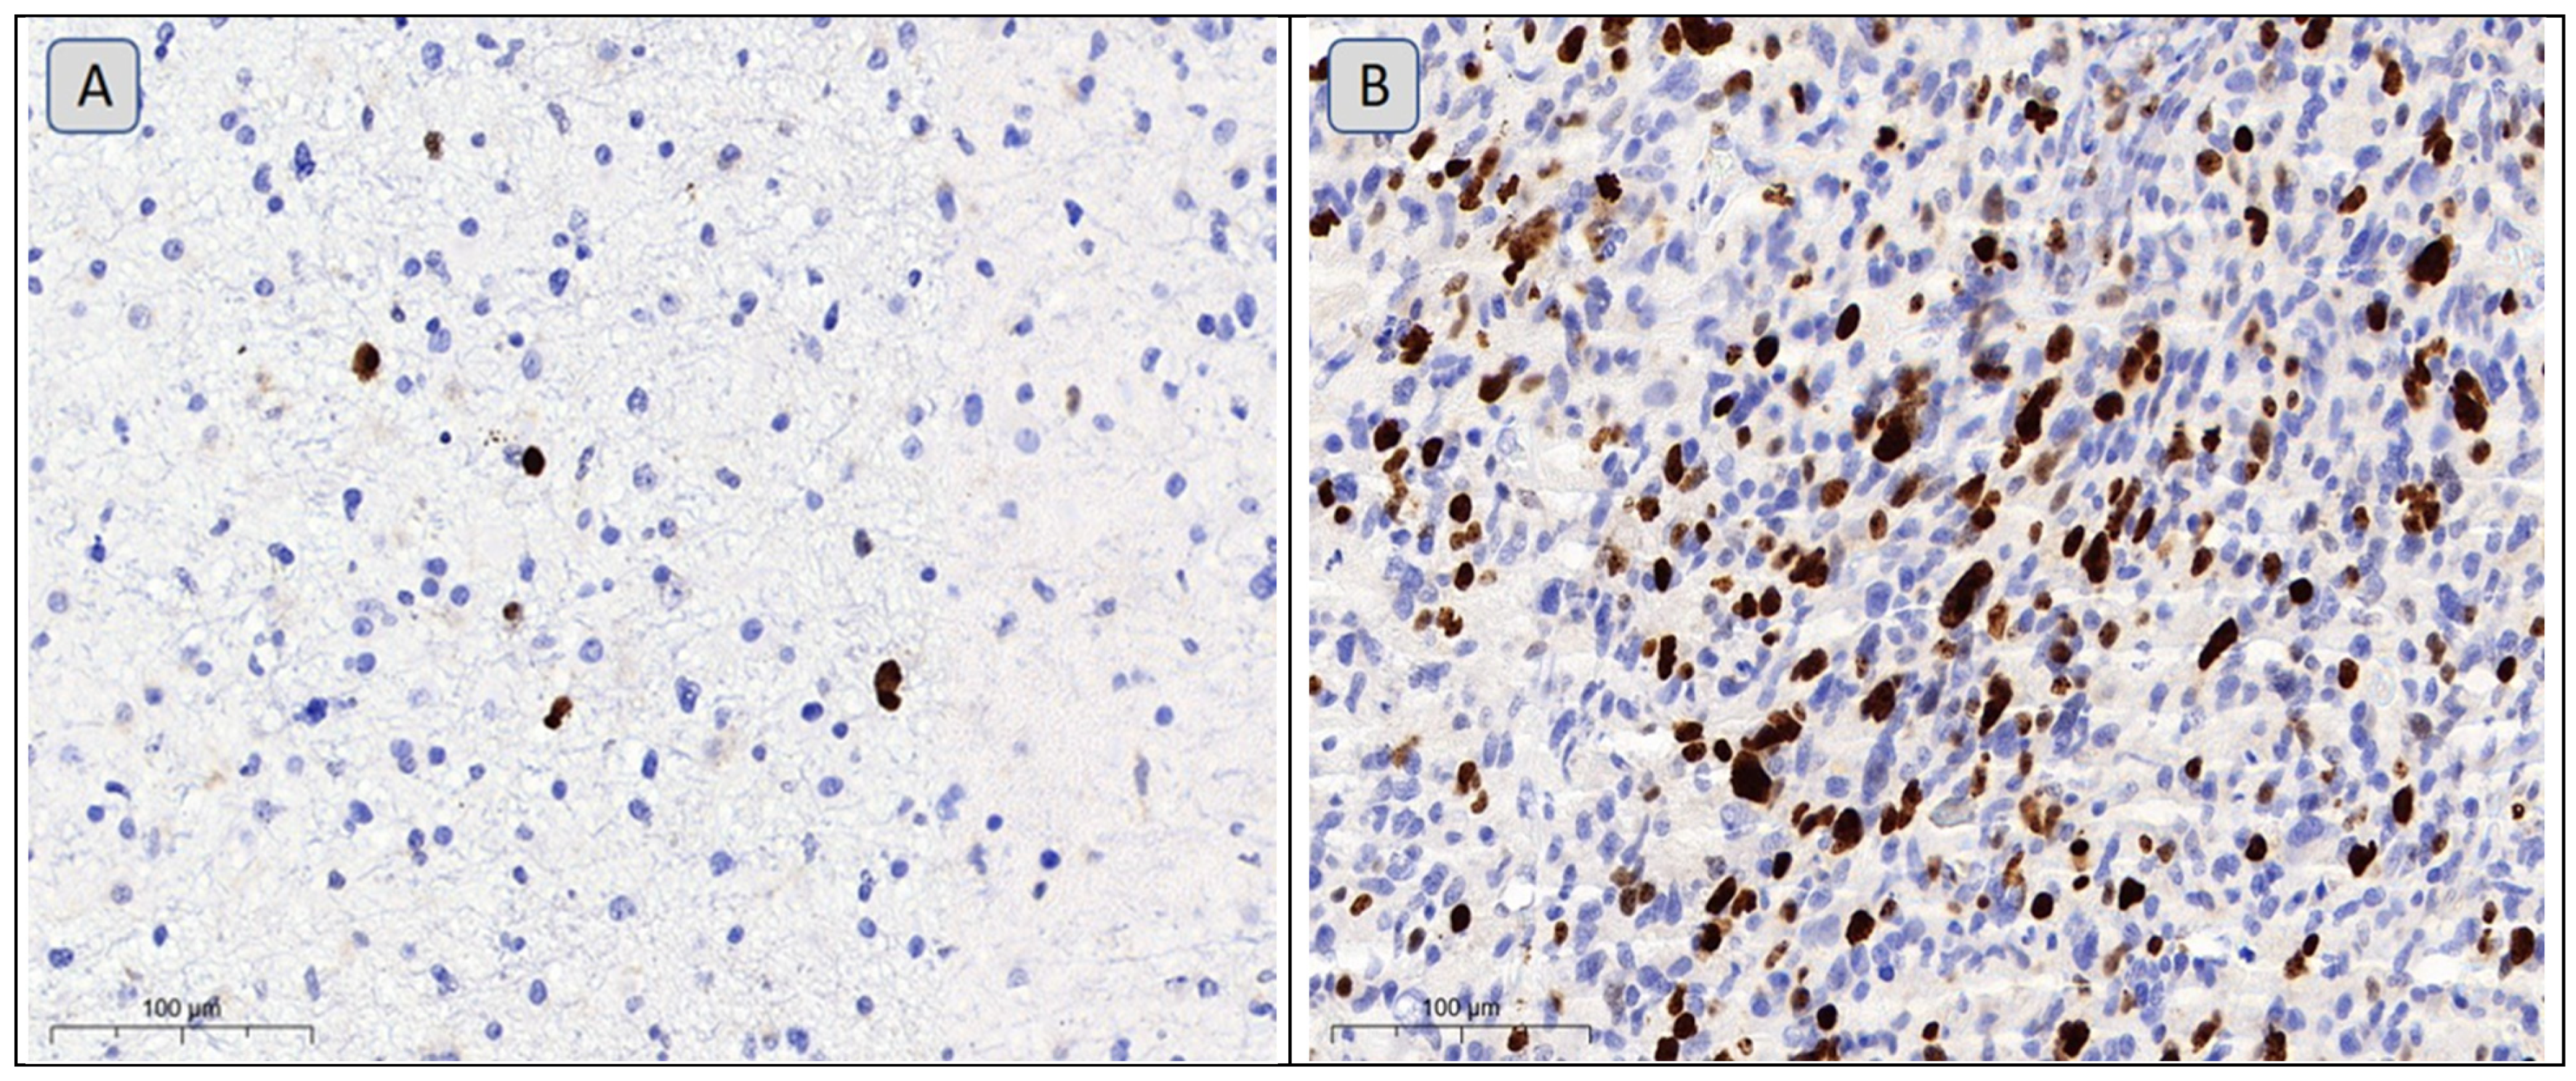
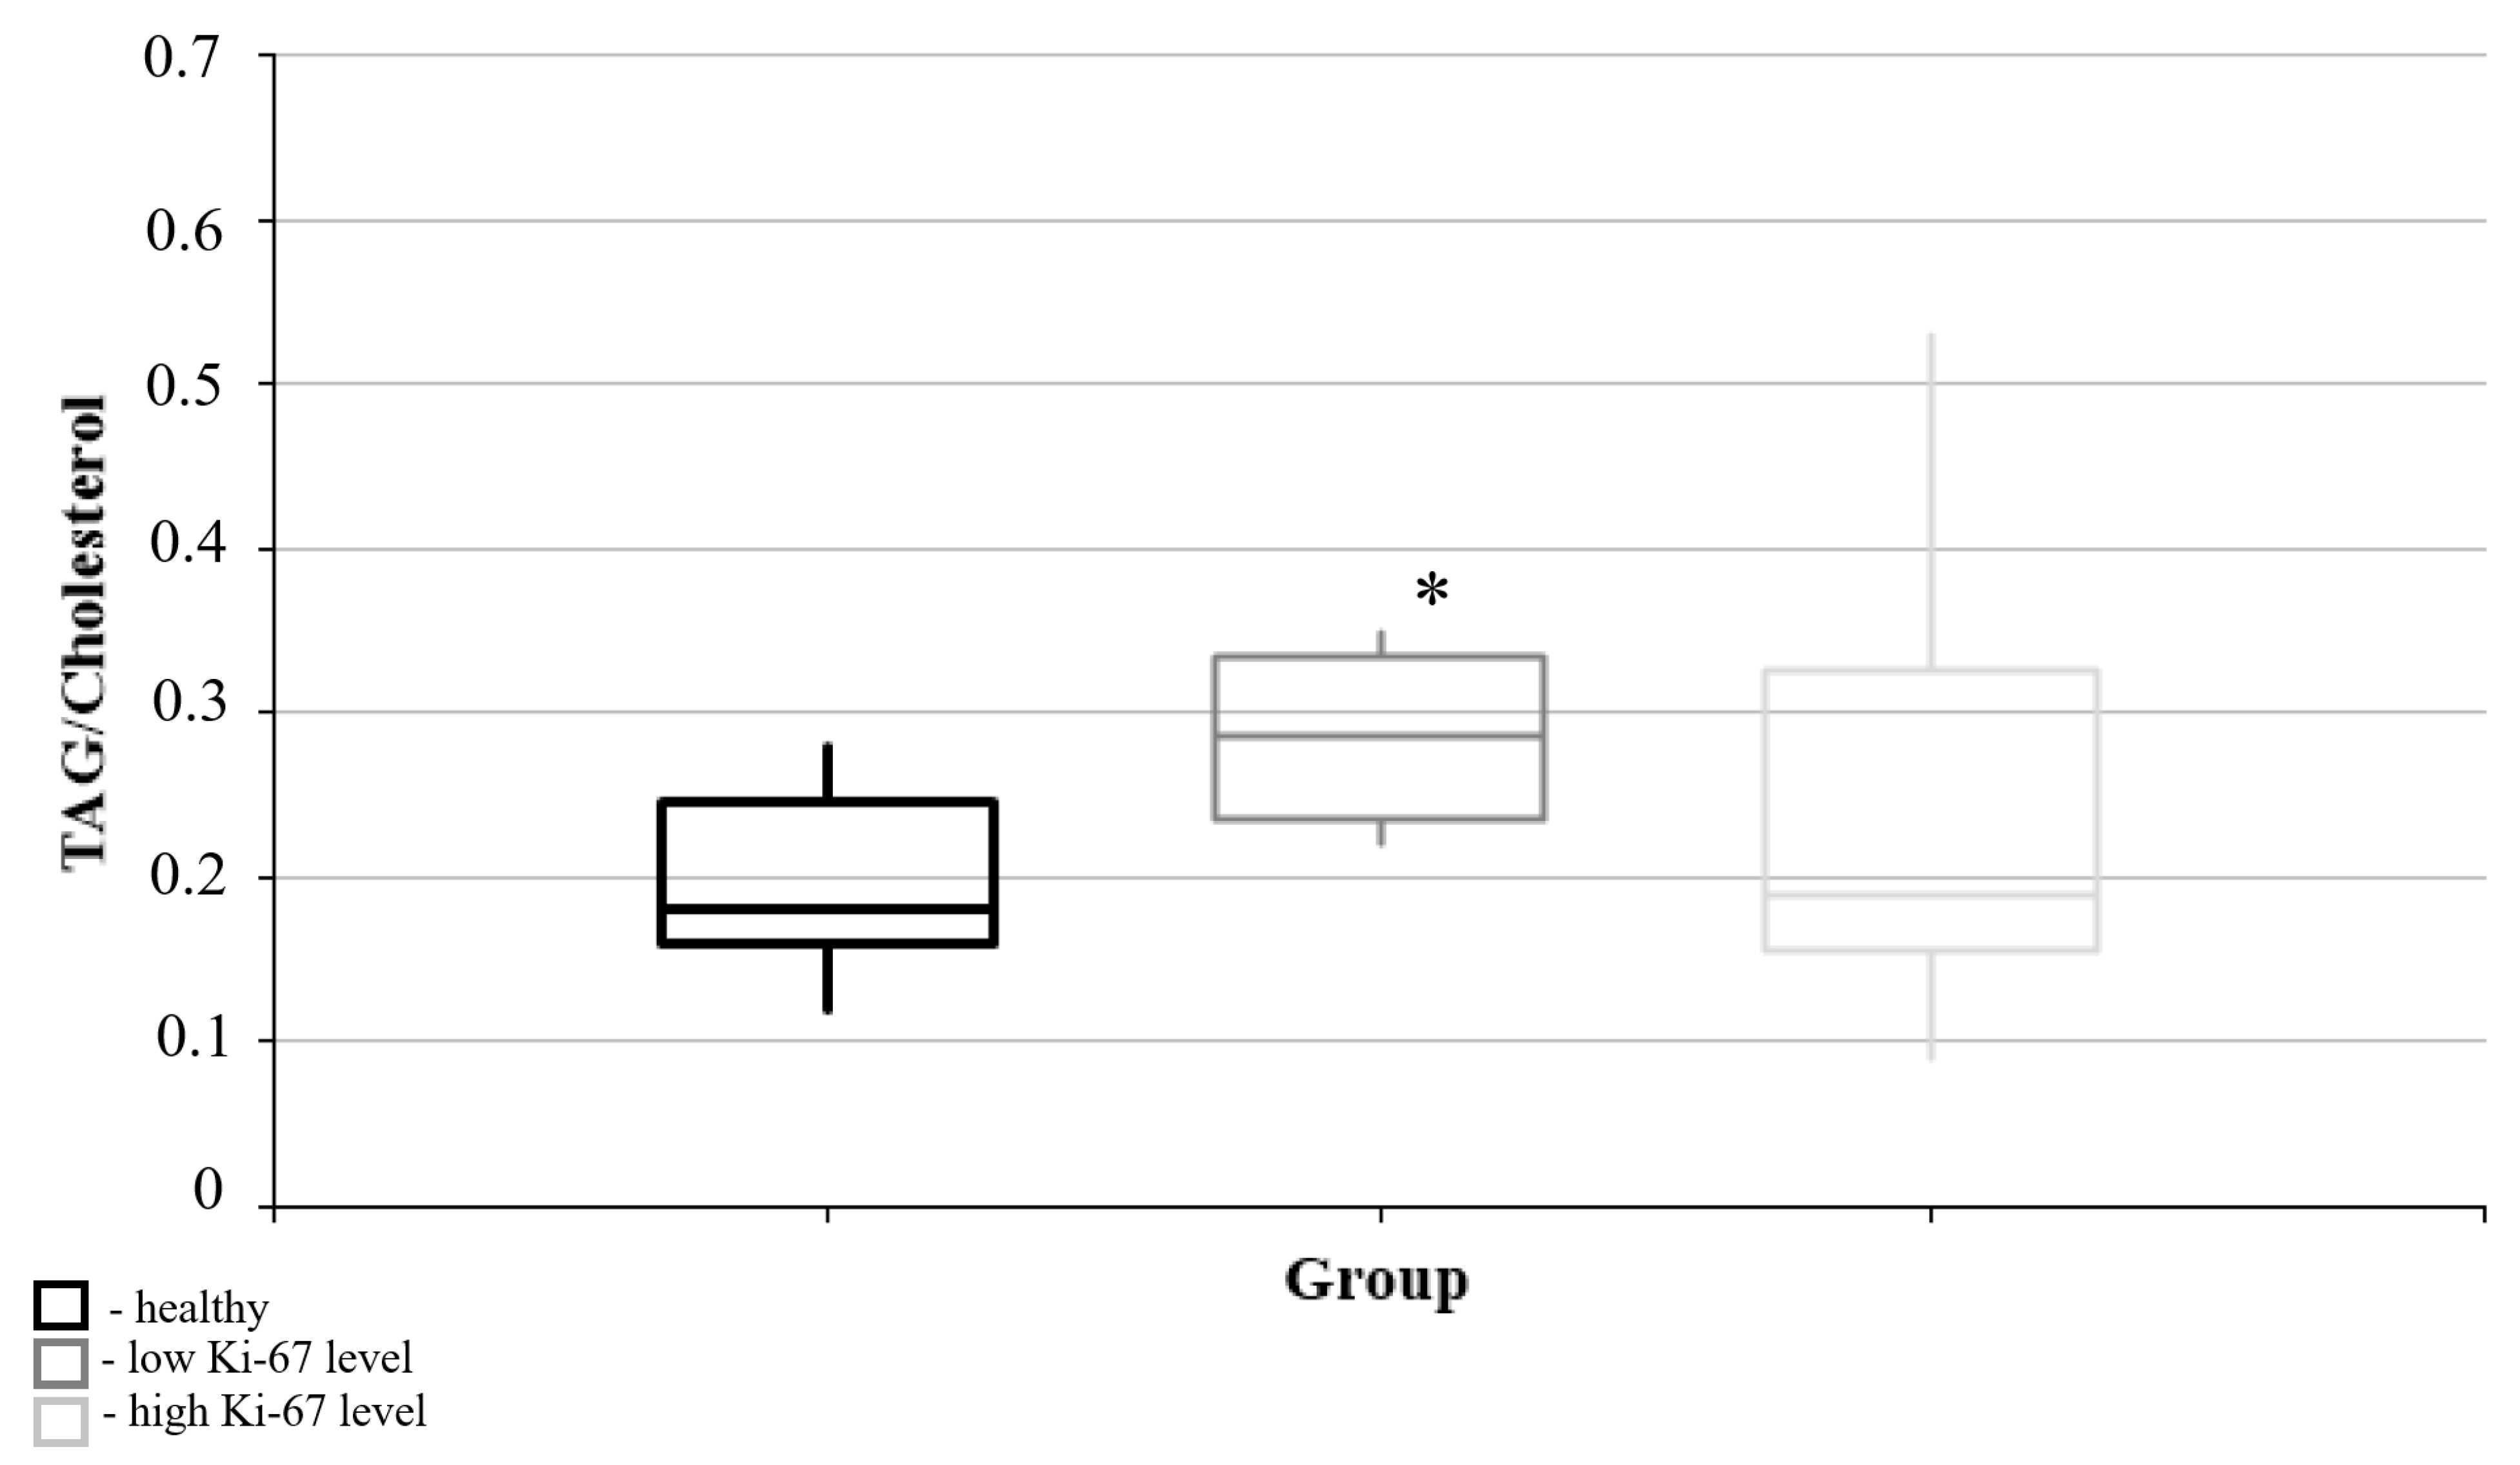
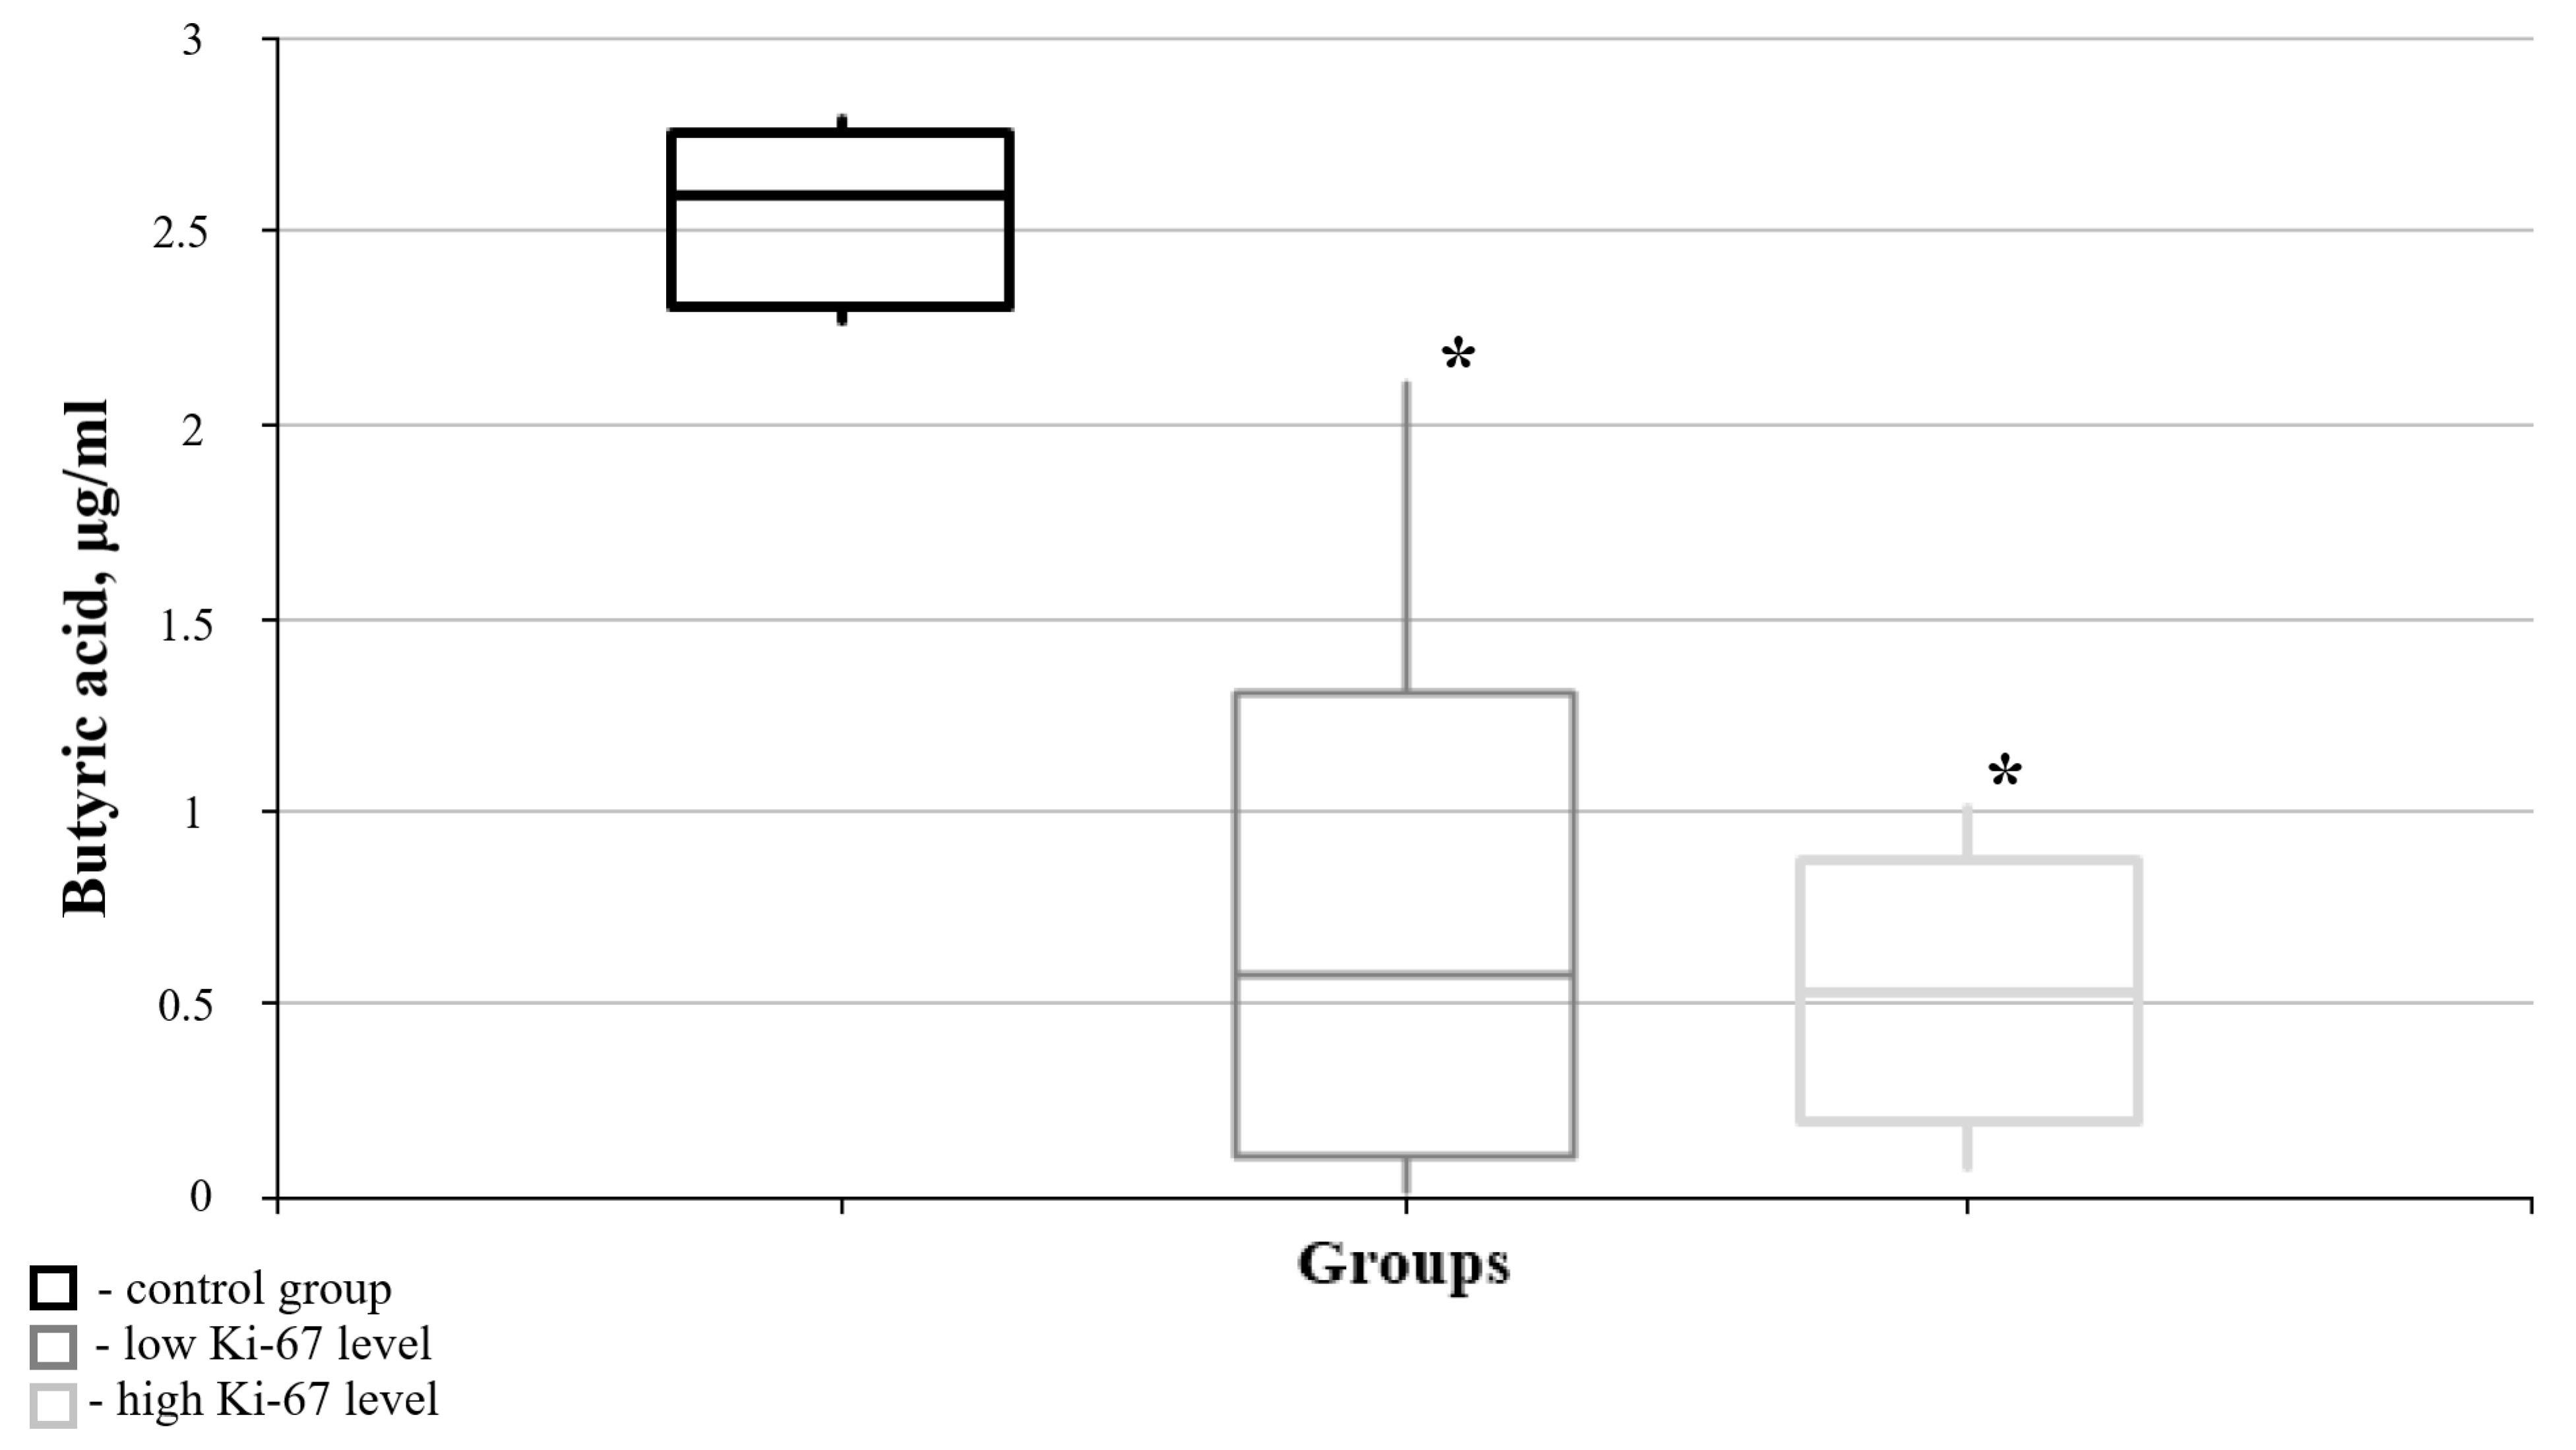
3.2. Lipid Metabolism Characteristics Corresponding to the Immunohistochemical Profile of Brain Tumors
4. Discussion
5. Conclusions
Supplementary Materials
Author Contributions
Funding
Institutional Review Board Statement
Informed Consent Statement
Data Availability Statement
Conflicts of Interest
References
- Marien, E.; Meister, M.; Muley, T.; Fieuws, S.; Bordel, S.; Derua, R.; Spraggins, J.; Van de Plas, R.; Dehairs, J.; Wouters, J.; et al. Non-small cell lung cancer is characterized by dramatic changes in phospholipid profiles. Int. J. Cancer 2015, 137, 1539–1548. [Google Scholar] [CrossRef] [PubMed]
- Guo, D.; Bell, E.H.; Chakravarti, A. Lipid metabolism emerges as a promising target for malignant glioma therapy. CNS Oncol. 2013, 2, 289–299. [Google Scholar] [CrossRef] [PubMed]
- Herrington, W.; Lacey, B.; Sherliker, P.; Armitage, J.; Lewington, S. Epidemiology of Atherosclerosis and the Potential to Reduce the Global Burden of Atherothrombotic Disease. Circ. Res. 2016, 118, 535–546. [Google Scholar] [CrossRef] [PubMed]
- Mayer, E.A.; Savidge, T.; Shulman, R.J. Brain–Gut Microbiome Interactions and Functional Bowel Disorders. Gastroenterology 2014, 146, 1500–1512. [Google Scholar] [CrossRef]
- Silva, Y.P.; Bernardi, A.; Frozza, R.L. The Role of Short-Chain Fatty Acids From Gut Microbiota in Gut-Brain Communication. Front. Endocrinol. 2020, 11, 25. [Google Scholar] [CrossRef]
- Louis, D.N.; Perry, A.; Wesseling, P.; Brat, D.J.; Cree, I.A.; Figarella-Branger, D.; Hawkins, C.; Ng, H.K.; Pfister, S.M.; Reifenberger, G.; et al. The 2021 WHO Classification of Tumors of the Central Nervous System: A summary. Neuro-Oncology 2021, 23, 1231–1251. [Google Scholar] [CrossRef]
- Theresia, E.; Malueka, R.G.; Pranacipta, S.; Kameswari, B.; Dananjoyo, K.; Asmedi, A.; Wicaksono, A.S.; Hartanto, R.A.; Dwianingsih, E.K. Association between Ki-67 Labeling index and Histopathological Grading of Glioma in Indonesian Population. Asian Pac. J. Cancer Prev. 2020, 21, 1063–1068. [Google Scholar] [CrossRef] [PubMed]
- Familiari, P.; Relucenti, M.; Lapolla, P.; Palmieri, M.; Antonelli, M.; Cristiano, L.; Barbaranelli, C.; Catalano, M.; D’Angelo, L.; Familiari, G.; et al. Adult IDH Wild-Type Glioblastoma Ultrastructural Investigation Suggests a Possible Correlation between Morphological Biomarkers and Ki-67 Index. Biomedicines 2023, 11, 1968. [Google Scholar] [CrossRef]
- Zhang, Z.; Gu, W.; Hu, M.; Zhang, G.; Yu, F.; Xu, J.; Deng, J.; Xu, L.; Mei, J.; Wang, C.; et al. Based on clinical Ki-67 expression and serum infiltrating lymphocytes related nomogram for predicting the diagnosis of glioma-grading. Front. Oncol. 2022, 12, 696037. [Google Scholar] [CrossRef]
- Leung, S.C.Y.; Nielsen, T.O.; Zabaglo, L.; Arun, I.; Badve, S.S.; Bane, A.L.; Bartlett, J.M.S.; Borgquist, S.; Chang, M.C.; Dodson, A.; et al. Analytical validation of a standardized scoring protocol for Ki67: Phase 3 of an international multicenter collaboration. NPJ Breast Cancer 2016, 2, 16014. [Google Scholar] [CrossRef]
- Nielsen, L.A.G.; Bangso, J.A.; Lindahl, K.H.; Dahlrot, R.H.; Hjelmborg, J.V.B.; Hansen, S.; Kristensen, B.W. Evaluation of the proliferation marker Ki-67 in gliomas: Interobserver variability and digital quantification. Diagn. Pathol. 2018, 3, 8. [Google Scholar] [CrossRef]
- Ríos-Marco, P.; Martín-Fernández, M.; Soria-Bretones, I.; Ríos, A.; Carrasco, M.P.; Marco, C. Alkylphospholipids deregulate cholesterol metabolism and induce cell-cycle arrest and autophagy in U-87 MG glioblastoma cells. Biochim. Biophys. Acta 2013, 1831, 1322–1334. [Google Scholar] [CrossRef] [PubMed]
- Bullwinkel, J.; Baron-Luehr, B.; Lüdemann, A.; Wohlenberg, C.; Gerdes, J.; Scholzen, T. Ki-67 protein is associated with ribosomal RNA transcription in quiescent and proliferating cells. J. Cell Physiol. 2006, 206, 624–635. [Google Scholar] [CrossRef]
- Yoda, R.A.; Marxen, T.; Longo, L.; Ene, C.; Wirsching, H.G.; Keene, C.D.; Holland, E.C.; Cimino, P.J. Mitotic Index Thresholds Do Not Predict Clinical Outcome for IDH-Mutant Astrocytoma. J. Neuropathol. Exp. Neurol. 2019, 78, 1002–1010. [Google Scholar] [CrossRef]
- Dahlrot, R.H.; Bangso, J.A.; Petersen, J.K.; Rosager, A.M.; Sorensen, M.D.; Reifenberger, G.; Hansen, S.; Kristensen, B.W. Prognostic role of Ki-67 in glioblastomas excluding contribution from non-neoplastic cells. Sci. Rep. 2021, 11, 17918. [Google Scholar] [CrossRef] [PubMed]
- Geng, F.; Guo, D. Lipid droplets, potential biomarker and metabolic target in glioblastoma. Intern. Med. Rev. 2017, 3, 10.18103/imr.v3i5.443. [Google Scholar] [CrossRef]
- Sarkaria, J.N.; Hu, L.S.; Parney, I.F.; Pafundi, D.H.; Brinkmann, D.H.; Laack, N.N.; Giannini, C.; Burns, T.C.; Kizilbash, S.H.; Laramy, J.K.; et al. Is the blood-brain barrier really disrupted in all glioblastomas? A critical assessment of existing clinical data. Neuro-Oncology 2018, 20, 184–191. [Google Scholar] [CrossRef]
- Dalile, B.; Van Oudenhove, L.; Vervliet, B.; Verbeke, K. The role of short-chain fatty acids in microbiota-gut-brain communication. Nat. Rev. Gastroenterol. Hepatol. 2019, 16, 461–478. [Google Scholar] [CrossRef]
- Dono, A.; Nickles, J.; Rodriguez-Armendariz, A.G.; McFarland, B.C.; Ajami, N.J.; Ballester, L.Y.; Wargo, J.A.; Esquenazi, Y. Glioma and the gut-brain axis: Opportunities and future perspectives. Neuro-Oncol. Adv. 2022, 4, vdac054. [Google Scholar] [CrossRef]
- Ney, L.M.; Wipplinger, M.; Grossmann, M.; Engert, N.; Wegner, V.D.; Mosig, A.S. Short chain fatty acids: Key regulators of the local and systemic immune response in inflammatory diseases and infections. Open Biol. 2023, 13, 230014. [Google Scholar] [CrossRef]
- O’Riordan, K.J.; Collins, M.K.; Moloney, G.M.; Knox, E.G.; Aburto, M.R.; Fülling, C.; Morley, S.J.; Clarke, G.; Schellekens, H.; Cryan, J.F. Short chain fatty acids: Microbial metabolites for gut-brain axis signalling. Mol. Cell Endocrinol. 2022, 546, 111572. [Google Scholar] [CrossRef]
- Vijay, N.; Morris, M.E. Role of monocarboxylate transporters in drug delivery to the brain. Curr. Pharm. Des. 2014, 20, 1487–1498. [Google Scholar] [CrossRef]
- Dono, A.; Patrizz, A.; McCormack, R.M.; Putluri, N.; Ganesh, B.P.; Kaur, B.; McCullough, L.D.; Ballester, L.Y.; Esquenazi, Y. Glioma induced alterations in fecal short-chain fatty acids and neurotransmitters. CNS Oncol. 2020, 9, CNS57. [Google Scholar] [CrossRef]
- Stilling, R.M.; Van de Wouw, M.; Clarke, G.; Stanton, C.; Dinan, T.G.; Cryan, J.F. The neuropharmacology of butyrate: The bread and butter of the microbiota-gut-brain axis? Neurochem. Int. 2016, 99, 110–132. [Google Scholar] [CrossRef]
- Guo, C.; Huo, Y.J.; Li, Y.; Han, Y.; Zhou, D. Gut-brain axis: Focus on gut metabolites short-chain fatty acids. World J. Clin. Cases 2022, 10, 1754–1763. [Google Scholar] [CrossRef] [PubMed]
- Wu, Q.; Zhang, Y.; Zhang, Y.; Xia, C.; Lai, Q.; Dong, Z.; Kuang, W.; Yang, C.; Su, D.; Li, H.; et al. Potential effects of antibiotic-induced gut microbiome alteration on blood-brain barrier permeability compromise in rhesus monkeys. Ann. N. Y. Acad. Sci. 2020, 1470, 14–24. [Google Scholar] [CrossRef] [PubMed]
- Sun, N.; Hu, H.; Wang, F.; Li, L.; Zhu, W.; Shen, Y.; Xiu, J.; Xu, Q. Antibiotic-induced microbiome depletion in adult mice disrupts blood-brain barrier and facilitates brain infiltration of monocytes after bone-marrow transplantation. Brain Behav. Immun. 2021, 92, 102–114. [Google Scholar] [CrossRef] [PubMed]
- Wen, J.; Ding, Y.; Wang, L.; Xiao, Y. Gut microbiome improves postoperative cognitive function by decreasing permeability of the blood-brain barrier in aged mice. Brain Res. Bull. 2020, 164, 249–256. [Google Scholar] [CrossRef]
- Caetano-Silva, M.E.; Rund, L.; Hutchinson, N.T.; Woods, J.A.; Steelman, A.J.; Johnson, R.W. Inhibition of inflammatory microglia by dietary fiber and short-chain fatty acids. Sci. Rep. 2023, 13, 2819. [Google Scholar] [CrossRef]
- Fock, E.; Parnova, R. Mechanisms of Blood-Brain Barrier Protection by Microbiota-Derived Short-Chain Fatty Acids. Cells 2023, 12, 657. [Google Scholar] [CrossRef]
- Emenaker, N.J.; Calaf, G.M.; Cox, D.; Basson, M.D.; Qureshi, N. Short-chain fatty acids inhibit invasive human colon cancer by modulating uPA, TIMP-1, TIMP-2, mutant p53, Bcl-2, Bax, p21 and PCNA protein expression in an in vitro cell culture model. J. Nutr. 2001, 131 (Suppl. S11), 3041S–3046S. [Google Scholar] [CrossRef]
- Chen, J.; Zhao, K.N.; Vitetta, L. Effects of Intestinal Microbial-Elaborated Butyrate on Oncogenic Signaling Pathways. Nutrients 2019, 11, 1026. [Google Scholar] [CrossRef] [PubMed]
- McBrearty, N.; Arzumanyan, A.; Bichenkov, E.; Merali, S.; Merali, C.; Feitelson, M. Short chain fatty acids delay the development of hepatocellular carcinoma in HBx transgenic mice. Neoplasia 2021, 23, 529–538. [Google Scholar] [CrossRef] [PubMed]
- Feitelson, M.A.; Arzumanyan, A.; Medhat, A.; Spector, I. Short-chain fatty acids in cancer pathogenesis. Cancer Metastasis Rev. 2023, 42, 677–698. [Google Scholar] [CrossRef]
- Gao, S.; Chen, C.; Wang, L.; Hong, L.; Wu, J.; Dong, P. Histone deacetylases inhibitor sodium butyrate inhibits JAK2/STAT signaling through upregulation of SOCS1 and SOCS3 mediated by HDAC8 inhibition in myeloproliferative neoplasms. Exp. Hematol. 2013, 41, 261–270.e4. [Google Scholar] [CrossRef] [PubMed]

| Parameters | Healthy Persons | Brain Tumors | Atherosclerosis | U-Criterion of Mann–Whitney Test | |||||
|---|---|---|---|---|---|---|---|---|---|
| Median | Quartiles | Median | Quartiles | Median | Quartiles | Difference Between Healthy Persons and Brain Tumors | Difference Between Healthy Persons and Atherosclerosis | Difference Between Brain Tumors and Atherosclerosis | |
| Cholesterol | 4.6 | (4.5; 4.7) | 5.72 | (4.88; 6.415) | 3.5 | (2.9; 4.4) | 0.316 | 0.002 * | 4.78 × 10⁻⁸ * |
| Triacylglycerols | 0.8 | (0.765; 2.01) | 1.43 | (1.01; 2.02) | 1.21 | (0.87; 1.59) | 0.138 | 0.714 | 0.248 |
| Low-density lipoproteins | 2.9 | (2.8; 2.85) | 3.65 | (2.67; 4.30) | 2.30 | (2.1; 2.7) | 0.225 | 0.001 * | 0.0003 * |
| High-density lipoproteins | 1.56 | (1.43; 1.755) | 1.34 | (1.22; 1.61) | 1.15 | (0.945; 1.42) | 0.497 | 0.139 | 0.135 |
| Triacylglycerols/cholesterol | 0.18 | (0.16; 0.255) | 0.28 | (0.17; 0.35) | 0.33 | (0.25; 0.4) | 0.016 * | 0.0001 * | 0.046 * |
| Triacylglycerols/Low-density lipoproteins | 0.32 | (0.27; 0.42) | 0.4 (0.31; 0.56) | (0.495; 0.285) | 0.03 | (0.395; 0.69) | 0.089 | 0.002 * | 0.039 * |
| Cholesterol/High-density lipoproteins | 2.965 | (2.73; 3.395) | 4.34 (2.86; 5.76) | (4.08; 2.735) | 2.72 | (2.3; 3.33) | 0.129 | 0.158 | 0.007 * |
| Low-density lipoproteins/High-density lipoproteins | 0.705 | (0.56; 1.14) | 2.88 (1.79; 3.61) | (4.08; 2.735) | 1.52 | (1.035; 2.36) | 0.003 * | 0.0005 * | 0.108 |
| Triacylglycerols/High-density lipoproteins | 0.55 | (0.46; 0.89) | 1.54 | (1.54; 1.065) | 0.82 | (0.7; 1.29) | 0.011 * | 0.019 * | 0.769 |
| Cholesterol/Low-density lipoproteins | 1.72 | (1.61; 1.855) | 1.315 | (1.315; 0.725) | 1.865 | (1.49; 2.17) | 0.085 | 0.671 | 0.213 |
| Healthy Persons (0) | Meningiomas (1) | U-Criterion of Mann–Whitney | Gliomas (2) | U-criterion of Mann–Whitney (Difference from the “Healthy” Control Group) | U-criterion of Mann–Whitney (Difference from the “Healthy” Control Group) | ||||
|---|---|---|---|---|---|---|---|---|---|
| Acid | Median | Quartiles | Median | Quartiles | Median | Quartiles | |||
| Q1 | Q1 | Q1 | |||||||
| Q2 | Q2 | Q2 | |||||||
| Q3 | Q3 | Q3 | |||||||
| Lactic acid | 268.1 | 237.7 | 554.4 | 298.5 | 0.142 | 439.1 | 313.4 | 0.028 | 1.000 |
| 268.1 | 554.4 | 439.1 | |||||||
| 303.3 | 640.8 | 779.1 | |||||||
| Acetic acid | 68.28 | 64.95 | 30.78 | 11.08 | 0.014 * | 39.43 | 31.64 | 0.361 | 0.394 |
| 68.28 | 30.78 | 39.43 | |||||||
| 76.00 | 55.50 | 99.93 | |||||||
| Propionic acid | 3.880 | 2.160 | 3.177 | 1.489 | 0.624 | 3.247 | 1.983 | 0.273 | 1.000 |
| 3.880 | 3.177 | 3.247 | |||||||
| 5.614 | 3.956 | 3.906 | |||||||
| Isobutyric acid | 0.727 | 0.669 | 0.610 | 0.349 | 0.806 | 0.915 | 0.254 | 1.000 | 0.670 |
| 0.727 | 0.610 | 0.915 | |||||||
| 0.816 | 0.990 | 3.230 | |||||||
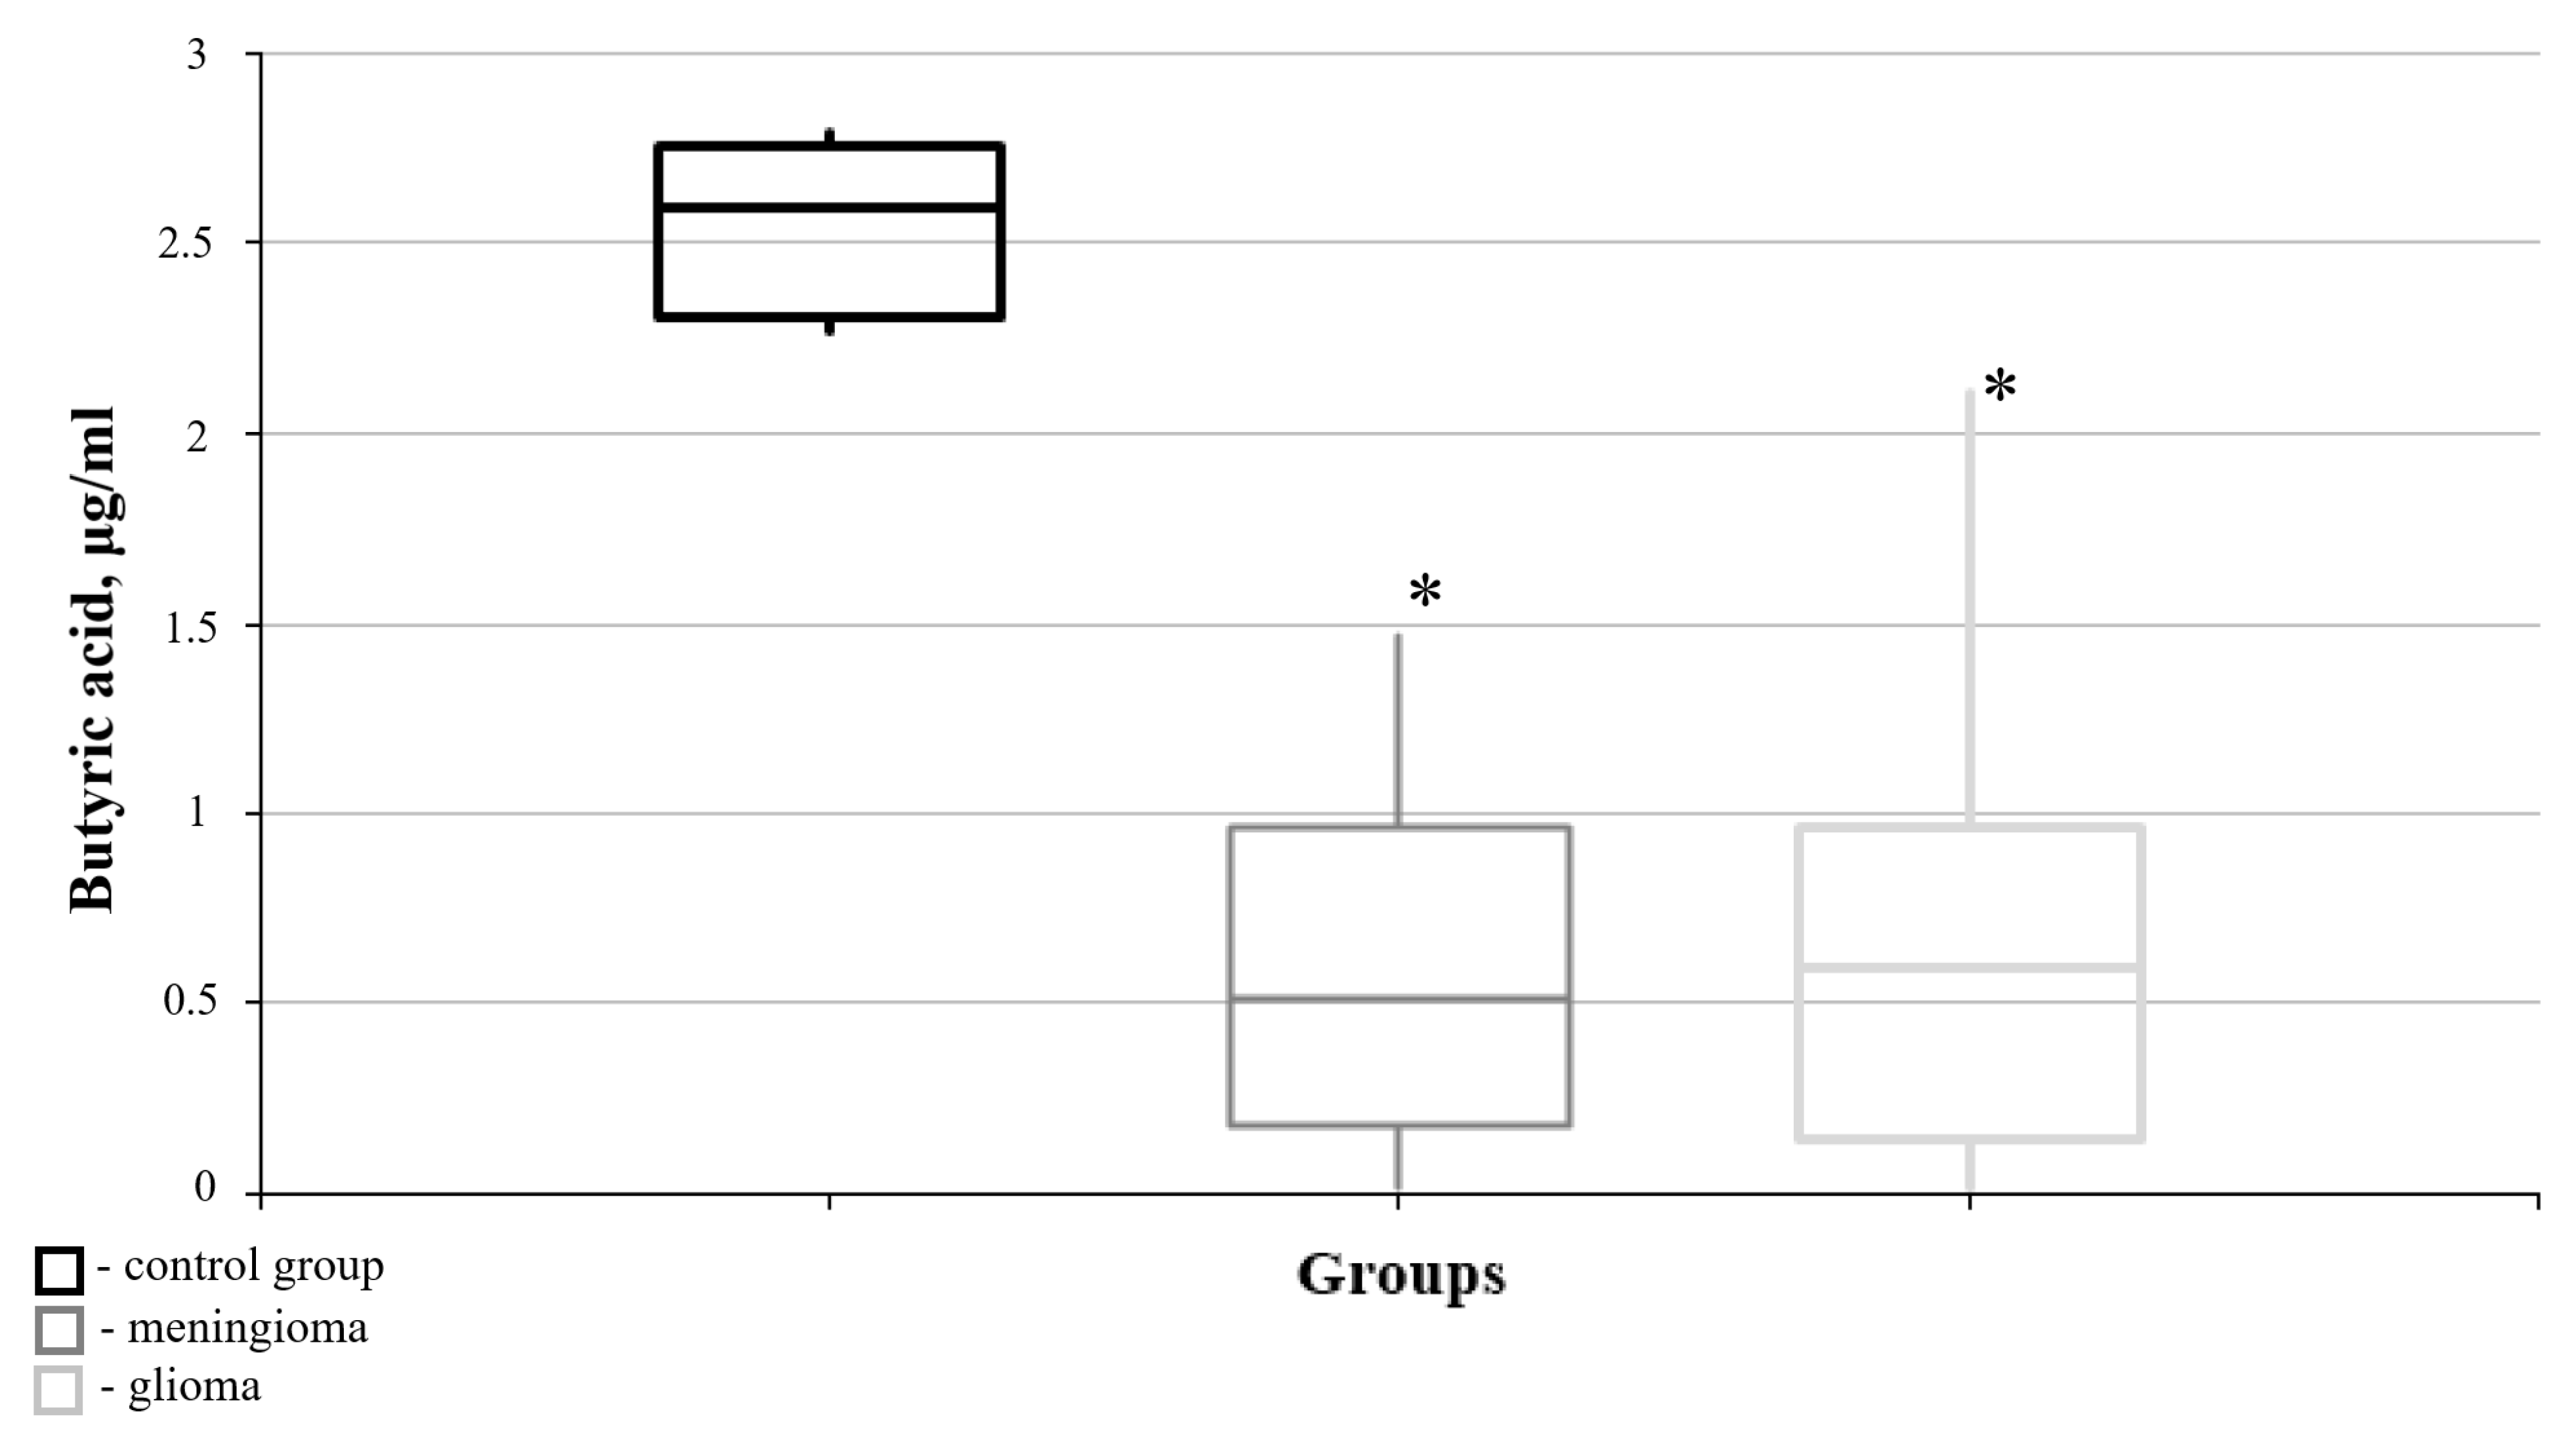
| Butyric acid | 2.592 | 2.289 | 0.515 | 0.075 | 0.014 * | 0.591 | 0.064 | 0.006 * | 0.748 |
| 2.592 | 0.515 | 0.591 | |||||||
| 2.778 | 1.303 | 1.283 | |||||||
| Succinic acid | 0.240 | 0.199 | 0.477 | 0.243 | 0.221 | 0.377 | 0.192 | 0.361 | 0.670 |
| 0.240 | 0.477 | 0.377 | |||||||
| 0.295 | 0.839 | 0.646 | |||||||
| Isovaleric acid | 0.192 | 0.116 | 0.211 | 0.019 | 1.000 | 0.272 | 0.199 | 0.272 | 0.915 |
| 0.192 | 0.211 | 0.272 | |||||||
| 0.266 | 0.581 | 0.325 | |||||||
| Valeric acid | 2.700 | 2.633 | 0.670 | 0.014 | 0.014 | 1.169 | 0.587 | 0.006 * | 0.394 |
| 2.700 | 0.670 | 1.169 | |||||||
| 2.753 | 1.292 | 1.854 | |||||||
| Maleic acid | 49.26 | 32.43 | 5.730 | 3.737 | 0.014 * | 1.906 | 0.000 | 0.360 | 0.521 |
| 49.26 | 5.730 | 1.906 | |||||||
| 61.98 | 16.01 | 143.3 | |||||||
| Glyoxylic acid | 0.390 | 0.379 | 0.944 | 0.738 | 0.014 * | 1.557 | 0.491 | 0.067 | 0.670 |
| 0.390 | 0.944 | 1.557 | |||||||
| 0.397 | 1.745 | 2.211 | |||||||
| Pyruvic acid | 5.350 | 3.916 | 2.722 | 1.965 | 0.027 * | 4.012 | 3.092 | 0.584 | 0.088 |
| 5.350 | 2.722 | 4.012 | |||||||
| 6.463 | 4.001 | 7.373 | |||||||
| Glycolic acid | 1.275 | 0.808 | 2.848 | 1.419 | 0.086 | 1.524 | 0.954 | 0.361 | 0.286 |
| 1.275 | 2.848 | 1.524 | |||||||
| 1.652 | 6.029 | 2.782 | |||||||
| Parameter of Lipid Metabolism of Blood Plasma | Statistical Parameters (Spearman’s Coefficient) | Ki-67 Marker of Cell Proliferation in Glioblastoma Material |
|---|---|---|
| Cholesterol | Rho | 0.290 |
| p | 0.191 | |
| Triacylglycerols | Rho | −0.169 |
| p | 0.478 | |
| Low-density lipoproteins | Rho | 0.155 |
| p | 0.567 | |
| High-density lipoproteins | Rho | −0.222 |
| p | 0.409 | |
| Triacylglycerols/Cholesterol | Rho | −0.524 * |
| p | 0.039 | |
| Triacylglycerols/Low-density lipoproteins | Rho | −0.412 |
| p | 0.127 | |
| Cholesterol/High-density lipoproteins | Rho | 0.536 * |
| p | 0.039 | |
| Low-density lipoproteins/High-density lipoproteins | Rho | 0.381 |
| p | 0.179 | |
| Triacylglycerols/High-density lipoproteins | Rho | 0.172 |
| p | 0.494 | |
| Cholesterol/Low-density lipoproteins | Rho | −0.014 |
| p | 0.956 | |
| Lactic acid | Rho | 0.455 |
| p | 0.137 | |
| Acetic acid | Rho | −0.158 |
| p | 0.6247 | |
| Propionic acid | Rho | −0.322 |
| p | 0.307 | |
| Isobutyric acid | Rho | 0.112 |
| p | 0.729 | |
| Butyric acid | Rho | −0.526 * |
| p | 0.044 | |
| Succinic acid | Rho | 0.388 |
| p | 0.212 | |
| Isovaleric acid | Rho | −0.123 |
| p | 0.703 | |
| Valeric acid | Rho | −0.463 |
| p | 0.130 | |
| Maleic acid | Rho | −0.358 |
| p | 0.253 | |
| Glyoxylic acid | Rho | 0.431 |
| p | 0.162 | |
| Pyruvic acid | Rho | 0.315 |
| p | 0.318 | |
| Glycolic acid | Rho | 0.237 |
| p | 0.458 | |
| Malic acid | Rho | −0.541 |
| p | 0.069 |
Disclaimer/Publisher’s Note: The statements, opinions and data contained in all publications are solely those of the individual author(s) and contributor(s) and not of MDPI and/or the editor(s). MDPI and/or the editor(s) disclaim responsibility for any injury to people or property resulting from any ideas, methods, instructions or products referred to in the content. |
© 2025 by the authors. Licensee MDPI, Basel, Switzerland. This article is an open access article distributed under the terms and conditions of the Creative Commons Attribution (CC BY) license (https://creativecommons.org/licenses/by/4.0/).
Share and Cite
Obukhova, L.; Shchelchkova, N.; Medyanik, I.; Yashin, K.; Grishin, A.; Bezvuglyak, O.; Abdullaev, I. Brain Tumor-Induced Changes in Routine Parameters of the Lipid Spectrum of Blood Plasma and Its Short-Chain Fatty Acids. Curr. Issues Mol. Biol. 2025, 47, 228. https://doi.org/10.3390/cimb47040228
Obukhova L, Shchelchkova N, Medyanik I, Yashin K, Grishin A, Bezvuglyak O, Abdullaev I. Brain Tumor-Induced Changes in Routine Parameters of the Lipid Spectrum of Blood Plasma and Its Short-Chain Fatty Acids. Current Issues in Molecular Biology. 2025; 47(4):228. https://doi.org/10.3390/cimb47040228
Chicago/Turabian StyleObukhova, Larisa, Natalia Shchelchkova, Igor Medyanik, Konstantin Yashin, Artem Grishin, Oksana Bezvuglyak, and Ilkhom Abdullaev. 2025. "Brain Tumor-Induced Changes in Routine Parameters of the Lipid Spectrum of Blood Plasma and Its Short-Chain Fatty Acids" Current Issues in Molecular Biology 47, no. 4: 228. https://doi.org/10.3390/cimb47040228
APA StyleObukhova, L., Shchelchkova, N., Medyanik, I., Yashin, K., Grishin, A., Bezvuglyak, O., & Abdullaev, I. (2025). Brain Tumor-Induced Changes in Routine Parameters of the Lipid Spectrum of Blood Plasma and Its Short-Chain Fatty Acids. Current Issues in Molecular Biology, 47(4), 228. https://doi.org/10.3390/cimb47040228