Article

ERBB2-Mutant Gastrointestinal Tumors Represent Heterogeneous Molecular Biology, Particularly in Microsatellite Instability, Tumor Mutation Burden, and Co-Mutated Genes: An In Silico Study

1
Division of Diagnostic Pathology, Kikuna Memorial Hospital, 4-4-27, Kikuna, Kohoku-ku, Yokohama 222-0011, Japan
2
Division of Pathology, Shizuoka Cancer Center, Shizuoka 411-8777, Japan
3
Department of Human Pathology, Juntendo University School of Medicine, Tokyo 113-8421, Japan
*
Author to whom correspondence should be addressed.
Curr. Issues Mol. Biol. 2023, 45(9), 7404-7416; https://doi.org/10.3390/cimb45090468
Submission received: 11 August 2023 / Revised: 9 September 2023 / Accepted: 10 September 2023 / Published: 11 September 2023
(This article belongs to the Special Issue Advances in Molecular Pathogenesis Regulation in Cancer, 2nd Edition)

Abstract

:
During recent years, activating mutations in ERBB2 have been reported in solid tumors of various organs, and clinical trials targeting ERBB2-mutant tumors have been conducted. However, no effective treatment has been established for gastrointestinal tumors targeting ERBB2 mutations. ERBB2-mutant tumors have a higher tumor mutation burden (TMB) and microsatellite instability (MSI) than ERBB2 non-mutant tumors, but not all ERBB2-mutant tumors are TMB- and MSI-high. Thus, a more detailed classification of ERBB2-mutant tumors based on the underlying molecular mechanisms is required. Herein, we classified ERBB2 mutations into three groups—group 1: both ERBB2 mutations and amplifications; group 2: ERBB2 mutations annotated as putative driver mutations but without amplifications; group 3: ERBB2 mutations annotated as non-driver mutations (passenger mutations or unknown significance) and those that were not amplified in gastrointestinal tumors. Esophageal adenocarcinoma, gastric cancer, and colorectal cancer presented significantly higher MSI and TMB in the ERBB2-mutant group than in the ERBB2-wild-type group. The proportions of TMB- and MSI-high tumors and frequency of co-mutated downstream genes differed among the groups. We identified TMB- and MSI-high groups; this classification is considered important for guiding the selection of drugs for ERBB2-mutant tumors with downstream genetic mutations.

Graphical Abstract

1. Introduction

Recently, activating mutations in ERBB2 have been reported in several solid cancers; they have been shown to play an oncogenic role similar to that of ERBB2 amplifications [1,2,3]. In the gastrointestinal tract, studies have been conducted on ERBB2-mutant gastric cancer (GC) and colorectal cancer (CRC) [4,5]; however, none have comprehensively examined ERBB2-mutant esophageal adenocarcinoma (EAC). Trastuzumab has been found to be effective against HER2-positive EAC [6], GC [7], and CRC [8,9] in clinical practice. On the contrary, trastuzumab deruxtecan (DS-8201a) has been shown to be effective for ERBB2-mutant non-small-cell lung cancer [10]. However, there are no known effective treatments for ERBB2-mutant EAC, GC, and CRC. Therefore, in this study, we focused on the gastrointestinal tumors (EAC, GC, and CRC).
Candidate therapeutic agents targeting ERBB2 kinase activity include monoclonal antibodies, antibody–drug conjugates, and small-molecule tyrosine kinase inhibitors. Although there are several clinical trials of drugs targeting ERBB2-mutant tumors with accumulating data, research on targeting ERBB2 mutations for cancer treatment has been slow owing to their low mutation frequency, insufficient understanding of their biological activity, and difficulty in detection [11]. In addition, drug susceptibility of cancer varies with ERBB2 mutations [12], and identifying individual ERBB2 mutations to develop effective targeted treatments is difficult. ERBB2-mutant tumors have a higher microsatellite instability (MSI) [13] and tumor mutation burden (TMB) than ERBB2 non-mutant tumors [1,2,5,14], suggesting that immune checkpoint inhibitors may be useful against ERBB2-mutant tumors [2,5,13]. However, not all ERBB2-mutant tumors in previous studies were MSI- and TMB-high [1,2,5,13,14]. In addition, previous studies have suggested that drug sensitivity or resistance can be attributed to the changes in downstream or parallel oncogenic pathways rather than the mutations themselves [3]. Considering the drug sensitivity, microsatellite (MS) status, and TMB, ERBB2-mutant tumors are regarded as heterogeneous.
Here, we aimed to determine whether heterogeneous ERBB2-mutant tumors can be appropriately classified by biological features (clinicopathologic features, MS status, TMB, and co-mutated genes) to facilitate the selection of an appropriate treatment plan using bioinformatic methods. Furthermore, we discuss whether this classification would lead to effective therapies that consider the biological and co-mutated genetic characteristics of each group.

2. Materials and Methods

2.1. Data Collection of EAC, GC, and CRC Cases

Genomic and clinical data were collected from EAC, GC, and colorectal adenocarcinoma tumor cases using cBioPortal. Specifically, data from The Cancer Genome Atlas (TCGA) Pan-Cancer Atlas dataset (EAC) [15] and Memorial Sloan Kettering (MSK) dataset (esophagogastric cancer) [16] (n = 87 and 228, respectively) were obtained. Additionally, data from TCGA Pan-Cancer Atlas [15] and the OncoSG dataset [17] (n = 440 and 147, respectively) were collected for stomach adenocarcinoma, and data from TCGA Pan-Cancer Atlas [15] and the MSK dataset [18] (n = 594 and 471, respectively) were collected for colorectal adenocarcinoma. Next, samples from patients with EAC, stomach adenocarcinoma, and colorectal adenocarcinoma were divided into two groups each: those with ERBB2-mutant (n = 22, 38, and 39, respectively) and ERBB2 non-mutant (n = 293, 549, and 1026, respectively) tumors.
ERBB2 mutation sites were classified as follows: receptor-L domain, furin-like cysteine-rich domain, growth factor receptor domain, transmembrane domain, juxtamembrane domain-A, juxtamembrane domain-B, kinase domain, and C-terminal region. The distribution of genetic mutation sites in each carcinoma group is summarized in Table S1. The pathological significance of each ERBB2 mutation was assessed using the OncoKB database (Table S2) [19].

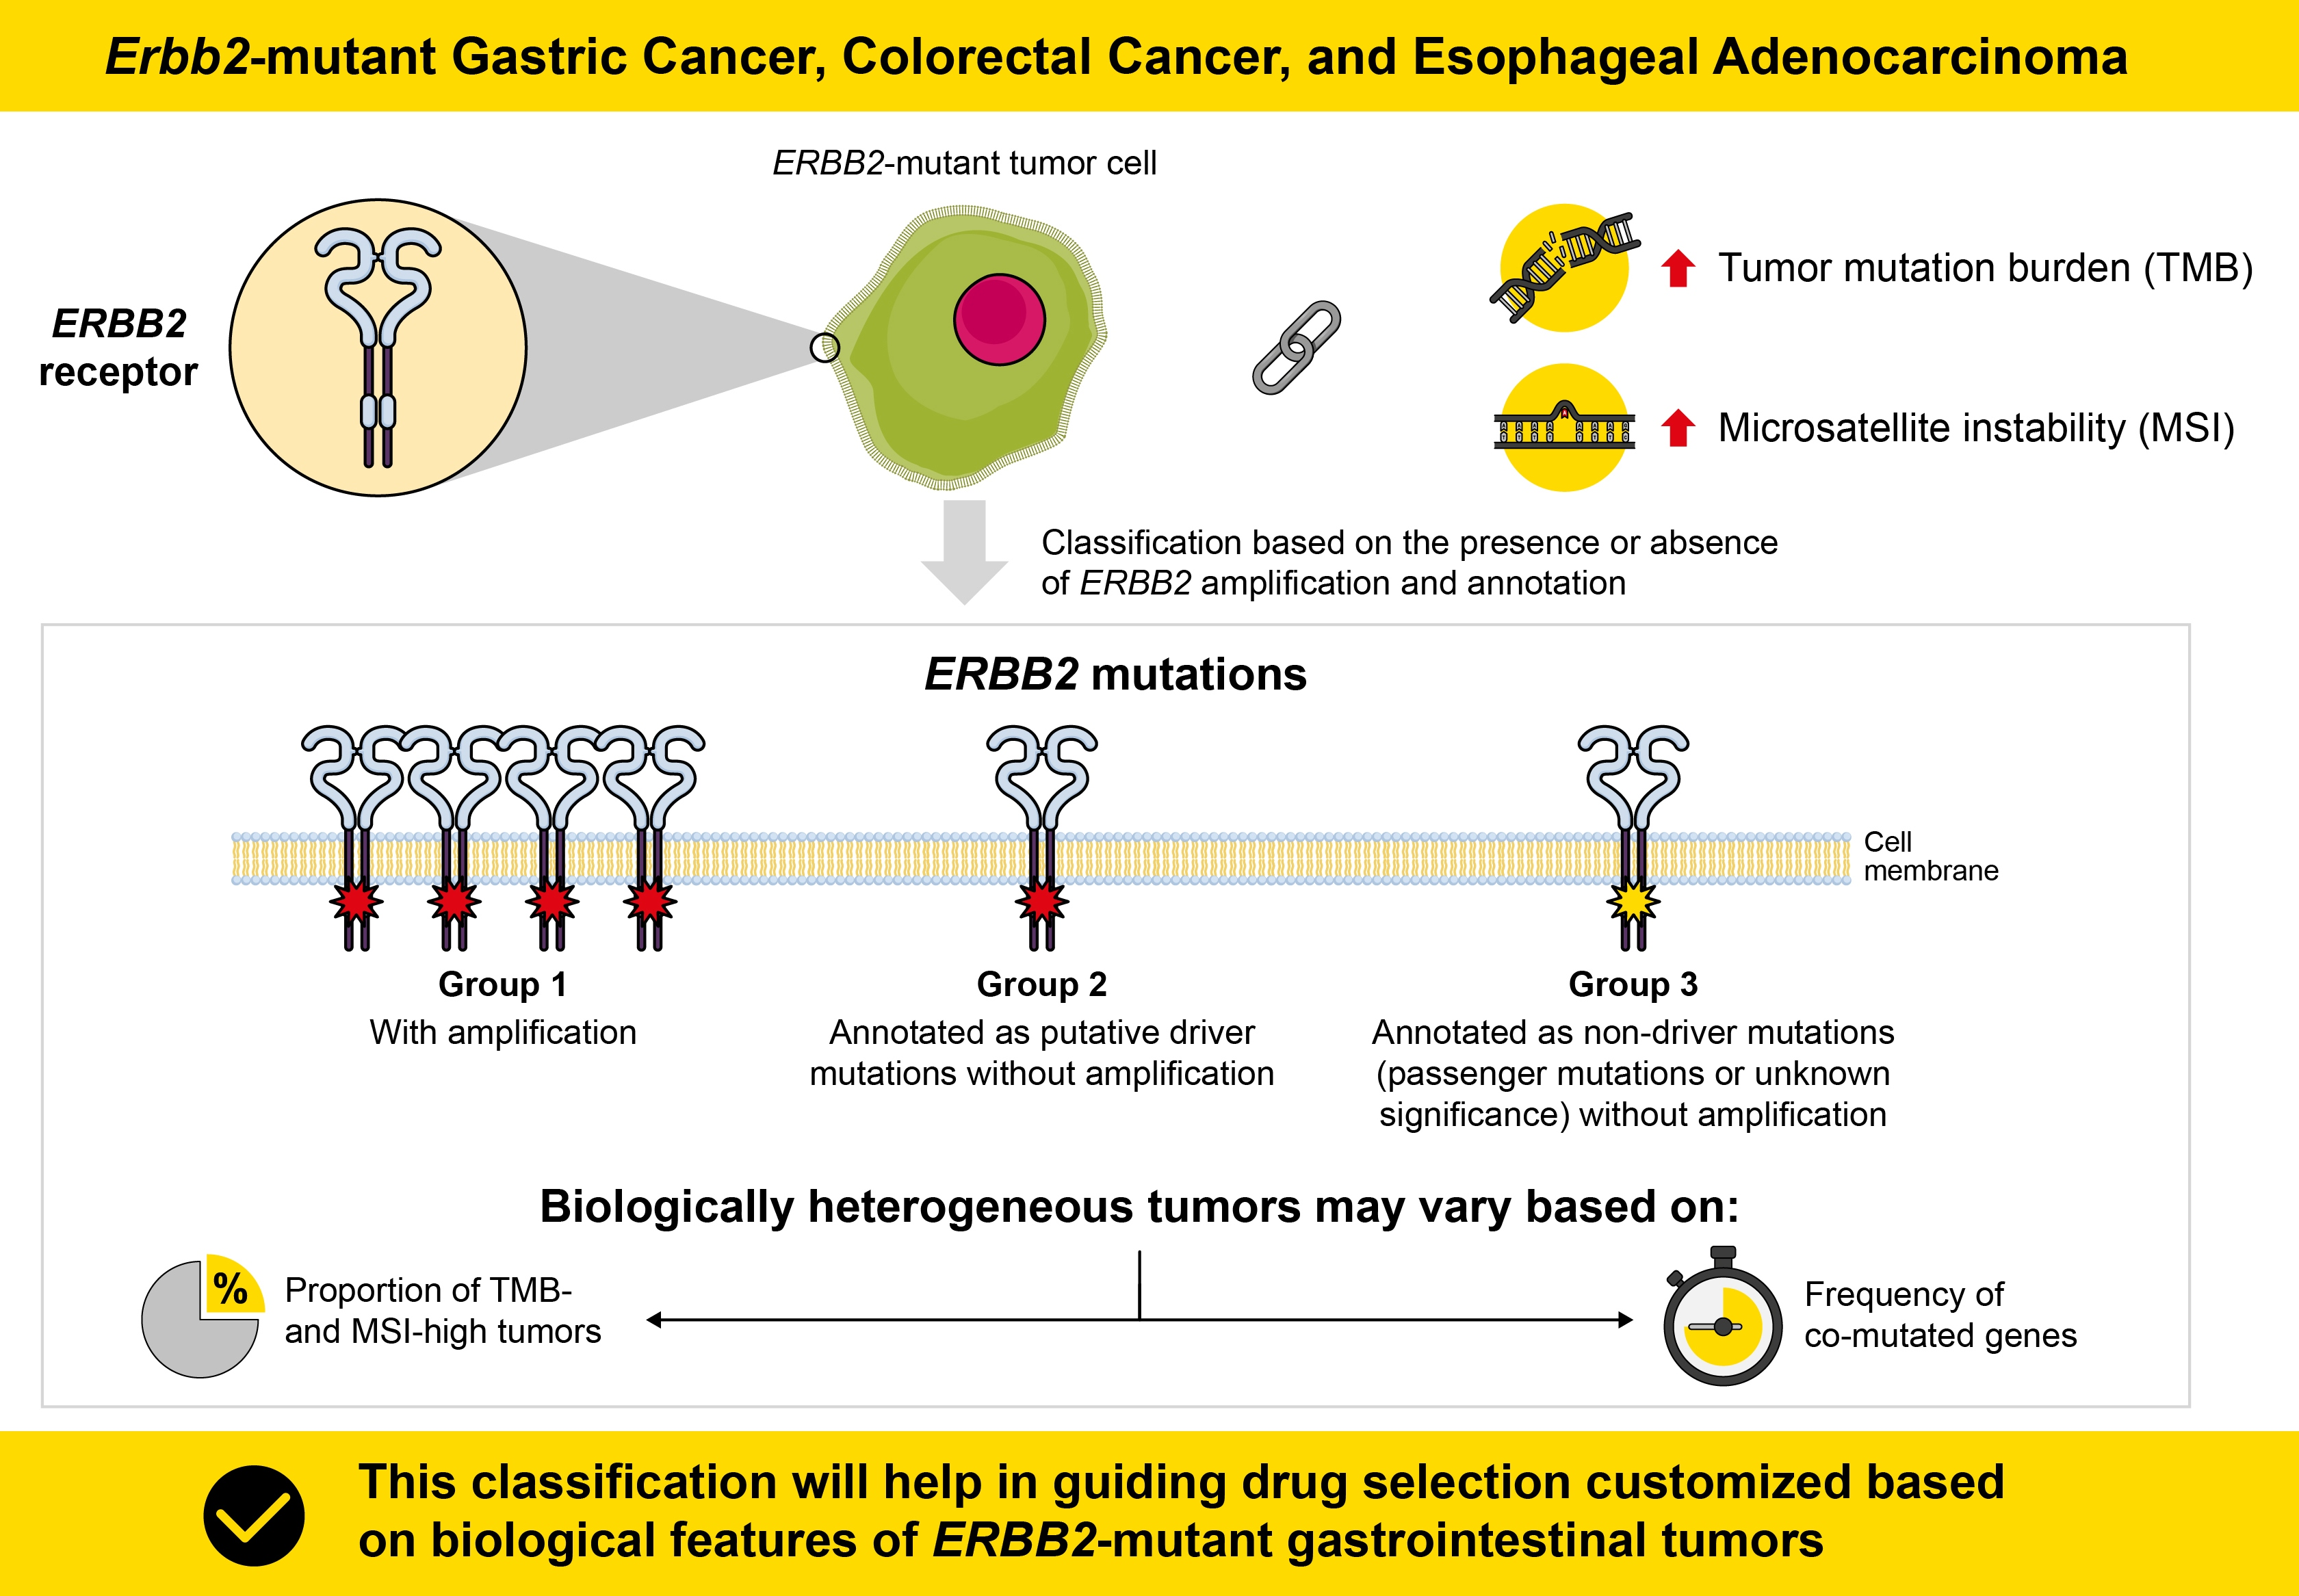
2.2. Molecular Subtype Classification

Molecular subtypes of EAC, GC, and CRC were determined on the basis of a previous study [20]. Using data from cBioPortal, five subtypes were identified: chromosomal instability (CIN), genome stability (GS), MSI, POLE, and Epstein–Barr virus (EBV). Specifically, EAC and CRC were classified into four types each—CIN, GS, MSI, and POLE—whereas GC was classified into five types—CIN, GS, MSI, POLE, and EBV.

2.3. MSI Analysis

For samples from TCGA Pan-Cancer Atlas, the MS status was assessed using an MSI sensor, a computational algorithm that analyzes sequencing reads at designated MS regions in tumor–normal tissue pairs, reporting the percentage of unstable loci as a cumulative score [21,22]. MSIsensor scores ≥10 are defined as MSI-H, scores ≥3 to 10 are defined as MSI-intermediate (MSI-I), and scores <3 are defined as microsatellite stability (MSS). In the esophagogastric cancer (MSK) and CRC (MSK) datasets, the MS status was divided into stable, indeterminate, and unstable. Therefore, in this study, MS status was categorized into MSS, MSI-I, and MSI-H. Information regarding the MS status was not available in the OncoSG dataset.

2.4. TMB Estimation

TMB is a measure of the total number of mut/Mb of the tumor tissue. It can also be interpreted as the mutation density in tumor genes, defined as the average number of mutations in the tumor genome, including the total number of coding sequence errors, base substitutions, insertions, or deletions. Information on TMB was obtained from all datasets. EAC and GC samples were classified as TMB-high if they had ≥10 mut/Mb and TMB-low if they had <10 mut/Mb [23]. In CRC, TMB ≥ 16 mut/Mb was classified as TMB-high, and TMB < 16 mut/Mb was classified as TMB-low [24,25].

2.5. Comparison of MS Status and TMB between ERBB2-Mutant and ERBB2-Wild-Type EAC, GC, and CRC

We conducted a comparative analysis of MSS, MSI-I, and MSI-H ratios between the ERBB2-mutant and ERBB2-non-mutant groups of EAC, GC, and CRC. Additionally, we compared the TMB of each cancer, as well as the TMB-low to TMB-high ratio between the ERBB2-mutant and ERBB2-non-mutant groups.

2.6. Comparison of Clinicopathological and Molecular Features among the Three Groups Each of EAC, GC, and CRC

EAC, GC, and CRC samples with ERBB2 mutations were categorized into three groups each on the basis of OncoKB annotation and amplification status. Group 1 included samples with both ERBB2 mutations and amplifications, group 2 comprised samples with ERBB2 mutations annotated as putative driver mutations by OncoKB but without amplifications, and group 3 consisted of samples evaluated as non-driver mutations (passenger mutations or unknown significance) by OncoKB and those that were not amplified. We compared the clinicopathological and molecular characteristics of each of the three groups.
For EAC samples, information on age (mean), sex distribution, histological grade, and molecular subtype was sourced from cBioPortal for the respective cancer types. Cases for which stage information was not available were designated as “N/A” and excluded from percentage calculations. However, age information was not available for the esophagogastric cancer dataset (MSK).
Similarly, for GC samples, information on clinicopathological characteristics, age (mean), sex distribution, histological grade, and molecular subtype was obtained from cBioPortal. For certain variables, including age, sex, histological grade, and molecular subtype, information was not available in some cases, and these were designated as “N/A”. These cases were excluded from percentage calculations.
For CRC samples, information on clinicopathological characteristics, age (mean), sex distribution, histological grade, and molecular subtype was obtained from cBioPortal. Information regarding molecular subtypes was not available in the colorectal adenocarcinoma dataset (MSK). The MS status and TMB were categorized as described above for each cancer type.

2.7. Analysis of ERBB2 Amplifications and Mutations in Signaling Pathways in EAC, GC, and CRC Samples and Comparison of the Frequencies of Genetic Variants in Each Group

We used cBioPortal to investigate the following signaling pathway genetic mutations in EAC, GC, and CRC samples: RTK signaling (ERBB2, ERBB3, ERBB4, EGFR, and NTRK3), WNT/β-catenin signaling (APC, CTNNB1, and RNF43), TGF-β signaling (SMAD4), PIK/MTOR signaling (PTEN, TSC1, and mTOR), RAS/RAF/MAPK signaling (KRAS, NRAS, NF1, and BRAF), mismatch repair (POLE, MSH2, PMS2, and MSH6), homologous recombination (BRCA2, ATM, PARP1, and RAD50), epigenetic modifiers (ADID1A, KMT2C, and KMT2D), cell cycle (TP53), and ERBB2 amplifications. The detected genetic alterations were visualized using Oncoprinter on cBioPortal. The number of mutations in each group was compared. All datasets only showed somatic mutations, and germline line mutations were not examined. Patients with Lynch syndrome may have been includincludeded.

2.8. Statistical Analysis

We tested the normality of continuous variables (TMB) using the Kolmogorov–Smirnov test in ERBB2-mutant EAC, GC, and CRC and ERBB2-wild-type EAC, GC, and CRC; no normality was confirmed in any of the cases. Therefore, the TMB in ERBB2-mutant and ERBB2-non-mutant samples was analyzed using the Mann–Whitney U test. The MS status and TMB in ERBB2-mutant and ERBB2-non-mutant samples were analyzed using chi-square. The clinicopathological and molecular features of groups 1, 2, and 3 of EAC, GC, and CRC were analyzed using Fisher’s exact test. The normality of the TMB values of the EAC, GC, and CRC groups was also verified using the Kolmogorov–Smirnov test. Considering the results of the test and the sample size, the TMB of groups 1, 2, and 3 of EAC, GC, and CRC was analyzed using Kruskal–Wallis test. Steel–Dwass post-test correction was used to reduce the likelihood of false positives. Statistical significance was set at p < 0.05. All statistical analyses were performed using EZR software (version 1.55) [26].

3. Results

3.1. Comparison of MS Status and TMB between ERBB2-Mutant and ERBB2-Wild-Type EAC, GC, and CRC

EAC, GC, and CRC presented significantly higher MSI and TMB in the ERBB2-mutant group than in the ERBB2-wild-type group (p < 0.05) (Table 1, Figure 1). In patients with GC and CRC, the proportions of TMB-high tumors were significantly higher in the ERBB2-mutant group than in the ERBB2-wild-type group (p < 0.05), whereas, in patients with EAC, no significant difference was found between the groups (p = 0.11). In contrast, regarding the MS status, 17 cases (77.3%) of ERBB2-mutant EAC showed MSS; 17 cases (77.3%) were also TMB-low. Fourteen cases (56%) of GC showed MSS, and 17 cases (44.7%) were TMB-low. Twenty-nine cases (74.4%) of CRC showed MSS, and 26 cases (66.7%) were TMB-low.

3.2. Classification of ERBB2-Mutant EAC, GC, and CRC and Clinicopathological Features of the Groups

We identified 21 samples of ERBB2-mutant EAC among 315 EAC samples (7.0%); 8/315 (2.5%) had coexisting ERBB2 mutations and amplifications. ERBB2 mutations were found in 38 of 587 GC cases (6.9%) and 4/587 (0.7%) cases had both ERBB2 mutations and amplifications. ERBB2 mutations were found in 39 of 1065 CRC cases (3.7%), and 6/1065 (0.6%) cases had coexisting mutations and amplifications. EAC, GC, and CRC were divided into three groups: group 1 comprised samples with both ERBB2 mutations and amplifications, group 2 comprised samples with ERBB2 mutations annotated as putative driver mutations by OncoKB but without amplifications, and group 3 consisted of samples evaluated as non-driver mutations (passenger mutations or unknown significance) by OncoKB and those that were not amplified. The 21 ERBB2-mutant EACs, 38 ERBB2-mutant GCs, and 39 ERBB2-mutant CRCs were divided into groups 1 (n = 8, 4, 6, respectively), 2 (n = 9, 25, 16, respectively), and 3 (n = 5, 9, 17, respectively).
For EAC (Table 2), both groups 1 and 3 showed 100% MSS and TMB-low tumors, whereas the proportion of both MSI- and TMB-high tumors was 55.6% in group 2. The MS status and proportions of TMB-low and -high tumors were significantly different among the groups (p < 0.05). Although the mean TMB value did not show a significant difference among the groups (p > 0.05), group 2 had a higher mean TMB than the other groups, and groups 1 and 2 showed significant differences (p < 0.05) (Figure 2a).
For GC (Table 3), group 2 showed a high proportion (73.3%) of grade 3 tumors (p < 0.05). The TMB values of groups 2 and 3 were higher than those of group 1 and differed significantly among the three groups (p < 0.05); significant differences in TMB were also found between groups 1 and 3 (p < 0.05) (Figure 2b). The proportions of TMB-high and TMB-low tumors were also higher in groups 2 and 3 than in group 1 (p < 0.05).
For CRC (Table 4), group 3 had the highest number of MSI-type subtypes (54.5%), whereas groups 1 and 2 had the highest number of CIN-type subtypes, with a significant difference among the three groups (p < 0.05). Group 1 showed 100% MSS, group 2 showed 87.5% MSS, and group 3 had 47.1% MSI-high tumors, with a significant difference among the groups. Group 3 also had the highest mean TMB value of 78.5 mutations per megabase (mut/Mb); TMB was significantly different among groups 1, 2, and 3 (p < 0.05) (Figure 2c). The proportion of TMB-low tumors was 100% in groups 1 and 2, whereas that of TMB-high tumors was 76.5% in group 3, showing a significant difference among the three groups and between groups 1 and 2.

3.3. Genomic Landscape of Somatic Mutations and Comparison of Somatic Mutations among the EAC, GC, and CRC Groups

Oncoplots summarizing all gene names, as well as the presence/absence, types, and frequency of mutations for each group within the EAC, GC, and CRC groups, are shown in Figure 3.
The oncoplot showed fewer co-mutations in group 1 than in groups 2 and 3 of EAC, GC, and CRC. In EAC, the mutation rate of MAPK pathway genes downstream to ERBB2 was 25.0% in group 1, 55.6% in group 2, and 0% in group 3, whereas that of PI3K/MTOR pathway genes was 0% in group 1, 11.1% in group 2, and 20.0% in group 3. In GC, the mutation rate of MAPK pathway genes was 0% in group 1, 40.0% in group 2, and 44.4% in group 3, whereas that of PI3K/MTOR pathway genes was 0% in group 1, 36.0% in group 2 and 22.2% in group 3. In CRC, the mutation rate of MAPK pathway genes was 16.7% in group 1, 25.0% in group 2, and 76.5% in group 3, whereas that of PI3K/MTOR pathway genes was 33.3% in group 1, 62.5% in group 2, and 70.6% in group 3. The proportion of PI3K/MTOR pathway gene mutations to varying degrees was 33.3% in group 1, 62.5% in group 2, and 70.6% in group 3 (Table 5).
Genetic variations for each tumor group and the results of statistical analysis among the groups are summarized in Table S3.

4. Discussion

In this study, we first compared ERBB2-mutant and ERBB2-non-mutant EAC, GC, and CRC in terms of MS status and TMB using public databases. The ERBB2-mutant group had significantly more MSI- and TMB-high tumors than the ERBB2-non-mutant group of EAC, GC, and CRC. This result is consistent with that of previous studies [5,13]. As further classification to accurately identify MSI- and TMB-high groups was considered important for the detection of immune checkpoint inhibitor indications in ERBB2-mutant tumors, we divided the tumors into three groups according to the presence or absence of ERBB2 amplifications and annotation content. Although ERBB2 amplifications and mutations are thought to be mutually exclusive [27,28], in this study, we identified cases of EAC (8/315, 2.5%), GC (4/587, 0.7%), and CRC (6/1065, 0.6%) with simultaneous amplifications and mutations, but at a low frequency. For EAC, the MS status and frequency of TMB-low and -high tumors among the three groups were significantly different. In particular, all patients in groups 1 and 3 had low MSS and a low proportion of TMB-low tumors. For GC, G3 histological grade was more frequently observed in group 2, and it differed significantly among the three groups. Groups 2 and 3 had similar distributions of MS status, mean TMB, and proportions of TMB-low and -high tumors, and, in group 1, all patients had MSS and TMB-low tumors. For CRC, MSI and polymerase epsilon (POLE) subtype were significantly more common in group 3. In addition, the distribution of MS status, average TMB, and proportions of TMB-low and -high tumors showed significant differences among the three groups. For CRC, all patients in group 1 had MSS and TMB-low tumors, whereas, in group 2, one patient (6.3%) presented as MSI-high, and all patients had TMB-low tumors.
We found that the percentages of MSI- and TMB-high tumors were significantly different in each of the three groups of EAC, GC, and CRC. This finding indicates that these three groups are biologically distinct. The division into three groups allowed us to classify the heterogeneous groups to some extent in terms of MSI- and TMB-high. Group 2 of EAC, groups 2 and 3 of GC, and group 3 of CRC had high percentages of MSI- and TMB-high tumors. MSI- and TMB-high are biomarkers of immune checkpoint inhibitor indication [29,30], and this classification scheme allowed us to identify patients with ERBB2-mutant tumors who could be candidates for treatment with immune checkpoint inhibitors.
Additionally, we analyzed 28 cancer-associated genetic variants with ERBB2 mutations. Notably, the ERBB2 mutations in EAC, GC, and CRC were genetically heterogeneous, with substantial diversity in the co-mutation patterns among carcinomas and within groups. Group 1 had a few comorbid genetic mutations, whereas groups 2 and 3 often presented mutations in other cancer-related genes. Targeting ERBB2 amplifications and mutations, as in group 1 in this study, a previous study demonstrated the efficacy of trastuzumab [7], with other reports of clinical efficacy [31,32,33]. This may be because, in general, group 1 had fewer concomitant mutations in downstream genes. In contrast, co-mutations were often observed in MAPK and PI3K/MTOR pathway genes downstream of ERBB2 in groups 2 and 3 of GC and CRC, respectively. These results showed that the mutation status of cancer-related genes in the PI3K/MTOR and MAPK pathways differed among EAC, GC, and CRC, and among the three groups. A gain-of-function mutation in a downstream gene (signal), such as the PI3K/MTOR or MAPK signal targeting only the ERBB2 mutation, may not stop the entire signal, resulting in reduced sensitivity to the drug. In previous studies, PIK3CA mutations were found in 21.4% of ERBB2-mutant tumors [34] and 23.8% of ERBB2-mutant CRC [5], which, along with our results, suggests that PIK3CA is a relatively common gene co-mutated with ERBB2. In ERBB2-amplified tumors, PIK3CA mutations render anti-HER2 therapy less effective [35], although dual inhibition of ERBB2 and PIK3CA expression has been reported to overcome resistance to therapy [36]. Furthermore, in breast cancer, mutations in MAPK pathway genes have been shown to impart resistance to anti-HER2 therapy but not to treatment with MEK/ERK inhibitors. Thus, PI3K/MTOR and MEK/ERK inhibitors may exert antitumor effects even in ERBB2-mutant tumors when downstream mutations are present [37]. Although ERBB2 mutations are independent biomarkers for chemotherapy, their clinical application is limited because of variability in the therapeutic response to single agents [11].
In this study, ERBB2-mutant gastrointestinal tumors (EAC, GC, and CRC) were classified into three groups. The MSI and TMB were different in each group, and the co-mutation patterns of cancer-related genes were also different. In particular, the PI3K/MTOR and MAPK pathways, which are downstream of ERBB2, also showed different mutation rates among the groups. The results of this study suggest that, as ERBB2 mutations are biologically heterogeneous, it is important to consider immune checkpoint inhibitors in groups with high MSI and TMB, or dual inhibition that also inhibits downstream mutations in groups with downstream mutations, rather than targeting ERBB2 mutations alone.
Our study had certain limitations. First, the percentages calculated in this study may not be accurate as we used different datasets, the data for some of the tested characteristics were not available (N/A), and, for some categories, data were not available in several instances. Second, we categorized heterogeneous ERBB2-mutant tumor groups into three groups, each of which was found to have distinct biological characteristics. Furthermore, the appropriate treatment for each group was discussed on the basis of biological characteristics and co-mutated genes of the downstream signaling pathways of ERBB2. However, as this study was based on bioinformatics analyses, further investigation is needed using wet laboratory studies and actual clinical trials to validate this classification method. Third, the number of cases was low in some datasets; however, multiple datasets were used, which may have overridden this limitation to some extent. Lastly, the current study included the three gastrointestinal tumors (EAC, GC, and CRC) in the same analysis, reporting that they behaved differently. Therefore, EAC, GC, and CRC must be studied individually in the future.

5. Conclusions

In this study, we classified the ERBB2 mutations in EAC, GC, and CRC into three groups each. The pattern of co-mutation of cancer-related genes varied among carcinomas and the groups, with group 1 showing a low frequency of co-mutated genes in all carcinomas and groups 2 and 3 showing varying degrees of mutations in MAPK and PI3K/MTOR pathway genes downstream to ERBB2. ERBB2-mutant tumors in this study could be classified into three groups from a biological point of view, with different frequencies of co-mutated genes and different percentages of TMB- and MSI-high. In summary, ERBB2-mutant tumors proved to be biologically heterogeneous. In the future, treatment methods may be tailored to the biological features of ERBB2-mutant tumors, and such classification may contribute to the development of more effective therapies for ERBB2-mutant gastrointestinal tumors.

Supplementary Materials

The following supporting information can be downloaded at https://www.mdpi.com/article/10.3390/cimb45090468/s1: Table S1. Mutation types and annotation results for ERBB2 mutations in EAC, GC, and CRC; Table S2. Summary of ERBB2 mutation sites in the three groups of EAC, GC, and CRC; Table S3. Mutation frequencies of cancer-related genes in the groups with EAC, GC, and CRC and results of statistical analysis.

Author Contributions

Conceptualization, S.U. and T.S.; formal analysis, S.U.; writing—original draft preparation, S.U. and T.S. All authors have read and agreed to the published version of the manuscript.

Funding

This research received no external funding.

Institutional Review Board Statement

Not applicable.

Informed Consent Statement

Not applicable.

Data Availability Statement

The datasets generated and/or analyzed in this study are available from the corresponding author on reasonable request.

Conflicts of Interest

The authors declare no conflict of interest.

References

  1. Hyman, D.M.; Piha-Paul, S.A.; Won, H.; Rodon, J.; Saura, C.; Shapiro, G.I.; Juric, D.; Quinn, D.I.; Moreno, V.; Doger, B.; et al. HER kinase inhibition in patients with HER2- and HER3-mutant cancers. Nature 2018, 554, 189–194. [Google Scholar] [CrossRef] [PubMed]
  2. Wang, H.; Miao, J.; Wen, Y.; Xia, X.; Chen, Y.; Huang, M.; Chen, S.; Zhao, Z.; Zhang, Y.; Chen, C.; et al. Molecular landscape of ERBB2 alterations in 14,956 solid tumors. Pathol. Oncol. Res. 2022, 28, 1610360. [Google Scholar] [CrossRef] [PubMed]
  3. Connell, C.M.; Doherty, G.J. Activating HER2 mutations as emerging targets in multiple solid cancers. ESMO Open 2017, 2, e000279. [Google Scholar] [CrossRef] [PubMed]
  4. Park, S.; Ahn, S.; Kim, D.G.; Kim, H.; Kang, S.Y.; Kim, K.M. High frequency of juxtamembrane domain ERBB2 mutation in gastric cancer. Cancer Genom. Proteom. 2022, 19, 105–112. [Google Scholar] [CrossRef] [PubMed]
  5. Ross, J.S.; Fakih, M.; Ali, S.M.; Elvin, J.A.; Schrock, A.B.; Suh, J.; Vergilio, J.A.; Ramkissoon, S.; Severson, E.; Daniel, S.; et al. Targeting HER2 in colorectal cancer: The landscape of amplification and short variant mutations in ERBB2 and ERBB3. Cancer 2018, 124, 1358–1373. [Google Scholar] [CrossRef]
  6. Janjigian, Y.Y.; Sanchez-Vega, F.; Jonsson, P.; Chatila, W.K.; Hechtman, J.F.; Ku, G.Y.; Riches, J.C.; Tuvy, Y.; Kundra, R.; Bouvier, N.; et al. Genetic predictors of response to systemic therapy in esophagogastric cancer. Cancer Discov. 2018, 8, 49–58. [Google Scholar] [CrossRef]
  7. Bang, Y.J.; Van Cutsem, E.; Feyereislova, A.; Chung, H.C.; Shen, L.; Sawaki, A.; Lordick, F.; Ohtsu, A.; Omuro, Y.; Satoh, T.; et al. Trastuzumab in combination with chemotherapy versus chemotherapy alone for treatment of HER2-positive advanced gastric or gastro-oesophageal junction cancer (ToGA): A phase 3, open-label, randomised controlled trial. Lancet 2010, 376, 687–697. [Google Scholar] [CrossRef]
  8. Nakamura, Y.; Okamoto, W.; Kato, T.; Esaki, T.; Kato, K.; Komatsu, Y.; Yuki, S.; Masuishi, T.; Nishina, T.; Ebi, H.; et al. Circulating tumor DNA-guided treatment with pertuzumab plus trastuzumab for HER2-amplified metastatic colorectal cancer: A phase 2 trial. Nat. Med. 2021, 27, 1899–1903. [Google Scholar] [CrossRef]
  9. Sartore-Bianchi, A.; Trusolino, L.; Martino, C.; Bencardino, K.; Lonardi, S.; Bergamo, F.; Zagonel, V.; Leone, F.; Depetris, I.; Martinelli, E.; et al. Dual-targeted therapy with trastuzumab and lapatinib in treatment-refractory, KRAS codon 12/13 wild-type, HER2-positive metastatic colorectal cancer (HERACLES): A proof-of-concept, multicentre, open-label, phase 2 trial. Lancet Oncol. 2016, 17, 738–746. [Google Scholar] [CrossRef]
  10. Li, B.T.; Smit, E.F.; Goto, Y.; Nakagawa, K.; Udagawa, H.; Mazières, J.; Nagasaka, M.; Bazhenova, L.; Saltos, A.N.; Felip, E.; et al. Trastuzumab deruxtecan in HER2-mutant non-small-cell lung cancer. N. Engl. J. Med. 2022, 386, 241–251. [Google Scholar] [CrossRef]
  11. Subramanian, J.; Katta, A.; Masood, A.; Vudem, D.R.; Kancha, R.K. Emergence of ERBB2 mutation as a biomarker and an actionable target in solid cancers. Oncologist 2019, 24, e1303–e1314. [Google Scholar] [CrossRef] [PubMed]
  12. Nagano, M.; Kohsaka, S.; Ueno, T.; Kojima, S.; Saka, K.; Iwase, H.; Kawazu, M.; Mano, H. High-throughput functional evaluation of variants of unknown significance in ERBB2. Clin. Cancer Res. 2018, 24, 5112–5122. [Google Scholar] [CrossRef]
  13. Loree, J.M.; Bailey, A.M.; Johnson, A.M.; Yu, Y.; Wu, W.; Bristow, C.A.; Davis, J.S.; Shaw, K.R.; Broaddus, R.; Banks, K.C.; et al. Molecular landscape of ERBB2/ERBB3 mutated colorectal cancer. J. Natl. Cancer Inst. 2018, 110, 1409–1417. [Google Scholar] [CrossRef]
  14. Uchida, S.; Kojima, T.; Sugino, T. Clinicopathological features, tumor mutational burden and tumour-infiltrating lymphocyte interplay in erbb2-mutated breast cancer: In silico analysis. Pathol. Oncol. Res. 2021, 27, 633243. [Google Scholar] [CrossRef] [PubMed]
  15. Hoadley, K.A.; Yau, C.; Hinoue, T.; Wolf, D.M.; Lazar, A.J.; Drill, E.; Shen, R.; Taylor, A.M.; Cherniack, A.D.; Thorsson, V.; et al. Cell-of-origin patterns dominate the molecular classification of 10,000 tumors from 33 types of cancer. Cell 2018, 173, 291–304.e6. [Google Scholar] [CrossRef] [PubMed]
  16. Sihag, S.; Nussenzweig, S.C.; Walch, H.S.; Hsu, M.; Tan, K.S.; De La Torre, S.; Janjigian, Y.Y.; Maron, S.B.; Ku, G.Y.; Tang, L.H.; et al. The role of the TP53 pathway in predicting response to neoadjuvant therapy in esophageal adenocarcinoma. Clin. Cancer Res. 2022, 28, 2669–2678. [Google Scholar] [CrossRef]
  17. Guo, Y.A.; Chang, M.M.; Huang, W.; Ooi, W.F.; Xing, M.; Tan, P.; Skanderup, A.J. Mutation hotspots at CTCF binding sites coupled to chromosomal instability in gastrointestinal cancers. Nat. Commun. 2018, 9, 1520. [Google Scholar] [CrossRef]
  18. Mondaca, S.; Walch, H.; Nandakumar, S.; Chatila, W.K.; Schultz, N.; Yaeger, R. Specific mutations in APC, but not alterations in DNA damage response, associate with outcomes of patients with metastatic colorectal cancer. Gastroenterology 2020, 159, 1975–1978.e4. [Google Scholar] [CrossRef]
  19. Chakravarty, D.; Gao, J.; Phillips, S.M.; Kundra, R.; Zhang, H.; Wang, J.; Rudolph, J.E.; Yaeger, R.; Soumerai, T.; Nissan, M.H.; et al. OncoKB: A precision oncology knowledge base. JCO Precis. Oncol. 2017, 2017, PO.17.00011. [Google Scholar] [CrossRef]
  20. Liu, Y.; Sethi, N.S.; Hinoue, T.; Schneider, B.G.; Cherniack, A.D.; Sanchez-Vega, F.; Seoane, J.A.; Farshidfar, F.; Bowlby, R.; Islam, M.; et al. Comparative molecular analysis of gastrointestinal adenocarcinomas. Cancer Cell 2018, 33, 721–735.e8. [Google Scholar] [CrossRef]
  21. Niu, B.; Ye, K.; Zhang, Q.; Lu, C.; Xie, M.; McLellan, M.D.; Wendl, M.C.; Ding, L. MSIsensor: Microsatellite instability detection using paired tumor-normal sequence data. Bioinformatics 2014, 30, 1015–1016. [Google Scholar] [CrossRef] [PubMed]
  22. Latham, A.; Srinivasan, P.; Kemel, Y.; Shia, J.; Bandlamudi, C.; Mandelker, D.; Middha, S.; Hechtman, J.; Zehir, A.; Dubard-Gault, M.; et al. Microsatellite instability is associated with the presence of Lynch syndrome pan-cancer. J. Clin. Oncol. 2019, 37, 286–295. [Google Scholar] [CrossRef]
  23. Park, R.; Da Silva, L.L.; Saeed, A. Immunotherapy predictive molecular markers in advanced gastroesophageal cancer: MSI and beyond. Cancers 2021, 13, 1715. [Google Scholar] [CrossRef] [PubMed]
  24. Hou, W.; Yi, C.; Zhu, H. Predictive biomarkers of colon cancer immunotherapy: Present and future. Front. Immunol. 2022, 13, 1032314. [Google Scholar] [CrossRef] [PubMed]
  25. Friedman, C.F.; Hainsworth, J.D.; Kurzrock, R.; Spigel, D.R.; Burris, H.A.; Sweeney, C.J.; Meric-Bernstam, F.; Wang, Y.; Levy, J.; Grindheim, J.; et al. Atezolizumab treatment of tumors with high tumor mutational burden from MyPathway, a multicenter, open-label, Phase IIa multiple basket study. Cancer Discov. 2022, 12, 654–669. [Google Scholar] [CrossRef]
  26. Kanda, Y. Investigation of the freely available easy-to-use software ‘EZR’ for medical statistics. Bone Marrow Transplant. 2013, 48, 452–458. [Google Scholar] [CrossRef]
  27. Chmielecki, J.; Ross, J.S.; Wang, K.; Frampton, G.M.; Palmer, G.A.; Ali, S.M.; Palma, N.; Morosini, D.; Miller, V.A.; Yelensky, R.; et al. Oncogenic alterations in ERBB2/HER2 represent potential therapeutic targets across tumors from diverse anatomic sites of origin. Oncologist 2015, 20, 7–12. [Google Scholar] [CrossRef]
  28. Li, B.T.; Ross, D.S.; Aisner, D.L.; Chaft, J.E.; Hsu, M.; Kako, S.L.; Kris, M.G.; Varella-Garcia, M.; Arcila, M.E. HER2 amplification and HER2 mutation are distinct molecular targets in lung cancers. J. Thorac. Oncol. 2016, 11, 414–419. [Google Scholar] [CrossRef]
  29. Marcus, L.; Lemery, S.J.; Keegan, P.; Pazdur, R. FDA approval summary: Pembrolizumab for the treatment of microsatellite instability-high solid tumors. Clin. Cancer Res. 2019, 25, 3753–3758. [Google Scholar] [CrossRef] [PubMed]
  30. Chan, T.A.; Yarchoan, M.; Jaffee, E.; Swanton, C.; Quezada, S.A.; Stenzinger, A.; Peters, S. Development of tumor mutation burden as an immunotherapy biomarker: Utility for the oncology clinic. Ann. Oncol. 2019, 30, 44–56. [Google Scholar] [CrossRef]
  31. Cappuzzo, F.; Bemis, L.; Varella-Garcia, M. HER2 mutation and response to trastuzumab therapy in non-small-cell lung cancer. N. Engl. J. Med. 2006, 354, 2619–2621. [Google Scholar] [CrossRef]
  32. Weiler, D.; Diebold, J.; Strobel, K.; Aebi, S.; Gautschi, O. Rapid response to trastuzumab emtansine in a patient with HER2-driven lung cancer. J. Thorac. Oncol. 2015, 10, e16–e17. [Google Scholar] [CrossRef]
  33. Shih, J.; Bashir, B.; Gustafson, K.S.; Andrake, M.; Dunbrack, R.L.; Goldstein, L.J.; Boumber, Y. Cancer signature investigation: ERBB2 (HER2)-activating mutation and amplification-positive breast carcinoma mimicking lung primary. J. Natl. Compr. Cancer Netw. 2015, 13, 947–952. [Google Scholar] [CrossRef] [PubMed]
  34. Cousin, S.; Khalifa, E.; Crombe, A.; Laizet, Y.; Lucchesi, C.; Toulmonde, M.; Le Moulec, S.; Auzanneau, C.; Soubeyran, I.; Italiano, A. Targeting ERBB2 mutations in solid tumors: Biological and clinical implications. J. Hematol. Oncol. 2018, 11, 86. [Google Scholar] [CrossRef] [PubMed]
  35. Loibl, S.; von Minckwitz, G.; Schneeweiss, A.; Paepke, S.; Lehmann, A.; Rezai, M.; Zahm, D.M.; Sinn, P.; Khandan, F.; Eidtmann, H.; et al. PIK3CA mutations are associated with lower rates of pathologic complete response to anti-human epidermal growth factor receptor 2 (her2) therapy in primary HER2-overexpressing breast cancer. J. Clin. Oncol. 2014, 32, 3212–3220. [Google Scholar] [CrossRef] [PubMed]
  36. Lopez, S.; Cocco, E.; Black, J.; Bellone, S.; Bonazzoli, E.; Predolini, F.; Ferrari, F.; Schwab, C.L.; English, D.P.; Ratner, E.; et al. Dual HER2/PIK3CA targeting overcomes single-agent acquired resistance in HER2-amplified uterine serous carcinoma cell lines in vitro and in vivo. Mol. Cancer Ther. 2015, 14, 2519–2526. [Google Scholar] [CrossRef]
  37. Smith, A.E.; Ferraro, E.; Safonov, A.; Morales, C.B.; Lahuerta, E.J.A.; Li, Q.; Kulick, A.; Ross, D.; Solit, D.B.; de Stanchina, E.; et al. HER2 + breast cancers evade anti-HER2 therapy via a switch in driver pathway. Nat. Commun. 2021, 12, 6667. [Google Scholar] [CrossRef]
Figure 1. Comparison of tumor mutation burden (TMB) in ERBB2-mutant and ERBB2-non-mutant EAC, GC, and CRC. (a) TMB in ERBB2-mutant (n = 22) and ERBB2-non-mutant (n = 293) EAC. The mean TMB for ERBB2-mutant and ERBB2-non-mutant EAC was 21.0 and 6.5 mut/Mb, respectively (p < 0.05). (b) TMB in ERBB2-mutant (n = 38) and ERBB2-non-mutant (n = 549) GC. The mean TMB for ERBB2-mutant and ERBB2-non-mutant GC was 26.9 and 10.0 mut/Mb, respectively (p < 0.05). (c) TMB in ERBB2-mutant (n = 39) and ERBB2-non-mutant (n = 1026) CRC. The mean TMB for ERBB2-mutant and ERBB2-non-mutant CRC was 40.0 and 10.5 mut/Mb, respectively (p < 0.05). Statistical analysis was performed using the Mann–Whitney U test, and significant differences (p < 0.05) are denoted using asterisks (*).
Cimb 45 00468 g001
Figure 2. Tumor mutation burden (TMB) among groups 1, 2, and 3 with EAC, GC, and CRC. (a) TMB of groups 1, 2, and 3 of ERBB2-mutant EAC. Group 2 showed the highest TMB, although no significant differences were observed among the three groups. (b) TMB of groups 1, 2, and 3 of ERBB2-mutant GC. Significant differences were found among the three groups (p < 0.05), with groups 2 and 3 showing higher values than group 1. (c) TMB of groups 1, 2, and 3 of ERBB2-mutant CRC. Significant differences were found among the three groups (p < 0.05), with group 3 showing a higher value than groups 1 and 2. Statistical analysis was performed using the Kruskal–Wallis test, and Steel–Dwass post-test correlation was used to reduce the likelihood of false positives. Significant differences (p < 0.05) are denoted using asterisks (*).
Cimb 45 00468 g002
Figure 3. Mutation landscape of ERBB2-mutant EAC, GC, and CRC. Co-mutational frequency in ERBB2-mutant EAC (n = 22), GC (n = 38), and CRC (n = 39). Oncoprint showing genes across multiple pathways, with altered frequency of mutations, including cancer-related genes. Each column represents one sample. Genes are assorted according to pathways in which they are implicated, with the frequency of the alterations denoted on the left.
Cimb 45 00468 g003
Table 1. Comparison of MS and TMB between ERBB2-mutant and ERBB2-wild-type EAC, GC, and CRC.
Cancer TypeCharacteristicCategoryERBB2-MutantERBB2-Wild-Typep
EACMS status (%)MSS17 (77.3)272 (95.1)<0.05
MSI-I0 (0)3 (1.0)
MSI-H5 (22.7)11 (3.8)
N/A07
TMB (mut/Mb)mean22.77.2<0.05
SD33.49.1
Median6.95.4
Minimum4.10
Maximum113.392.5
Low (<10)17 (77.3)265 (90.4)0.11
High (≥10)5 (22.7)28 (9.6)
GCMS status (%)MSS14 (56)342 (82.8)<0.05
MSI-I2 (8)11 (2.7)
MSI-H9 (36)60 (14.5)
N/A13136
TMB (mut/Mb)mean26.910.0<0.05
SD25.723.3
Median22.53.5
Minimum0.70
Maximum89.6330.8
Low (<10)17 (44.7)453 (83.1)<0.05
High (≥10)21 (55.2)92 (16.9)
N/A04
CRCMS status (%)MSS29 (74.4)894 (88.7)<0.05
MSI-I1 (2.6)19 (1.9)
MSI-H9 (23.1)95 (9.4)
TMB (mut/Mb)mean40.010.5<0.05
SD80.223.1
Median9.84.6
Minimum2.00
Maximum382.6316.8
Low (<16)26 (66.7)870 (90.0)<0.05
High (≥16)13 (33.3)96 (9.9)
EAC: esophageal adenocarcinoma, GC: gastric cancer, CRC: colorectal cancer, mut: mutation, MS: microsatellite, MSS: MS stability, MSI-I: MS instability—intermediate, MSI-H: MS instability—high, TMB: tumor mutation burden, SD: standard deviation, N/A: not available, Mb: megabase.
Table 2. Clinicopathological information of the three groups with ERBB2-mutant EAC.
CharacteristicCategoryGroup 1 (n = 8)Group 2 (n = 9)Group 3 (n = 5)p
Age (years)Mean65.869.067.00.81
N/A263
Sex (%)Male6 (75.0)6 (66.7)4 (80.0)1
Female2 (25.0)3 (33.3)1 (20.0)
Histological grade (%)G11 (12.5)2 (22.5)0 (0)0.28
G25 (62.5)5 (55.6)1 (20.0)
G32 (25.0)2 (22.2)4 (80.0)
Subtype (%)CIN6 (100)1 (33.3)2 (100)0.07
GS0 (0)0 (0)0 (0)
MSI0 (0)2 (66.7)0 (0)
POLE0 (0)0 (0)0 (0)
N/A263
MS status (%)MSS8 (100)4 (44.4)5 (100)<0.05
MSI-I0 (0)0 (0)0 (0)
MSI-H0 (0)5 (55.6)0 (0)
TMB (mut/Mb)Mean5.243.56.00.05
SD1.042.93.2
Median5.041.56.1
Minimum4.13.52.4
Maximum6.9113.29.5
Low (<10)8 (100)4 (44.4)5 (100)<0.05
High (<10)0 (0)5 (55.6)0 (0)
CIN: chromosomal instability, GS: genome stability, POLE: polymerase epsilon, MS: microsatellite, MSS: MS stability, MSI-I: MS instability—intermediate, MSI-H: MS instability—high, TMB: tumor mutation burden, SD: standard deviation, N/A: not available.
Table 3. Clinicopathological information on the three groups with ERBB2-mutant GC.
CharacteristicCategoryGroup 1 (n = 4)Group 2 (n = 25)Group 3 (n = 9)p
Age (years)Mean72.368.164.30.32
N/A022
Sex (%)Male2 (50)10 (43.5)6 (66.7)0.78
Female2 (50)13 (56.5)3 (37.5)
N/A021
Histological grade (%)G10 (0)0 (0)0 (0)<0.05
G23 (100)4 (26.7)5 (71.4)
G30 (0)11 (73.3)2 (28.6)
Subtype (%)CIN2 (100)5 (22.7)3 (33.3)0.32
EBV0 (0)1 (4.5)0 (0)
GS0 (0)1 (4.5)1 (11.1)
MSI0 (0)15 (68.2)5 (56.6)
N/A230
MS statusMSS3 (100)7 (46.7)4 (57.1)0.47
MSI-I0 (0)1 (6.7)1 (14.3)
MSI-H0 (0)7 (46.7)2 (28.6)
N/A1102
TMB (mut/Mb)Mean4.026.936.9<0.05
SD2.323.531.9
Median4.828.038.3
Minimum0.72.05.9
Maximum5.988.489.6
Low (<10)4 (100)10 (40.0)3 (33.3)0.07
High (≥10)0 (0)15 (60.0)6 (66.7)
CIN: chromosomal instability, GS: genome-stable, POLE: polymerase epsilon, EBV: Epstein–Barr virus, MS: microsatellite, MSS: MS stability, MSI-I: MS instability-intermediate, MSI-H: MS instability-high, TMB: tumor mutation burden, SD: standard deviation, N/A: Not available.
Table 4. Clinicopathological information on the three groups with ERBB2-mutant CRC.
CharacteristicCategoryGroup 1 (n = 6)Group 2 (n = 16)Group 3 (n = 17)p
Age (years)Mean58.365.562.70.67
Sex (%)Male5 (83.3)9 (56.3)10 (58.8)0.56
Female1 (16.7)7 (43.8)7 (41.2)
Histological gradeG10 (0)2 (12.5)1 (5.9)0.73
G24 (66.7)9 (56.3)13 (76.5)
G32 (33.3)5 (31.3)3 (17.6)
Subtype (%)CIN3 (100)4 (80.0)2 (18.2)<0.05
GS0 (0)1 (20.0)1 (9.1)
MSI0 (0)0 (0)6 (54.5)
POLE0 (0)0 (0)2 (18.2)
N/A3116
MS statusMSS6 (100)14 (87.5)9 (52.9)<0.05
MSI-I0 (0)1 (6.3)0 (0)
MSI-H0 (0)1 (6.3)8 (47.1)
TMB (mut/Mb)Mean5.911.978.5<0.05
SD3.221.0109.8
Median4.77.337.0
Minimum2.92.02.0
Maximum9.889.9382.6
Low (<16)6 (100)16 (100)4 (23.5)<0.05
High (≥16)0 (0)0 (0)13 (76.5)<0.05
CIN: chromosomal instability, GS: genome stable, POLE: polymerase epsilon, MS: microsatellite, MSS: MS stability, MSI-I: MS instability—intermediate, MSI-H: MS instability—high, TMB: tumor mutation burden, SD: standard deviation.
Table 5. PI3K/MTOR and MAPK pathway mutation rates in the three groups with EAC, GC, and CRC.
Cancer TypeGroup (Number)PI3K/MTOR (%)MAPK (%)
EAC
Group 1 (n = 8)2 (25.0)0 (0)
Group 2 (n = 9)5 (55.6)1 (11.1)
Group 3 (n = 5)0 (0)1 (20.0)
GC
Group 1 (n = 4)0 (0)0 (0)
Group 2 (n = 25)10 (40.0)9 (36.0)
Group 3 (n = 9)4 (44.4)2 (22.2)
CRC
Group 1 (n = 6)1 (16.7)2 (33.3)
Group 2 (n = 16)4 (25.0)10 (62.5)
Group 3 (n = 17)13 (76.5)12 (70.6)
EAC: esophageal adenocarcinoma, GC: gastric cancer, CRC: colorectal cancer, PI3K: phosphoinositide 3-kinase, MTOR: mammalian target of rapamycin, MAPK: mitogen-activated protein kinase.
Disclaimer/Publisher’s Note: The statements, opinions and data contained in all publications are solely those of the individual author(s) and contributor(s) and not of MDPI and/or the editor(s). MDPI and/or the editor(s) disclaim responsibility for any injury to people or property resulting from any ideas, methods, instructions or products referred to in the content.

