
Inhibition of Autophagy and the Cytoprotective Role of Smac Mimetic against ROS-Induced Cancer: A Potential Therapeutic Strategy in Relapse and Chemoresistance Cases in Breast Cancer
 , , , ,
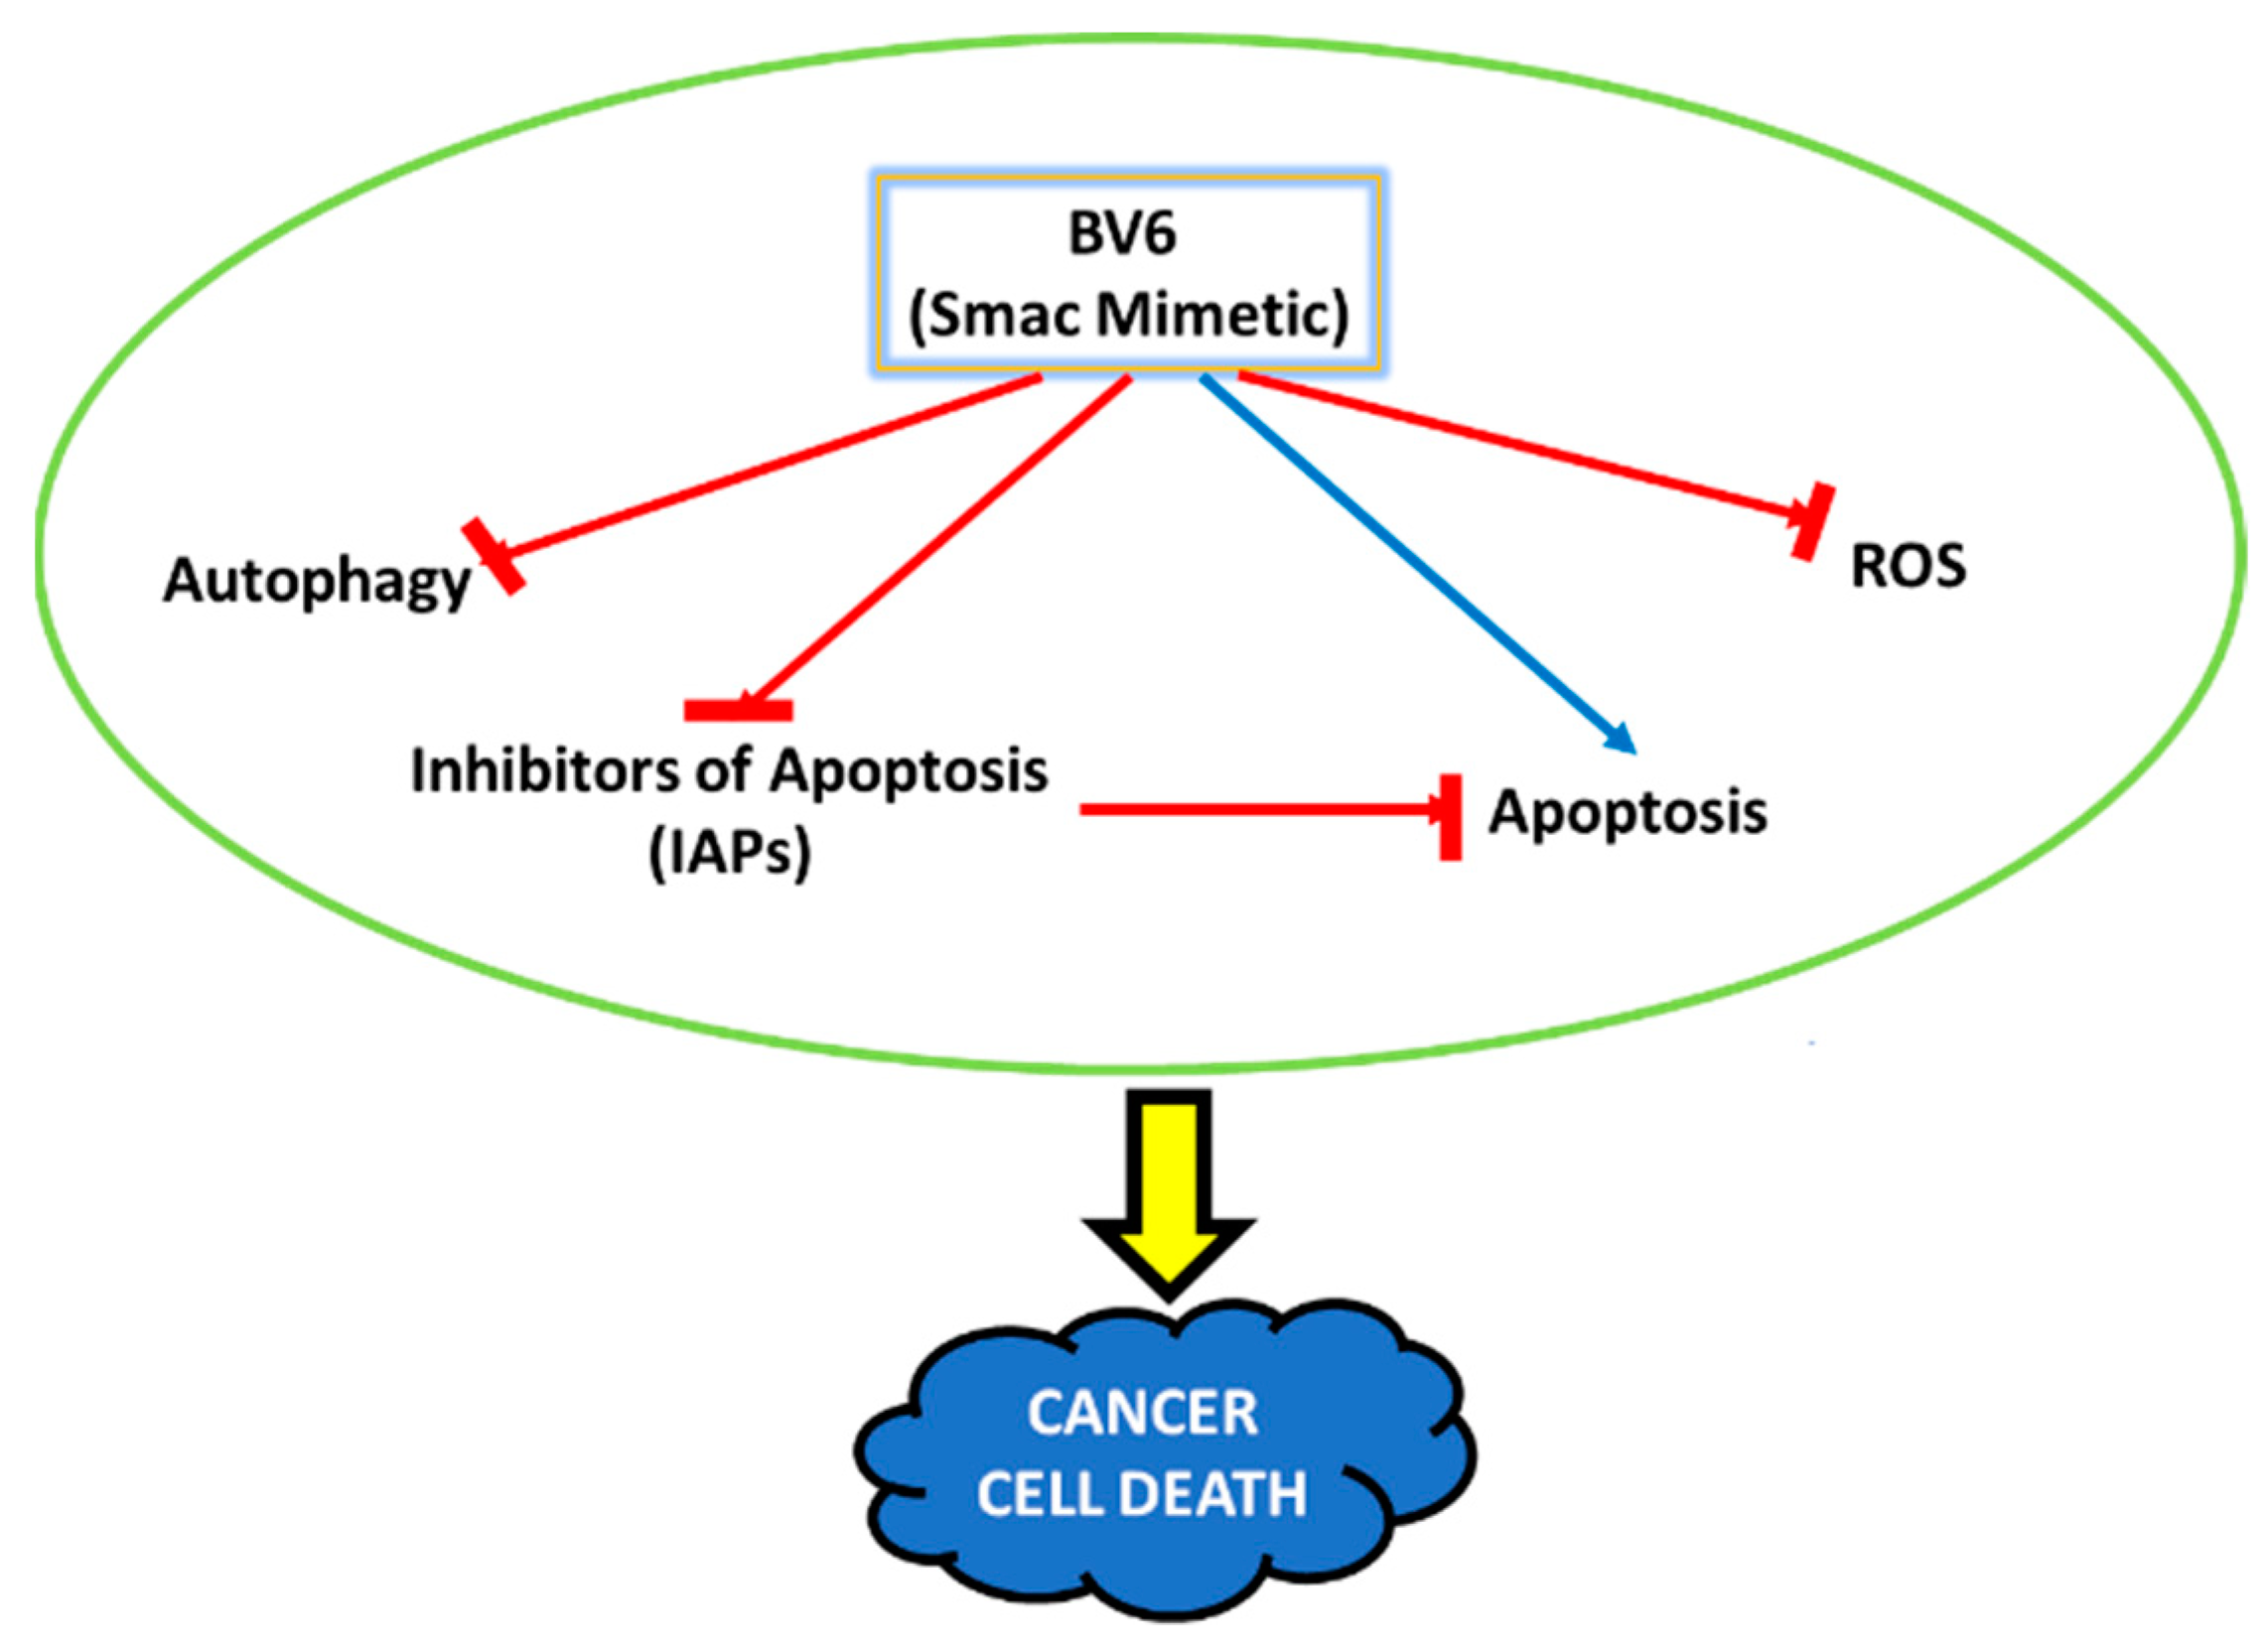
Abstract
1. Introduction
2. Material and Methods
2.1. Cancer Cell Culture
2.2. MTT Assay
2.3. DAPI Staining
2.4. AO/EtBr (Acridine Orange and Ethidium Bromide) Staining
2.5. Flow Cytometry
2.6. MDC (Monodansylcadavarine) Assay
2.7. Cytoprotective Impact Measured against ROS-Induced Cellular Oxidative Stress

2.8. Real-Time PCR
2.9. Western Blotting
2.10. Transmission Electron Microscope (TEM)
2.11. Statistical Analysis
3. Results
3.1. Effect of Smac Mimetic Compound BV6 with H2O2 on Cell Viability
3.2. BV6 Effect on ROS in H2O2-Induced Breast Cancer Cells
3.3. Combinational Treatment of BV6 with H2O2 (100 µM) Enhances Apoptosis in MCF-7 Cells
3.4. Autophagy Is Downregulated by the BV6 Compound in H2O2-Induced Breast Cancer Cells
4. Discussion
Author Contributions
Funding
Institutional Review Board Statement
Informed Consent Statement
Data Availability Statement
Acknowledgments
Conflicts of Interest
References
- Ferlay, J.; Colombet, M.; Soerjomataram, I.; Parkin, D.M.; Piñeros, M.; Znaor, A.; Bray, F. Cancer statistics for the year 2020: An overview. Int. J. Cancer 2021, 149, 778–789. [Google Scholar] [CrossRef] [PubMed]
- Cancer Drug Resistance: An Evolving Paradigm|Nature Reviews Cancer. Available online: https://www.nature.com/articles/nrc3599 (accessed on 11 June 2023).
- Ghayad, S.E.; Vendrell, J.A.; Larbi, S.B.; Dumontet, C.; Bieche, I.; Cohen, P.A. Endocrine resistance associated with activated ErbB system in breast cancer cells is reversed by inhibiting MAPK or PI3K/Akt signaling pathways. Int. J. Cancer 2010, 126, 545–562. [Google Scholar] [CrossRef] [PubMed]
- Lee, A.V.; Oesterreich, S.; Davidson, N.E. MCF-7 Cells—Changing the Course of Breast Cancer Research and Care for 45 Years. JNCI J. Natl. Cancer Inst. 2015, 107, djv073. [Google Scholar] [CrossRef] [PubMed]
- Simstein, R.; Burow, M.; Parker, A.; Weldon, C.; Beckman, B. Apoptosis, Chemoresistance, and Breast Cancer: Insights from the MCF-7 Cell Model System. Exp. Biol. Med. 2003, 228, 995–1003. [Google Scholar] [CrossRef]
- Hormone Therapy for Breast Cancer|Breast Cancer Treatment. Available online: https://www.cancer.org/cancer/types/breast-cancer/treatment/hormone-therapy-for-breast-cancer.html (accessed on 30 June 2023).
- Full Article: Dasatinib Reverses the Multidrug Resistance of Breast Cancer MCF-7 Cells to Doxorubicin by Downregulating P-gp Expression via Inhibiting the Activation of ERK Signaling Pathway. Available online: https://www.tandfonline.com/doi/full/10.4161/15384047.2014.987062 (accessed on 1 July 2023).
- Labi, V.; Erlacher, M. How cell death shapes cancer. Cell Death Dis. 2015, 6, e1675. [Google Scholar] [CrossRef]
- Death and Anti-Death: Tumour Resistance to Apoptosis|Nature Reviews Cancer. Available online: https://www.nature.com/articles/nrc776 (accessed on 7 August 2021).
- Targeting Triple-Negative Breast Cancers with the Smac-Mimetic Birinapant|Cell Death & Differentiation. Available online: https://www.nature.com/articles/s41418-020-0541-0 (accessed on 8 August 2021).
- Onorati, A.V.; Dyczynski, M.; Ojha, R.; Amaravadi, R.K. Targeting autophagy in cancer. Cancer 2018, 124, 3307–3318. [Google Scholar] [CrossRef]
- Di Meo, S.; Reed, T.T.; Venditti, P.; Victor, V.M. Role of ROS and RNS Sources in Physiological and Pathological Conditions. Oxid. Med. Cell. Longev. 2016, 2016, e1245049. [Google Scholar] [CrossRef]
- Ciccarone, F.; Castelli, S.; Ciriolo, M.R. Oxidative Stress-Driven Autophagy acROSs Onset and Therapeutic Outcome in Hepatocellular Carcinoma. Oxid. Med. Cell. Longev. 2019, 2019, e6050123. [Google Scholar] [CrossRef]
- Poillet-Perez, L.; Despouy, G.; Delage-Mourroux, R.; Boyer-Guittaut, M. Interplay between ROS and autophagy in cancer cells, from tumor initiation to cancer therapy. Redox Biol. 2015, 4, 184–192. [Google Scholar] [CrossRef]
- Gupta, S.C.; Hevia, D.; Patchva, S.; Park, B.; Koh, W.; Aggarwal, B.B. Upsides and Downsides of Reactive Oxygen Species for Cancer: The Roles of Reactive Oxygen Species in Tumorigenesis, Prevention, and Therapy. Antioxid. Redox Signal. 2012, 16, 1295–1322. [Google Scholar] [CrossRef]
- Verma, A.K.; Bharti, P.S.; Rafat, S.; Bhatt, D.; Goyal, Y.; Pandey, K.K.; Ranjan, S.; Almatroodi, S.A.; Alsahli, M.A.; Rahmani, A.H.; et al. Autophagy Paradox of Cancer: Role, Regulation, and Duality. Oxid. Med. Cell. Longev. 2021, 2021, e8832541. [Google Scholar] [CrossRef]
- Abbas, R.; Larisch, S. Targeting XIAP for Promoting Cancer Cell Death—The Story of ARTS and SMAC. Cells 2020, 9, 663. [Google Scholar] [CrossRef]
- Ehrenschwender, M.; Bittner, S.; Seibold, K.; Wajant, H. XIAP-targeting drugs re-sensitize PIK3CA-mutated colorectal cancer cells for death receptor-induced apoptosis. Cell Death Dis. 2014, 5, e1570. [Google Scholar] [CrossRef]
- Li, W.; Li, B.; Giacalone, N.J.; Torossian, A.; Sun, Y.; Niu, K.; Lin-Tsai, O.; Lu, B. BV6, an IAP Antagonist, Activates Apoptosis and Enhances Radiosensitization of Non-small Cell Lung Carcinoma In Vitro. J. Thorac. Oncol. 2011, 6, 1801–1809. [Google Scholar] [CrossRef]
- Obexer, P.; Ausserlechner, M.J. X-Linked Inhibitor of Apoptosis Protein—A Critical Death Resistance Regulator and Therapeutic Target for Personalized Cancer Therapy. Front. Oncol. 2014, 4, 197. [Google Scholar] [CrossRef] [PubMed]
- Vitamin D Analog EB1089 Triggers Dramatic Lysosomal Changes and Beclin 1-Mediated Autophagic Cell Death|Cell Death & Differentiation. Available online: https://www.nature.com/articles/4401651 (accessed on 8 August 2021).
- Dar, M.I.; Rafat, S.; Dev, K.; Abass, S.; Khan, M.U.; Abualsunun, W.A.; Murshid, S.S.; Ahmad, S.; Qureshi, M.I. Heartwood Extract of Pterocarpus marsupium Roxb. Offers Defense against Oxyradicals and Improves Glucose Uptake in HepG2 Cells. Metabolites 2022, 12, 947. [Google Scholar] [CrossRef] [PubMed]
- The Paradox Role of Caspase Cascade in Ionizing Radiation Therapy|Journal of Biomedical Science. Available online: https://jbiomedsci.biomedcentral.com/articles/10.1186/s12929-016-0306-8 (accessed on 23 June 2023).
- Girard-Lalancette, K.; Pichette, A.; Legault, J. Sensitive cell-based assay using DCFH oxidation for the determination of pro- and antioxidant properties of compounds and mixtures: Analysis of fruit and vegetable juices. Food Chem. 2009, 115, 720–726. [Google Scholar] [CrossRef]
- Grauzdytė, D.; Pukalskas, A.; Viranaicken, W.; Kalamouni, C.E.; Venskutonis, P.R. Protective effects of Phyllanthus phillyreifolius extracts against hydrogen peroxide induced oxidative stress in HEK293 cells. PLoS ONE 2018, 13, e0207672. [Google Scholar] [CrossRef]
- Davalli, P.; Mitic, T.; Caporali, A.; Lauriola, A.; D’Arca, D. ROS, Cell Senescence, and Novel Molecular Mechanisms in Aging and Age-Related Diseases. Oxid. Med. Cell. Longev. 2016, 2016, e3565127. [Google Scholar] [CrossRef]
- Vurusaner, B.; Poli, G.; Basaga, H. Tumor suppressor genes and ROS: Complex networks of interactions. Free Radic. Biol. Med. 2012, 52, 7–18. [Google Scholar] [CrossRef]
- Trachootham, D.; Alexandre, J.; Huang, P. Targeting cancer cells by ROS-mediated mechanisms: A radical therapeutic approach? Nat. Rev. Drug Discov. 2009, 8, 579–591. [Google Scholar] [CrossRef] [PubMed]
- Singh, G.; Maulik, S.; Jaiswal, A.; Kumar, P.; Parshad, R. Effect on Antioxidant Levels in Patients of Breast Carcinoma during Neoadjuvant Chemotherapy and Mastectomy. Malays. J. Med. Sci. MJMS 2010, 17, 24–28. [Google Scholar]
- Shacter, E.; Williams, J.A.; Hinson, R.M.; Sentürker, S.; Lee, Y.J. Oxidative stress interferes with cancer chemotherapy: Inhibition of lymphoma cell apoptosis and phagocytosis. Blood 2000, 96, 307–313. [Google Scholar] [CrossRef] [PubMed]
- Conklin, K.A. Dietary antioxidants during cancer chemotherapy: Impact on chemotherapeutic effectiveness and development of side effects. Nutr. Cancer 2000, 37, 1–18. [Google Scholar] [CrossRef] [PubMed]
- Halliwell, B. The antioxidant paradox. Lancet 2000, 355, 1179–1180. [Google Scholar] [CrossRef] [PubMed]
- Lamson, D.W.; Brignall, M.S. Antioxidants in cancer therapy; their actions and interactions with oncologic therapies. Altern. Med. Rev. J. Clin. Ther. 1999, 4, 304–329. [Google Scholar]
- Wang, H.; Liu, X.; Long, M.; Huang, Y.; Zhang, L.; Zhang, R.; Zheng, Y.; Liao, X.; Wang, Y.; Liao, Q.; et al. NRF2 activation by antioxidant antidiabetic agents accelerates tumor metastasis. Sci. Transl. Med. 2016, 8, 334ra51. [Google Scholar] [CrossRef]
- Singh, K.; Bhori, M.; Kasu, Y.A.; Bhat, G.; Marar, T. Antioxidants as precision weapons in war against cancer chemotherapy induced toxicity—Exploring the armoury of obscurity. Saudi Pharm. J. SPJ Off. Publ. Saudi Pharm. Soc. 2018, 26, 177–190. [Google Scholar] [CrossRef]
- Frontiers|Crosstalk between ROS and Autophagy in Tumorigenesis: Understanding the Multifaceted Paradox. Available online: https://www.frontiersin.org/articles/10.3389/fonc.2022.852424/full (accessed on 31 January 2023).
- Das, P.; Chatterjee, K.; Choudhuri, T. ROS Induced Regulatory Crosstalk with Autophagy and AKT/mTOR Signaling in Cancer Cells mTOR signalling in cancer. In Handbook of Oxidative Stress in Cancer: Mechanistic Aspects; Springer: Berlin/Heidelberg, Germany, 2021; pp. 1–14. ISBN 9789811545016. [Google Scholar]
- He, Y.; Shi, Y.; Yang, Y.; Huang, H.; Feng, Y.; Wang, Y.; Zhan, L.; Wei, B. Chrysin induces autophagy through the inactivation of the ROS-mediated Akt/mTOR signaling pathway in endometrial cancer. Int. J. Mol. Med. 2021, 48, 172. [Google Scholar] [CrossRef]
- Wang, S.; Li, Z.; Liu, W.; Wei, G.; Yu, N.; Ji, G. Neohesperidin Induces Cell Cycle Arrest, Apoptosis, and Autophagy via the ROS/JNK Signaling Pathway in Human Osteosarcoma Cells. Am. J. Chin. Med. 2021, 49, 1251–1274. [Google Scholar] [CrossRef]
- Rafat, S.; Singh, P.; Pandey, K.K.; Almatroodi, S.A.; Alsahli, M.A.; Almatroudi, A.; Rahmani, A.H.; Dev, K. SMAC Mimetic BV6 Co-Treatment Downregulates the Factors Involved in Resistance and Relapse of Cancer: IAPs and Autophagy. Biology 2022, 11, 1581. [Google Scholar] [CrossRef] [PubMed]
- Rafat, S.; Dar, M.I.; Sunita, K.; Khan, S.; Verma, A.K.; Ahmad, F.; Dev, K. Therapeutic potential and protective effect against induced ROS and autophagy inhibition of AT101 compound in human breast cancer cell line MCF7. Gene Rep. 2022, 27, 101560. [Google Scholar] [CrossRef]
- Modulation of Respiration and Mitochondrial Dynamics by SMAC-Mimetics for Combination Therapy in Chemoresistant Cancer. Available online: https://www.thno.org/v09p4909.htm (accessed on 31 January 2023).


Disclaimer/Publisher’s Note: The statements, opinions and data contained in all publications are solely those of the individual author(s) and contributor(s) and not of MDPI and/or the editor(s). MDPI and/or the editor(s) disclaim responsibility for any injury to people or property resulting from any ideas, methods, instructions or products referred to in the content. |
© 2023 by the authors. Licensee MDPI, Basel, Switzerland. This article is an open access article distributed under the terms and conditions of the Creative Commons Attribution (CC BY) license (https://creativecommons.org/licenses/by/4.0/).
Share and Cite
Rafat, S.; Hakami, M.A.; Hazazi, A.; Alsaiari, A.A.; Rashid, S.; Hasan, M.R.; Aloliqi, A.A.; Eisa, A.A.; Dar, M.I.; Khan, M.F.; et al. Inhibition of Autophagy and the Cytoprotective Role of Smac Mimetic against ROS-Induced Cancer: A Potential Therapeutic Strategy in Relapse and Chemoresistance Cases in Breast Cancer. Curr. Issues Mol. Biol. 2023, 45, 5752-5764. https://doi.org/10.3390/cimb45070363
Rafat S, Hakami MA, Hazazi A, Alsaiari AA, Rashid S, Hasan MR, Aloliqi AA, Eisa AA, Dar MI, Khan MF, et al. Inhibition of Autophagy and the Cytoprotective Role of Smac Mimetic against ROS-Induced Cancer: A Potential Therapeutic Strategy in Relapse and Chemoresistance Cases in Breast Cancer. Current Issues in Molecular Biology. 2023; 45(7):5752-5764. https://doi.org/10.3390/cimb45070363
Chicago/Turabian StyleRafat, Sahar, Mohammed Ageeli Hakami, Ali Hazazi, Ahad Amer Alsaiari, Summya Rashid, Mohammad Raghibul Hasan, Abdulaziz A. Aloliqi, Alaa Abdulaziz Eisa, Mohammad Irfan Dar, Mohd Faisal Khan, and et al. 2023. "Inhibition of Autophagy and the Cytoprotective Role of Smac Mimetic against ROS-Induced Cancer: A Potential Therapeutic Strategy in Relapse and Chemoresistance Cases in Breast Cancer" Current Issues in Molecular Biology 45, no. 7: 5752-5764. https://doi.org/10.3390/cimb45070363
APA StyleRafat, S., Hakami, M. A., Hazazi, A., Alsaiari, A. A., Rashid, S., Hasan, M. R., Aloliqi, A. A., Eisa, A. A., Dar, M. I., Khan, M. F., & Dev, K. (2023). Inhibition of Autophagy and the Cytoprotective Role of Smac Mimetic against ROS-Induced Cancer: A Potential Therapeutic Strategy in Relapse and Chemoresistance Cases in Breast Cancer. Current Issues in Molecular Biology, 45(7), 5752-5764. https://doi.org/10.3390/cimb45070363