Abstract
The area of saline land in the world is quite large, and there is broad room for its development and usage. ‘Xuxiang’ is an Actinidia deliciosa variety that is tolerant to salt and can be planted in an area of light-saline land, and has good comprehensive characteristics and high economic value. However, the molecular mechanism of salt tolerance is unknown at present. To understand the molecular mechanism of salt tolerance, the leaves of A. deliciosa ‘Xuxiang’ were used as explants to establish a sterile tissue culture system, and plantlets were obtained using this system. One percent concentration (w/v) of sodium chloride (NaCl) was employed to treat the young plantlets cultured in Murashige and Skoog (MS) medium, then RNA-seq was used for transcriptome analysis. The results showed that the genes related to salt stress in the phenylpropanoid biosynthesis pathway and the anabolism of trehalose and maltose pathways were up-regulated; however, those genes in the plant hormone signal transduction and metabolic pathways of starch, sucrose, glucose, and fructose were down-regulated after salt treatment. The expression levels of ten genes that were up-regulated and down-regulated in these pathways were confirmed by real-time quantitative polymerase chain reaction (RT-qPCR) analysis. The salt tolerance of A. deliciosa might be related to the expression level changes in the genes in the pathways of plant hormone signal transduction, phenylpropanoid biosynthesis, and starch, sucrose, glucose, and fructose metabolism. The increased expression levels of the genes encoding alpha-trehalose-phosphate synthase, trehalose-phosphatase, alpha-amylase, beta-amylase, feruloyl-CoA 6-hydroxylase, ferulate 5-hydroxylase, and coniferyl-alcohol glucosyl transferase might be vital to the salt stress response of the young A. deliciosa plants.
1. Introduction
At present, more than 100 countries are affected by soil salinization [1]. There are at least 100,000 hm2 of saline–alkali lands, of which 20% of the cultivated land is salinized [1]. Salt stress is one of the adverse environmental factors that causes plant growth inhibition and yield reduction [2]. Nowadays, the control of saline soil is mainly realized by improving saline soil, e.g., irrigation, organic fertilizer, deep tillage, loosening soil, and cultivating salt-tolerant plant varieties [1].
Cross-breeding to breed salt-tolerant varieties has become a vital topic in the academic research of salt-tolerant plant breeding [3]. However, because of the long breeding cycle of kiwifruit, the genetic improvement process of cross-breeding is seriously hindered [4,5]. A combination of traditional breeding and modern breeding techniques such as marker-assisted selection (MAS) is the trend in fruit tree breeding [4,5,6]. Hence, finding genes or molecular markers related to the traits is vital for fruit tree breeding. Modern techniques, for example, transcriptome, proteomics, and genomics can help screen salt-tolerance-related genes or molecular markers [2,7,8]. Combining cross-breeding with transcriptome sequencing technology to screen kiwifruit salt-tolerance-related genes is helpful for assisting in the breeding of salt-tolerant varieties [8,9,10].
Recent studies have shown that kiwifruit, like other salt-intolerant species, exhibit slowed growth, yellowing of leaves, and even death under salt-stressed environmental conditions [11]. The study of tree transcriptomes enables us to obtain new insights into the genetic basis for the formation of tree traits [7,8,10]. The study of salt stress response in plants has become a hot topic, and transcriptomic analysis has identified metabolic pathways associated with salt stress, including plant hormone signal transduction [12], lignin synthesis [13], starch, and the sucrose metabolism pathway [14,15].
The area of saline land is quite large, and there is broad room for its development and usage. Actinidia deliciosa ‘Xuxiang’ is one of the best kiwifruit varieties, which has good comprehensive characteristics and high economic value and can grow well in the light-saline land area [11,16]. However, the molecular mechanism of its salt tolerance is unknown. An in-depth study of the molecular regulation mechanism of salt tolerance and screening of salt-tolerance-related genes or molecular markers is essential to accelerate the breeding of kiwifruit varieties that can be planted in wilder saline land. In this study, to understand the molecular mechanism of salt tolerance and to screen the salt-tolerance-related genes of A. deliciosa, 1.0% (w/v) NaCl was used to treat the young plants, then expression levels of the salt tolerance-related genes were analyzed at the transcriptome level and confirmed by RT-qPCR analysis.
2. Materials and Methods
2.1. Plant Materials and Tissue Culture
In this study, leaves of A. deliciosa ‘Xuxiang’ from the nursery of the Southwest Forestry University were used as explants for tissue culture.
The leaves of A. deliciosa ‘Xuxiang’ were inoculated in a callus induction medium (Murashige and Skoog (MS) + thidiazuron (TDZ) 1.0 mg/L + indole-3-butytric acid (IBA) 0.15 mg/L) for 20 days. An aseptic differentiation medium (MS + 6-benzyl aminopurine (6-BA) 1.0 mg/L+ naphthalene acetic acid (NAA) 0.2 mg/L) was used to induce the adventitious buds. They were moved to a rooting medium (MS+IBA 0.75 mg/L+ activated carbon (AC) 0.30 g/L) after they grew to 2 to 3 cm in height. The plantlets were grown in 15 h of light: 9 h of dark cycles at 25 ± 2 °C, with a light intensity of 1200 lx. After the roots grew to 2 to 3 cm, the seedlings moved to a greenhouse.
2.2. Tissue-Culture Material Treatment
Three plants from tissue culture were placed in the salt medium with 1.0% (w/v) NaCl as reported by a previous study [11], numbered T1, T2, T3, and three plants were placed in the salt-free medium and numbered C1, C2, and C3. Seven days later [11], the leaves of the plants were removed, treated with liquid nitrogen, and placed in dry ice. These samples were sent to Differential Gene Company (Hefei, China) for RNA-Seq.
2.3. Sequencing Data Processing
RNA was extracted using the Tiangen kit (TIANGEN Biotech Beijing Co., Ltd., Beijing, China) from one gram of each sample. The RNA quality was tested using a Nanodrop 2000 spectrophotometer (Thermo Fisher Scientific, Waltham, MA, USA). Using 5 μg RNA, the cDNA library was generated according to the operation manual of the NEBNext® Ultra™ RNA Library Prep Kit for Illumina® (NEB, Ipswich, MA, USA). The transcripts were sequenced by Differential Gene Company (Hefei, China) using Illumina HiSeqTM 2500, and RNA-Seq data were presented at the Genome Sequence Archive of the BIG Data Center (accession number PRJCA002128). After the clean reads were obtained, the Bowtie2 v2.2.5 (https://bowtie-bio.sourceforge.net/bowtie2/index.shtml, accessed on 22 July 2022) was used to compare clean reads to A. chinensis ‘Hong Yang’ v2 genome (http://bioinfo.bti.cornell.edu/cgi-bin/kiwi/download.cgi, accessed on 21 July 2022) [17]. The DEseq2 software was used to analyze the differentially expressed genes (DEGs) [18]. The p-values were calculated and then corrected by the false discovery rate (FDR) [19,20]. The genes with a threshold of FDR < 0.05, log2FC (fold change for a gene) > 1, or log2FC < −1 were selected as the final DEGs.
2.4. Enrichment Analysis of Differentially Expressed Genes in the GO Database
After the differential genes were screened out, the distribution of these genes in GO (http://www.geneontology.org/, accessed on 24 July 2022) was studied, and the embodiment of sample differences in gene function was clarified. The number of genes per term was calculated, and hypergeometric tests were applied to identify metabolic pathways where differential genes were significantly enriched relative to all annotated genes. The GO term with FDR ≤ 0.05 was selected as the significantly enriched GO entry.
2.5. Kyoto Encyclopedia of Genes and Genomes (KEGG) Analysis of DEGs
The differential genes were mapped to each term of KEGG (http://www.genome.jp/kegg/, accessed on 25 July 2022). The pathway significance enrichment analysis was based on the KEGG pathway and the hypergeometric test, and the number of genes per term was calculated using R software v.4.0.3. The metabolic pathway with FDR ≤ 0.05 was defined as a DEG that was enriched significantly.
2.6. Real-Time Quantitative Polymerase Chain Reaction (RT-qPCR) Analysis
Four genes in the pathway of phenylpropanoid biosynthesis and six genes in the starch and sucrose metabolism were selected for checking using RT-qPCR in 1% (w/v) NaCl-treated and control plantlets. The total RNA was extracted from the plantlets in the sequencing data processing section, and RT-qPCR analysis was conducted according to the method described by Li et al. [21]. The primers listed in Table 1 were for RT-qPCR analyses.

Table 1.
Primers of target genes (TG) and reference genes (RG) used in RT-qPCR.
2.7. Determination of the Growth of A. deliciosa ‘Xuxiang’ Plantlets after Salt Treatment
The plantlets grew well in a medium containing 0.5 % (w/v) NaCl, while growth in a medium with 1.0 % (w/v) NaCl was somewhat inhibited, but grew well. After weighing the flasks containing differentiation medium proliferation of 0.5% (w/v) NaCl and without NaCl, the plantlets of the same age (one month old) were inserted and the initial plantlet weight X was obtained. After 30 days, the operation was repeated, and the fresh weight Y of A. deliciosa ‘Xuxiang’ plantlets after 30 days of growth was obtained. The value of Y-X is the growing weight of A. deliciosa ‘Xuxiang’ plantlets within 30 days. Five biological replicates were set.
2.8. Data Statistical Analysis
The correlation coefficient between RNA-seq and RT-qPCR data was calculated using Excel 2007.
3. Results
3.1. Morphology of Salt-Treated Plants
After being treated with 1.0% (w/v) NaCl for 30 days, we found that the growth condition of control plants was significantly better than that of the salt-treated plants. The control plants could grow very well in the salt-free medium. Meanwhile, the leaves in the salt-contained medium turned yellow and withered, and the plants almost died (as shown in Figure 1). There was a significant difference in plant growth weight between salt-treated and non-salt-treated plants within 30 days (p-value = 0.000193, shown in Figure 2). After 30 days, the plants grown on the salt-containing medium did not emit any new shoots at the base, while the plants grown on the salt-free medium gave an average of 3.2 new shoots. The plants on the salt-containing medium had an average of 0.40 roots without root hair on the roots. The plants on the salt-free medium had an average of 8.2, and the main ones could grow lateral roots and root hairs.
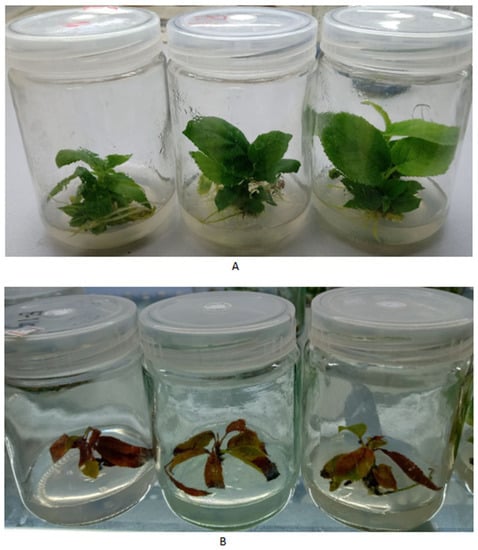
Figure 1.
Control and salt-treated plants grew in a medium containing 1.0% (w/v) NaCl for 30 days. (A) Control plants; (B) salt-treated plants.
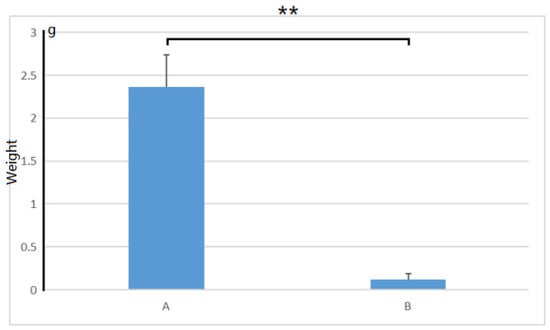
Figure 2.
The growth weight of A. deliciosa ‘Xuxiang’ seedlings in 0.5% (w/v) NaCl within 30 days. A, Plants in the salt-free medium; B, plants in the salt-contained medium. **, p < 0.01.
3.2. The Quality of RNA-Seq
The proportion of nucleotides with quality values greater than the 20 (Q20) rate and proportion of nucleotides with quality values greater than the 30 (Q30) rate of all samples were more than 94%, and the contents of GC were between 40% and 50%. The proportion of unknown bases was 0, and the rRNA content was 0.1%, much lower than 10% of the indices (see Table 2). This indicated that the quality of the sequencing results was good.
Table 2.
Quality evaluation of sample sequencing data after filtering.
In six samples, the genes with the lowest expression levels (fragments per kilobase of exon model per million mapped fragments, FPKM 0~3) were 32–36%; the genes with low expression levels (FPKM 3~15) were 32–38%; and the genes with middle expression levels (FPKM 15~60) were 20–23%. The genes with high expression levels (FPKM ≥ 60) were between 6% and 8% (see Table 3).
Table 3.
Statistics on the number of genes in different expression levels.
3.3. DEGs Analysis
The results of the DEGs comparison between the treatment and control groups are shown in Table 4. The number of DEGs between the treatment and control groups was 5555, with 1546 genes up-regulated and 4009 genes down-regulated. Additionally, the total number of differential genes and up-regulated and down-regulated genes in the treatment group was significantly higher than that in the control group. Figure 3 shows differences in the transcriptome profiles between salt-treated and control plants.
Table 4.
Statistics of gene differential expression analysis results.
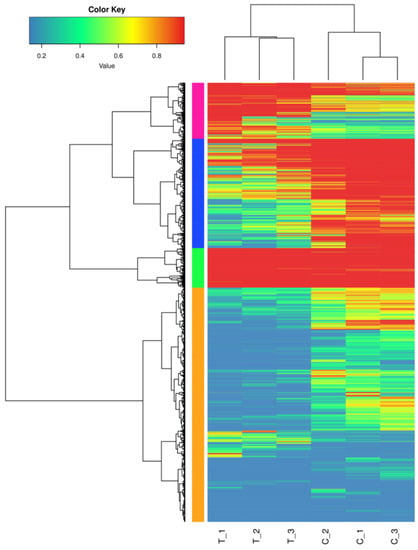
Figure 3.
Cluster analysis of DEGs between salt-treated and control plants.
The differential genes were annotated and assigned to the molecular function, biological process, and cellular components in the GO database. Ten functional classification items were enriched in molecular function, twenty in biological function, and sixteen in cell components (see Figure 4). Most of the differential genes were in the biological one. The metabolic, cellular, and single-organism processes, the biological regulation, and the regulation of the biological process were the top five items enriched, in which there were 1755, 1594, 1269, 679, and 590 differential genes, respectively. Second, there were also many differential genes in the cellular component, and the items enriched in the top five categories were cell, cell part, membrane, membrane part, and organelle, with 1352, 1352, 1344, 1244, and 898 differential genes, respectively. The least abundant of the differential gene was the molecular function. The items enriched in the top five were binding, catalytic activity, transporter activity, nucleic acid binding transcription factor activity, and molecular function regulator, with 1755, 1640, 252, 190, and 85 differential genes, respectively.
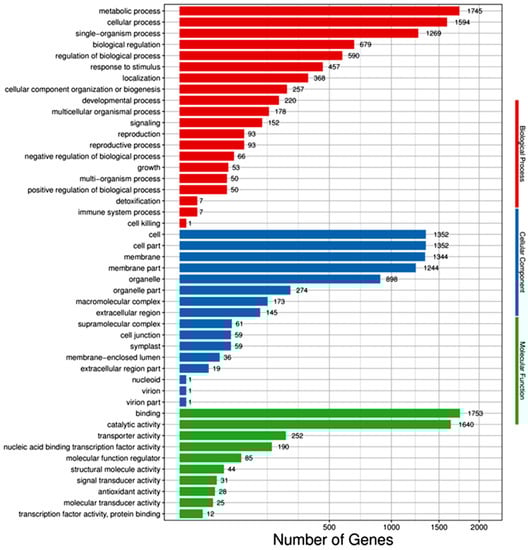
Figure 4.
GO classification bar of DEGs between salt-treated and control plants.
The enrichment of all differential genes was similar to that of down-regulated differential genes, and the enrichment of all differential genes was slightly different from that of the up-regulated differential genes. The up-regulated differential genes were enriched in the cellular components, and the top five items were membrane, membrane part, cell, cell part, and organelle. Therefore, it could be inferred that the genes related to stomatal regulation may be up-regulated after salt stress. The differential genes enriched in these entries might be closely related to salt tolerance.
3.4. KEGG Analysis of DEGs
The results showed that 1423 significantly different genes were annotated in the KEGG pathway and enriched in 117 metabolic pathways. Among them, 420 up-regulated differential genes belonged to 82 metabolic pathways, and 1003 down-regulated differential genes belonged to 114 metabolic pathways. The top 15 pathways with the accumulation of differential genes are shown in Table 5. After filtering by Q-value (Q < 0.05), only seven were left. Among them, the enrichment of the top five pathways included plant hormone signal transduction, phenylpropane biosynthesis, starch and sucrose metabolism, the transformation of pentose and glucuronic acid, and the MAPK signaling pathway. The pathway of plant hormone signal transduction (ko04075) enriched 126 differential genes, of which 25 were up-regulated and 101 were down-regulated. The phenylpropane biosynthesis pathway (ko00940) enriched 70 differential genes, including 30 up-regulated and 40 down-regulated genes. The starch and sucrose metabolism pathway (ko00500) enriched 57 differential genes, including 17 up-regulated and 40 down-regulated genes. The transformation of the pentose and glucuronic acid pathway (ko00040) enriched 41 differential genes, consisting of 11 up-regulated and 30 down-regulated genes. The MAPK signaling pathway (ko04016) enriched 40 differential genes consisting of 21 up-regulated and 19 down-regulated genes.
Table 5.
Top fifteen pathways of differential gene enrichment.
Plant hormones are involved in almost all life processes in plants, and the response of plants to salt stress is no exception [22]. Many down-regulated differential genes were enriched in the plant hormone signal transduction pathway (see Figure 5), for example, the auxin, cytokinin, gibberellin, and brassinosteroid signaling pathway. This could partly explain the significant slowing of plant growth under salt stress mentioned earlier (Figure 2).
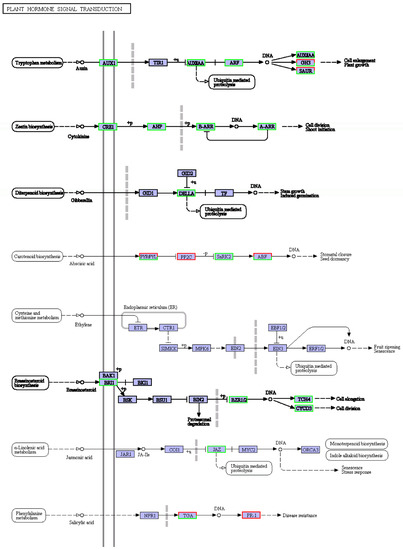
Figure 5.
KEGG diagram of plant hormone signal transduction pathway under salt stress. Red box, up-regulated genes; green box, down-regulated genes; black box, no change in expression level compared to control. White in the box, no expression detected; blue, expression detected.
Phenylpropanes are ubiquitous in plants, and these secondary metabolites are characterized by hydroxyl aromatic rings [23]. There are thousands of chemical structures, including total flavonoids, flavonols, coumarins, lignin, anthocyanins, tannins, and other benzene compounds. These compounds play vital roles in plant growth, development, and stress response [24]. The phenylpropane biosynthesis pathway is shown in Figure 6. The biosynthesis pathway related to lignin synthesis responds to salt stress, and the regulatory network was complex. In this pathway, the number of down-regulated genes was more than that of the up-regulated genes, but the number of up- and down-regulation genes enriched in vital enzymes was similar, so it was hard to determine the positive and negative effects of its regulation. Among them, the genes encoding F5H and UGT72E2, the vital enzymes of lignin synthesis [25,26], were up-regulated. The gene encoding key enzyme F6H1, a tolerant coumarin compound, was up-regulated in salt-treated plants.
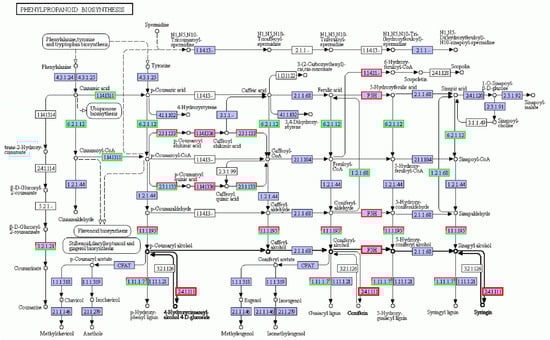
Figure 6.
Phenylpropanoid biosynthesis metabolic pathway under salt stress conditions. Red box, up-regulated genes; green box, down-regulated genes; black box, no change in expression level compared to control. White in the box, no expression detected; blue, expression detected.
The metabolic pathways related to starch and sucrose metabolites were very complex (as shown in Figure 7), and the number of down-regulated genes was more than that of the up-regulated ones. It may be because under salt, plants are affected by stress, and overall transcript levels are reduced, so most gene expression levels are decreased, but since starch and sucrose metabolites are vital for plant resistance, some key enzymes are essential for starch and sucrose synthesis, so the expression of these related coding genes was up-regulated. In this pathway, trehalose-6-phosphate synthase (TPS) and thiamine pyrophosphate (TPP), the key enzymes related to trehalose synthesis [27], responded to salt stress and were up-regulated. In the metabolic pathway of maltose synthesis, genes encoding α-amylase, β-amylase, and isoamylase were up-regulated. In the starch and sucrose metabolic pathway, genes related to the synthesis and metabolism of sucrose, starch, glucose, and fructose were down-regulated after salt stress, but the genes of trehalose and maltose synthesis were up-regulated.
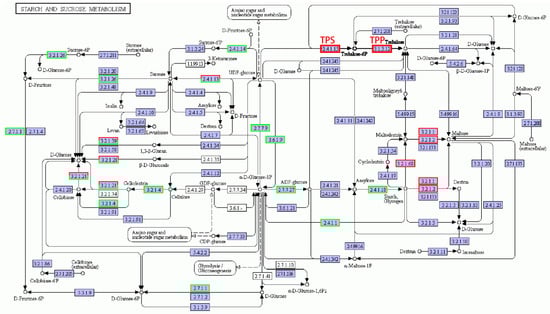
Figure 7.
Starch and sucrose metabolic pathways under salt stress conditions. Red box, up-regulated genes; green box, down-regulated genes; black box, no change in expression level compared to control. White in the box, no expression detected; blue, expression detected.
3.5. RT-qPCR Validation
All ten genes selected in the pathway of phenylpropanoid biosynthesis and starch and sucrose metabolism were consistent with the transcriptome analysis results (as shown in Figure 8). The correlation analysis showed that the expression levels of ten DEGs in RNA-seq and RT-qPCR had a strong positive correlation (R2 = 0.9858). It indicated that the results of the RT-qPCR analysis were in line with the transcriptome analysis after the young A. deliciosa ‘Xuxiang’ plants were treated with 1.0% salt.
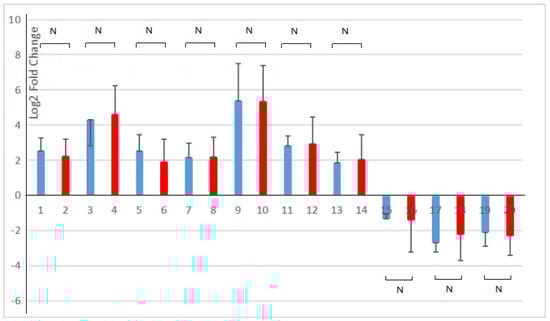
Figure 8.
Comparison of RNA-sequencing and RT-qPCR results of the selected DEGs. Blue, RNA-seq; red, RT-qPCR. 1, 2. Alpha-trehalose-phosphate synthase gene; 3, 4. Trehalose-phosphatase gene; 5, 6. Alpha-amylase gene; 7, 8. Beta-amylase gene; 9, 10. Feruloyl-CoA 6-hydroxylase gene; 11, 12. Ferulate 5-hydroxylase (F5H) gene; 13, 14. Coniferyl-alcohol glucosyl transferase gene; 15, 16. 1,4-Alpha-glucan branching enzyme gene; 17, 18. UTP-glucose-1-phosphate uridylyltransferase gene; 19, 20. 4-Coumarate:CoA ligase gene. RT-qPCR was performed on three salt-treated (1% w/v NaCl) and three control seedlings, normalized with the housekeeping gene elongation factor. The 2(−∆∆Ct) method was utilized to process the data [28]. N, p > 0.05.
4. Discussion
Soil salinization or salt is one of the most crucial abiotic stresses that limits crop growth and productivity [29]. Various life activities of plants under salt stress are affected in varying degrees, such as inhibiting plant growth and development, destroying plant cell structure, and decreasing the synthesis of biomolecules needed to maintain plant physiological metabolism [30,31]. The way for glycophytes to avoid ion toxicity is to sacrifice part of the senescent tissue to protect the growth of plant seedlings [32]. The poor condition of plants caused by the high concentration of salt ions is not only characterized by physiological drought or difficulty in water absorption, but also due to the absorption of too much salt, which leads to the absorption of some nutrient elements that are beneficial to plant growth, thus inhibiting the growth and development of plants [33]. In this study, the leaves of salt-treated plants yellowed, plant growth stagnated, and even died, while the control plants grew very well. The views of Yang et al. partly confirmed our results [32].
As network regulation responds to abiotic stress, genes will up-regulate and down-regulate when the plants are treated with salt and other abiotic stress. Over-, under- or mixed expression of genes was found in abiotic stress-treated plants [13,34]. Amirbakhtiar et al. [29] found that 5128 genes were differentially expressed due to salt stress in the root of a salinity-tolerant wheat cultivar. Teshome et al. [35] identified 1555 transcripts of up-regulated genes and 1264 transcripts of down-regulated genes in response to salt stress in Festulolium hybrids. Jin et al. [36] compared transcriptomes from salt-treated and salt-free Suaeda glauca samples, and 231 DEGs were detected, including 130 up-regulated genes and 101 down-regulated genes. The comparative transcriptome analysis results of wheat roots under salt stress showed that there were 152 up-regulated genes and 5 significantly down-regulated genes [36]. In our study, 5555 DEGs were detected between the salt-treated and control group, with 1546 genes up-regulated and 4009 genes down-regulated. Some identified transcripts showed significant sequence similarity with genes to be up-regulated or down-regulated during salt and other abiotic stresses. The expression levels of the genes encoding alpha-trehalose-phosphate synthase, trehalose-phosphatase, alpha-amylase, beta-amylase, feruloyl-CoA 6-hydroxylase, F5H, and coniferyl-alcohol glucosyl transferase in salt-treated A. deliciosa ‘Xuxiang’ plantlets were significantly higher than those of control plants.
Among the plant hormone signaling pathways enriched in most differential genes, growth hormone, cytokinin, gibberellin, ethylene, and jasmonic acid metabolism were all down-regulated by salt stress, but salicylate metabolism was up-regulated (see Figure 5). The synthesis of growth hormone, cytokinin, gibberellin, and oleuropein lactone was reduced, especially the growth hormone synthesis pathway, which was enriched with many down-regulated differential genes. It suggests that when the ‘Xuxiang’ kiwifruit is subjected to salt stress, growth-related hormone pathways may be blocked, the synthesis of growth-promoting hormones is slowed down, and growth is inhibited. Noor et al. found that exogenous jasmonic acid can control salt stress [37]. However, the jasmonic acid-related genes were down-regulated, and the salicylic acid metabolism gene was up-regulated in the salt-treated ‘Xuxiang’ kiwifruit plants. Boamah et al. showed that salicylic acid could effectively protect the integrity of cell membranes during Trichoderma longibrachiatum seed germination and enhance the viability of its seeds under NaCl stress [38]. When ‘Xuxiang’ was subjected to salt stress, up-regulation of genes related to salicylate hormone synthesis led to a salt injury reduction and a salt tolerance increase.
Some transcripts are associated with the cell wall, in which lignin is the major component in salt tolerance [39]. The lignin content of plants was found to be positively related to salt stress [40]. Many genes from phenylpropanoid metabolism pathways that are known to take part in lignin biosynthesis were involved in the salt stress response [39,41]. Chun et al. [37] found that the lignin content of Arabidopsis plants increased after salt stress. In this study, the vital enzymes for lignin synthesis, F5H and UGT72E2, which are in the pathway for phenylpropane biosynthesis related to lignin synthesis, were up-regulated. We suggest that the up-regulation of key genes for lignin synthesis could provide more raw material for the synthesis of plant secondary cell walls, which would be more difficult to penetrate with salt when thickened. The up-regulation of key genes for lignin synthesis could thus serve as an indicator that the plant senses and responds to salt stress in the first place.
Soluble sugar metabolism contributes to salt tolerance [13,14]. Starch and sucrose metabolism is involved in the salt stress response in plants [13,14,42,43]. For example, Chen et al. [43] found that DEGs associated with phenylpropanoid biosynthesis and starch and sucrose metabolism were involved in the salt stress response in maize. The genes in the sucrose, starch, glucose, and fructose synthesis and metabolism pathways were down-regulated after salt treatment, while the expression levels of the genes in the trehalose and maltose synthesis pathways were up-regulated. Sucrose, glucose, fructose, trehalose, and maltose are all soluble sugars [44,45], but only the expression levels of the genes in the trehalose and maltose synthesis pathways were up-regulated (see Figure 4). The accumulation of the soluble sugars trehalose and maltose was beneficial for improving the ability of plants to regulate osmotically and enhanced salt tolerance.
It has been pointed out that trehalose could form a unique protective layer on the cell surface to prevent the phase transition of the biofilm or replace the lost water membrane of biological macromolecules in harsh environments such as high osmotic pressure and effectively protect the structure of nucleic acids, proteins, and other macromolecules, and maintain the survival and biological characteristics of life [46,47]. Some TPS- and TPP-related genes are regulated in response to abiotic stresses, including salt stress in plants [48]. An increase in the content of trehalose can improve the salt resistance of plants. In this study, the expression levels of the differential genes encoding TPS or TPP were up-regulated after salt treatment.
5. Conclusions
The salt tolerance of A. deliciosa is related to the expression level changes in the genes in the pathways of plant hormone signal transduction, phenylpropanoid biosynthesis, and starch, sucrose, glucose, and fructose metabolism. The vital genes related to lignin synthesis were up-regulated, and the genes related to the synthesis and metabolism of sucrose, starch, glucose, and fructose were down-regulated after salt treatment, while the expression levels of the genes for the synthesis of trehalose and maltose were up-regulated. The expression levels of the genes encoding alpha-trehalose-phosphate synthase, trehalose-phosphatase, alpha-amylase, beta-amylase, feruloyl-CoA 6-hydroxylase, F5H, and coniferyl-alcohol glucosyl transferase were up-reregulated when the A. deliciosa ‘Xuxiang’ plantlets were treated with 1% salt. These genes might be vital to the salt stress response of the young A. deliciosa plants.
Author Contributions
Conceptualization, H.Z. and X.L.; methodology, J.W.; software, Z.Z.; validation, Z.W., W.Z. and Z.Z.; formal analysis, Z.W.; resources, D.C.; data curation, W.Z. and D.C.; writing—original draft preparation, J.W.; writing—review and editing, H.Z.; visualization, Z.Z.; supervision, H.Z.; project administration, X.L.; funding acquisition, H.Z. All authors have read and agreed to the published version of the manuscript.
Funding
The project was supported by the Agricultural Joint Key Project in Yunnan Province (202301BD070001-003), the Yunnan Academician (expert) Workstation Project (202305AF150020), and the National Natural Science Foundation of China (Grant No. 31760450).
Institutional Review Board Statement
Not applicable.
Informed Consent Statement
Not applicable.
Data Availability Statement
All data generated or analyzed during this study are included in this published article. RNA-Seq data were presented at the Genome Sequence Archive of the Beijing Institute of Genomics (BIG) Data Center (accession number CRA002280, https://ngdc.cncb.ac.cn/search/?dbId=gsa&q=CRA002280, accessed on 18 July 2022).
Acknowledgments
The authors thank research scientist Xiuying Chen of the New Zealand Institute for Plant & Food Research for her critical reading of the manuscript. The authors also thank Yongchao Yang for his assistance in the formal analysis.
Conflicts of Interest
The authors declare no conflict of interest. The funders had no role in the design of the study; in the collection, analyses, or interpretation of data; in the writing of the manuscript; or in the decision to publish the results.
References
- Ye, X.; Wang, H.; Cao, X.; Jin, X.; Cui, F.; Bu, Y.; Liu, H.; Wu, W.; Takano, T.; Liu, S. Transcriptome profiling of Puccinellia tenuiflora during seed germination under a long-term saline-alkali stress. BMC Genom. 2019, 20, 589. [Google Scholar] [CrossRef] [PubMed]
- Akram, M.S.; Shahid, M.; Tariq, M.; Azeem, M.; Javed, M.T.; Saleem, S.; Riaz, S. Deciphering Staphylococcus sciuri SAT-17 mediated anti-oxidative defense mechanisms and growth modulations in salt stressed maize (Zea mays L.). Front Microbiol. 2016, 7, 867. [Google Scholar] [CrossRef] [PubMed]
- Çelik, Ö.; Atak, Ç. Random amplified polymorphic DNA analysis of salt-tolerant tobacco mutants generated by gamma radiation. Genet. Mol. Res. 2015, 14, 1324–1337. [Google Scholar] [CrossRef] [PubMed]
- Primo-Capella, A.; Forner-Giner, M.Á.; Martínez-Cuenca, M.R.; Terol, J. Comparative transcriptomic analyses of citrus cold-resistant vs. sensitive rootstocks might suggest a relevant role of ABA signaling in triggering cold scion adaption. BMC Plant Biol. 2022, 22, 209. [Google Scholar] [CrossRef]
- Harfouche, A.; Meilan, R.; Kirst, M.; Morgante, M.; Boerjan, W.; Sabatti, M.; Scarascia Mugnozza, G. Accelerating the domestication of forest trees in a changing world. Trends Plant Sci. 2012, 17, 64–72. [Google Scholar] [CrossRef]
- Liu, X.; Zhang, Z.; Bian, W.; Duan, A.; Zhang, H. Enhancing the expression of ARK1 genes in poplar leads to multiple branches and transcriptomic changes. R. Soc. Open Sci. 2020, 7, 201201. [Google Scholar] [CrossRef]
- Li, Y.; Zhang, Z.; Liu, X.; Wei, Z.; Zhang, X.; Bian, W.; Li, S.; Zhang, H. Transcriptome analysis of the low temperature- treated tetraploid yellow Actinidia chinensis Planch. tissue culture plantlets. Life 2022, 12, 1573. [Google Scholar] [CrossRef]
- Quiroz-Iturra, L.F.; Simpson, K.; Arias, D.; Silva, C.; González-Calquin, C.; Amaza, L.; Handford, M.; Stange, C. Carrot DcALFIN4 and DcALFIN7 transcription factors boost carotenoid levels and participate differentially in salt stress tolerance when expressed in Arabidopsis thaliana and Actinidia deliciosa. Int. J. Mol. Sci. 2022, 23, 12157. [Google Scholar] [CrossRef]
- Hao, S.; Zhao, T.; Xia, X.; Yin, W. Genome-wide comparison of two poplar genotypes with different growth rates. Plant Mol. Biol. 2011, 76, 575–591. [Google Scholar] [CrossRef]
- Ganie, S.A.; Molla, K.A.; Henry, R.J.; Bhat, K.V.; Mondal, T.K. Advances in understanding salt tolerance in rice. Theor. Appl. Genet. 2019, 132, 851–870. [Google Scholar] [CrossRef]
- Zhang, H.; Wu, J.; Liu, X.; Wei, Z.; Zhang, Z.; Bian, W. Method for the Induction of Salt-Tolerant Mutants in ‘Xuxiang’ Kiwifruit Tissue-Cultured Seedlings. Chinese Patent ZL201910566729.8, 27 June 2019. (In Chinese). [Google Scholar]
- Che, Y.; Yao, T.; Wang, H.; Wang, Z.; Zhang, H.; Sun, G.; Zhang, H. Potassium ion regulates hormone, Ca2+ and H2O2 signal transduction and antioxidant activities to improve salt stress resistance in tobacco. Plant Physiol. Biochem. 2022, 186, 40–51. [Google Scholar] [CrossRef]
- Ahmad, M.; Li, J.; Yang, Q.; Jamil, W.; Teng, Y.; Bai, S. Phylogenetic, molecular, and functional characterization of PpyCBF proteins in asian pears (Pyrus pyrifolia). Int. J. Mol. Sci. 2019, 20, 2074. [Google Scholar] [CrossRef]
- Daldoul, S.; Hanzouli, F.; Hamdi, Z.; Chenenaoui, S.; Wetzel, T.; Nick, P.; Mliki, A.; Gargouri, M. The root transcriptome dynamics reveals new valuable insights in the salt-resilience mechanism of wild grapevine (Vitis vinifera subsp. sylvestris). Front. Plant Sci. 2022, 13, 1077710. [Google Scholar] [CrossRef]
- Hajiboland, R.; Bahrami-Rad, S.; Akhani, H.; Poschenrieder, C. Salt tolerance mechanisms in three Irano-Turanian Brassicaceae halophytes relatives of Arabidopsis thaliana. J. Plant Res. 2018, 131, 1029–1046. [Google Scholar] [CrossRef]
- Yiman, Q.; Miaomiao, L.; Kun, Y.; Mingtao, F. Effect of skin maceration treatment on aroma profiles of kiwi wines elaborated with Actinidia deliciosa “Xuxiang” and A. chinensis “Hort16A”. J. AOAC Int. 2019, 102, 683–685. [Google Scholar] [CrossRef]
- Munakata, R.; Takemura, T.; Tatsumi, K.; Moriyoshi, E.; Yanagihara, K.; Sugiyama, A.; Suzuki, H.; Seki, H.; Muranaka, T.; Kawano, N.; et al. Isolation of Artemisia capillaris membrane-bound di-prenyltransferase for phenylpropanoids and redesign of artepillin C in yeast. Commun. Biol. 2019, 2, 384. [Google Scholar] [CrossRef]
- Anders, S.; Huber, W. Differential expression analysis for sequence count data. Genome Biol. 2010, 11, R106. [Google Scholar] [CrossRef]
- Sedgwick, P. Multiple hypothesis testing and Bonferroni’s correction. Br. Med. J. 2014, 349, g6284. [Google Scholar] [CrossRef]
- Liang, K. False discovery rate estimation for large-scale homogeneous discrete p-values. Biometrics 2016, 72, 639–648. [Google Scholar] [CrossRef]
- Li, S.; Liu, X.; Liu, H.; Zhang, X.; Ye, Q.; Zhang, H. Induction, identification and genetics analysis of tetraploid Actinidia chinensis. R. Soc. Open Sci. 2019, 6, 191052. [Google Scholar] [CrossRef]
- Ku, Y.S.; Sintaha, M.; Cheung, M.Y.; Lam, H.M. Plant hormone signaling crosstalks between biotic and abiotic stress responses. Int. J. Mol. Sci. 2018, 19, 3206. [Google Scholar] [CrossRef] [PubMed]
- Boudet, A.M. Evolution and current status of research in phenolic compounds. Phytochemistry 2007, 68, 2722–2735. [Google Scholar] [CrossRef] [PubMed]
- Godwin, J.; Farrona, S. Plant epigenetic stress memory induced by drought: A physiological and molecular perspective. Methods Mol. Biol. 2020, 2093, 243–259. [Google Scholar] [CrossRef] [PubMed]
- Lanot, A.; Hodge, D.; Jackson, R.G.; George, G.L.; Elias, L.; Lim, E.K.; Vaistij, F.E.; Bowles, D.J. The glucosyltransferase UGT72E2 is responsible for monolignol 4-O-glucoside production in Arabidopsis thaliana. Plant J. 2006, 48, 286–295. [Google Scholar] [CrossRef] [PubMed]
- Kim, J.; Choi, B.; Park, Y.H.; Cho, B.K.; Lim, H.S.; Natarajan, S.; Park, S.U.; Bae, H. Molecular characterization of ferulate 5-hydroxylase gene from kenaf (Hibiscus cannabinus L.). Sci. World J. 2013, 2013, 421578. [Google Scholar] [CrossRef]
- de Oliveira, L.P.; Navarro, B.V.; de Jesus Pereira, J.P.; Lopes, A.R.; Martins, M.C.M.; Riaño-Pachón, D.M.; Buckeridge, M.S. Bioinformatic analyses to uncover genes involved in trehalose metabolism in the polyploid sugarcane. Sci. Rep. 2022, 12, 7516. [Google Scholar] [CrossRef]
- Jang, I.C.; Oh, S.J.; Seo, J.S.; Choi, W.B.; Song, S.I.; Kim, C.H.; Kim, Y.S.; Seo, H.S.; Choi, Y.D.; Nahm, B.H.; et al. Expression of a bifunctional fusion of the Escherichia coli genes for trehalose-6-phosphate synthase and trehalose-6-phosphate phosphatase in transgenic rice plants increases trehalose accumulation and abiotic stress tolerance without stunting growth. Plant Physiol. 2003, 131, 516–524. [Google Scholar] [CrossRef]
- Amirbakhtiar, N.; Ismaili, A.; Ghaffari, M.R.; Nazarian Firouzabadi, F.; Shobbar, Z.S. Transcriptome response of roots to salt stress in a salinity-tolerant bread wheat cultivar. PLoS ONE 2019, 14, e0213305. [Google Scholar] [CrossRef]
- Frukh, A.; Siddiqi, T.O.; Khan, M.I.R.; Ahmad, A. Modulation in growth, biochemical attributes and proteome profile of rice cultivars under salt stress. Plant Physiol. Biochem. 2020, 146, 55–70. [Google Scholar] [CrossRef]
- Truong, H.A.; Lee, W.J.; Jeong, C.Y.; Trịnh, C.S.; Lee, S.; Kang, C.S.; Cheong, Y.K.; Hong, S.W.; Lee, H. Enhanced anthocyanin accumulation confers increased growth performance in plants under low nitrate and high salt stress conditions owing to active modulation of nitrate metabolism. J. Plant Physiol. 2018, 231, 41–48. [Google Scholar] [CrossRef]
- Yang, Y.; Zheng, Q.; Liu, M.; Long, X.; Liu, Z.; Shen, Q.; Guo, S. Difference in sodium spatial distribution in the shoot of two canola cultivars under saline stress. Plant Cell Physiol. 2012, 53, 1083–1092. [Google Scholar] [CrossRef]
- Poór, P.; Borbély, P.; Czékus, Z.; Takács, Z.; Ördög, A.; Popović, B.; Tari, I. Comparison of changes in water status and photosynthetic parameters in wild type and abscisic acid-deficient sitiens mutant of tomato (Solanum lycopersicum cv. Rheinlands Ruhm) exposed to sublethal and lethal salt stress. J. Plant Physiol. 2019, 232, 130–140. [Google Scholar] [CrossRef]
- Bushman, B.S.; Amundsen, K.L.; Warnke, S.E.; Robins, J.G.; Johnson, P.G. Transcriptome profiling of Kentucky bluegrass (Poa pratensis L.) accessions in response to salt stress. BMC Genom. 2016, 17, 48. [Google Scholar] [CrossRef]
- Teshome, A.; Byrne, S.L.; Didion, T.; De Vega, J.; Jensen, C.S.; Klaas, M.; Barth, S. Transcriptome sequencing of Festulolium accessions under salt stress. BMC Res. Notes 2019, 12, 311. [Google Scholar] [CrossRef]
- Jin, H.; Dong, D.; Yang, Q.; Zhu, D. Salt-responsive transcriptome profiling of Suaeda glauca via RNA sequencing. PLoS ONE 2016, 11, e0150504. [Google Scholar] [CrossRef]
- Noor, J.; Ullah, A.; Saleem, M.H.; Tariq, A.; Ullah, S.; Waheed, A.; Okla, M.K.; Al-Hashimi, A.; Chen, Y.; Ahmed, Z.; et al. Effect of jasmonic acid foliar spray on the morpho-physiological mechanism of salt stress tolerance in two soybean varieties (Glycine max L.). Plants 2022, 11, 651. [Google Scholar] [CrossRef]
- Boamah, S.; Zhang, S.; Xu, B.; Li, T.; Calderón-Urrea, A.; John Tiika, R. Trichoderma longibrachiatum TG1 increases endogenous salicylic acid content and antioxidants activity in wheat seedlings under salinity stress. PeerJ 2022, 10, e12923. [Google Scholar] [CrossRef]
- Ruiz, K.B.; Maldonado, J.; Biondi, S.; Silva, H. RNA-seq analysis of salt-stressed versus non salt-stressed transcriptomes of Chenopodium quinoa Landrace R49. Genes 2019, 10, 1042. [Google Scholar] [CrossRef]
- Safdarian, M.; Askari, H.; Shariati, J.V.; Nematzadeh, G. Transcriptional responses of wheat roots inoculated with Arthrobacter nitroguajacolicus to salt stress. Sci. Rep. 2019, 9, 1792. [Google Scholar] [CrossRef]
- Nguyen, D.Q.; Brown, C.W.; Pegler, J.L.; Eamens, A.L.; Grof, C.P.L. Molecular manipulation of MicroRNA397 abundance influences the development and salt stress response of Arabidopsis thaliana. Int. J. Mol. Sci. 2020, 21, 7879. [Google Scholar] [CrossRef]
- Yuenyong, W.; Chinpongpanich, A.; Comai, L.; Chadchawan, S.; Buaboocha, T. Downstream components of the calmodulin signaling pathway in the rice salt stress response revealed by transcriptome profiling and target identification. BMC Plant Biol. 2018, 18, 335. [Google Scholar] [CrossRef] [PubMed]
- Chen, F.; Fang, P.; Peng, Y.; Zeng, W.; Zhao, X.; Ding, Y.; Zhuang, Z.; Gao, Q.; Ren, B. Comparative proteomics of salt-tolerant and salt-sensitive maize inbred lines to reveal the molecular mechanism of salt tolerance. Int. J. Mol. Sci. 2019, 20, 4725. [Google Scholar] [CrossRef] [PubMed]
- Tatevossian, A. Hydrolysis of some carbohydrate substrates by enzymes of pooled human dental plaque fluid. Arch. Oral Biol. 1982, 27, 39–43. [Google Scholar] [CrossRef] [PubMed]
- Kerimi, A.; Nyambe-Silavwe, H.; Pyner, A.; Oladele, E.; Gauer, J.S.; Stevens, Y.; Williamson, G. Nutritional implications of olives and sugar: Attenuation of post-prandial glucose spikes in healthy volunteers by inhibition of sucrose hydrolysis and glucose transport by oleuropein. Eur. J. Nutr. 2019, 58, 1315–1330. [Google Scholar] [CrossRef]
- Miranda, J.A.; Avonce, N.; Suárez, R.; Thevelein, J.M.; Van Dijck, P.; Iturriaga, G. A bifunctional TPS-TPP enzyme from yeast confers tolerance to multiple and extreme abiotic-stress conditions in transgenic Arabidopsis. Planta 2007, 226, 1411–1421. [Google Scholar] [CrossRef]
- Ge, L.F.; Chao, D.Y.; Shi, M.; Zhu, M.Z.; Gao, J.P.; Lin, H.X. Overexpression of the trehalose-6-phosphate phosphatase gene OsTPP1 confers stress tolerance in rice and results in the activation of stress responsive genes. Planta 2008, 228, 191–201. [Google Scholar] [CrossRef]
- Iordachescu, M.; Imai, R. Trehalose biosynthesis in response to abiotic stresses. J Integr. Plant Biol. 2008, 50, 1223–1229. [Google Scholar] [CrossRef]


Disclaimer/Publisher’s Note: The statements, opinions and data contained in all publications are solely those of the individual author(s) and contributor(s) and not of MDPI and/or the editor(s). MDPI and/or the editor(s) disclaim responsibility for any injury to people or property resulting from any ideas, methods, instructions or products referred to in the content. |
© 2023 by the authors. Licensee MDPI, Basel, Switzerland. This article is an open access article distributed under the terms and conditions of the Creative Commons Attribution (CC BY) license (https://creativecommons.org/licenses/by/4.0/).