Article

Infliximab Inhibits Colitis Associated Cancer in Model Mice by Downregulating Genes Associated with Mast Cells and Decreasing Their Accumulation

Department of Surgery, Tohoku University Graduate School of Medicine, Sendai 980-8574, Japan
*
Author to whom correspondence should be addressed.
Curr. Issues Mol. Biol. 2023, 45(4), 2895-2907; https://doi.org/10.3390/cimb45040189
Submission received: 4 February 2023 / Revised: 26 March 2023 / Accepted: 28 March 2023 / Published: 1 April 2023
(This article belongs to the Special Issue Molecular-Based Approaches in Therapy for Gastrointestinal Cancers)

Abstract

:
Inflammatory bowel diseases (IBDs), such as Crohn’s disease or ulcerative colitis, can be treated with anti TNF-alpha (TNF-α) antibodies (Abs), but they also put patients with IBDs at risk of cancer. We aimed to determine whether the anti TNF-α Ab induces colon cancer development in vitro and in vivo, and to identify the genes involved in colitis-associated cancer. We found that TNF-α (50 ng/mL) inhibited the proliferation, migration, and invasion of HCT8 and COLO205 colon cancer cell lines and that anti TNF-α Ab neutralized TNF-α inhibition in vitro. The effects of anti TNF-α Ab, infliximab (10 mg/kg) were investigated in mouse models of colitis-associated cancer induced by intraperitoneally injected azoxymethane (AOM: 10 mg/kg)/orally administered dextran sodium sulfate (DSS: 2.5%) (AOM/DSS) in vivo. Infliximab significantly attenuated the development of colon cancer in these mice. Microarray analyses and RT-qPCR revealed that mast cell protease 1, mast cell protease 2, and chymase 1 were up-regulated in cancer tissue of AOM/DSS mice; however, those mast cell related genes were downregulated in cancer tissue of AOM/DSS mice with infliximab. These results suggested that mast cells play a pivotal role in the development of cancer associated with colitis in AOM/DSS mice.

1. Introduction

Inflammatory bowel diseases (IBDs), including Crohn’s disease (CD) and ulcerative colitis (UC), are chronic states that cause intestinal inflammation in any part of the gastrointestinal tract and in all parts of the large intestine, respectively [1,2]. The incidence and prevalence of IBDs are increasing in different regions around the world. The highest annual incidences of UC were 24.3 in Europe, 6.3 in Asia and the Middle East, and 19.2 in North America (per 100,000 person years), respectively. The highest annual incidences of CD were 12.7 in Europe, 5.0 in Asia and the Middle East, and 20.2 in North America (per 100,000 person years), respectively [3]. Uncontrolled inflammation leads to intestinal stenosis, obstruction, bleeding, and perforation in patients with IBDs, which results in high morbidity and a poor quality of life [1,2]. Therefore, effective medications to maintain the remission of IBDs are essential. IBDs are currently treated with 5-aminosalicylic acid (5-ASA), steroids, immunomodulators, antibiotics, and anti TNF-α antibodies (Abs). Among them, anti TNF-α Abs was a major breakthrough in IBD treatment [4]. Anti TNF-α Abs have reduced hospitalizations and surgical interventions in patients with IBDs [5]. Recently, other novel anti-inflammatory treatments focusing inflammatory pathways, such as cellular signaling anti-interleukin 12/23 agents and Janus kinase inhibitors and leukocyte trafficking, have been developed [2]. Furthermore, new therapeutic targets, including B cells, innate lymphoid cells, bile acids, the brain–gut axis, and microbiota have been highlighted [2]. Although treatment failure is seen in a significant proportion of patients treated with anti TNF-α Abs, anti TNF-α Abs are still mainstream to treat patients with IBDs [6].
The proinflammatory cytokine TNF-α is involved in systemic inflammation. The balance of TNF-α and other proinflammatory cytokines is maintained by anti-inflammatory factors, and disruption of this balance might lead to IBDs [7,8]. TNF-α is elevated in inflamed tissues from patients with CD [9]. Macrophages, lymphocytes, fibroblasts, keratinocytes, mast cells, dendritic cells, and tumor cells synthesize TNF-α [10], which not only induces inflammation, but also inhibits carcinogenesis by promoting apoptosis, inducing vascular endothelial cell necrosis in tumors, and activating immunocytes and tumor immunity [11,12,13]. However, TNF-α can increase carcinogenesis by activating the Wnt/β-catenin signaling pathway, inducing mutations in oncogenes, and promoting angiogenesis in tumors, as well as the proliferation and invasiveness of cancer cells [13,14,15]. Patients with CD have a 2.4-fold increased risk of colorectal cancer [16], and those with IBDs treated with anti TNF-α Abs are at risk of developing cancer [17,18,19,20]. In fact, the product label for anti TNF-α Ab warns against its application to patients with extant cancer. We encountered four cancer patients with CD and a history of anti TNF-α Ab therapy before being diagnosed with advanced anorectal cancer [18]. This raises the question of whether anti TNF-α Ab induces carcinogenesis in the colon.
The present study analyzed the effects of TNF-α and the anti TNF-α Ab on the proliferation, migration, and invasion of human colon cancer cell lines in vitro. Then, we verified if anti TNF-α Ab inhibits carcinogenesis in mouse models of colitis-associated cancer in vivo. Furthermore, comprehensive gene expression analysis was carried out to identify the genes involved in colitis-associated cancer.

2. Materials and Methods

2.1. Chemicals and Cell Lines

The following reagents and cell lines were purchased from the respective suppliers; RPMI 1640, fetal bovine serum (FBS) and penicillin-streptomycin (Sigma-Aldrich Corp., St. Louis, MO, USA); azoxymethane (AOM; Wako Chemicals, Osaka, Japan); dextran sulfate sodium (DSS) salt (colitis-induced grade) (MP Biomedicals Inc., Irvine, CA, USA); infliximab (IFX; Mitsubishi Tanabe, Tokyo, Japan); and Human TNF-α (Abcam 9642), human anti TNF-α antibody (Abcam 7742; both from Abcam, Cambridge, UK). The colon cancer cell lines HCT8, HCT116, and COLO205 (ATCC., Manassas, VA, USA) were cultured in RPMI-1640 medium containing 10% FBS and 1% penicillin-streptomycin at 37 °C under a 5% CO2 atmosphere.

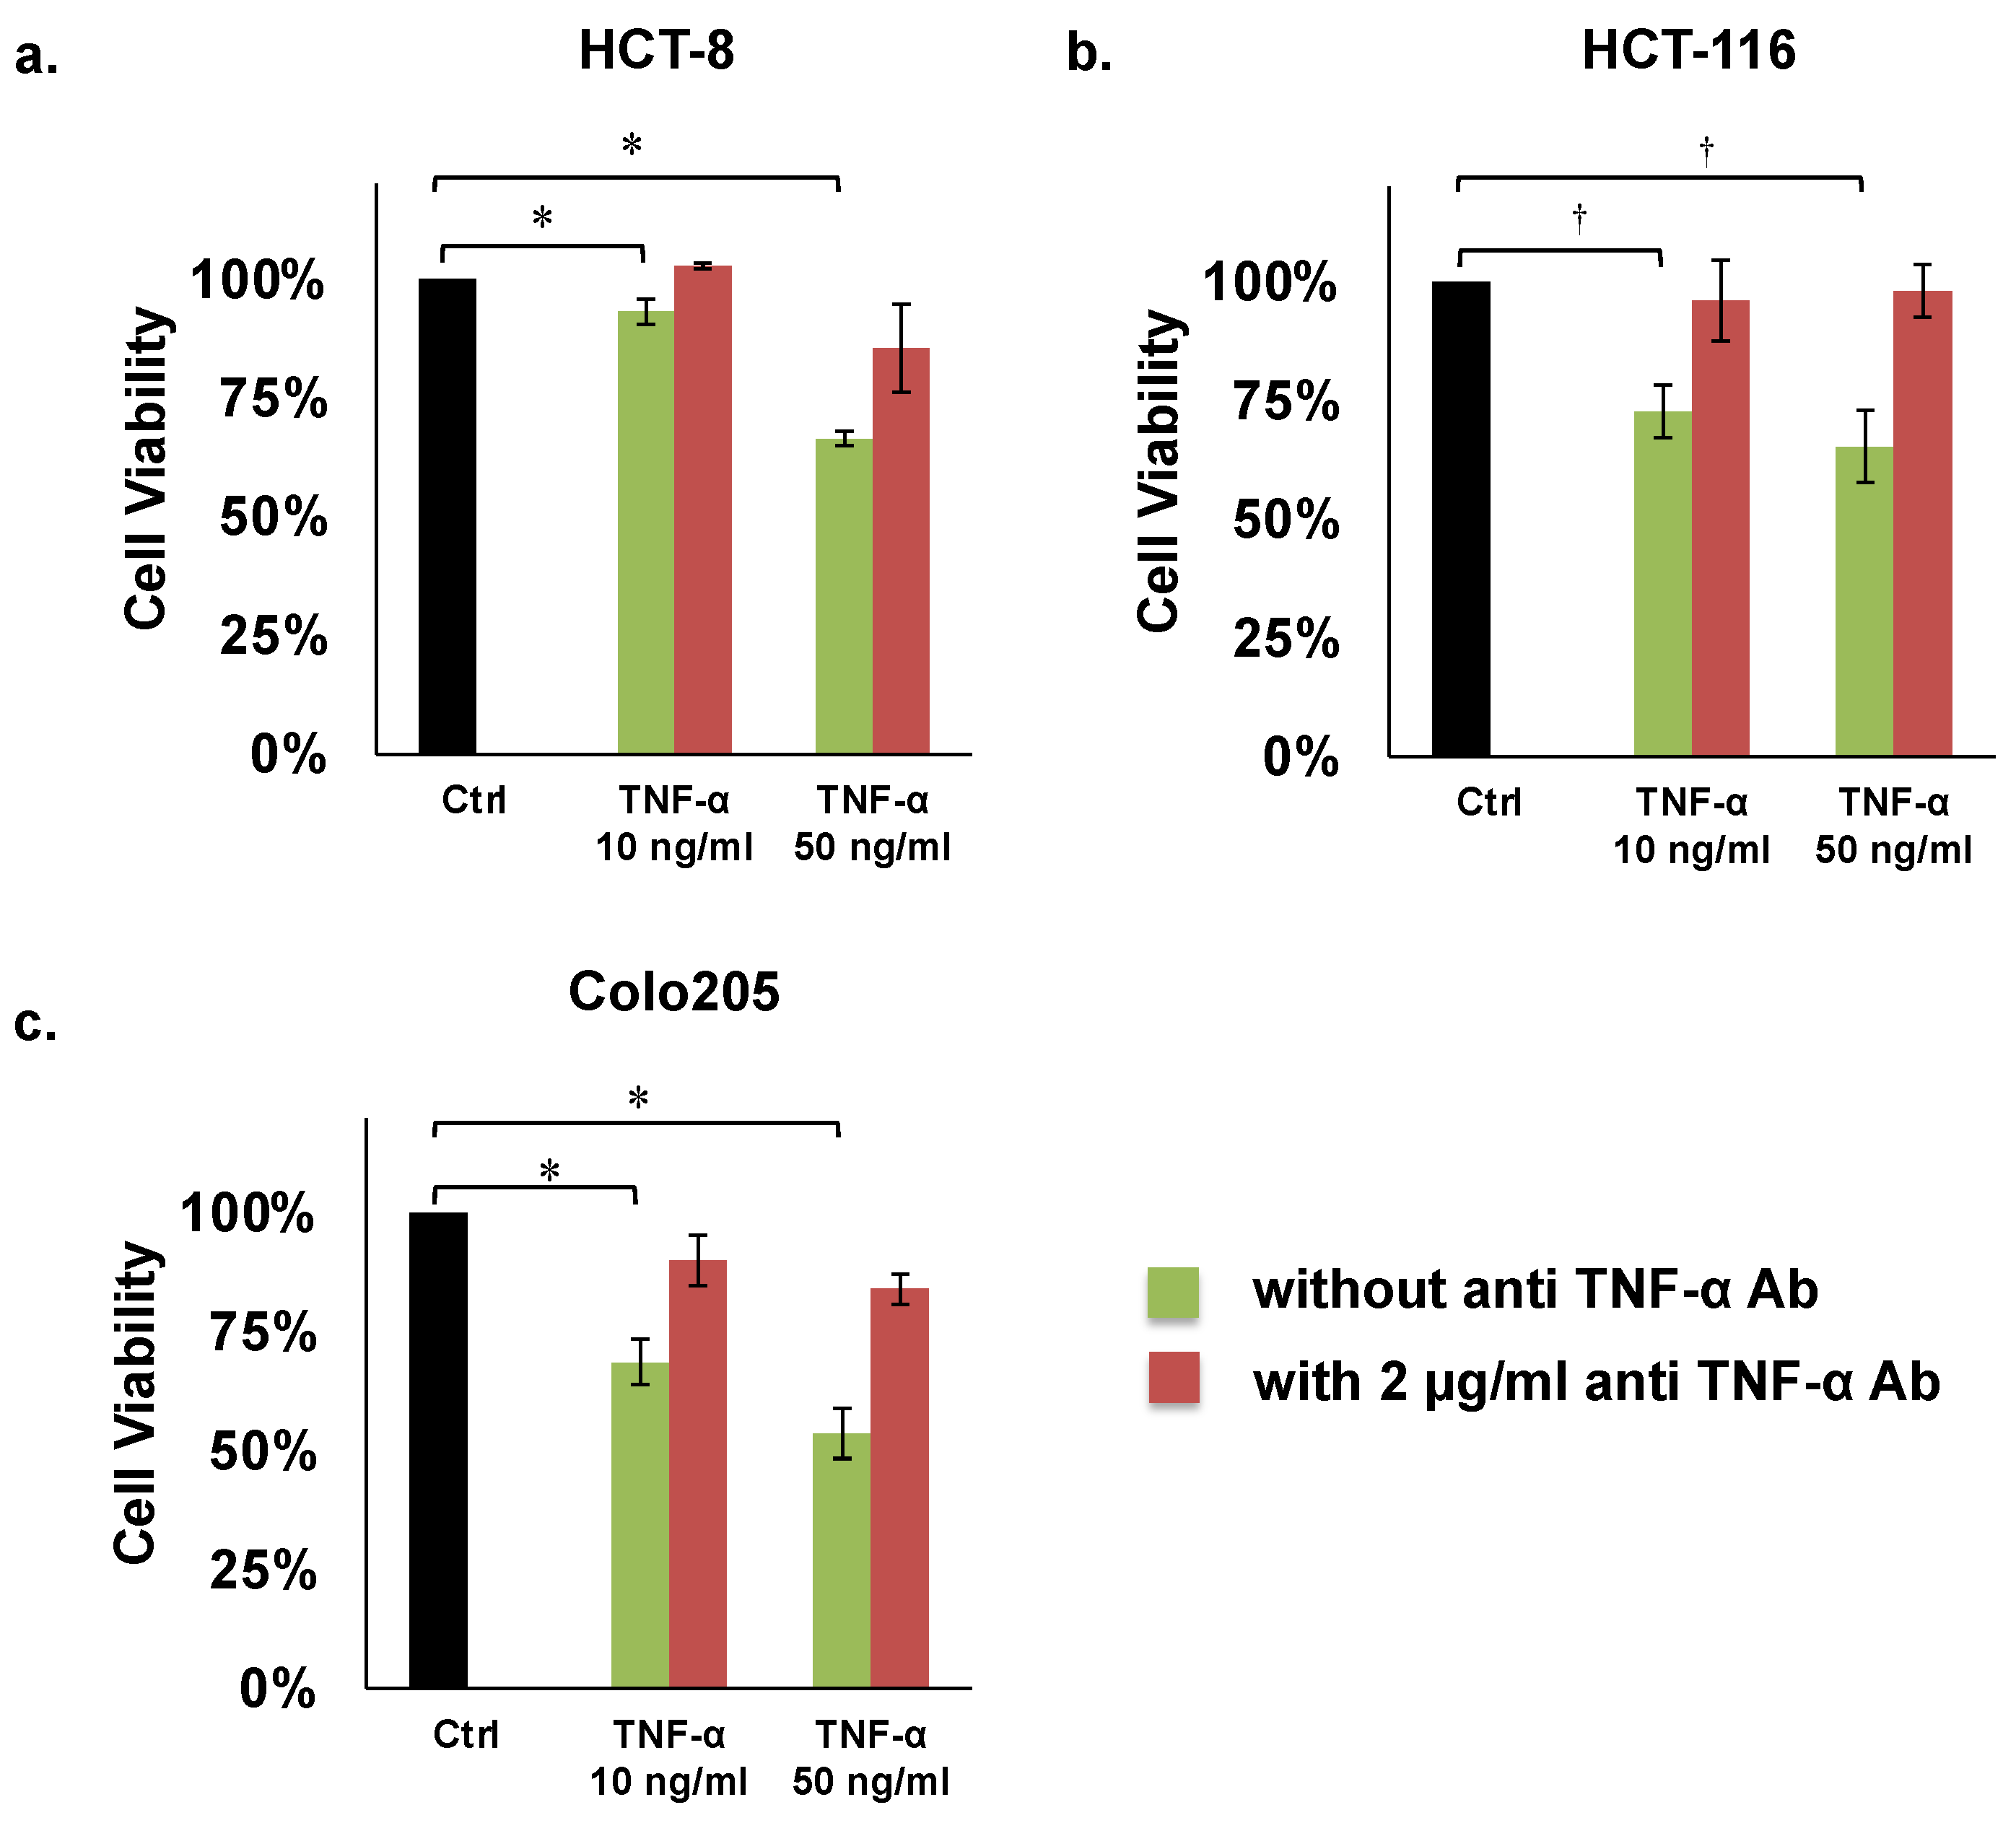
2.2. Proliferation Assays

Cell proliferation was determined by counting cells stained with Trypan blue. Cancer cells (2 × 10⁴) in 2 mL of medium were seeded in 24-well dishes and incubated for 12 h. Thereafter, 10 or 50 ng/mL of TNF-α with or without 2 µg/mL of human anti TNF-α antibody were added to fresh medium and incubated for 24 h. Then, the cells stained with 0.4% Trypan blue on slides were enumerated using a TC20 Automated Cell Counter (Bio-Rad Laboratories Inc., Hercules, CA, USA). Cell survival was calculated as ratios (%) of live cells incubated with TNF-α with or without anti TNF-α antibody to control cells. The results were obtained from three independent experiments.

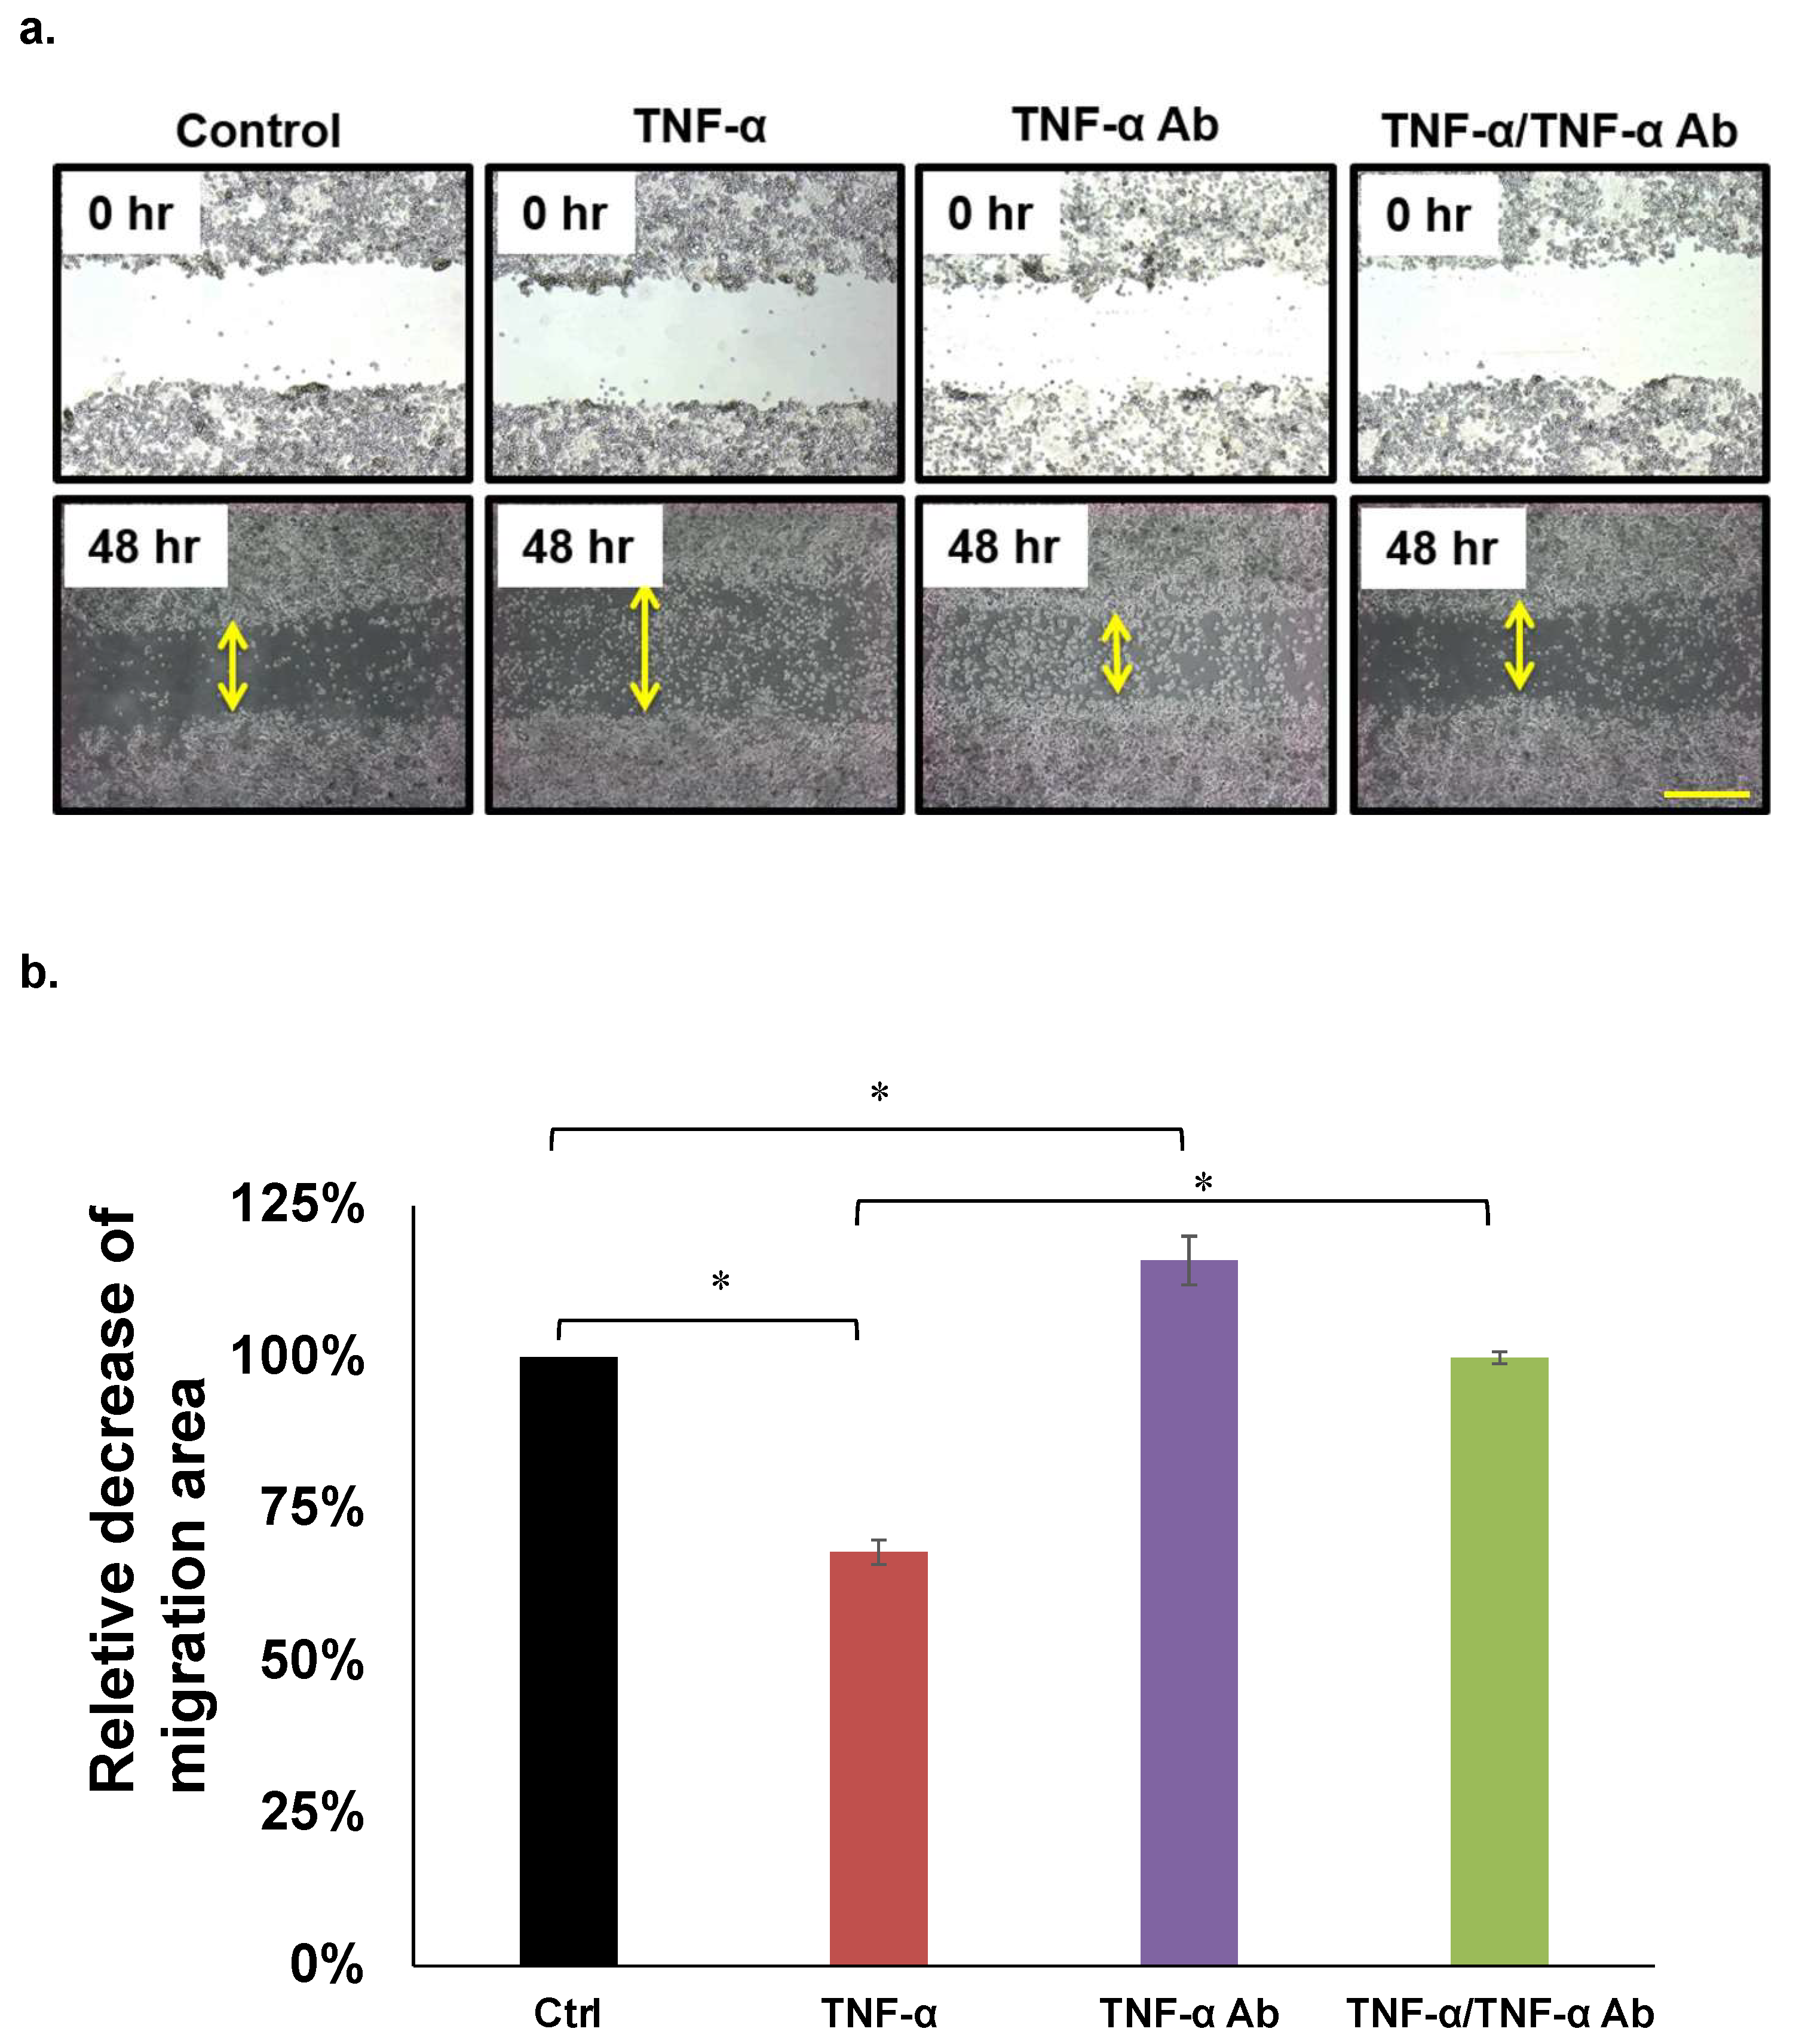
2.3. Migration Assays

Cancer cell migration was determined using scratch assays as follows. Briefly, 2 × 10⁵ cancer cells in 2 mL media/well were seeded in 12-well dishes; then, 50 ng/mL of TNF-α and/or 2 µg/mL of human anti TNF-α antibody were added to the wells. Confluent cell monolayers were scratched using Eppendorf pipet tips. Images of scratches were captured before and at 48 h after incubation in RPMI-1640 medium without FBS. Digital images of gap closure were acquired using a BZ-9000 microscope (Keyence, Tokyo, Japan). Migration areas were analyzed using ImageJ software, and data are presented as decreases in the average migration area relative to that of controls. The results were obtained from three independent experiments.

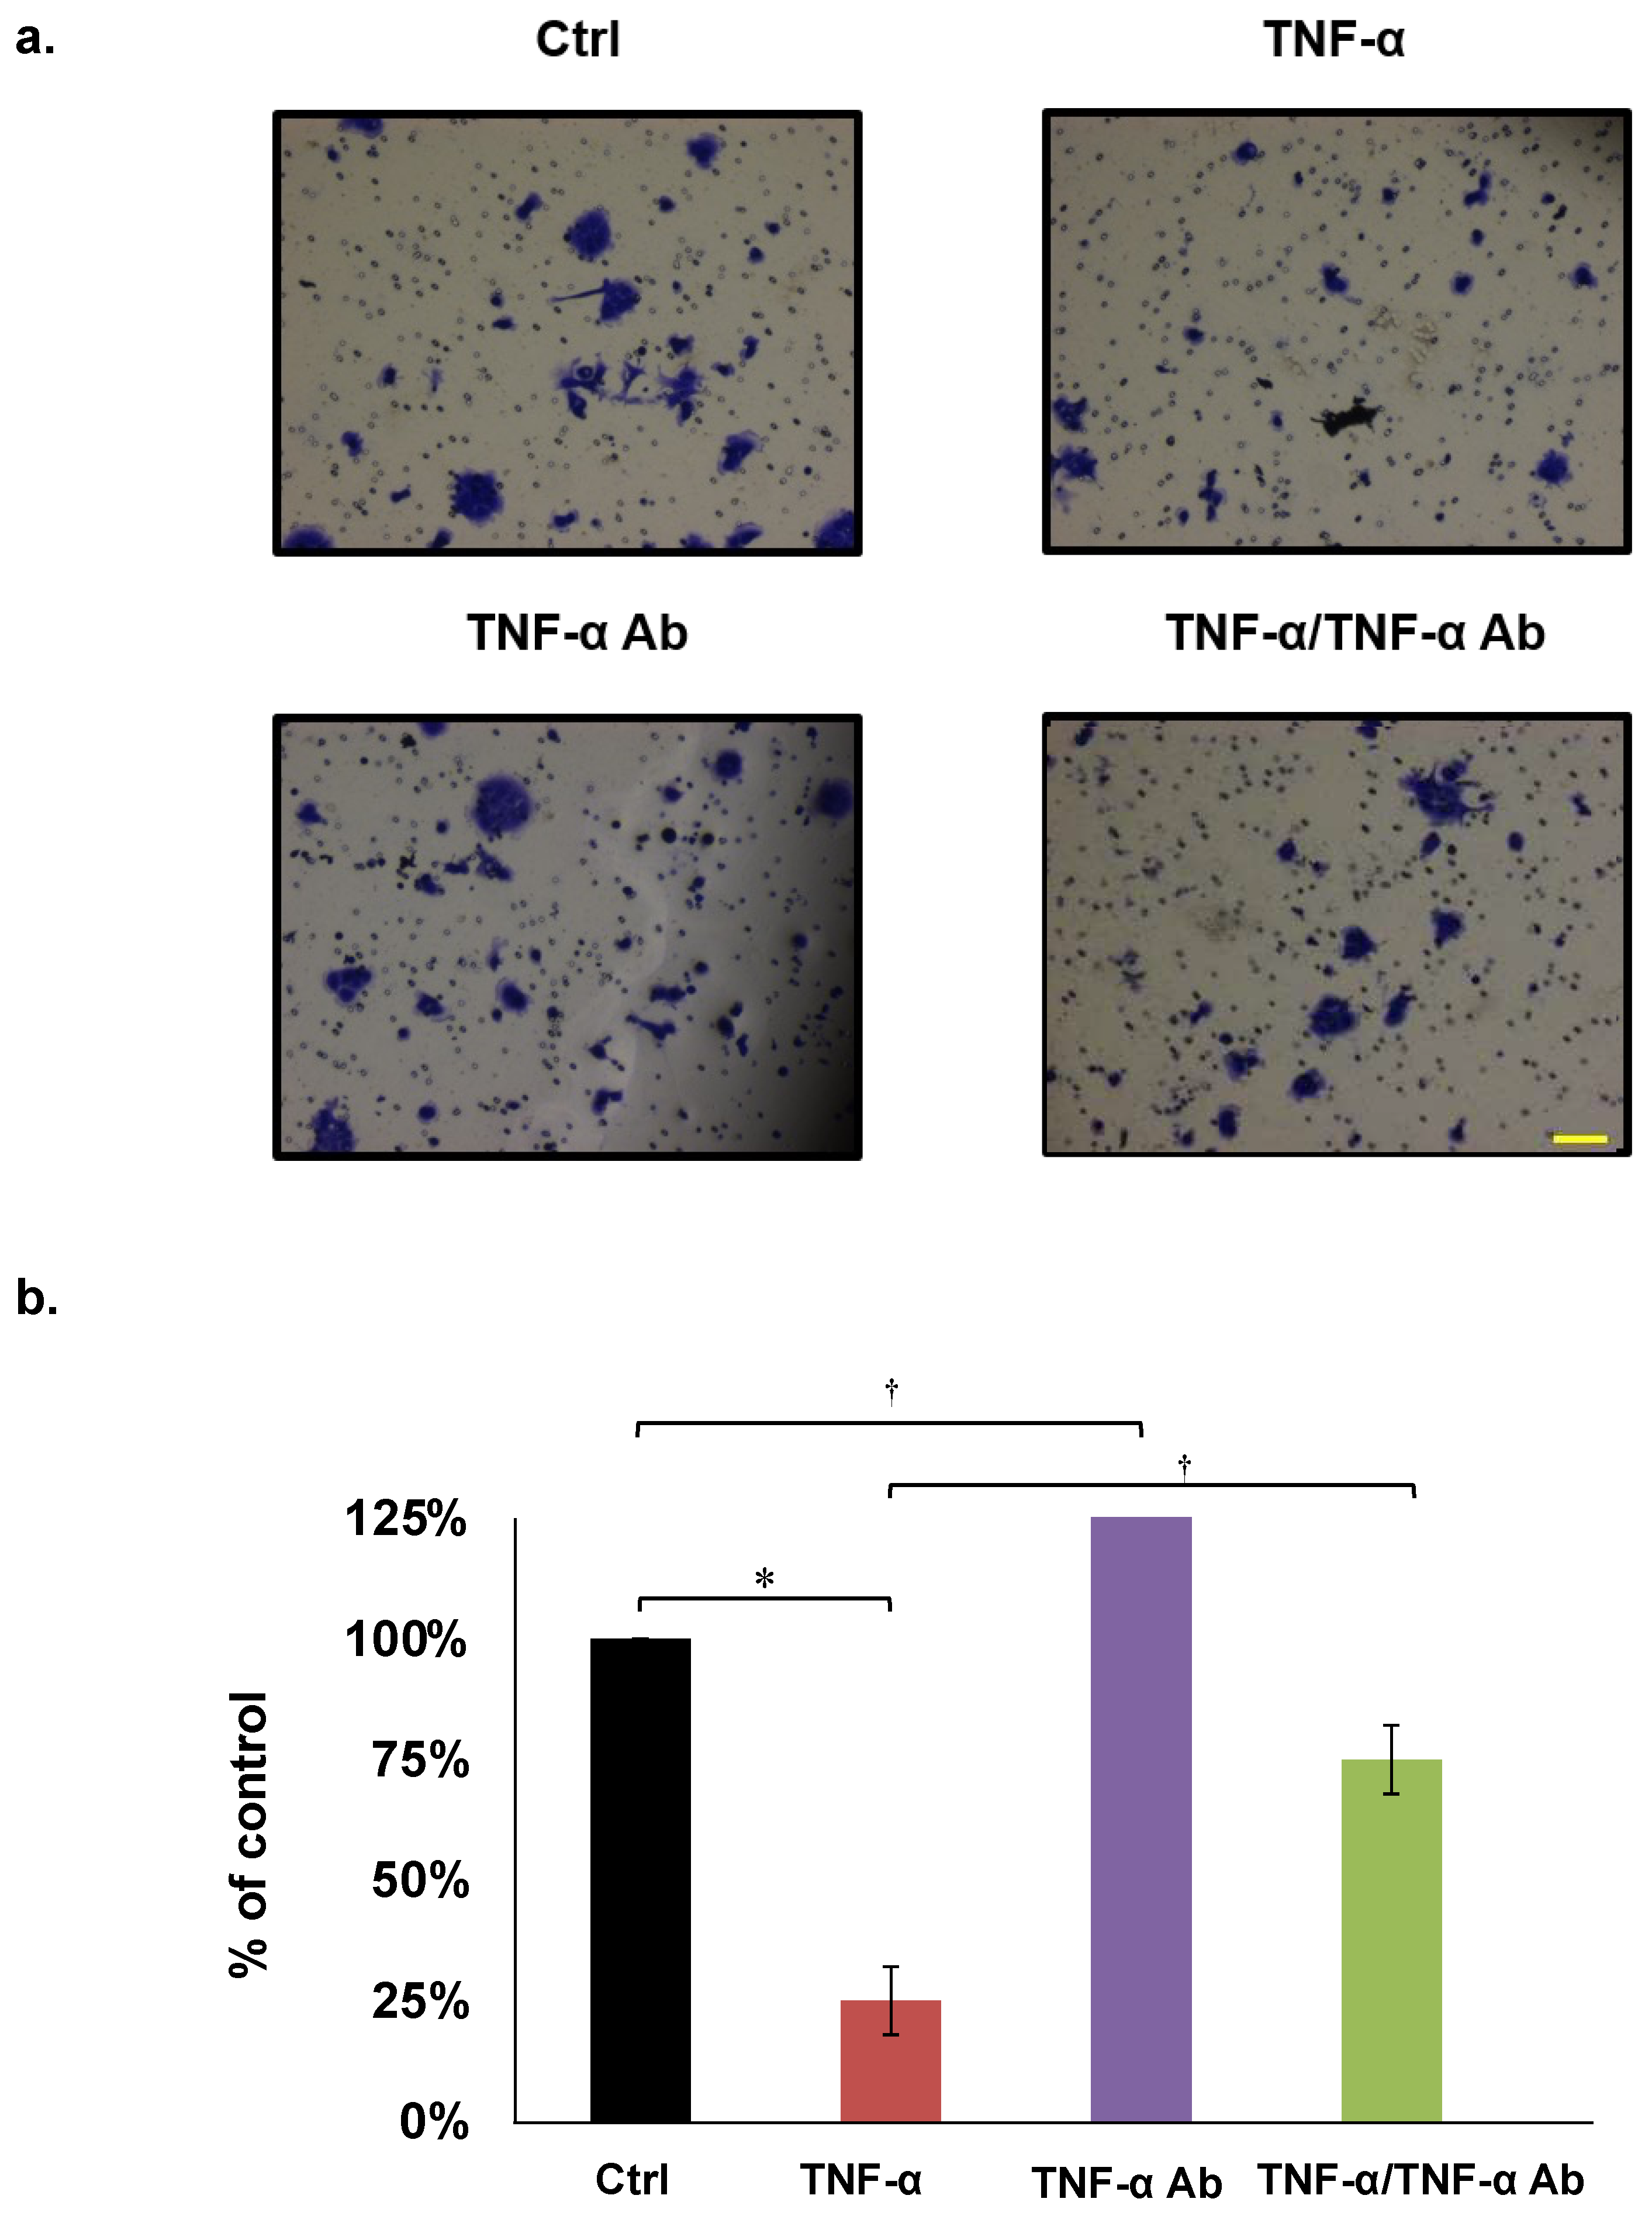
2.4. Invasion Assays

Invasiveness was assayed using BioCoat Matrigel Invasion Chambers (Corning Inc., Corning, NY, USA), as described by the manufacturer. Cancer cells (1 × 10⁵) with FBS-free medium were placed in the chambers, then incubated for 22 h with 50 ng/mL of TNF-α and/or 2 µg/mL of human anti TNF-α antibody. Cells on the lower surface of the filter in the chamber were fixed and stained with 1% crystal violet (Wako, Osaka, Japan). Cell invasion was defined as density (%) in five selected microscope fields at 20 h, compared with 0 h. Data are shown as increases in average cell density relative to controls. The results were obtained from three independent experiments.

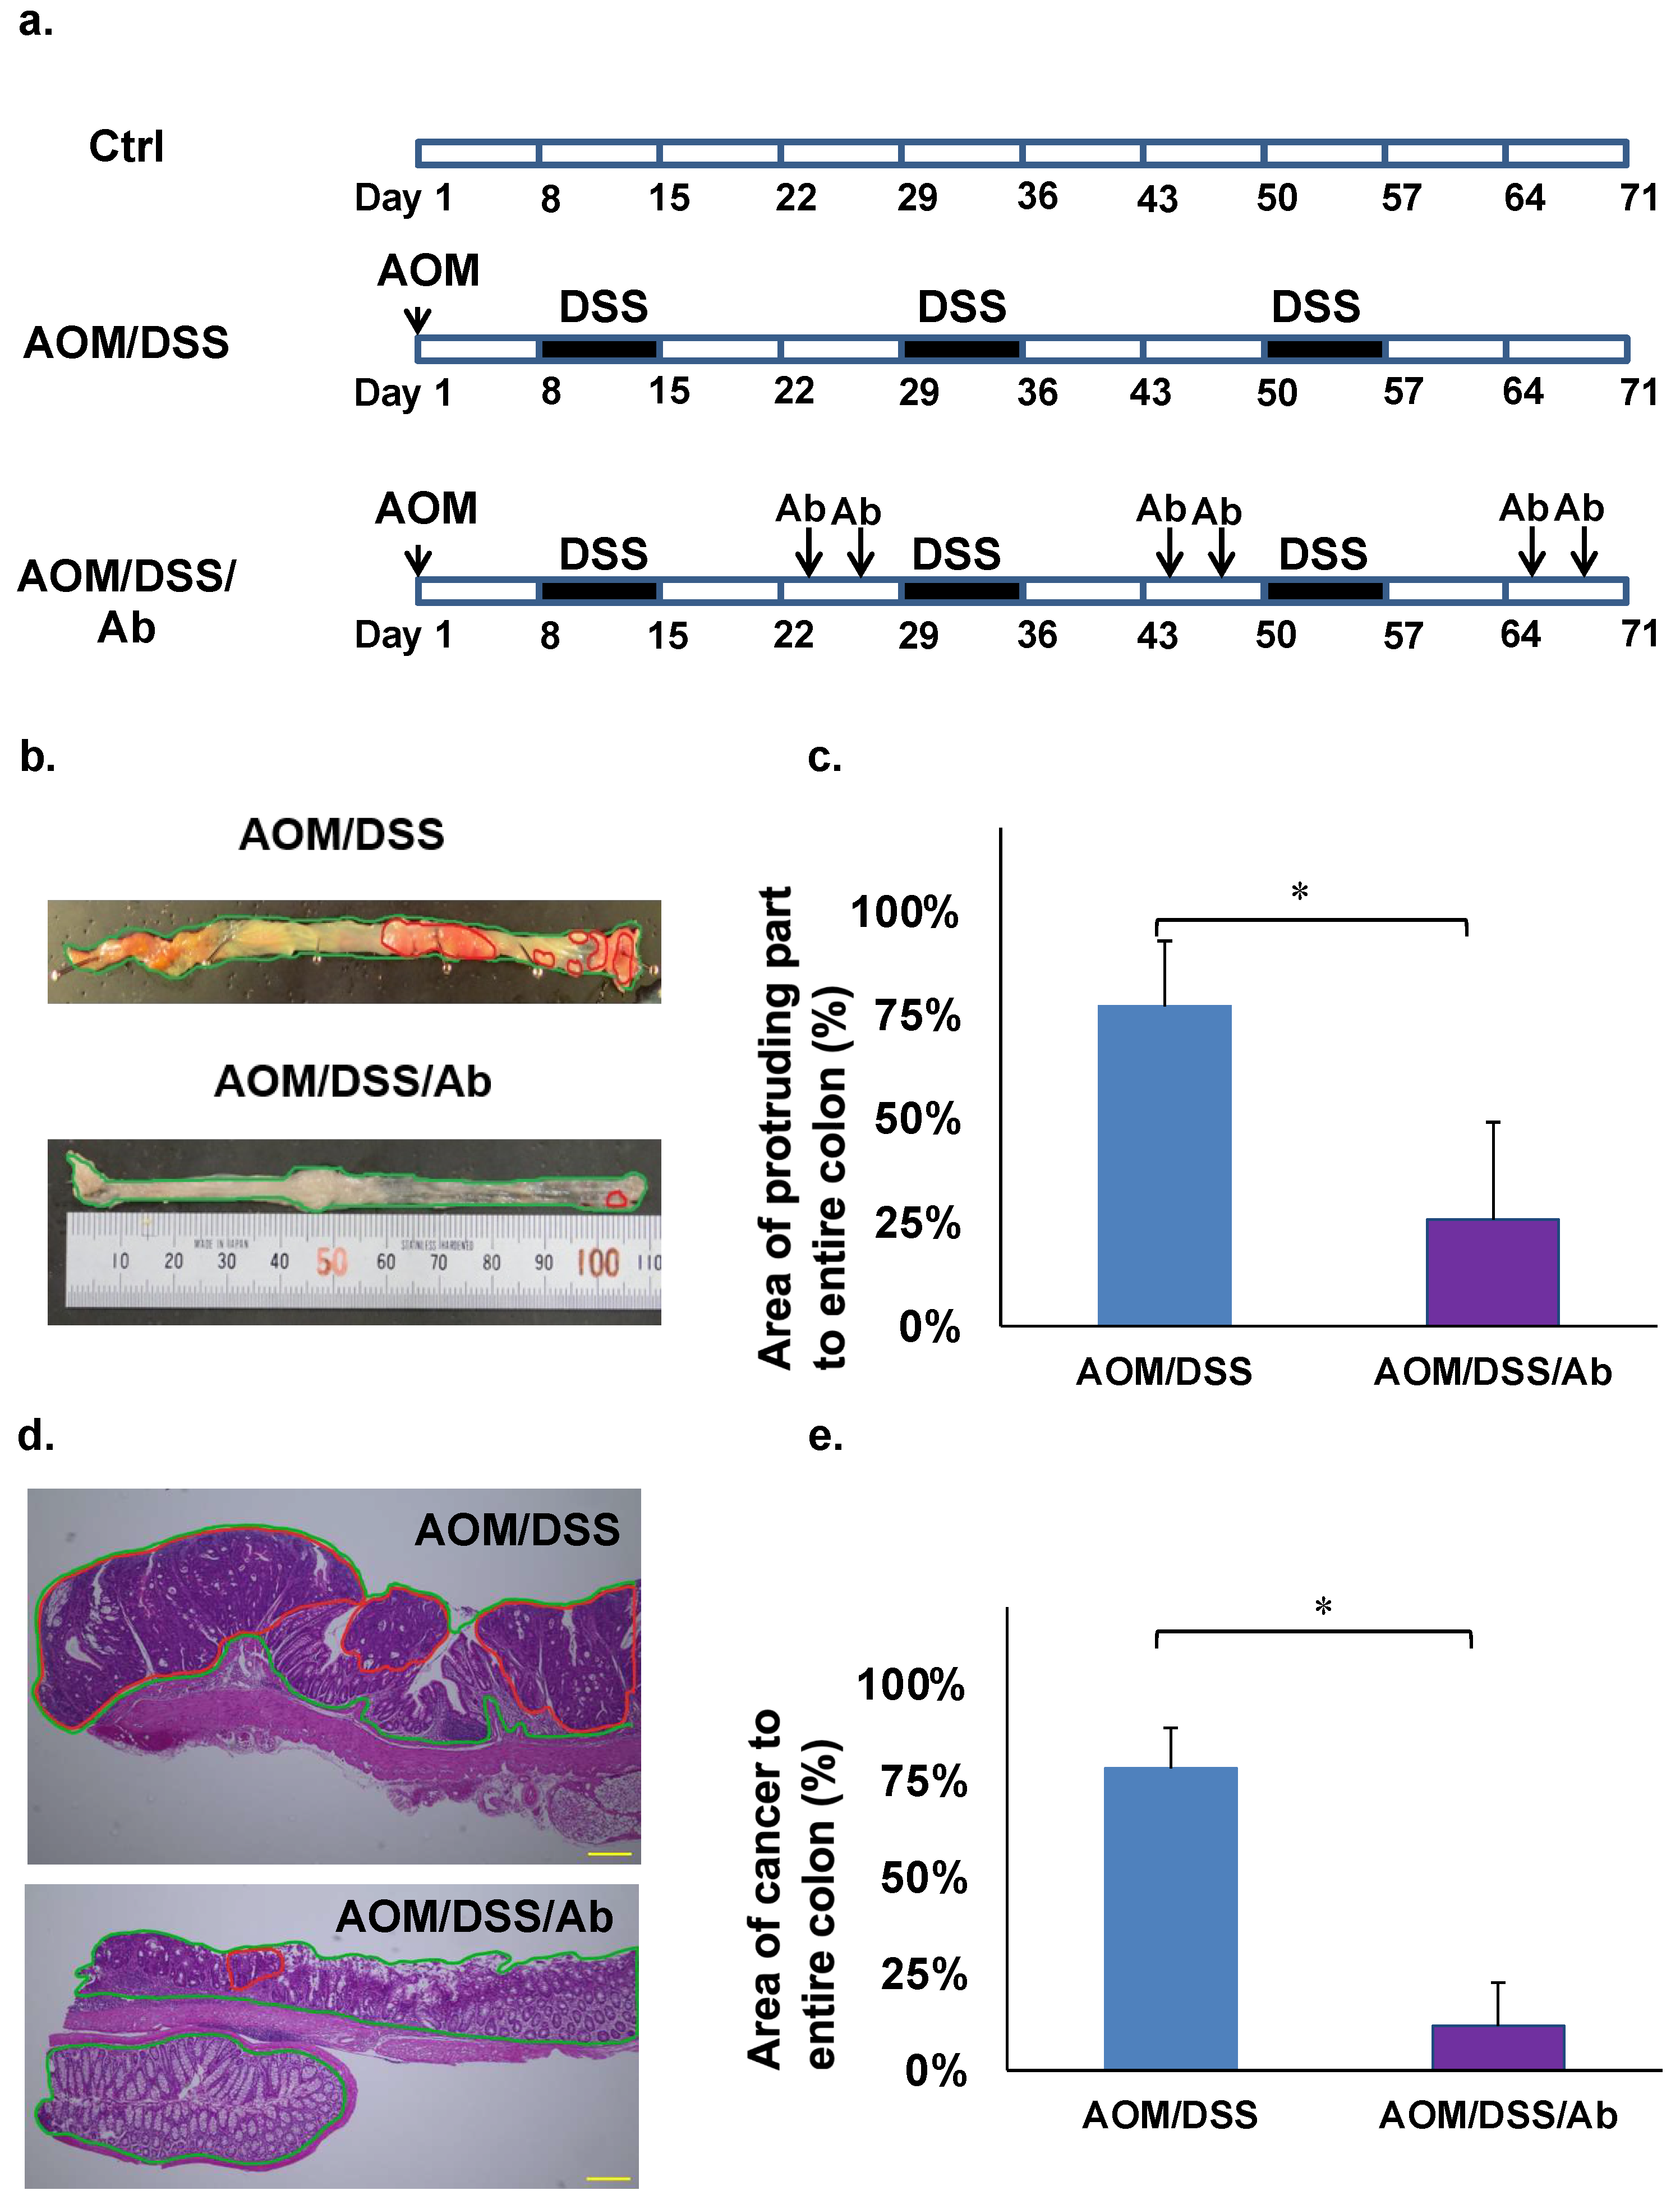
2.5. Animal Experiments

The AOM/DSS model was created by injecting AOM (10 mg/kg) i.p. and DSS (2.5%) p.o. and replicates the features of human cancer associated with colitis in mice [21]. The carcinogenic rate of this model is 80–100% [21]. Five-week-old male ICR mice (CLEA Japan, Tokyo, Japan) were fed with standard commercial pellet diets and ordinary tap water and acclimated in an air-conditioned room at 24 °C for one week. The mice (n = 3 per group) were then assigned to a control group, or a group treated with AOM and DSS (AOM/DSS) or with AOM, DSS, and infliximab (AOM/DSS/Ab). Mice in both groups were injected i.p. with 10 mg/kg AOM. One week later, the mice started on three cycles of orally administered 2.5% DSS in tap water for one week, followed by 2 weeks of recovery (Figure 1a). The AOM/DSS/Ab group was also injected i.p. twice with 10 mg/kg infliximab in 200 μL of saline during the third week of each cycle (Figure 1a). The mice were weighed, and fecal consistency was evaluated daily. All mice were euthanized at the end of the third cycle, then the entire colon was removed and cut into seven pieces. Portions with cancer and corresponding normal tissues were stored in liquid nitrogen, and the remainder was fixed in 10% formalin for 2 days and processed into paraffin blocks for histological analyses. All animal studies proceeded under strict ethical considerations for the use of experimental animals according to the Guidelines for the Care and Use of Laboratory Animals of Tohoku University. The Animal Care and Use Committee of the Tohoku University Graduate School of Medicine approved all animal care procedures (Approval ID: 2017-173).

2.6. Calculation of Cancerous Areas in the Colon

Photographs of whole colons from euthanized mice were stored on a computer. The area of the protruding part of the colon that might include cancer in the images was macroscopically examined by an animal pathologist. All tumor-like parts of the colon were macroscopically counted, and areas of tumor-like lesions were calculated using Image J (http://rsb.info.nih.gov/ij/, accessed on 29 August 2017) (Figure 1b,c). After confirming colon cancer in HE-stained slides, areas of cancerous lesions were histologically validated and calculated as (area of cancer/area of entire colon) × 100 (%) using Image J (Figure 1d,e).

2.7. Microarray Analysis

Total RNA extracted from control, normal and cancerous tissues of AOM/DSS and AOM/DSS/Ab mice were analyzed using a 3D-Gene Mouse Oligo chip 24k microarray (Toray Industries Inc., Tokyo, Japan). Total RNA was labeled with Cy5 using Amino Allyl MessageAMPTM II aRNA Amplification Kits (Thermo Fisher Scientific Inc., Waltham, MA, USA) and hybridized for 16 h, as described by the manufacturer (www.3d-gene.com, accessed on 7 September 2017). Hybridization signals obtained using a 3D-Gene Scanner were processed using 3D-Gene Extraction (Both from Toray Industries Inc.). Signals for genes of interest were globally normalized to an adjusted median intensity of 25.

2.8. Staining Mast Cells with Toluidine Blue

Mast cells in colon tissues were detected by HCL-Toluidine blue staining. Tissue sections on slides were dewaxed, washed with distilled water, then stained at room temperature for 30 min in 0.5 N HCL containing 0.5% powdered Toluidine blue. Tissue sections were washed with distilled water, dried, and coverslipped using xylene, then an animal pathologist examined the specimens using a microscope. Mast cells were calculated as the number per area of the entire colon as follows: the positively stained mast cells in the sample tissues were detected by selecting seven random fields in high-power microscope (×400) after microscopic examination scanning the entire colon tissues in three mice. The mast cell counts are the mean of seven individual high-power fields.

2.9. Reverse Transcription Quantitative PCR (RT-qPCR)

Total RNA (0.5 μg) was transcribed into cDNA using PrimeScript RT Reagent Kits (Takara Bio) as described by the manufacturer, then RT-qPCR proceeded using the StepOnePlus Real-Time PCR system with FAST SYBR Green Master Mix (both from Thermo Fisher Scientific Inc.). Messenger RNA expression in samples was relatively quantified using the 2−ΔΔCt method, and the results were normalized against those of the internal control mouse β-actin. The forward and reverse (5′ → 3′) primers were as follows:
Mus-Mcpt1: TTCCAGGTCTGTGTGGGAAG and TCCAGGGCACATATGCAGAG,
Mus-Mcpt2: AACGGTTCGAAGGAGAGGTG and TCTGCTGTGTGGGTTCGTTC,
Mus-Cma1 (chymase 1, mast cells): ATAAGCCTAAGGCCCAAATATGA and CAATGATCTCTCCAGCTTTGGT,
β-actin: GGCTGTATTCCCCTCCATCG and CCAGTTGGTAACAATGCCATGT [22].

2.10. Statistical Analysis

Data are shown as the means ± standard error (SE) of at least three independent experiments. Differences between means were analyzed using Student t-tests. Values with p < 0.05 were considered statistically significant. All data were statistically analyzed using JMP v.12.2 (SAS International Inc., Cary, NC, USA).

3. Results

3.1. Proliferation Assays

The results of these assays revealed that human TNF-α (50 ng/mL) significantly inhibited proliferation of the HCT8, HCT116, and COLO205 colon cancer cell lines by 66%, 65%, and 54%, respectively, compared with controls (Figure 2a–c; Table 1). However, TNF-α mediated inhibition of these three cell lines was recovered by adding 2 µg/mL of human anti TNF-α Ab (Figure 2a–c; Table 1).

3.2. Migration Assays

We analyzed the effects of TNF-α on HCT8, HCT116, and COLO205 cell migration using wound healing assays. Figure 2a shows that 50 ng/mL of TNF-α significantly attenuated, whereas human anti TNF-α Ab (2 µg/mL) recovered the migration of COLO205 cells (Figure 3a,b). This trend was similar in HCT8, but not in HCT116 cells (Table 1).

3.3. Invasion Assays

We assayed the effects of TNF-α on HCT8, HCT116, and COLO205 cell invasion using Matrigel chambers. The results showed that TNF-α (50 ng/mL) significantly inhibited, whereas human anti TNF-α Ab (2 µg/mL) neutralized COLO205 invasion (Figure 4a,b). These trends were similar in HCT8 and HCT116 cells (Table 1).

3.4. Effects of Infliximab in Azoxymethane/Dextran Sodium Sulfate (AOM/DSS) Model Mice

The body weight decreased by 10–20% in azoxymethane (AOM)/dextran sodium sulfate (DSS) mice and in those treated with anti TNF-α Ab infliximab (AOM/DSS/Ab), and both groups also developed diarrhea and rectal bleeding when administered with DSS water (data not shown). Neoplastic lesions were found in the colons of all euthanized mice, but significantly fewer were evident in AOM/DSS/Ab, than AOM/DSS mice (Figure 1b). Tumor-like lesions occupied 71.7% and 25.7% of colons from AOM/DSS and AOM/DSS/Ab mice, respectively, and differed significantly (p < 0.01; Figure 1c). Staining with hematoxylin and eosin (HE) revealed that adenocarcinoma accounted for 78.2% and 11.5% of the areas with colon cancer lesions in the AOM/DSS and AOM/DSS/Ab mice, respectively (p < 0.01; Figure 1d,e).

3.5. Microarray Analysis

Because infliximab significantly decreased the incidence of colon cancer in AOM/DSS mice, we compared downregulated genes in cancer tissues between the AOM/DSS/Ab and AOM/DSS mice. We identified 100 genes that were upregulated in cancer tissues of the AOM/DSS group compared with normal control tissues. We then compared downregulated genes in cancer tissues from the AOM/DSS/Ab and AOM/DSS groups. Table 2 shows the top 10 downregulated genes including mast cell proteases 1, 2, and 4 (Mctp1, Mctp2, Mctp4), chymase 1 (Cma1), Fc receptor IgE high affinity I alpha polypeptide (Fcer1a), phospholipase A2, group IIE (Pla2g2e), and carboxypeptidase A3 (Cpa3). All these genes were associated with mast cells.

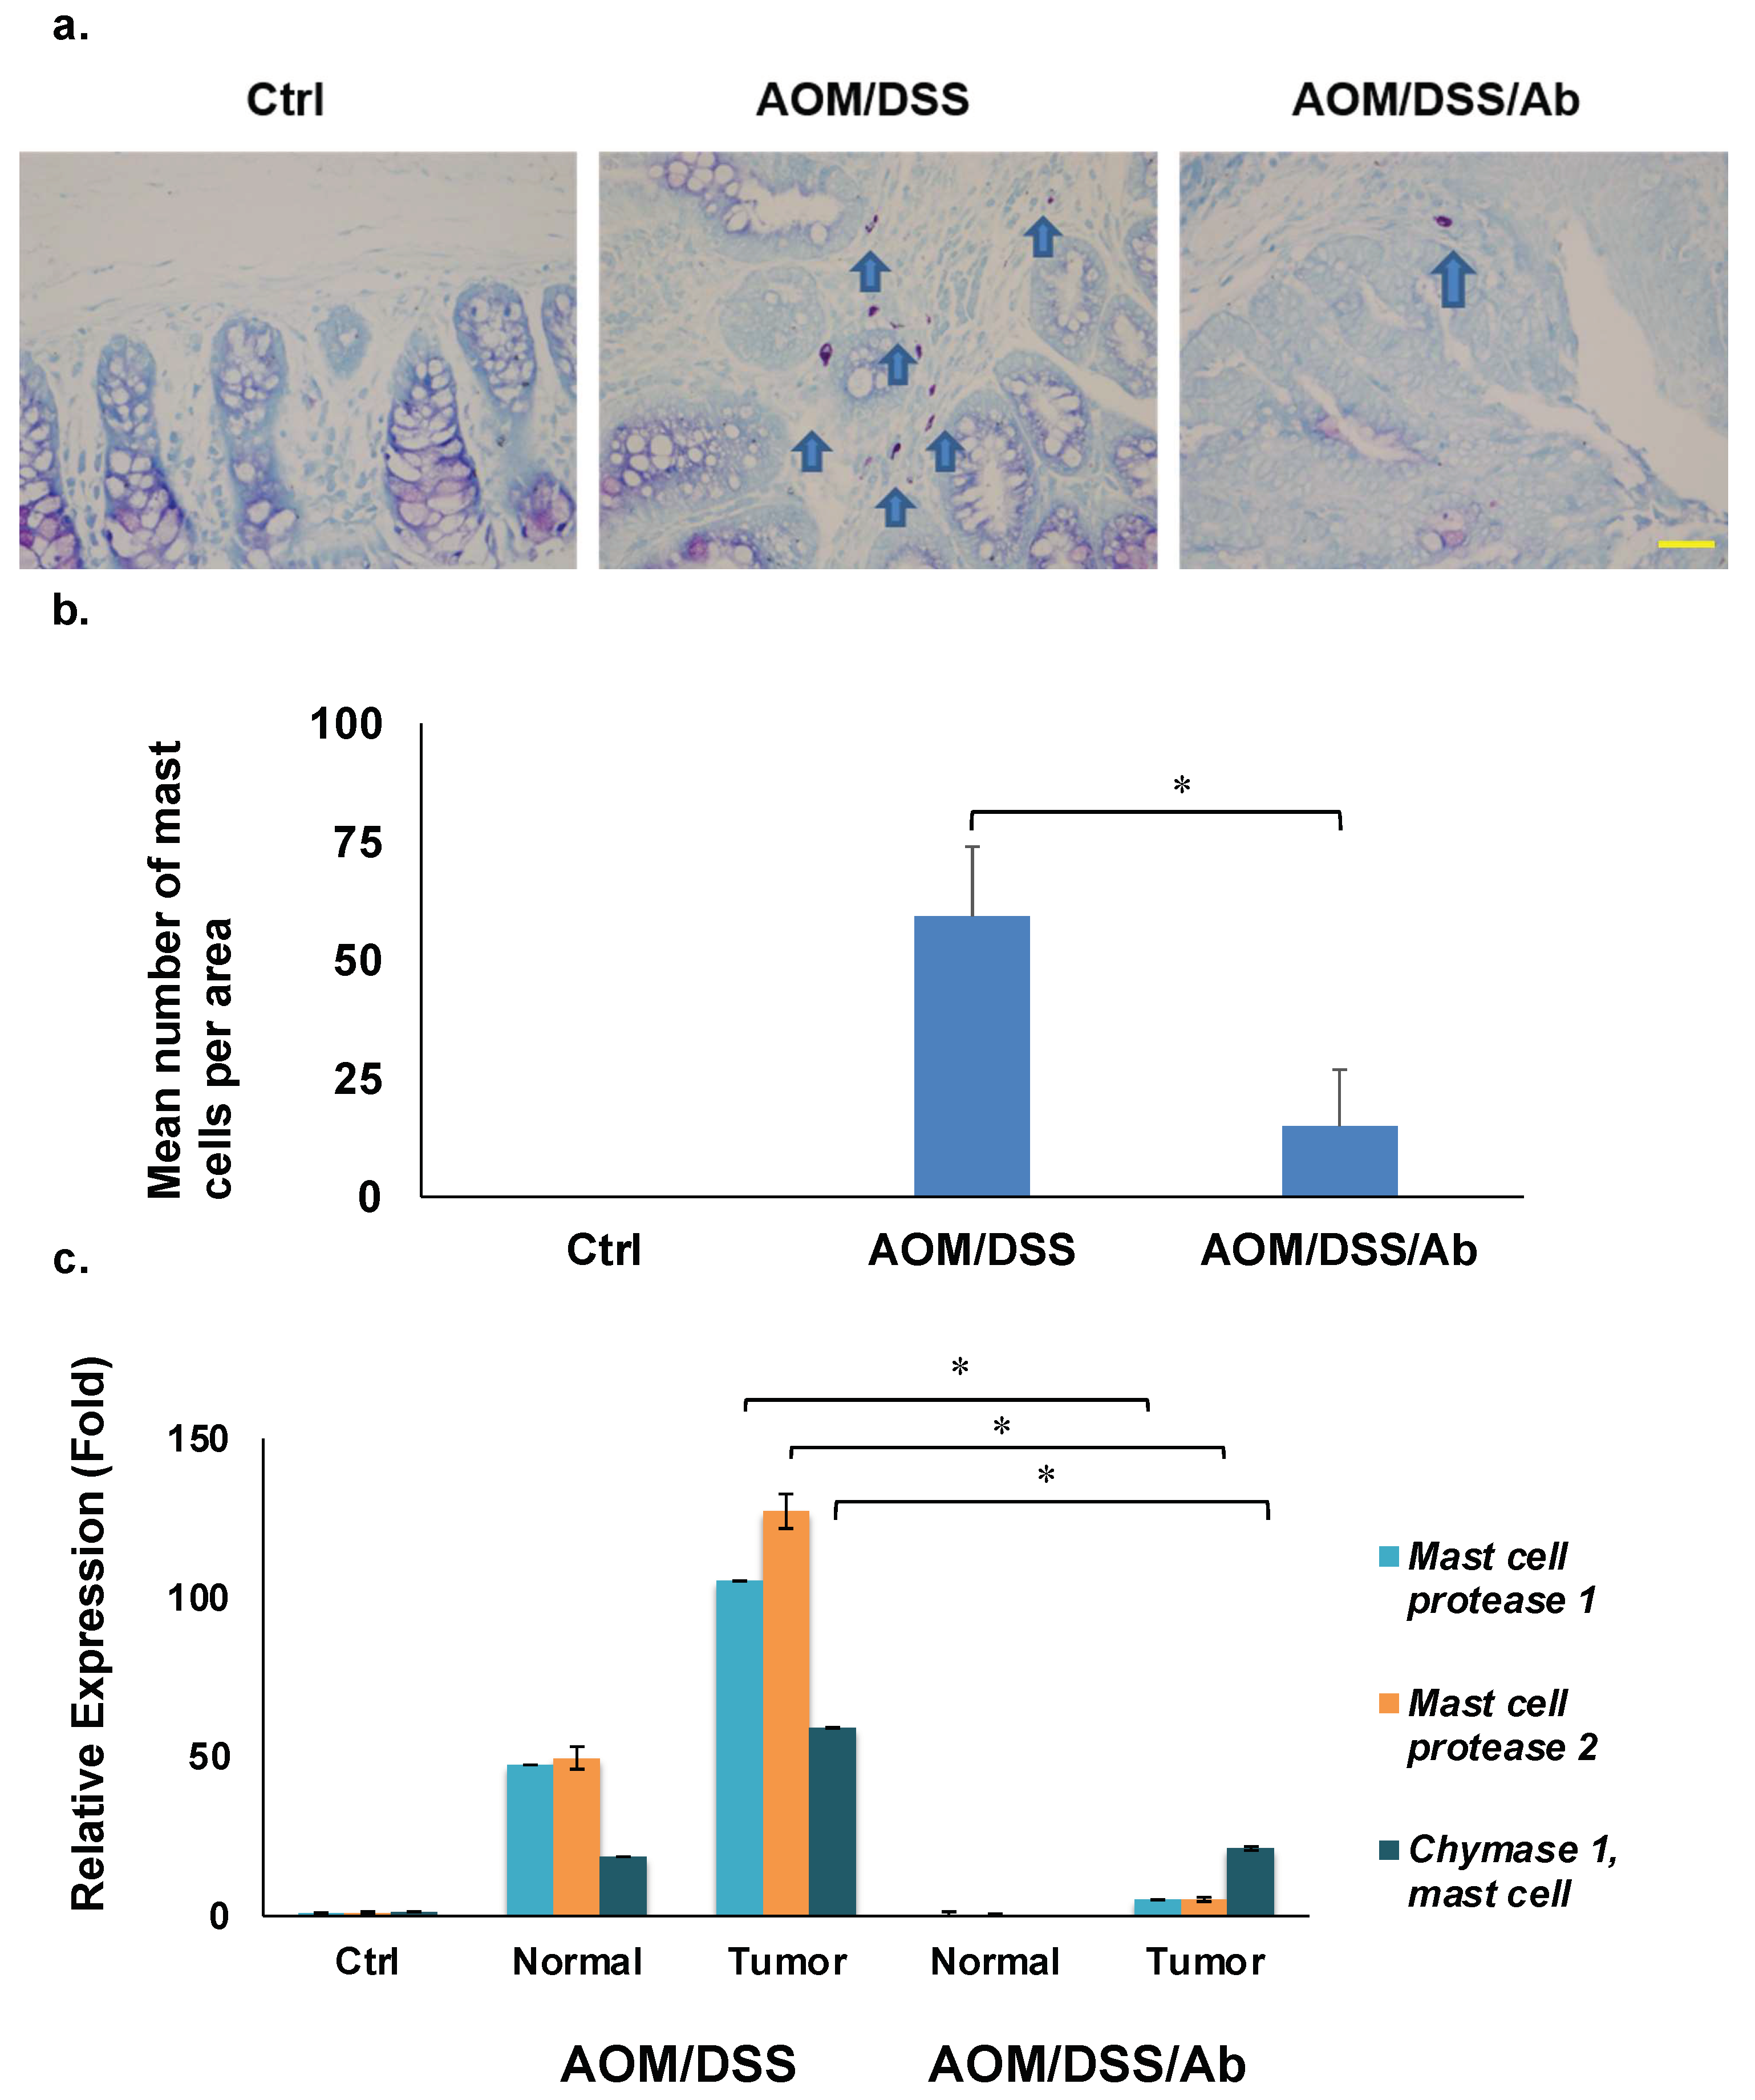
3.6. Toluidine Blue Staining

Staining with HCL-Toluidine revealed that infliximab significantly decreased the high abundance of mast cells in colon cancer tissues from AOM/DSS mice (59.2 vs. 14.9, p < 0.01). (Figure 5a,b).

3.7. Reverse Transcription Quantitative PCR (RT-qPCR)

Table 2 shows several downregulated mast cell-related genes in the AOM/DSS/Ab group. We analyzed expression of the top three genes, Mcpt1, Mcpt2, and Cma1 using RT-qPCR to validate the microarray results. The mRNA expression of these genes was 100-, 125-, and 60-fold higher, respectively, in cancer tissues from AOM/DSS, than control mice, and infliximab significantly inhibited their expression compared to the control 5-, 5-, and 21-fold, respectively (p < 0.01; Figure 5c).

4. Discussion

This study found that TNF-α inhibited the proliferation, migration, and invasion of human colon cancer cells, and that this was offset by anti TNF-α Ab in vitro. In contrast, infliximab significantly inhibited colon cancer development in AOM/DSS mice in vivo.
Although TNF-α is rarely cytotoxic against cancer cells in vitro [23] the present findings revealed that TNF-α inhibited colon cancer cell growth and motility. Although TNF-α induces apoptosis in colon cancer cells [24], it can also induce the proliferation and migration of colon cancer cell lines [25]. The growth of BxPc3 and COLO 357 pancreatic cancer cells similarly reduced by TNF-α, but it also strongly enhances their invasive properties [26]. Therefore, diverse functions of TNF-α in cell signaling are hardly surprising.
Cell signaling starts after TNF-α binds to TNF-α receptor 1 (TNFR1), which then sequentially recruits TNFR-associated death domain (TRADD), TNFR-associated factor 2 (TRAF2), receptor-interacting protein (RIP), and inhibitor of nuclear factor-kappa B (NF-κB) kinase (IKK). This cascade leads to NF-κB activation which induces inflammatory cytokines and anti-apoptotic proteins. In contrast, the recruitment of TRADD, FAS-associated death domain (FADD) and caspase-8 leads to caspase-3 activation, which in subsequently induces apoptosis [23]. Therefore, cell proliferation, migration, and invasive properties might be altered in vitro depending on dominant cell signaling mediated by TNF-α in various cell lines.
Orally administered DSS induces inflammation and ulceration in the mouse colon, and the intraperitoneal (i.p). administration of AOM leads to the development of aberrant crypt foci (ACF) in the colonic mucosa, which causes the emergence of colon cancer [21]. Therefore, the AOM/DSS mouse models are useful tools for analyzing colitis-associated carcinogenesis and detecting modulators [27].
Our findings in vivo showed that infliximab significantly inhibited colon cancer development in AOM/DSS mice. Figure 4c shows that adenocarcinoma occupied 78.2% and 11.5% of colonic areas in the AOM/DSS and AOM/DSS/Ab mice, respectively. Infliximab attenuated colon cancer development by 85%. Inflammatory cells such as granulocytes and macrophages in the inflamed mucosa of AOM/DSS mice upregulate TNF-α expression [28], which then activates NF-κB in intestinal epithelial cells and promotes tumor growth [29,30]. Moreover, etanercept (a TNF-α blocker) inhibits colon carcinogenesis in AOM/DSS mice by decreasing levels of prostaglandin H2 and E2 secreted by inflammatory cells, which are essential mediators of angiogenesis [31], and by inhibiting the Wnt/B-catenin signaling pathway that is associated with colon carcinogenesis [28]. Therefore, the direct inhibition of TNF-α by infliximab reduced colon cancer formation in the AOM/DSS/Ab mice.
Our microarray data provided new evidence that mast cells play roles in colitis-associated cancer in AOM/DSS mice. Microarray analysis of cancer tissues from AOM/DSS and AOM/DSS/Ab mice revealed profound differences in the expression of genes associated with mast cells, namely Mctp1, Mctp2, Mctp4, Cma1, Fcer1a, Pla2g2e, and Cpa3. The top three genes, Mctp1, Mctp2, and Cma1 were validated by RT-qPCR, which confirmed the microarray results. Furthermore, Toluidine blue staining confirmed an increased abundance of mast cells in interstitial tissues of the AOM/DSS group. Collectively, these results suggested that the development of colitis-associated cancer is associated with mast cell accumulation in the mouse colon.
Mast cells are involved in IBDs. The numbers of mast cells and of those positive for chymase are increased in the intestinal mucosa of patients with active CD [32]. Chemical mediators such as histamine and tryptase are released from mast cells in patients with IBD [33,34]. Mast cells are bone-marrow-derived multifunctional immune cells that have secretory granules that contain proteases, chymase, tryptase, and carboxypeptidase A3 and were recognized by Paul Ehrlich 130 years ago [35]. Mast cell proteases significantly influence not only inflammation but also angiogenesis, thus affecting tumor growth and progression by acting on immunosuppression, release of the proangiogenic cytokines VEGF, IL-18, and TNF-α, mitogenic factors, and extracellular matrix degradation [36,37]. Mast cells are also an important source of TNF-α [38,39], which further induces mast cell accumulation in tissues, which can be blocked by infliximab [40]. Inflammation-induced cytokines play pivotal roles in the initiation, promotion, and progression of colon carcinogenesis [41]. Our in vivo results suggested that anti TNF-α Ab, infliximab could inhibit mast cell accumulation in the colon, resulting in decreased levels of TNF-α and attenuated colon cancer in AOM/DSS mice. Moreover, inflammatory cells such as mast cells in the colon might explain the different assay results of cancer progression between in vitro and in vivo. Therefore, anti TNF-α Ab did not inhibit colon cancer cell lines in vitro, but inhibited colon cancer development in mice in vivo. Although mast cells may play pivotal roles in the development of colitis-associated cancer, only the data of mRNA expressions were shown in this study. To prove the roles of mast cells in colitis-associated cancers, further experiments are needed, for example, an experiment to see the role of mast cells during colitis with or without infliximab treatment using a mast cell-deficient mouse model [42].
One limitation of this study is that we used infliximab, which was designed for humans, in experiments involving mice. Infliximab exerts considerable anti-inflammatory or anti-cancer effects, even in mouse models [43]. However, to evaluate the precise mechanism of infliximab in colon carcinogenesis in mice, an anti-mouse TNF-α Ab might require consideration [29]. Furthermore, we injected the mice with infliximab i.p., to ensure adequate coverage, whereas patients with CD are injected intravenously. Therefore, intravenous infliximab should also be considered in future studies of experimental animals.

5. Conclusions

This study revealed that anti TNF-α Ab infliximab significantly inhibited colon carcinogenesis in AOM/DSS mice. Furthermore, mast cell accumulation and the mRNA expression of genes associated with mast cells were significantly decreased in colon cancer tissues from mice treated with infliximab. These findings indicated that mast cells play pivotal roles in the development of colitis-associated cancer. The precise roles of mast cells and TNF-α in IBDs and colitis-associated cancer have not been fully elucidated. Further investigation is warranted to determine whether infliximab could prevent colonic mast cell accumulation and colitis-associated cancer in patients with IBDs.

Author Contributions

Concept, S.O., H.S. and S.H.; methodology, D.-Y.W., S.O., H.S., K.K. and M.I.; formal analysis and investigation, D.-Y.W., K.I., M.M., T.H. (Takashi Hirosawa), T.H. (Tomoaki Hirashima), M.K. and H.M.; writing—original draft preparation, D.-Y.W. and S.O.; writing—review and editing, M.K., T.H. (Takashi Hirosawa), H.S., M.I. and S.O.; supervision, T.N. and M.U.; project administration; S.O.; funding acquisition, S.H. All authors have read and agreed to the published version of the manuscript.

Funding

This work was supported by JSPS KAKENHI (grant number 25861169).

Institutional Review Board Statement

All animal studies proceeded under strict ethical considerations for the use of experimental animals, according to the Guidelines for the Care and Use of Laboratory Animals of Tohoku University. All animal care procedures were approved by the Animal Care and Use Committee of the Tohoku University Graduate School of Medicine (Approval ID: 2017-173. Date of approval: 2 March 2017).

Informed Consent Statement

Not applicable.

Acknowledgments

We thank Tsuyoshi Tsuzuki, Takashi Sawai, Fumiko Date, and Emiko Shibuya for helpful discussions and technical advice.

Conflicts of Interest

The authors declare no conflict of interest.

References

  1. Chudy-Onwugaje, K.O.; Christian, K.E.; Farraye, F.A.; Cross, R.K. A State-of-the-Art Review of New and Emerging Therapies for the Treatment of IBD. Inflamm. Bowel Dis. 2019, 25, 820–830. [Google Scholar] [CrossRef] [PubMed]
  2. Higashiyama, M.; Hokaria, R. New and Emerging Treatments for Inflammatory Bowel Disease. Digestion 2023, 104, 74–81. [Google Scholar] [CrossRef]
  3. Molodecky, N.A.; Soon, I.S.; Rabi, D.M.; Ghali, W.A.; Ferris, M.; Chernoff, G.; Benchimol, E.I.; Panaccione, R.; Ghosh, S.; Barkema, H.W.; et al. Increasing incidence and prevalence of the inflammatory bowel diseases with time, based on systematic review. Gastroenterology 2012, 142, 46–54. [Google Scholar] [CrossRef] [PubMed] [Green Version]
  4. Hanauer, S.B.; Feagan, B.G.; Lichtenstein, G.R.; Mayer, L.F.; Schreiber, S.; Colombel, J.F.; Rachmilewitz, D.; Wolf, D.C.; Olson, A.; Bao, W.; et al. Maintenance infliximab for Crohn’s disease: The ACCENT I randomised trial. Lancet 2002, 359, 1541–1549. [Google Scholar] [CrossRef] [PubMed]
  5. Costa, J.; Magro, F.; Caldeira, D.; Alarcao, J.; Sousa, R.; Vaz-Carneiro, A. Infliximab reduces hospitalizations and surgery interventions in patients with inflammatory bowel disease: A systematic review and meta-analysis. Inflamm. Bowel Dis. 2013, 19, 2098–2110. [Google Scholar] [CrossRef] [PubMed]
  6. Adegbola, S.O.; Sahnan, K.; Warusavitarne, J.; Hart, A.; Tozer, P. Anti-TNF Therapy in Crohn’s Disease. Int. J. Mol. Sci. 2018, 19, 2244. [Google Scholar] [CrossRef] [Green Version]
  7. Apostolaki, M.; Armaka, M.; Victoratos, P.; Kollias, G. Cellular mechanisms of TNF function in models of inflammation and autoimmunity. TNF Pathophysiol. 2010, 11, 1–26. [Google Scholar]
  8. Sethi, G.; Sung, B.; Aggarwal, B.B. TNF: A master switch for inflammation to cancer. Front. Biosci. 2008, 13, 5094–5107. [Google Scholar] [CrossRef] [Green Version]
  9. Braegger, C.P.; Nicholls, S.; Murch, S.H.; MacDonald, T.T.; Stephens, S. Tumor necrosis factor alpha in stool as a marker of intestinal inflammation. Lancet 1992, 339, 89–91. [Google Scholar] [CrossRef]
  10. Bazzoni, F.; Beutler, B. The tumor necrosis factor ligand and receptor families. N. Engl. J. Med. 1996, 334, 1717–1725. [Google Scholar] [CrossRef]
  11. Waters, J.P.; Pober, J.S.; Bradley, J.R. Tumour necrosis factor and cancer. J. Pathol. 2013, 230, 241–248. [Google Scholar] [CrossRef]
  12. Balkwill, F. Tumour necrosis factor and cancer. Nat. Rev. Cancer 2009, 9, 361–371. [Google Scholar] [CrossRef] [PubMed]
  13. Mukaida, N.; Baba, T. Chemokines in tumor development and progression. Exp. Cell Res. 2012, 318, 95–102. [Google Scholar] [CrossRef] [PubMed] [Green Version]
  14. Oguma, K.; Oshima, H.; Aoki, M.; Uchio, R.; Naka, K.; Nakamura, S.; Hirao, A.; Saya, H.; Taketo, M.M.; Oshima, M. Activated macrophages promote Wnt signalling through tumour necrosis factor-alpha in gastric tumour cells. EMBO J. 2008, 27, 1671–1681. [Google Scholar] [CrossRef] [PubMed] [Green Version]
  15. Komori, J.; Marusawa, H.; Machimoto, T.; Endo, Y.; Kinoshita, K.; Kou, T.; Haga, H.; Ikai, I.; Uemoto, S.; Chiba, T. Activation-induced cytidine deaminase links bile duct inflammation to human cholangiocarcinoma. Hepatology 2008, 47, 888–896. [Google Scholar] [CrossRef] [PubMed] [Green Version]
  16. von Roon, A.C.; Reese, G.; Teare, J.; Constantinides, V.; Darzi, A.W.; Tekkis, P.P. The risk of cancer in patients with Crohn’s disease. Dis. Colon Rectum 2007, 50, 839–855. [Google Scholar] [CrossRef]
  17. Raval, G.; Mehta, P. TNF-alpha inhibitors: Are they carcinogenic? Drug Healthc. Patient Saf. 2010, 2, 241–247. [Google Scholar] [PubMed]
  18. Ogawa, H.; Haneda, S.; Shibata, C.; Miura, K.; Nagao, M.; Ohnuma, S.; Kohyama, A.; Unno, M. Adenocarcinoma associated with perianal fistulas in Crohn’s disease. Anticancer Res. 2013, 33, 685–689. [Google Scholar] [PubMed]
  19. Brown, S.L.; Greene, M.H.; Gershon, S.K.; Edwards, E.T.; Braun, M.M. Tumor necrosis factor antagonist therapy and lymphoma development: Twenty-six cases reported to the Food and Drug Administration. Arthritis Rheum. 2002, 46, 3151–3158. [Google Scholar] [CrossRef] [PubMed]
  20. de Vries, H.S.; van Oijen, M.G.; de Jong, D.J. Serious events with infliximab in patients with inflammatory bowel disease: A 9-year cohort study in the Netherlands. Drug Saf. 2008, 31, 1135–1144. [Google Scholar] [CrossRef]
  21. Tanaka, T.; Kohno, H.; Suzuki, R.; Yamada, Y.; Sugie, S.; Mori, H. A novel inflammation-related mouse colon carcinogenesis model induced by azoxymethane and dextran sodium sulfate. Cancer Sci. 2003, 94, 965–973. [Google Scholar] [CrossRef] [PubMed]
  22. Wang, X.; Spandidos, A.; Wang, H.; Seed, B. PrimerBank: A PCR primer database for quantitative gene expression analysis, 2012 update. Nucleic Acids Res. 2012, 40, D1144–D1149. [Google Scholar] [CrossRef] [PubMed] [Green Version]
  23. Aggarwal, B.B. Signaling pathways of the TNF superfamily: A double-edged sword. Nat. Rev. Immunol. 2003, 3, 745–756. [Google Scholar] [CrossRef] [PubMed]
  24. Chantana, C.; Yenjai, C.; Reubroycharoen, P.; Waiwut, P. Combination of Nimbolide and TNF-α-Increases Human Colon Adenocarcinoma Cell Death through JNK-mediated DR5 Up-Regulation. Asian Pac. J. Cancer Prev. 2016, 17, 2637–2641. [Google Scholar]
  25. Bhat, A.A.; Ahmad, R.; Uppada, S.B.; Singh, A.B.; Dhawan, P. Claudin-1 promotes TNF-α-induced epithelial-mesenchymal transition and migration in colorectal adenocarcinoma cells. Exp. Cell Res. 2016, 349, 119–127. [Google Scholar] [CrossRef]
  26. Egberts, J.H.; Cloosters, V.; Noack, A.; Schniewind, B.; Thon, L.; Klose, S.; Kettler, B.; von Forstner, C.; Kneitz, C.; Tepel, J.; et al. Anti-tumor necrosis factor therapy inhibits pancreatic tumor growth and metastasis. Cancer Res. 2008, 68, 1443–1450. [Google Scholar] [CrossRef] [Green Version]
  27. Kim, Y.J.; Hong, K.S.; Chung, J.W.; Kim, J.H.; Hahm, K.B. Prevention of colitis-associated carcinogenesis with infliximab. Cancer Prev. Res. 2010, 3, 1314–1333. [Google Scholar] [CrossRef] [Green Version]
  28. Popivanova, B.K.; Kitamura, K.; Wu, Y.; Kondo, T.; Kagaya, T.; Kaneko, S.; Oshima, M.; Fujii, C.; Mukaida, N. Blocking TNF-alpha in mice reduces colorectal carcinogenesis associated with chronic colitis. J. Clin. Investig. 2008, 118, 560–570. [Google Scholar]
  29. Greten, F.R.; Eckmann, L.; Greten, T.F.; Park, J.M.; Li, Z.W.; Egan, L.J.; Kagnoff, M.F.; Karin, M. IKKbeta links inflammation and tumorigenesis in a mouse model of colitis-associated cancer. Cell 2004, 118, 285–296. [Google Scholar] [CrossRef] [Green Version]
  30. Onizawa, M.; Nagaishi, T.; Kanai, T.; Nagano, K.-I.; Oshima, S.; Nemoto, Y.; Yoshioka, A.; Totsuka, T.; Okamoto, R.; Nakamura, T.; et al. Signaling pathway via TNF-alpha/NF-kappaB in intestinal epithelial cells may be directly involved in colitis-associated carcinogenesis. Am. J. Physiol.-Gastrointest. Liver Physiol. 2009, 296, G850–G859. [Google Scholar] [CrossRef]
  31. Wilson, J.A. Tumor necrosis factor alpha and colitis-assoiated colon cancer. N. Engl. J. Med. 2008, 358, 2733–2734. [Google Scholar] [CrossRef]
  32. Andoh, A.; Dequchi, Y.; Inatomi, O.; Yagi, Y.; Bamba, S.; Tsujikawa, T.; Fujiyama, Y. Immunohistochemical study of chymase-positive mast cells in inflammatory bowel disease. Oncol. Rep. 2006, 16, 103–107. [Google Scholar] [CrossRef] [PubMed] [Green Version]
  33. Raithel, M.; Schneider, H.T.; Hahn, E.G. Effect of substance P on histamine secretion from gut mucosa in inflammatory bowel disease. Scand. J. Gastroenterol. 1999, 34, 496–503. [Google Scholar] [PubMed]
  34. Raithel, M.; Winterkamp, S.; Pacurar, A.; Ulrich, P.; Hochberger, J.; Hahn, E.G. Release of mast cell tryptase from human colorectal mucosa in inflammatory bowel disease. Scand. J. Gastroenterol. 2001, 36, 174–179. [Google Scholar] [CrossRef]
  35. Ribatti, D.; Crivellato, E. Mast cells, angiogenesis, and tumor growth. Biochim. Biophys. Acta 2012, 1822, 2–8. [Google Scholar] [CrossRef] [PubMed] [Green Version]
  36. de Souza Junior, D.A.; Santana, A.C.; da Silva, E.Z.; Oliver, C.; Jamur, M.C. The Role of Mast Cell Specific Chymases and Tryptases in Tumor Angiogenesis. Biomed. Res. Int. 2015, 2015, 142359. [Google Scholar] [CrossRef] [Green Version]
  37. Ribatti, D.; Vacca, A.; Nico, B.; Crivellato, E.; Roncali, L.; Dammacco, F. The role of mast cells in tumour angiogenesis. Br. J. Haematol. 2001, 115, 514–521. [Google Scholar] [CrossRef] [PubMed]
  38. Bischoff, S.C.; Lorentz, A.; Schwengberg, S.; Weier, G.; Raab, R.; Manns, M.P. Mast cells are an important cellular source of tumour necrosis factor alpha in human intestinal tissue. Gut 1999, 44, 643–652. [Google Scholar] [CrossRef] [Green Version]
  39. Wershil, B.K., IX. Mast cell-deficient mice and intestinal biology. Am. J. Physiol.-Gastrointest. Liver Physiol. 2000, 278, G343:8. [Google Scholar] [CrossRef] [Green Version]
  40. Misiak-Tloczek, A.; Brzezinska-Blaszczyk, E. IL-6, but not IL-4, stimulates chemokinesis and TNF stimulates chemotaxis of tissue mast cells: Involvement of both mitogen-activated protein kinases and phosphatidylinositol 3-kinase signalling pathways. Apmis 2009, 117, 558–567. [Google Scholar] [CrossRef]
  41. Yeo, M.; Kim, D.K.; Park, H.J.; Oh, T.Y.; Kim, J.H.; Cho, S.W.; Paik, Y.-K.; Hahm, K.-B. Loss of transgelin in repeated bouts of ulcerative colitis-induced colon carcinogenesis. Proteomics 2006, 6, 1158–1165. [Google Scholar] [CrossRef] [PubMed]
  42. Sasaki, H.; Imanishi, M.; Fujikura, D.; Sugiyama, M.; Tanimoto, K.; Mochiji, Y.; Takahashi, Y.; Hiura, K.; Watanabe, M.; Kashimoto, T.; et al. New inducible mast cell-deficient mouse model (Mcpt5/Cma1DTR). Biochem. Biophys. Res. Commun. 2021, 551, 127–132. [Google Scholar] [CrossRef] [PubMed]
  43. Deveci, F.; Muz, M.H.; Ilhan, N.; Kirkil, G.; Turgut, T.; Akpolat, N. Evaluation of the anti-inflammatory effect of infliximab in a mouse model of acute asthma. Respirology 2008, 13, 488–497. [Google Scholar] [CrossRef] [PubMed]
Figure 1. Findings of cancer associated with colitis in mouse models. (a) Induction of colitis-associated cancer in mice. (b) Macroscopic findings of colon, AOM/DSS (above), AOM/DSS/Ab (below). The areas highlighted by red circles indicate tumor-like lesions. (c) Comparison of protruding areas between AOM/DSS and AOM/DSS/Ab groups. (d) Colon cancer tissues stained with HE. AOM/DSS (above), AOM/DSS/Ab (below); The areas highlighted by red circles indicate lesions of adenocarcinoma. Scale bars represent 50 μm. (e) Comparison of adenocarcinoma areas between AOM/DSS and AOM/DSS/Ab groups. Ab, Infliximab; AOM, azoxymethane; DSS, dextran sodium sulfate; AOM/DSS, mice administered with AOM and DSS; AOM/DSS/Ab, mice administered with AOM, DSS, and Infliximab; Ctrl, control; HE, hematoxylin and eosin. ↓ Intraperitoneal administration. * p < 0.01.
Cimb 45 00189 g001
Figure 2. Proliferation assays of colon cancer cells. (a) HCT8, (b) HCT116, (c) COLO205. Concentrations of TNF-α: 10 or 50 ng/mL. Concentration of human anti TNF-α Ab: 2 µg/mL. * p < 0.01, p < 0.05.
Cimb 45 00189 g002
Figure 3. Migration assays. (a,b) Representative COLO205 data. Concentrations of TNF-α and human anti TNF-α Ab: 50 ng/mL and 2 µg/mL, respectively. * p < 0.05. Scale bar represents 200 μm.
Cimb 45 00189 g003
Figure 4. Invasion assays. (a,b) Representative COLO205 data. Concentrations of TNF-α and human anti TNF-α Ab are 50 ng/mL and 2 µg/mL, respectively. * p < 0.01, p < 0.05. Scale bar represents 100 μm.
Cimb 45 00189 g004
Figure 5. Results of staining and quantifying mast cells and RT-qPCR. (a) Mast cells stained with HCL-Toluidine blue (magnification: ×400). Scale bar represents 50 μm. (b) Comparison of mast cell numbers. (c) Results of RT-qPCR of mast cell protease 1, mast cell protease 2, and chymase 1, * p < 0.01. Ab, Infliximab; AOM, azoxymethane; AOM/DSS, mice administered with AOM and DSS; AOM/DSS/Ab, mice administered with AOM, DSS, and infliximab; Ctrl, control; DSS, dextran sodium sulfate; normal, normal tissue; tumor, cancer tissue.
Cimb 45 00189 g005
Table 1. Summary of proliferation, migration, and invasion assays of colon cancer cell lines incubated with TNF-α and anti TNF-α Ab.
AssaysCell LinesInhibition by TNF-α
(50 ng/mL)
Recovery Effect by Anti TNF-α Ab (2 µg/mL)
ProliferationHCT866% *85%
HCT11665% 98%
COLO20554% *84%
MigrationHCT874% 91%
HCT116NoneNone
COLO20561% 100%
InvasionHCT849% *99%
HCT11612% *20%
COLO20523% *75%
Values are shown as ratios to control set at 100%. * p < 0.01, p < 0.05.
Table 2. Microarray results of top 10 downregulated genes in cancerous tissues from AOM/DSS mice with and without anti TNF-α Ab.
GeneNameAb(-)/Normal *Ab(-)/Ab(+)
Mcpt1Mast cell protease 158.628.77
Mcpt2Mast cell protease 254.937.91
Cma1Chymase 1, mast cell71.014.84
Mcpt4Mast cell protease 417.214.76
Fcer1aFc receptor, IgE, high affinity I, alpha polypeptide27.104.74
9530003J23RikRIKEN cDNA 9530003J2317.134.32
Pla2g2ePhospholipase A2, group IIE19.444.21
Mmp8Matrix metallopeptidase 815.233.20
Cpa3Carboxypeptidase A3, mast cell13.302.79
Krt35Keratin 35122.872.78
The top 10 genes downregulated in cancer tissue of AOM/DSS mice by adding TNF-α Ab are shown with gene symbols. * Ab (-)/Normal, Values were calculated by dividing relative gene expression in cancer of AOM/DSS (Ab-) by that in normal control (Normal). Ab (-)/Ab (+), Values were calculated by dividing relative gene expression in cancer of AOM/DSS (Ab(-)) by that of AOM/DSS/Ab (Ab(+)).
Disclaimer/Publisher’s Note: The statements, opinions and data contained in all publications are solely those of the individual author(s) and contributor(s) and not of MDPI and/or the editor(s). MDPI and/or the editor(s) disclaim responsibility for any injury to people or property resulting from any ideas, methods, instructions or products referred to in the content.

