Article

Expression of GOT2 Is Epigenetically Regulated by DNA Methylation and Correlates with Immune Infiltrates in Clear-Cell Renal Cell Carcinoma

by
Wallax Augusto Silva Ferreira
1,* and
Edivaldo Herculano Correa de Oliveira
1,2
1
Laboratory of Cytogenomics and Environmental Mutagenesis, Environment Section (SAMAM), Evandro Chagas Institute (IEC), BR 316, KM 7, s/n, Levilândia, Ananindeua 67030-000, PA, Brazil
2
Faculty of Natural Sciences, Institute of Exact and Natural Sciences, Federal University of Pará (UFPA), Rua Augusto Correa, 01, Belém 66075-990, PA, Brazil
*
Author to whom correspondence should be addressed.
Curr. Issues Mol. Biol. 2022, 44(6), 2472-2489; https://doi.org/10.3390/cimb44060169
Submission received: 7 March 2022 / Revised: 14 April 2022 / Accepted: 23 April 2022 / Published: 25 May 2022
(This article belongs to the Special Issue Molecules at Play in Cancer)

Abstract

:
Clear cell renal cell carcinoma (KIRC) is the most common and highly malignant pathological type of kidney cancer, characterized by a profound metabolism dysregulation. As part of aspartate biosynthesis, mitochondrial GOT2 (glutamic-oxaloacetic transaminase 2) is essential for regulating cellular energy production and biosynthesis, linking multiple pathways. Nevertheless, the expression profile and prognostic significance of GOT2 in KIRC remain unclear. This study comprehensively analyzed the transcriptional levels, epigenetic regulation, correlation with immune infiltration, and prognosis of GOT2 in KIRC using rigorous bioinformatics analysis. We discovered that the expression levels of both mRNA and protein of GOT2 were remarkably decreased in KIRC tissues in comparison with normal tissues and were also significantly related to the clinical features and prognosis of KIRC. Remarkably, low GOT2 expression was positively associated with poorer overall survival (OS) and disease-free survival (DFS). Further analysis revealed that GOT2 downregulation is driven by DNA methylation in the promoter-related CpG islands. Finally, we also shed light on the influence of GOT2 expression in immune cell infiltration, suggesting that GOT2 may be a potential prognostic marker and therapeutic target for KIRC patients.

1. Introduction

Renal cell carcinoma (RCC) is one of the most common malignancies of the genitourinary system, representing 3% of all malignancies in adults [1]. In the subtypes of kidney cancer, kidney renal clear cell carcinoma (KIRC) accounts for about 75% of all RCC [2,3,4]. Indeed, due to the evident complexity from both morphological and molecular points of view [5,6,7,8,9], KIRC patients have heterogeneous clinical outcomes [10,11]. Most KIRC tumors are radiotherapy and chemotherapy-resistant, and ~30% of patients eventually develop metastases [3,12,13]. Thus, it is critical to identify new sensitive tumor biomarkers to advance the prognosis of KIRC.
Current shreds of evidence have demonstrated that KIRC is a metabolic disease [13,14,15,16,17,18]. This metabolic reprogramming is mainly related to loss-of-function mutation (or, less commonly, hypermethylation) in the von Hippel–Lindau (VHL) gene. VLH inactivation results in constitutive activation of hypoxia-inducible factors (HIF-1α and HIF-2α), thereby altering many genes involved in angiogenesis, metabolism, chromatin remodeling, extracellular matrix (ECM) and DNA repair [9,15,19,20,21]. Accordingly, mutations in several other genes (e.g., PBRM1, SETD2, BAP1, KDM5C, and MTOR) have been continuously identified to contribute to the pathogenesis (used to classify tumors into subgroups) and metabolic remodeling process of KIRC [22,23].
The metabolic shift in KIRC tumors covers different pathways and specific intermediates (e.g., amino acids, aerobic glycolysis, and fatty acid metabolism) [16,24], allowing cancer cells to rapidly proliferate, and survive during nutrient depletion and hypoxia, and evade the immune system [14]. Supporting this notion, aberrant tumor growth is promoted by an enhanced supply of specific metabolites, and some of them, such as aspartate (Asp), are limiting in some tumors [25,26,27]. Asp is usually synthesized in the mitochondrial matrix through the sequential actions of MDH2 and glutamic-oxaloacetic transaminase 2 (GOT2) and then transported to the cytosol for use by GOT1 and other enzymes [28].
GOT2, situated on chromosome 16q21, is a crucial enzyme for cancer cell metabolism, (i) mediating the reversible interconversion of oxaloacetate and glutamate into aspartate and α-ketoglutarate, providing energy for tumor cells (Krebs cycle) [29]; (ii) being a key transfer enzyme in the malate-aspartate NADH shuttle activity and oxidative protection [30], maintaining glycolysis, and (iii) participating in the amino acid metabolism of tumor cells [31]. Increasing evidence has shown that dysregulation of GOT2 expression significantly influences tumor growth and the prognosis of several human neoplasms [30,32,33,34,35,36,37,38]. However, the role of GOT2 in the development and prognosis of KIRC has not been reported. To address these issues, this study aims to evaluate the expression levels of GOT2 in KIRC and determine its epigenetic modulation, prognostic value, and correlation with tumor-infiltrating immune cells in KIRC patients through multiple databases.

2. Materials and Methods

2.1. Differential Expression of GOT2 mRNA and Protein

Initially, pan-cancer analysis of GOT2 transcription levels was performed via the TIMER2.0 database (Tumor Immune Estimation Resource, http://timer.cistrome.org/, accessed on 1 December 2021) [39], using the differential expression module across all TCGA tumors. The statistical significance computed by the Wilcoxon test was annotated by the number of stars (* p-value < 0.05; ** p-value < 0.01; *** p-value < 0.001).
To keep the focus of our analyses on KIRC tumors, the GEPIA2 database (Gene Expression Profiling Interactive Analysis 2) (http://gepia.cancer-pku.cn/index.html, accessed on 1 December 2021) [40] was used to confirm the differential expression found in the TIMER analysis by comparing the TCGA-KIRC (523 samples) with normal kidney samples from GTEx (Genotype-Tissue Expression project, http://www.gtexportal.org/home/index.html, accessed on 1 December 2021) (100 samples). The differential threshold of log2FC was 1 and the value cutoff of 0.05.
At the protein level, we used the UALCAN platform (http://ualcan.path.uab.edu/index.html, accessed on 1 December 2021) [41,42] to mine GOT2 expression in the high-throughput mass spectrometry data, obtained from the Clinical Proteomic Tumor Analysis Consortium (CPTAC) of normal kidney tissues (n = 84) and primary KIRC tumors (N = 110) [43]. Integration and analysis of these data were described elsewhere [44,45]. Briefly, protein expression values (Log2 Spectral count ratio values) from CPTAC were first normalized within each sample profile, then normalized across samples. Then Z-values for each sample for GOT2 protein were calculated as standard deviations from the median across samples.
In this study, we checked the expression of GOT2 in the protein expression module of the HPA database (Human Protein Atlas, https://www.proteinatlas.org/, accessed on 1 December 2021) [46,47,48], and we analyzed the immunohistochemical results of GOT2 in tumor tissue (ID: 2176) and normal tissue (ID: 2067). The antibody used in both samples was HPA018139. All images of tissues stained by immunohistochemistry were manually annotated by a specialist, followed by verification by a second specialist. Protein expression score was based on immunohistochemical data manually scored concerning staining intensity (negative, weak, moderate, or strong) and the fraction of stained cells (<25%, 25–75% or >75%). Each combination of intensity and fractions was automatically converted into an protein expression level score as follows: negative—not detected; weak <25%—not detected; weak combined with either 25–75% or 75%—low; moderate <25%—low; moderate combined with either 25–75% or 75%—medium; strong <25%—medium, strong combined with either 25–75% or 75%—high (For more details, see https://www.proteinatlas.org/about/assays+annotation#ihk, accessed on 1 December 2021).

2.2. Clinical Correlations & Survival Analysis

Associations between clinicopathological parameters and mRNA expression of GOT2 were analyzed using the UALCAN (http://ualcan.path.uab.edu/analysis.html, accessed on 5 December 2021) [41]. For these analyses, we included the following clinical features: cancer stage (stages 1, 2, 3, and 4), gender, tumor grade (1, 2, 3 and 4), KIRC subtypes (good risk: ccA; poor risk: ccB) [49], nodal metastasis status (N0: no regional lymph node metastasis; N1: metastases in 1 to 3 axillary lymph nodes).
The prognosis analysis was estimated by Kaplan–Meier (KM) survival curves generated by the Kaplan Meier (KM) Plotter (http://kmplot.com/analysis/, accessed on 5 December 2021) [50], GEPIA2 (http://gepia.cancer-pku.cn/index.html, accessed on 1 December 2021) [40] and HPA database (http://www.proteinatlas.org/, accessed on 5 December 2021) [46,47,48]. In this study, KIRC patients were split into high and low expression groups based on the median expression levels of GOT2, and then these two groups were compared in terms of relapse-free survival. Moreover, the hazard ratio (HR) with a 95% confidence interval (CI) and the p-value of the log-rank test were obtained. For all survival analyses, p < 0.05 was considered statistically significant.

2.3. GOT2 Methylation Analysis

To explore the DNA methylation level of all CpG islands located in GOT2 of KIRC-TCGA samples, we used the MethSurv database (https://biit.cs.ut.ee/methsurv/, accessed on 10 December 2021) [51]. Next, Shiny Methylation Analysis Resource Tool (SMART) (http://www.bioinfo-zs.com/smartapp/, accessed on 10 December 2021) [52] was used for differential methylation analysis of each GOT2 probe and Spearman’s correlation between methylation level (β-values, 450 k array) and mRNA level (Log2-scaled, TPM+1). CpG-aggregated methylation values were determined by mean (β-values).

2.4. Analysis of Immune Cell Infiltration

We calculated and compared the GOT2 gene expression contributed by different immune cell types in kidney samples (TCGA tumor/normal and GTEx normal) by the GEPIA2021 (http://gepia2021.cancer-pku.cn/, accessed on 1 December 2021) [53]. For each GTEx/KIRC-TCGA sample, we run the CIBERSORT algorithm (absolute mode) with the default parameters to obtain the absolute proportions of 22 immune cell subtypes. The 22 immune cells included: memory B cells, naïve B cells, activated memory CD4+ T cells, resting memory CD4+ T cells, naïve CD4+ T cells, CD8+ T cells, follicular helper T cells (Tfh), regulatory T cells (Tregs), and gamma/delta T cells, activated dendritic cells (DC), resting dendritic cells, eosinophils, macrophages (M0–M2), activated mast cells, resting mast cells, monocytes, resting NK cells, activated NK cells, neutrophils, and plasma cells. ANOVA (analysis of variance) was used for quantitative comparison. Sidak’s multiple comparisons test was used for the post-test, and p < 0.05 was considered significant.

2.5. Association between GOT2 and Tumor Microenvironment Exploration

The Tumor Immune Single-cell Hub (TISCH, http://tisch.comp-genomics.org/home/, accessed on 1 April 2022) is an online single-cell RNA-seq database focused on the tumor microenvironment (TME) [54]. In our analyses, two human KIRC scRNA-seq datasets [55,56] were used to obtain the GOT2 average expression at the single-cell level. The expression of GOT2 was collapsed by the mean value. The gene expression level displayed using UMAP and violin plots was quantified by the normalized values.

3. Results

3.1. Expression Level of GOT2 mRNA in Pan-Cancer

To determine whether GOT2 expression correlates with cancer, we surveyed GOT2 expression in multiple cancer types and adjacent normal tissues through the TIMER database. As shown in Figure 1, compared with normal tissues, GOT2 expression was higher in BLCA (Bladder Urothelial Carcinoma), CESC (Cervical squamous cell carcinoma and endocervical adenocarcinoma), COAD (Colon adenocarcinoma), KICH (Kidney Chromophobe), ESCA (Esophageal carcinoma), LUAD (Lung adenocarcinoma), LUSC (Lung squamous cell carcinoma), STAD (Stomach adenocarcinoma) and UCEC (Uterine Corpus Endometrial Carcinoma). Conversely, GOT2 had markedly lower expression in CHOL (Cholangiocarcinoma), GBM (Glioblastoma), KIRC (Kidney renal clear cell carcinoma), LIHC (Liver hepatocellular carcinoma), PRAD (Prostate adenocarcinoma) and THCA (Thyroid carcinoma). All these data indicated that the dysregulation of this glutamic-oxaloacetic transaminase was common across several tumors, including KIRC.

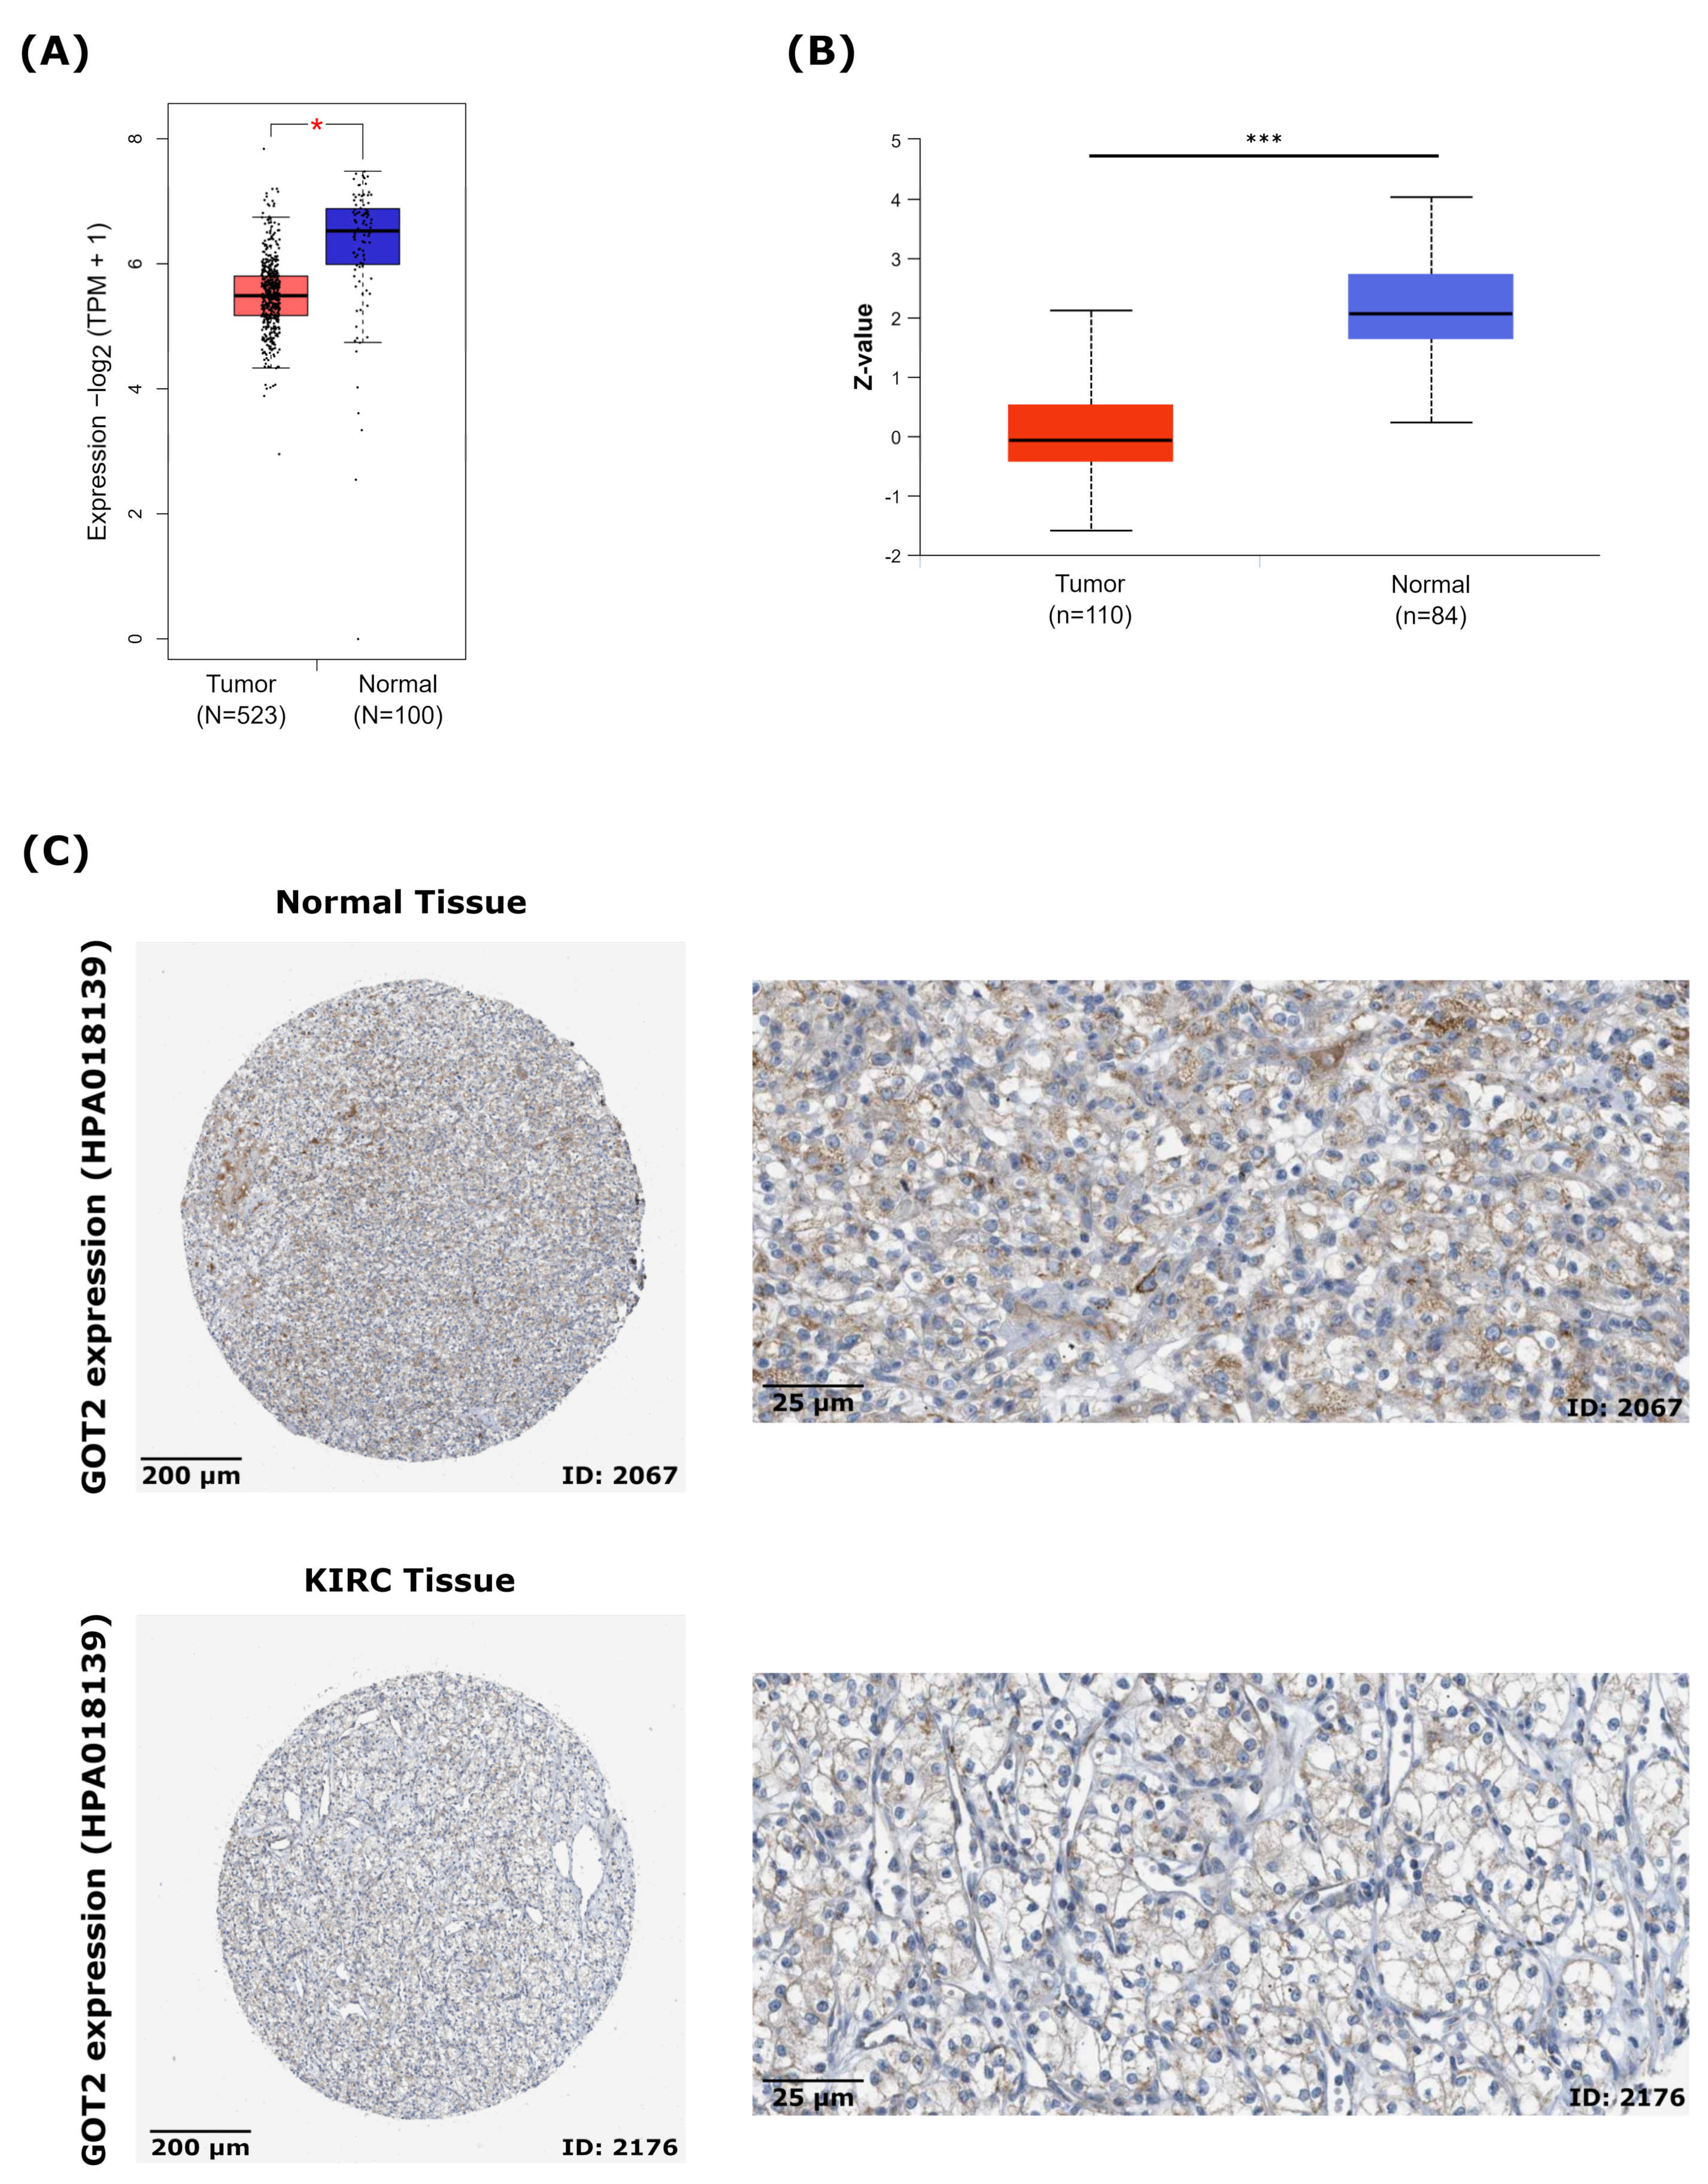
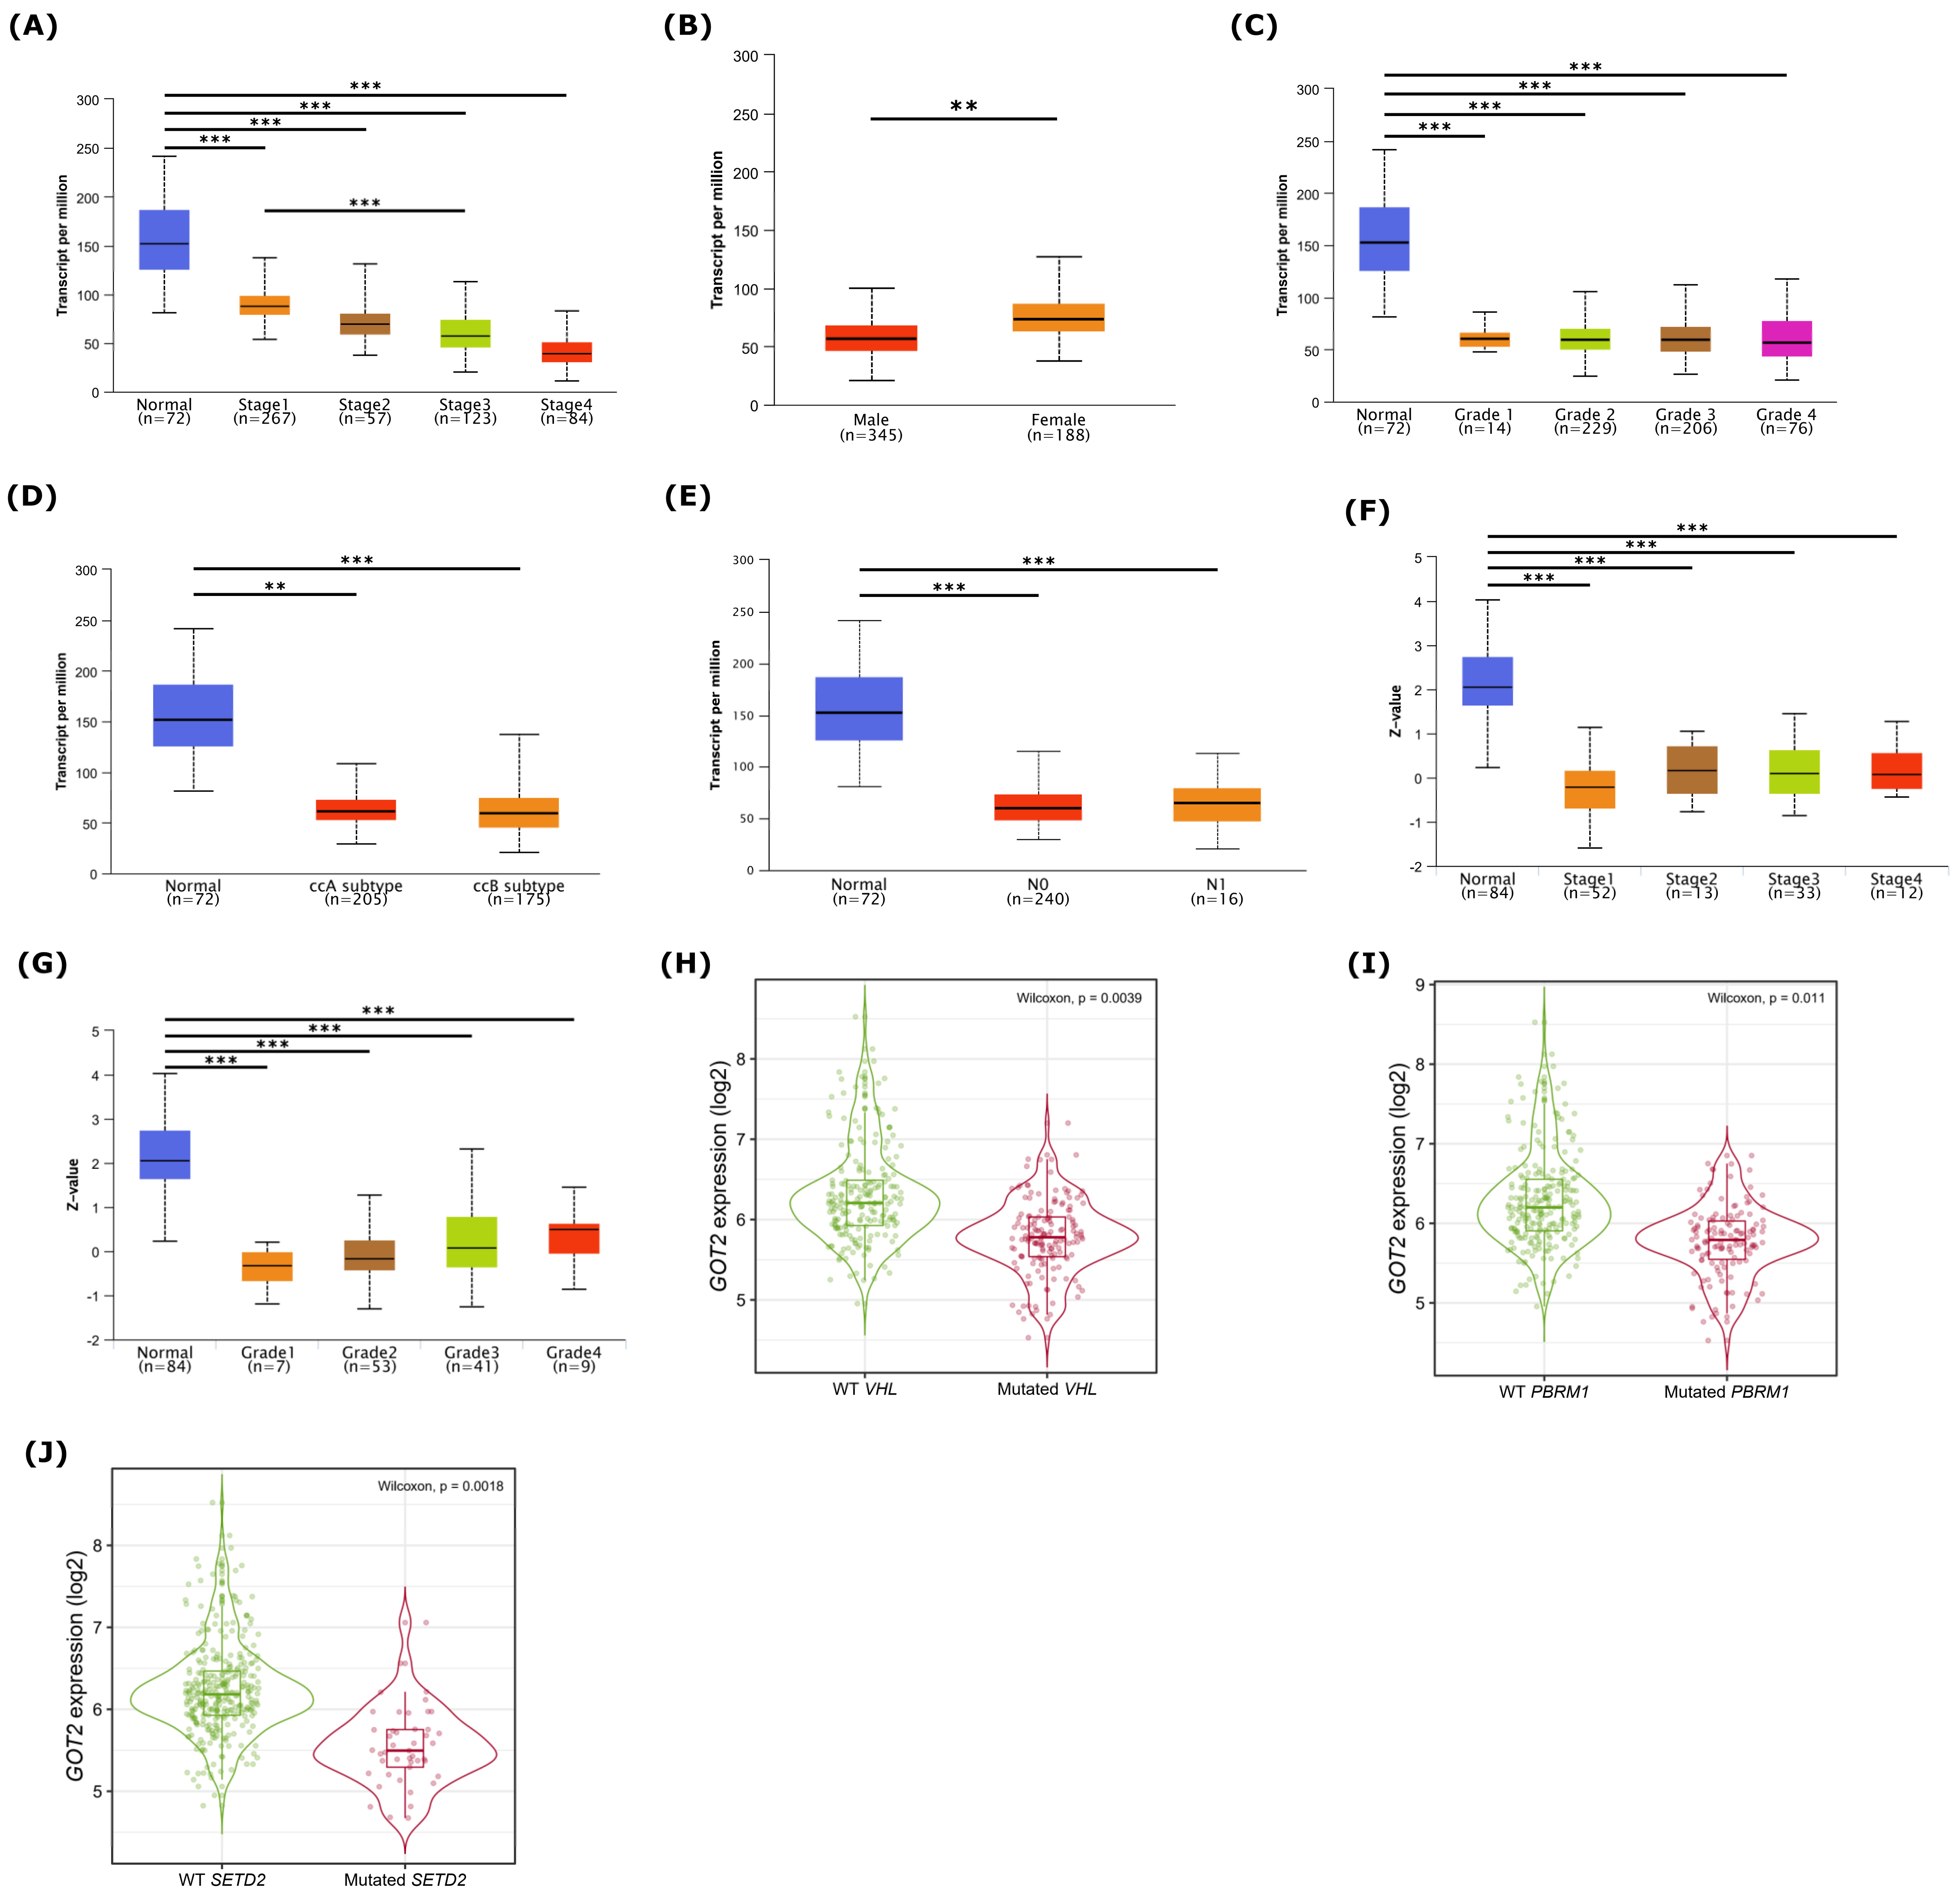
3.2. GOT2 mRNA and Protein Are Downregulated and Correlated with Clinicopathological Parameters in KIRC

Next, to focus our analysis on KIRC, we investigated the transcription levels of GOT2 performing a single-gene differential analysis using RNA-seq data from the TCGA database (KIRC-TCGA), compared with non-tumor tissues from the GTEx database by GEPIA2. Our results showed that the mRNA expression levels of GOT2 in KIRC tissues (n = 523) were significantly lower than in adjacent normal tissues (n = 100) (Figure 2A). Correspondingly, in the CPTAC KIRC cohort, there was a significant downregulation of GOT2 in the tumors (Figure 2B), consistent with the immunohistochemical (IHC) staining images from the Human Protein Atlas (HPA) (Figure 2C). This further confirmed that the expression of GOT2 in tumor tissues was significantly lower than that in normal tissues.

3.3. Relationship between GOT2 Expression and Clinical Pathological Parameters of Patients with KIRC

We next investigated the correlation between clinical parameters and the GOT2 expression in KIRC. Data showed that GOT2 expression levels were significantly associated with stage, gender, grade, KIRC subtypes, and nodal metastasis status (Figure 3A–G). Lastly, concerning the most commonly mutated genes in KIRC, patients harboring VHL, PBRM1, and SETD2 mutations under-expressed GOT2 (Figure 3H–J). Thus, it is likely that GOT2 expression may serve as a potential diagnostic biomarker for KIRC patients.

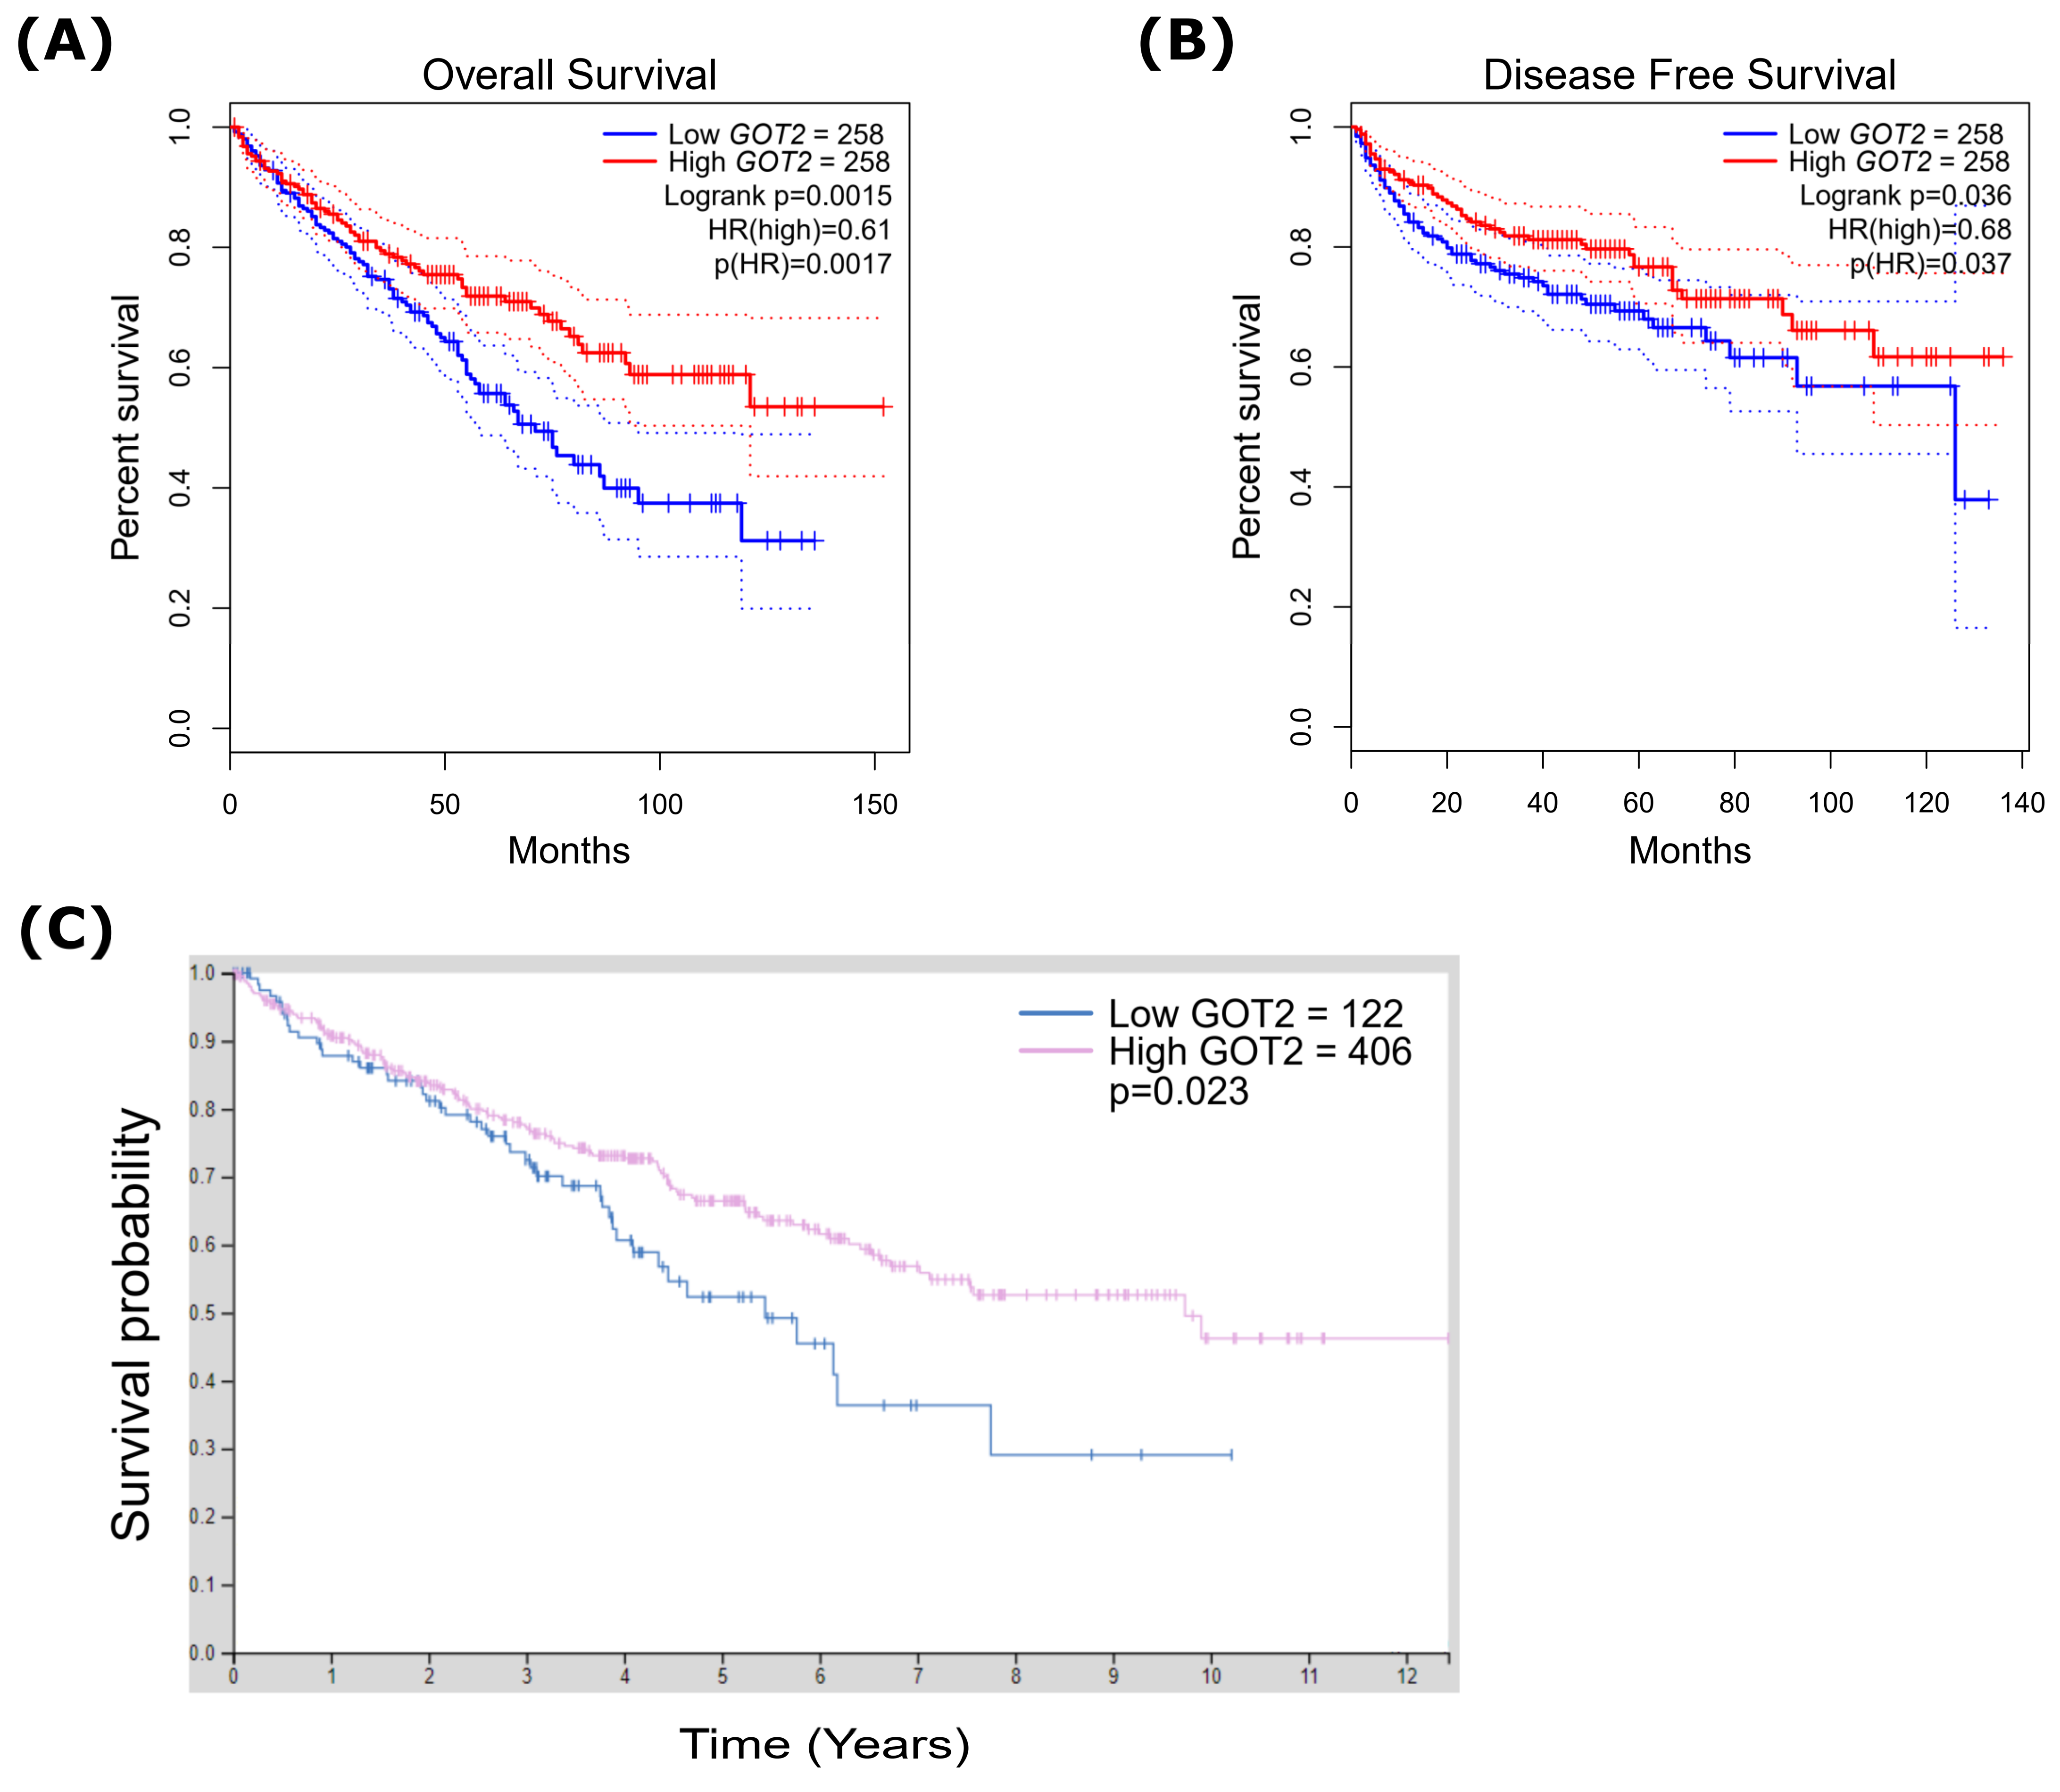
3.4. Low Expression of GOT2 Is Associated with Poor Outcome in KIRC Patients

Initially, to explore the influence of GOT2 expression on KIRC outcomes, we conducted a Kaplan–Meier test and Cox regression analysis to delve into the associations with overall survival (OS) and disease-free survival (DFS). As shown in Figure 4A,B, the OS and DFS of KIRC patients with low expression of GOT2 were significantly shorter than those with high expression. At the same time, we also noticed that the low level of GOT2 protein was significantly related to the worse OS (p = 0.023) (Figure 4C). Additionally, we investigated the relationship between GOT2 expression and clinicopathological features of KIRC patients in the Kaplan–Meier plotter database. Surprisingly, low GOT2 mRNA expression was correlated with worse OS in KIRC patients with stage 4 (HR = 0.56, p = 3.50 × 10⁻²), grade 3 (HR = 0.53, p = 7.90 × 10⁻³), and low mutation burden (HR = 2.28, p = 3.49 × 10⁻²) (Table 1). Here, the differences in the clinical characteristics suggest that the use of GOT2 as an indicator gene should be carefully combined with the patient’s condition.

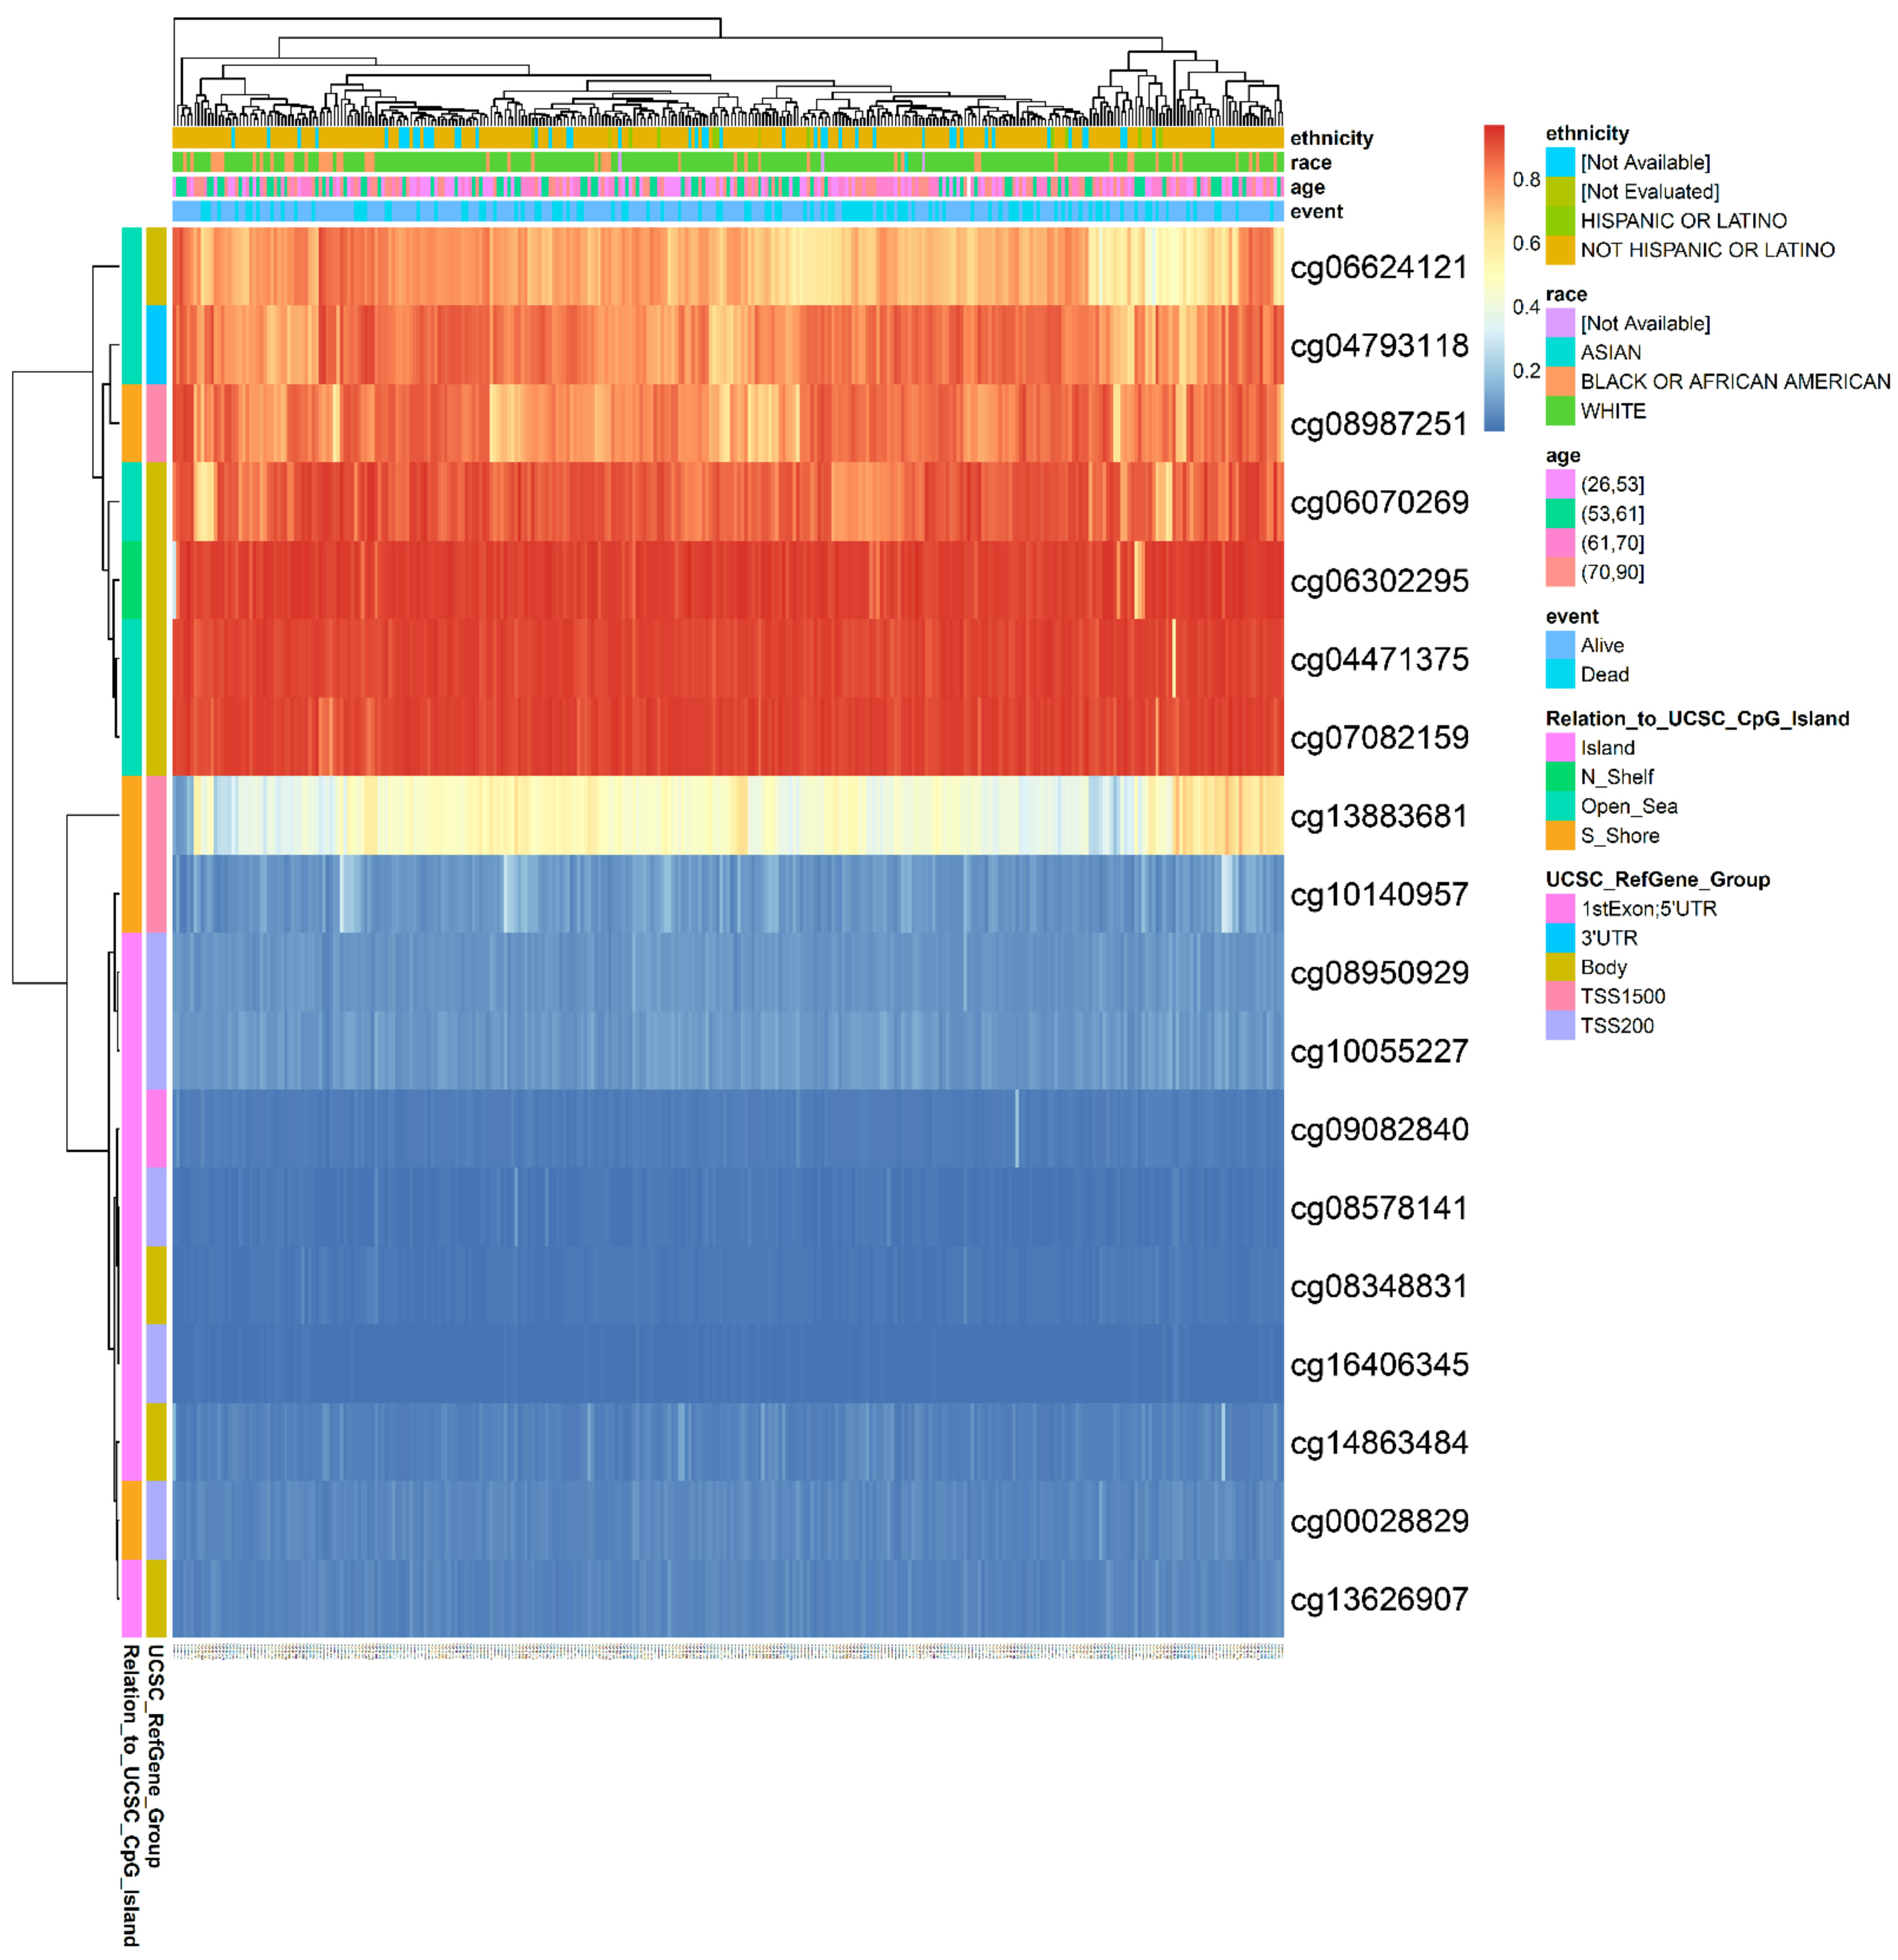
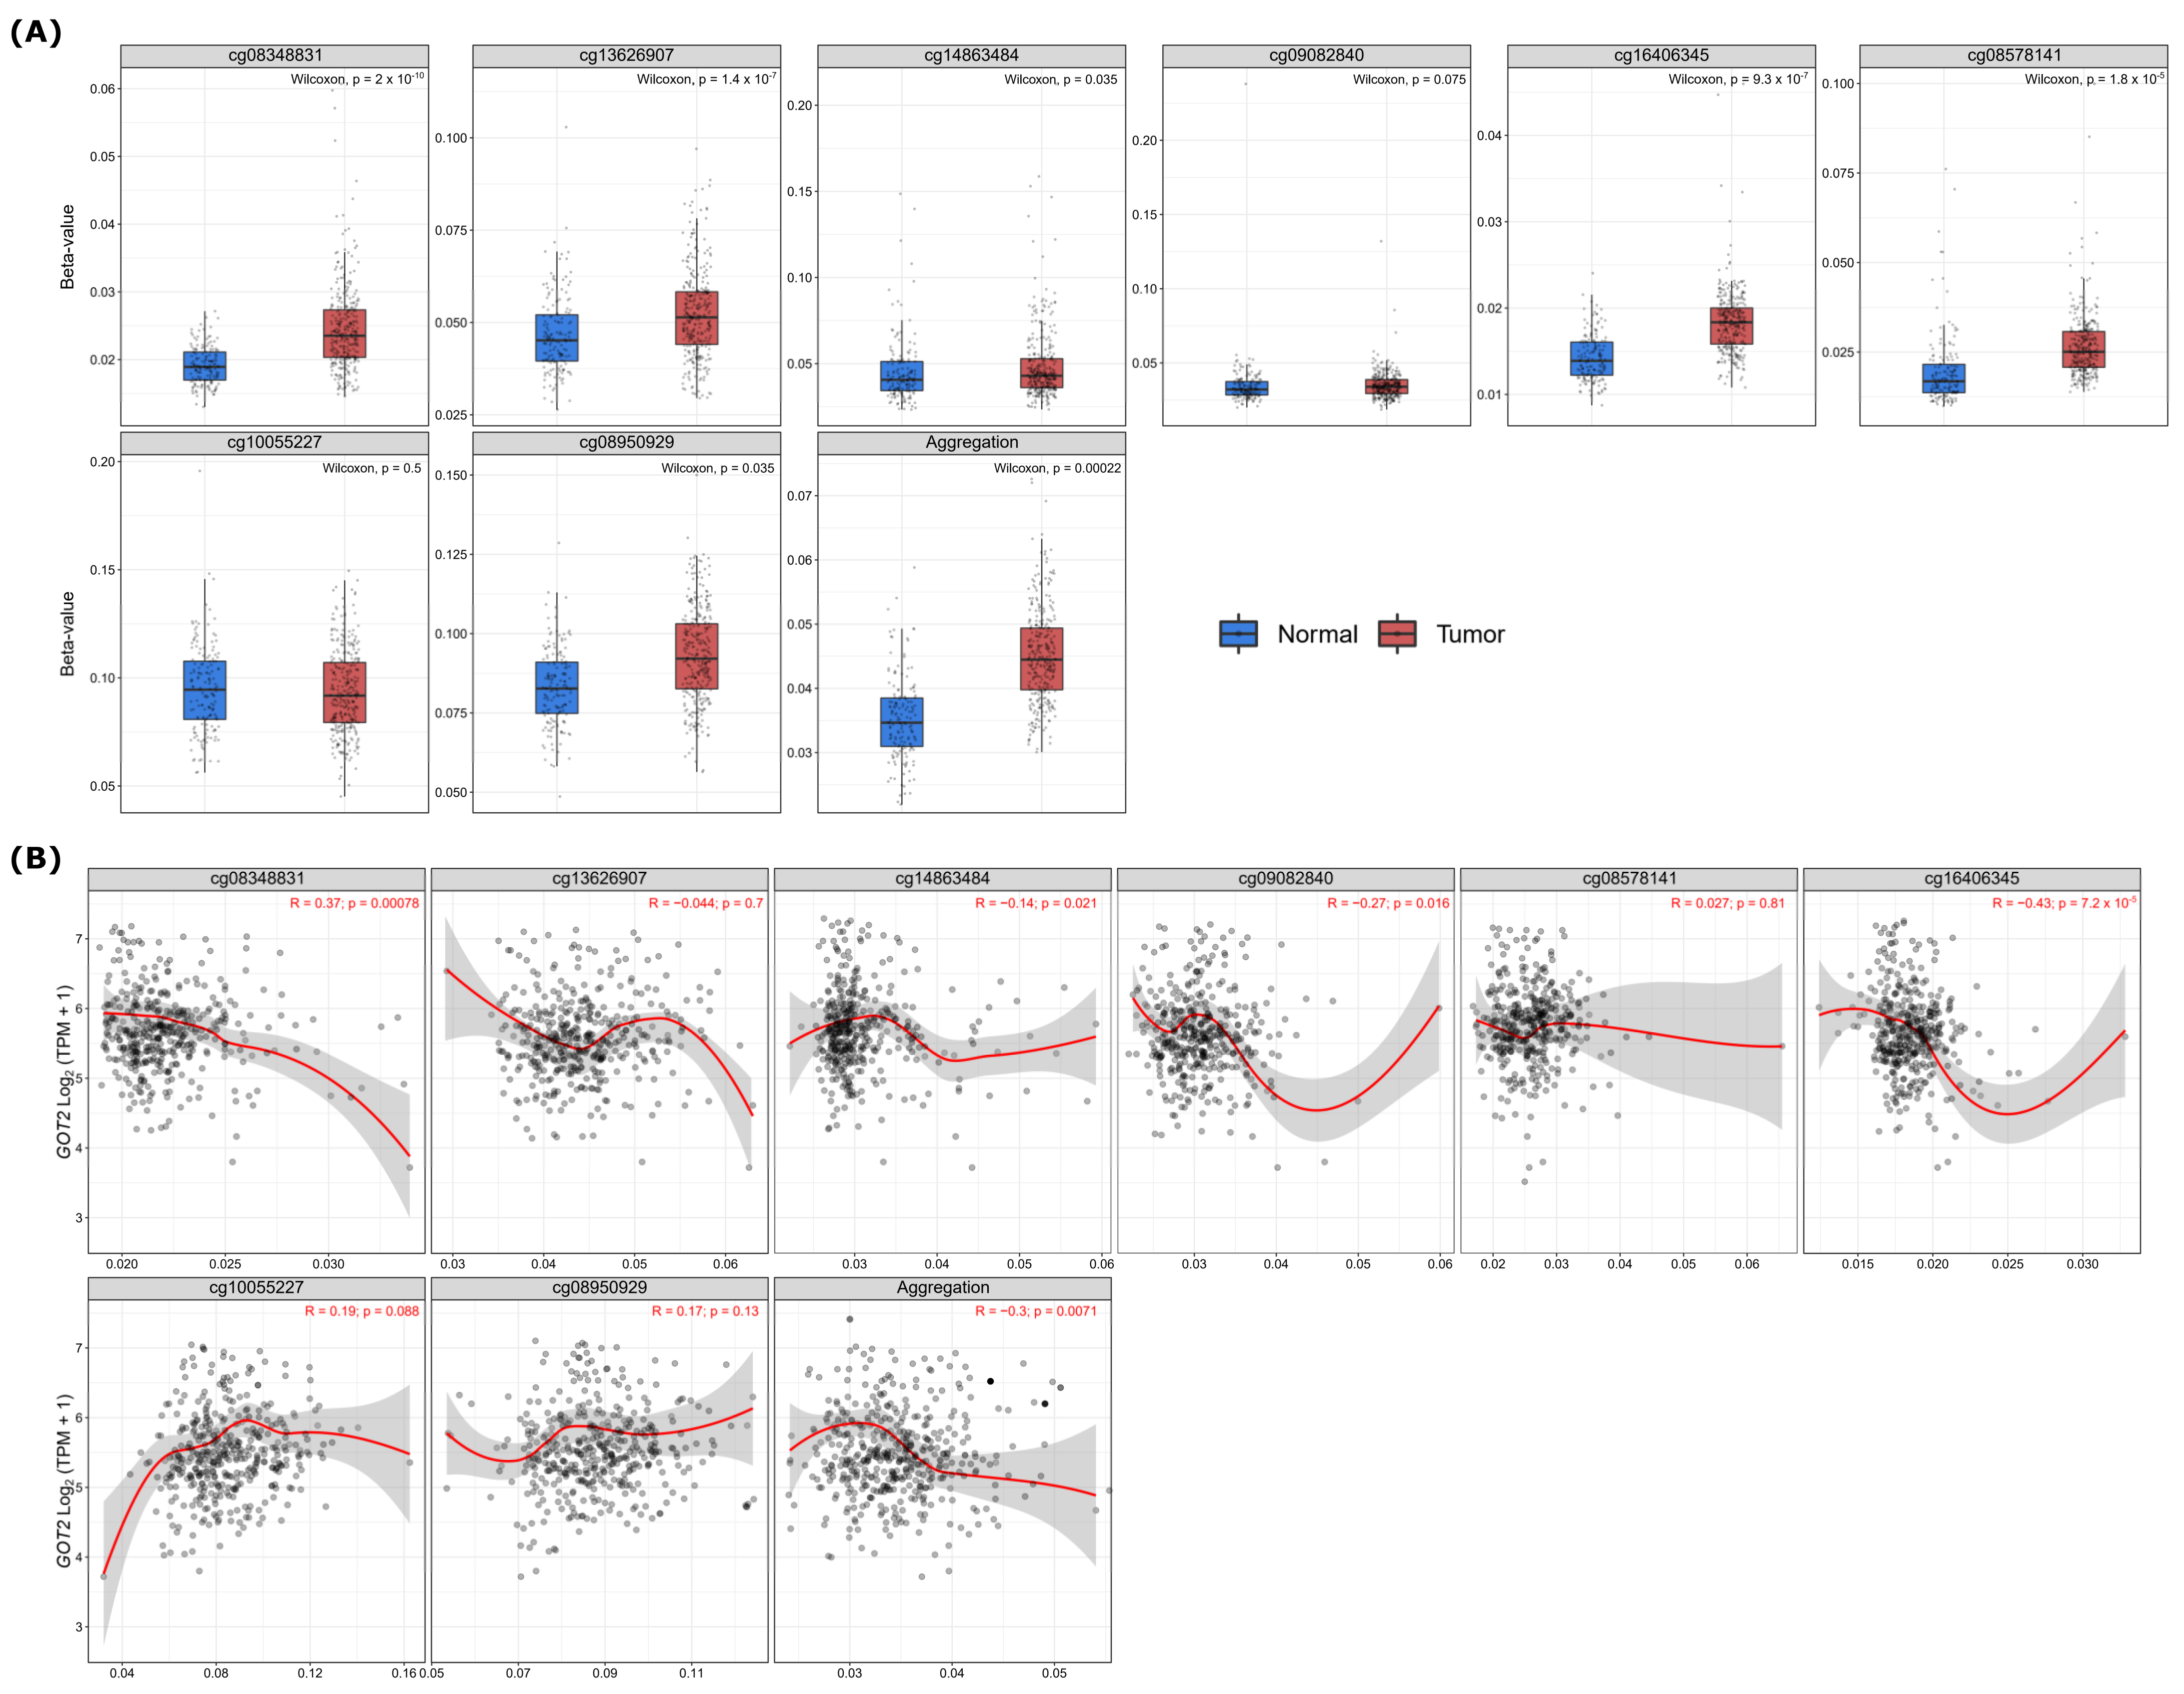
3.5. Hypermethylation of DNA in the Promoter Region Leads to Low Expression of GOT2 in KIRC

To further explore the epigenetic mechanism underlying GOT2 underexpression, we analyzed the methylation level of seventeen probes covering the island (promoter region), N Shelf, S Shore, and Open Sea regions of GOT2, chosen through the UCSC Genome Browser (Table 2; Figure 5). Notably, the results showed that lower methylation levels for GOT2 lay on probes at the promoter (island). At the same time, most hypermethylated sites fell in the open sea, N Shelf, and S Shore regions (Figure 6). Given that methylation of CpG sites within the gene promoter is a common mechanism in gene silencing, we next compared the methylation level of the probes that covered the GOT2 promoter between normal vs. KIRC-TCGA samples (Figure 5). Interestingly, we found that the average methylation of all CpG sites (probes) near the TSS (transcription start site) of GOT2 was significantly higher in tumor tissues than in the normal counterpart (Aggregation, p = 0.00022) (Figure 7A). Further analysis revealed a negative correlation between the methylation level and the mRNA of GOT2 (Aggregation: R = −0.3, p = 0.0071) (Figure 7B), thus indicating that upregulation of DNA methylation level of CpGs island-associated promoter region may contribute to the downregulation of GOT2 in KIRC patients.

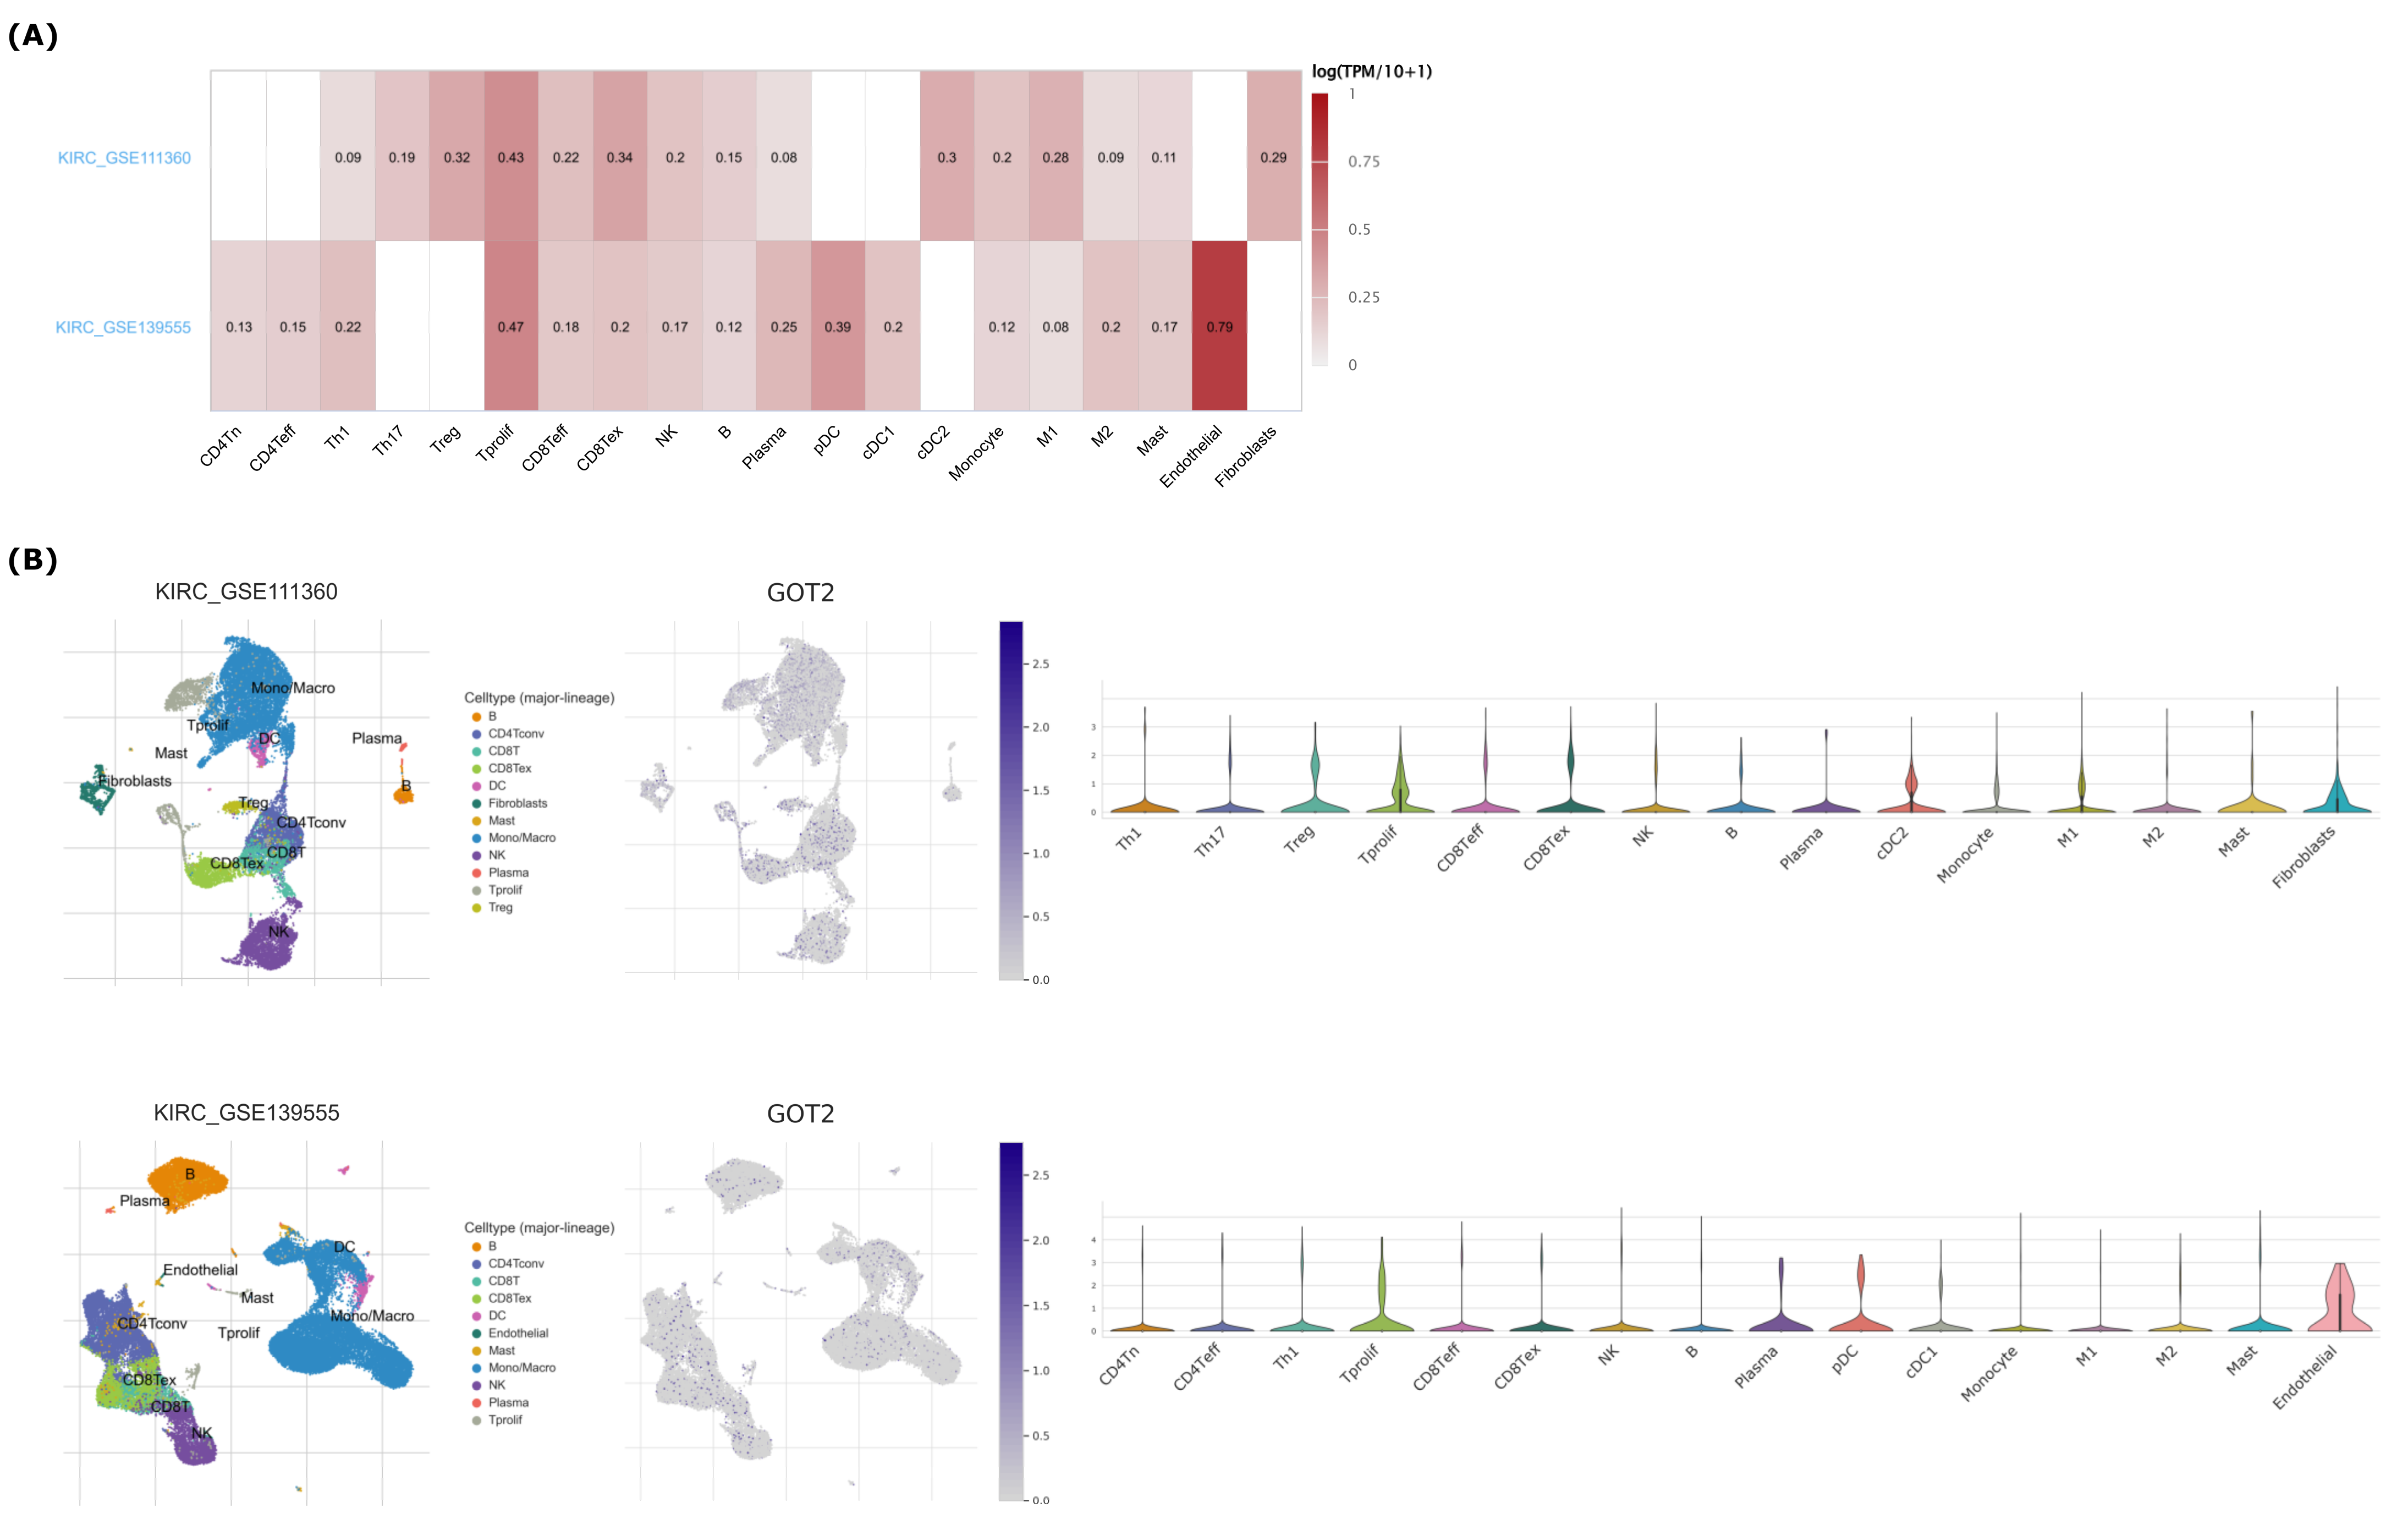
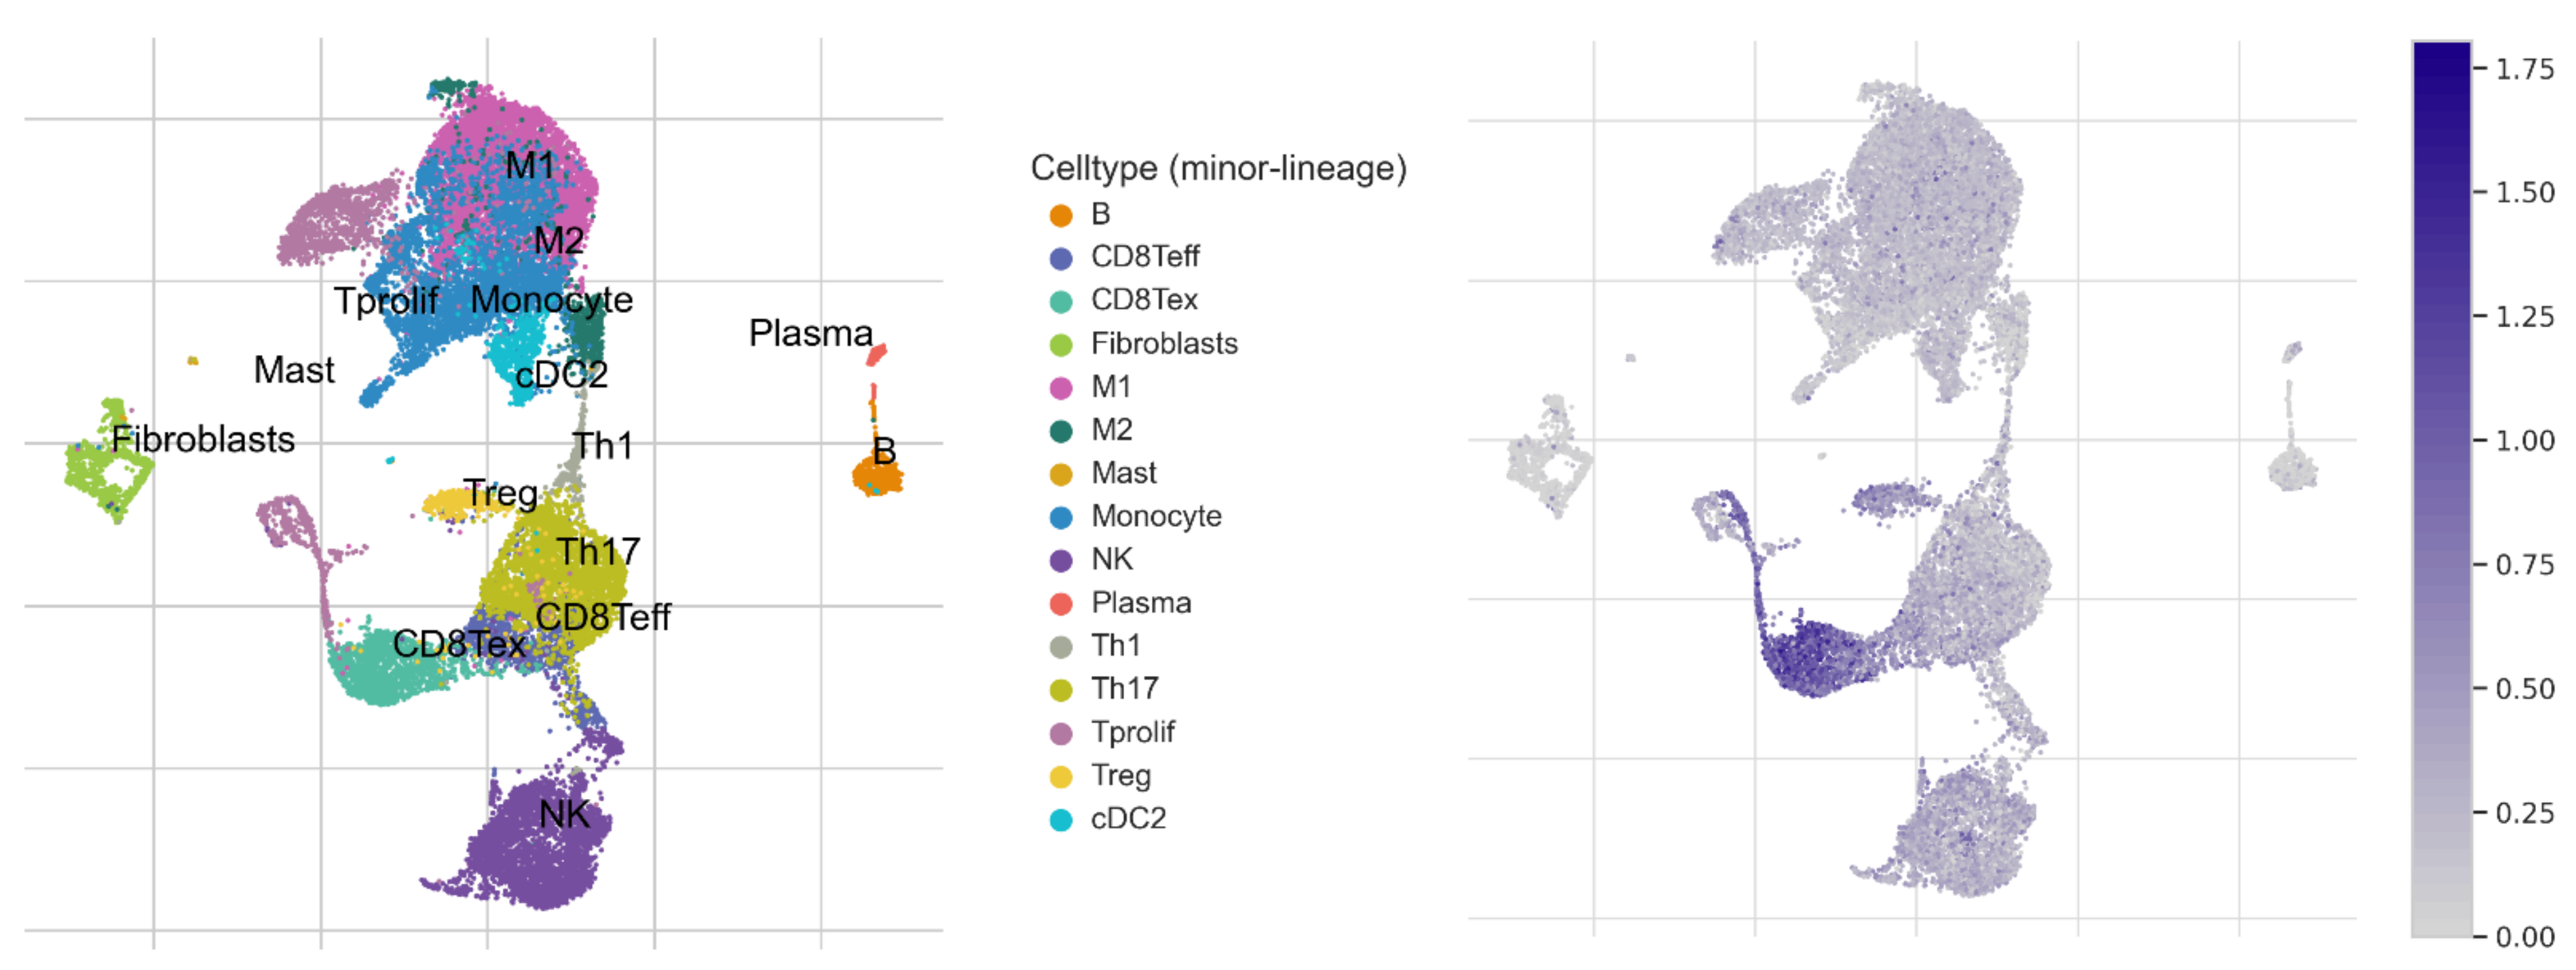
3.6. GOT2 Expression Correlates with Immune Cell Infiltration in KIRC

Tumor-infiltrating immune cells are essential for immune response and prognosis in KIRC patients [57,58]. To determine whether GOT2 could potentially impact immune cell infiltration in KIRC, we first examined the differences in GOT2 expression across the six immune subtypes proposed by Thorsson et al. [59]. We observed that GOT2 expression was highest in patients harboring the C5 subtype (immunologically quiet) and lowest in patients exhibiting the C2 subtype (IFN-gamma dominant), indicating that GOT2 can be used as a marker for immunophenotyping of patients with clear-cell renal cell carcinoma (Figure 8A).
To better understand the role of GOT2 in the infiltration of immune cells in KIRC, we used the CIBERSORT deconvolution analysis [53] for rough correlation analysis. The immune-related signatures revealed that GOT2 was higher in CD8+ T cells, follicular helper CD4+ T (Tfh) cells, M1 and M2 Macrophages in KIRC-TCGA tumors than in normal tissues (Figure 8B). To further expand and strengthen these results, the analysis of two independent single-cell RNA sequencing (scRNA-seq) datasets [55,56] showed that GOT2 was mainly expressed within endothelial cells, followed by proliferative T cells (Tprolif), plasmacytoid dendritic cells (pDCs), exhausted CD8+ T Cells (CD8Tex), Treg cells and conventional dendritic cells 2 (cDC2) (Figure 9A,B). These results imply that GOT2 may play an essential role in the tumor microenvironment of the clear-cell renal cell carcinoma, affecting both stroma and immune cells. Interestingly, GOT2 was broadly expressed within some clusters of immune cells (e.g., CD8ex and Tprolif) that also co-expressed some immune checkpoint inhibitors (e.g., CTLA4, TIGIT, TOX, EOMES, LAG3, PDCD1, HAVCR2, and CD96) (Figure 10), thus strongly suggesting that GOT2 is involved in the dynamic regulation of immune homeostasis and is particularly relevant to T cell functionality.

4. Discussion

KIRC is characterized by profound metabolic reprogramming that involves multiple pathways [14,15]. Current evidence suggests that changes in the supply of specific metabolites, such as aspartate, which is essential for nucleotide and protein synthesis in proliferating cells and maintains the reducing potential [28,60,61], can function as opportunistic fuel sources for high proliferation and tumor growth [25,27,62]. As part of the malate–aspartate shuttle, mitochondrial GOT2 generates aspartate from oxaloacetate and glutamate [63]. Additionally, this enzyme is involved in energy transduction, specifically amino acid metabolism and the urea and TCA cycles. Thus far, there is no available information about the detailed roles of GOT2 in KIRC. Herein, we elucidated the most comprehensive insights into understanding the epigenetic regulation and the potential association of GOT2 with the clinical and immunity of KIRC.
Based on a pan-cancer perspective, we initially demonstrated that GOT2 is differentially expressed in 18 tumor types, thus potentially being a therapeutic target. Further interrogating KIRC, we showed that the GOT2 mRNA and protein levels were markedly decreased in KIRC patients than in normal tissues. Besides, we observed that this transaminase was markedly lower as the pathological stage increased and was also strongly impacted by other clinicopathological characteristics, which conferred a worse outcome. Our findings are consistent with Zhao et al. [64], who also reported the decreased expression and prognostic value of GOT2 in hepatocellular carcinoma (HCC). The results from a recent study support a scenario in which in VHL-deficient KIRC, but not in non-clear renal cell carcinomas (NCRCC), the simultaneous suppression of GOT1 and GOT2 is HIF1α-dependent, which impairs oxidative and reductive aspartate biogenesis [61]. Hence, to compensate for the low levels of aspartate seen in the KIRC [65], glutamine metabolism has a dominant role in sustaining KIRC growth [66]. This conceivably explains the down-expression of GOT2 in KIRC patients harboring VHL, PBRM1, and SETD2 mutations seen in our study, thus suggesting that GOT2 repression represents a specific metabolic feature of KIRC.
DNA methylation of specific CpG sites in the promoter region is tightly linked with transcription repression. In the last few years, its role in carcinogenesis has been of considerable interest [67,68,69]. It is currently well known that KIRC is characterized by many epigenome aberrations [70,71]. Furthermore, many studies have pointed out the occurrence of a pattern known as CpG island methylator phenotype (CIMP) in 20% of KIRC [71,72]. However, no study has previously been carried out to analyze the role of DNA methylation in GOT2 expression in KIRC. Here, for the first time, we provided evidence that the methylation of the GOT2 promoter was increased in KIRC patients compared to normal samples. Additionally, the correlation analysis results revealed that promoter methylation was negatively correlated with the regulation of gene expression. According to these results, it can be speculated that the DNA hypermethylation in the promoter-associated CpG islands may be one of the mechanisms leading to GOT2 down-expression in KIRC. However, additional efforts are necessary to determine the potential impact of additional events, such as chromatin structural modifications, miRNAs, and the influence of metabolites on patients exhibiting GOT2 promoter hypermethylation.
In addition, another innovative aspect of this study clarified the significant correlations between GOT2 expression and various tumor-infiltrating immune cells in KIRC. Previous studies have found that T cells and macrophages represented the dominant populations in most KIRC cases [73,74], consistent with our findings, which indicates that GOT2 expression was more likely to affect the tumor infiltration of subtypes of T cells, especially CD8+ T cells and follicular helper CD4+ T (Tfh) cells, and M1 and M2 macrophages compared to normal renal tissue. Our deep-dissection of individual cell subsets from scRNA-seq data revealed that GOT2 was broadly expressed within exhausted CD8+ T Cells (CD8Tex) and in the proliferative T cells (Tprolif). Unlike all solid tumors, high tumor-infiltrating CD8+ T-cells predicted poor overall survival and inferior therapeutic responsiveness in patients with KIRC [75,76,77]. However, a comprehensive characterization of immune cells from KIRC patients using scRNA-seq along with T-cell-receptor (TCR) sequencing revealed that CD8+ T-cells exhibited four distinct groups that may represent transcriptional states upon tumor infiltration with distinct prognostic significance: two of them were associated with a PD-1+ TIM-3+ exhausted subcluster, one with a proliferative subcluster, and a fourth with the higher levels of cytokine signaling [73]. Moreover, a correlation observed between increased clusters with the signature CD8_6 (CD8+T-cells) and TAM_3 (macrophages) showed a better prognosis. In another study, a first-in-class CAR T-cell therapy co-expressing GOT2 enhanced T-cell metabolic function for treating GPC3-positive solid tumors, supporting the progress of a future first-in-human trial in subjects with GPC3-positive tumors [78]. Considering this context, we argue that GOT2 is likely to play distinct roles at different stages of T-cell exhaustion and might potentially be modulated by the spectrum of changes in TME conditions of KIRC patients, including tumor metabolism, hypoxia, nutrient restriction, and exhaustion driven by chronic stimulation, thus strengthening the potential application of synergic modulation of the GOT2 and T cell exhaustion markers in non-responsive KIRC patients to boost antitumor and immune responses.
In conclusion, using a series of rigorous bioinformatics analyses, we showed that the mRNA and the expression levels of the GOT2 protein were significantly decreased in KIRC patients compared to normal ones. This low expression was positively associated with clinicopathological features, culminating in poor clinical outcomes for KIRC patients. Notably, we provide the first mechanism insights into the epigenetic-mediated regulation of GOT2, which is driven by the DNA methylation in the promoter-related CpG islands. Finally, we also shed light on the influence of GOT2 expression in immune cell infiltration, suggesting that GOT2 may be a potential prognostic marker and therapeutic target for KIRC patients.

Author Contributions

W.A.S.F. and E.H.C.d.O.: conceived and designed the study; W.A.S.F.: performed data mining; W.A.S.F.: writing—original draft preparation; E.H.C.d.O.: reviewed and editing; E.H.C.d.O.: funding acquisition. All authors have read and agreed to the published version of the manuscript.

Funding

This research was funded by the Pró-Reitoria de Pesquisa e Pós-Graduação (PROPESP/UFPA, Brazil) (PAPQ-02/2022).

Institutional Review Board Statement

Not applicable.

Informed Consent Statement

Not applicable.

Data Availability Statement

The datasets analyzed for this study can be found in the GEPIA2 dababase (http://gepia.cancer-pku.cn/index.html, accessed on 1 December 2021), GTEx (http://www.gtexportal.org/home/index.html, accessed on 1 December 2021), HPA database (Human Protein Atlas) (https://www.proteinatlas.org/, accessed on 1 December 2021), UALCAN (http://ualcan.path.uab.edu/analysis.html, accessed on 1 December 2021), Kaplan Meier (KM) Plotter (http://kmplot.com/analysis/, accessed on 5 December 2021), MethSurv database (https://biit.cs.ut.ee/methsurv/, accessed on 10 December 2021), Shiny Methylation Analysis Resource Tool (SMART) (http://www.bioinfo-zs.com/smartapp/, accessed on 10 December 2021), GEPIA2021 (http://gepia2021.cancer-pku.cn/, accessed on 1 December 2021) and Tumor Immune Estimation Resource (TIMER, https://cistrome.shinyapps.io/timer, accessed on 1 December 2021 ), Tumor Immune Single-cell Hub (TISCH, http://tisch.comp-genomics.org/home/, accessed on 1 April 2022). Further inquiries can be directed to the corresponding authors.

Acknowledgments

The authors are grateful to Evandro Chagas Institute (Brazil) and Pró-Reitoria de Pesquisa e Pós-Graduação (PROPESP/UFPA, Brazil) for financial and technical support.

Conflicts of Interest

The authors declare no conflict of interest.

References

  1. Bray, F.; Ferlay, J.; Soerjomataram, I.; Siegel, R.L.; Torre, L.A.; Jemal, A. Global cancer statistics 2018: GLOBOCAN estimates of incidence and mortality worldwide for 36 cancers in 185 countries. CA Cancer J. Clin. 2018, 68, 394–424. [Google Scholar] [CrossRef] [PubMed] [Green Version]
  2. Lopez-Beltran, A.; Carrasco, J.C.; Cheng, L.; Scarpelli, M.; Kirkali, Z.; Montironi, R. 2009 update on the classification of renal epithelial tumors in adults. Int. J. Urol. 2009, 16, 432–443. [Google Scholar] [CrossRef] [PubMed]
  3. Hsieh, J.J.; Purdue, M.P.; Signoretti, S.; Swanton, C.; Albiges, L.; Schmidinger, M.; Heng, D.Y.; Larkin, J.; Ficarra, V. Renal cell carcinoma. Nat. Rev. Dis. Primers 2017, 3, 17009. [Google Scholar] [CrossRef] [PubMed]
  4. Rini, B.I.; Campbell, S.C.; Escudier, B. Renal cell carcinoma. Lancet 2009, 373, 1119–1132. [Google Scholar] [CrossRef]
  5. Gerlinger, M.; Rowan, A.J.; Horswell, S.; Math, M.; Larkin, J.; Endesfelder, D.; Gronroos, E.; Martinez, P.; Matthews, N.; Stewart, A.; et al. Intratumor heterogeneity and branched evolution revealed by multiregion sequencing. N. Engl. J. Med. 2012, 366, 883–892. [Google Scholar] [CrossRef] [Green Version]
  6. Gerlinger, M.; Horswell, S.; Larkin, J.; Rowan, A.J.; Salm, M.; Varela, I.; Fisher, R.; McGranahan, N.; Matthews, N.; Santos, C.R.; et al. Genomic architecture and evolution of clear cell renal cell carcinomas defined by multiregion sequencing. Nat. Genet. 2014, 46, 225–233. [Google Scholar] [CrossRef]
  7. Sankin, A.; Hakimi, A.A.; Mikkilineni, N.; Ostrovnaya, I.; Silk, M.T.; Liang, Y.; Mano, R.; Chevinsky, M.; Motzer, R.; Solomon, S.B.; et al. The impact of genetic heterogeneity on biomarker development in kidney cancer assessed by multiregional sampling. Cancer Med. 2014, 3, 1485–1492. [Google Scholar] [CrossRef] [PubMed]
  8. Hsieh, J.J.; Chen, D.; Wang, P.I.; Marker, M.; Redzematovic, A.; Chen, Y.-B.; Selcuklu, S.D.; Weinhold, N.; Bouvier, N.; Huberman, K.H.; et al. Genomic Biomarkers of a Randomized Trial Comparing First-line Everolimus and Sunitinib in Patients with Metastatic Renal Cell Carcinoma. Eur. Urol. 2016, 71, 405–414. [Google Scholar] [CrossRef] [Green Version]
  9. Jonasch, E.; Walker, C.L.; Rathmell, W.K. Clear cell renal cell carcinoma ontogeny and mechanisms of lethality. Nat. Rev. Nephrol. 2020, 17, 245–261. [Google Scholar] [CrossRef]
  10. Molina, A.; Lin, X.; Korytowsky, B.; Matczak, E.; Lechuga, M.; Wiltshire, R.; Motzer, R. Sunitinib objective response in metastatic renal cell carcinoma: Analysis of 1059 patients treated on clinical trials. Eur. J. Cancer 2013, 50, 351–358. [Google Scholar] [CrossRef]
  11. Motzer, R.J.; Barrios, C.H.; Kim, T.M.; Falcon, S.; Cosgriff, T.; Harker, W.G.; Srimuninnimit, V.; Pittman, K.; Sabbatini, R.; Rha, S.Y.; et al. Phase II Randomized Trial Comparing Sequential First-Line Everolimus and Second-Line Sunitinib Versus First-Line Sunitinib and Second-Line Everolimus in Patients With Metastatic Renal Cell Carcinoma. J. Clin. Oncol. 2014, 32, 2765–2772. [Google Scholar] [CrossRef] [Green Version]
  12. Cui, H.; Shan, H.; Miao, M.Z.; Jiang, Z.; Meng, Y.; Chen, R.; Zhang, L.; Liu, Y. Identification of the key genes and pathways involved in the tumorigenesis and prognosis of kidney renal clear cell carcinoma. Sci. Rep. 2020, 10, 4271. [Google Scholar] [CrossRef]
  13. Ragone, R.; Sallustio, F.; Piccinonna, S.; Rutigliano, M.; Vanessa, G.; Palazzo, S.; Lucarelli, G.; Ditonno, P.; Battaglia, M.; Fanizzi, F.P.; et al. Renal Cell Carcinoma: A Study through NMR-Based Metabolomics Combined with Transcriptomics. Diseases 2016, 4, 7. [Google Scholar] [CrossRef]
  14. Wettersten, H.I.; Aboud, O.A.; Lara, P.N., Jr.; Weiss, R.H. Metabolic reprogramming in clear cell renal cell carcinoma. Nature reviews. Nephrology 2017, 13, 410–419. [Google Scholar]
  15. Bianchi, C.; Meregalli, C.; Bombelli, S.; Di Stefano, V.; Salerno, F.; Torsello, B.; De Marco, S.; Bovo, G.; Cifola, I.; Mangano, E.; et al. The glucose and lipid metabolism reprogramming is grade-dependent in clear cell renal cell carcinoma primary cultures and is targetable to modulate cell viability and proliferation. Oncotarget 2017, 8, 113502–113515. [Google Scholar] [CrossRef] [Green Version]
  16. Lucarelli, G.; Loizzo, D.; Franzin, R.; Battaglia, S.; Ferro, M.; Cantiello, F.; Castellano, G.; Bettocchi, C.; Ditonno, P.; Battaglia, M. Metabolomic insights into pathophysiological mechanisms and biomarker discovery in clear cell renal cell carcinoma. Expert Rev. Mol. Diagn. 2019, 19, 397–407. [Google Scholar] [CrossRef]
  17. Lucarelli, G.; Rutigliano, M.; Sallustio, F.; Ribatti, D.; Giglio, A.; Signorile, M.L.; Grossi, V.; Sanese, P.; Napoli, A.; Maiorano, E.; et al. Integrated multi-omics characterization reveals a distinctive metabolic signature and the role of NDUFA4L2 in promoting angiogenesis, chemoresistance, and mitochondrial dysfunction in clear cell renal cell carcinoma. Aging 2018, 10, 3957–3985. [Google Scholar] [CrossRef]
  18. Bombelli, S.; Torsello, B.; De Marco, S.; Lucarelli, G.; Cifola, I.; Grasselli, C.; Strada, G.; Bovo, G.; Perego, R.A.; Bianchi, C. 36-kDa Annexin A3 Isoform Negatively Modulates Lipid Storage in Clear Cell Renal Cell Carcinoma Cells. Am. J. Pathol. 2020, 190, 2317–2326. [Google Scholar] [CrossRef]
  19. Maxwell, P.H.; Dachs, G.U.; Gleadle, J.M.; Nicholls, L.G.; Harris, A.L.; Stratford, I.J.; Hankinson, O.; Pugh, C.W.; Ratcliffe, P.J. Hypoxia-inducible factor-1 modulates gene expression in solid tumors and influences both angiogenesis and tumor growth. Proc. Natl. Acad. Sci. USA 1997, 94, 8104–8109. [Google Scholar] [CrossRef] [Green Version]
  20. Flamme, I.; Krieg, M.; Plate, K.H. Up-Regulation of Vascular Endothelial Growth Factor in Stromal Cells of Hemangioblastomas Is Correlated with Up-Regulation of the Transcription Factor HRF/HIF-2α. Am. J. Pathol. 1998, 153, 25–29. [Google Scholar] [CrossRef]
  21. Krieg, M.; Haas, R.; Brauch, H.; Acker, T.; Flamme, I.; Plate, K.H. Up-regulation of hypoxia-inducible factors HIF-1α and HIF-2α under normoxic conditions in renal carcinoma cells by von Hippel-Lindau tumor suppressor gene loss of function. Oncogene 2000, 19, 5435–5443. [Google Scholar] [CrossRef] [PubMed] [Green Version]
  22. Díaz-Montero, C.M.; Rini, B.I.; Finke, J.H. The immunology of renal cell carcinoma. Nat. Rev. Nephrol. 2020, 16, 721–735. [Google Scholar] [CrossRef] [PubMed]
  23. D’Avella, C.; Abbosh, P.; Pal, S.K.; Geynisman, D.M. Mutations in renal cell carcinoma. Urol. Oncol. Semin. Orig. Investig. 2018, 38, 763–773. [Google Scholar] [CrossRef]
  24. Pandey, N.; Lanke, V.; Vinod, P.K. Network-based metabolic characterization of renal cell carcinoma. Sci. Rep. 2020, 10, 5955. [Google Scholar] [CrossRef] [PubMed]
  25. Garcia-Bermudez, J.; Baudrier, L.; La, K.; Zhu, X.G.; Fidelin, J.; Sviderskiy, V.O.; Papagiannakopoulos, T.; Molina, H.; Snuderl, M.; Lewis, C.A.; et al. Publisher Correction: Aspartate is a limiting metabolite for cancer cell proliferation under hypoxia and in tumours. Nat. Cell Biol. 2018, 20, 775–781. [Google Scholar] [CrossRef]
  26. Sullivan, L.B.; Luengo, A.; Danai, L.V.; Bush, L.N.; Diehl, F.F.; Hosios, A.M.; Lau, A.N.; Elmiligy, S.; Malstrom, S.; Lewis, C.A.; et al. Aspartate is an endogenous metabolic limitation for tumour growth. Nat. Cell Biol. 2018, 20, 782–788. [Google Scholar] [CrossRef] [PubMed]
  27. Rabinovich, S.; Adler, L.; Yizhak, K.; Sarver, A.; Silberman, A.; Agron, S.; Stettner, N.; Sun, Q.; Brandis, A.; Helbling, D.; et al. Diversion of aspartate in ASS1-deficient tumours fosters de novo pyrimidine synthesis. Nature 2015, 527, 379–383. [Google Scholar] [CrossRef]
  28. Birsoy, K.; Wang, T.; Chen, W.W.; Freinkman, E.; Abu-Remaileh, M.; Sabatini, D.M. An Essential Role of the Mitochondrial Electron Transport Chain in Cell Proliferation Is to Enable Aspartate Synthesis. Cell 2015, 162, 540–551. [Google Scholar] [CrossRef] [Green Version]
  29. Van Karnebeek, C.D.M.; Ramos, R.J.; Wen, X.-Y.; Tarailo-Graovac, M.; Gleeson, J.G.; Skrypnyk, C.; Brand-Arzamendi, K.; Karbassi, F.; Issa, M.Y.; van der Lee, R.; et al. Bi-allelic GOT2 Mutations Cause a Treatable Malate-Aspartate Shuttle-Related Encephalopathy. Am. J. Hum. Genet. 2019, 105, 534–548. [Google Scholar] [CrossRef] [Green Version]
  30. Yang, H.; Zhou, L.; Shi, Q.; Zhao, Y.; Lin, H.; Zhang, M.; Zhao, S.; Yang, Y.; Ling, Z.-Q.; Guan, K.-L.; et al. SIRT 3-dependent GOT2 acetylation status affects the malate–aspartate NADH shuttle activity and pancreatic tumor growth. EMBO J. 2015, 34, 1110–1125. [Google Scholar] [CrossRef] [Green Version]
  31. Hsu, P.P.; Sabatini, D.M. Cancer Cell Metabolism: Warburg and Beyond. Cell 2008, 134, 703–707. [Google Scholar] [CrossRef] [Green Version]
  32. Yang, S.; Hwang, S.; Kim, M.; Seo, S.B.; Lee, J.-H.; Jeong, S.M. Mitochondrial glutamine metabolism via GOT2 supports pancreatic cancer growth through senescence inhibition. Cell Death Dis. 2018, 9, 55. [Google Scholar] [CrossRef]
  33. Guan, H.; Sun, C.; Gu, Y.; Li, J.; Ji, J.; Zhu, Y. Circular RNA circ_0003028 contributes to tumorigenesis by regulating GOT2 via miR-1298-5p in non-small cell lung cancer. Bioengineered 2021, 12, 2326–2340. [Google Scholar] [CrossRef]
  34. Jin, M.; Shi, C.; Hua, Q.; Li, T.; Yang, C.; Wu, Y.; Zhao, L.; Yang, H.; Zhang, J.; Hu, C.; et al. High circ-SEC31A expression predicts unfavorable prognoses in non-small cell lung cancer by regulating the miR-520a-5p/GOT-2 axis. Aging 2020, 12, 10381–10397. [Google Scholar] [CrossRef]
  35. Liu, M.; Liu, X.; Liu, S.; Xiao, F.; Guo, E.; Qin, X.; Wu, L.; Liang, Q.; Liang, Z.; Li, K.; et al. Big Data-Based Identification of Multi-Gene Prognostic Signatures in Liver Cancer. Front. Oncol. 2020, 10, 847. [Google Scholar] [CrossRef]
  36. Du, F.; Chen, J.; Liu, H.; Cai, Y.; Cao, T.; Han, W.; Yi, X.; Qian, M.; Tian, D.; Nie, Y.; et al. SOX12 promotes colorectal cancer cell proliferation and metastasis by regulating asparagine synthesis. Cell Death Dis. 2019, 10, 239. [Google Scholar] [CrossRef]
  37. Feist, M.; Schwarzfischer, P.; Heinrich, P.; Sun, X.; Kemper, J.; von Bonin, F.; Perez-Rubio, P.; Taruttis, F.; Rehberg, T.; Dettmer, K.; et al. Cooperative stat/nf-kappab signaling regulates lymphoma metabolic reprogramming and aberrant got2 expression. Nat. Commun. 2018, 9, 1514. [Google Scholar] [CrossRef]
  38. Minchenko, O.H.; Riabovol, O.O.; Tsymbal, D.O.; Minchenko, D.O.; Ratushna, O.O. Effect of hypoxia on the expression of nuclear genes encoding mitochondrial proteins in U87 glioma cells. Ukr. Biochem. J. 2016, 88, 54–65. [Google Scholar] [CrossRef] [Green Version]
  39. Li, T.; Fu, J.; Zeng, Z.; Cohen, D.; Li, J.; Chen, Q.; Li, B.; Liu, X.S. TIMER2.0 for analysis of tumor-infiltrating immune cells. Nucleic Acids Res. 2020, 48, W509–W514. [Google Scholar] [CrossRef]
  40. Tang, Z.; Kang, B.; Li, C.; Chen, T.; Zhang, Z. GEPIA2: An enhanced web server for large-scale expression profiling and interactive analysis. Nucleic Acids Res. 2019, 47, W556–W560. [Google Scholar] [CrossRef] [PubMed] [Green Version]
  41. Chandrashekar, D.S.; Bashel, B.; Balasubramanya, S.A.H.; Creighton, C.J.; Ponce-Rodriguez, I.; Chakravarthi, B.V.S.K.; Varambally, S. UALCAN: A portal for facilitating tumor subgroup gene expression and survival analyses. Neoplasia 2017, 19, 649–658. [Google Scholar] [CrossRef] [PubMed]
  42. Chandrashekar, D.S.; Karthikeyan, S.K.; Korla, P.K.; Patel, H.; Shovon, A.R.; Athar, M.; Netto, G.J.; Qin, Z.S.; Kumar, S.; Manne, U.; et al. UALCAN: An update to the integrated cancer data analysis platform. Neoplasia 2022, 25, 18–27. [Google Scholar] [CrossRef] [PubMed]
  43. Edwards, N.J.; Oberti, M.; Thangudu, R.R.; Cai, S.; McGarvey, P.B.; Jacob, S.; Madhavan, S.; Ketchum, K.A. The CPTAC Data Portal: A Resource for Cancer Proteomics Research. J. Proteome Res. 2015, 14, 2707–2713. [Google Scholar] [CrossRef]
  44. Chen, F.; Chandrashekar, D.S.; Varambally, S.; Creighton, C.J. Pan-cancer molecular subtypes revealed by mass-spectrometry-based proteomic characterization of more than 500 human cancers. Nat. Commun. 2019, 10, 5679. [Google Scholar] [CrossRef] [Green Version]
  45. Monsivais, D.; Vasquez, Y.M.; Chen, F.; Zhang, Y.; Chandrashekar, D.S.; Faver, J.C.; Masand, R.P.; Scheurer, M.E.; Varambally, S.; Matzuk, M.M.; et al. Mass-spectrometry-based proteomic correlates of grade and stage reveal pathways and kinases associated with aggressive human cancers. Oncogene 2021, 40, 2081–2095. [Google Scholar] [CrossRef]
  46. Uhlén, M.; Zhang, C.; Lee, S.; Sjöstedt, E.; Fagerberg, L.; Bidkhori, G.; Benfeitas, R.; Arif, M.; Liu, Z.; Edfors, F.; et al. A pathology atlas of the human cancer transcriptome. Science 2017, 357, 2507. [Google Scholar] [CrossRef] [Green Version]
  47. Thul, P.J.; Åkesson, L.; Wiking, M.; Mahdessian, D.; Geladaki, A.; Ait Blal, H.; Alm, T.; Asplund, A.; Björk, L.; Breckels, L.M.; et al. A subcellular map of the human proteome. Science 2017, 356, eaal3321. [Google Scholar] [CrossRef]
  48. Uhlén, M.; Fagerberg, L.; Hallström, B.M.; Lindskog, C.; Oksvold, P.; Mardinoglu, A.; Sivertsson, Å.; Kampf, C.; Sjöstedt, E.; Asplund, A.; et al. Proteomics. Tissue-Based Map of the Human Proteome. Science 2015, 347, 1260419. [Google Scholar] [CrossRef]
  49. Brooks, S.A.; Brannon, A.R.; Parker, J.S.; Fisher, J.C.; Sen, O.; Kattan, M.W.; Hakimi, A.A.; Hsieh, J.J.; Choueiri, T.K.; Tamboli, P.; et al. ClearCode34: A Prognostic Risk Predictor for Localized Clear Cell Renal Cell Carcinoma. Eur. Urol. 2014, 66, 77–84. [Google Scholar] [CrossRef] [Green Version]
  50. Györffy, B.; Lanczky, A.; Eklund, A.C.; Denkert, C.; Budczies, J.; Li, Q.; Szallasi, Z. An online survival analysis tool to rapidly assess the effect of 22,277 genes on breast cancer prognosis using microarray data of 1809 patients. Breast Cancer Res. Treat. 2009, 123, 725–731. [Google Scholar] [CrossRef] [Green Version]
  51. Modhukur, V.; Iljasenko, T.; Metsalu, T.; Lokk, K.; Laisk-Podar, T.; Vilo, J. MethSurv: A web tool to perform multivariable survival analysis using DNA methylation data. Epigenomics 2018, 10, 277–288. [Google Scholar] [CrossRef] [PubMed] [Green Version]
  52. Li, Y.; Ge, D.; Lu, C. The SMART App: An interactive web application for comprehensive DNA methylation analysis and visualization. Epigenet. Chromatin 2019, 12, 71. [Google Scholar] [CrossRef] [PubMed] [Green Version]
  53. Li, C.; Tang, Z.; Zhang, W.; Ye, Z.; Liu, F. GEPIA2021: Integrating multiple deconvolution-based analysis into GEPIA. Nucleic Acids Res. 2021, 49, W242–W246. [Google Scholar] [CrossRef] [PubMed]
  54. Sun, D.; Wang, J.; Han, Y.; Dong, X.; Ge, J.; Zheng, R.; Shi, X.; Wang, B.; Li, Z.; Ren, P.; et al. TISCH: A comprehensive web resource enabling interactive single-cell transcriptome visualization of tumor microenvironment. Nucleic Acids Res. 2020, 49, D1420–D1430. [Google Scholar] [CrossRef]
  55. Neal, J.T.; Li, X.; Zhu, J.; Giangarra, V.; Grzeskowiak, C.L.; Ju, J.; Liu, I.H.; Chiou, S.-H.; Salahudeen, A.A.; Smith, A.R.; et al. Organoid Modeling of the Tumor Immune Microenvironment. Cell 2018, 175, 1972–1988.e16. [Google Scholar] [CrossRef] [Green Version]
  56. Wu, T.D.; Madireddi, S.; de Almeida, P.E.; Banchereau, R.; Chen, Y.-J.J.; Chitre, A.S.; Chiang, E.Y.; Iftikhar, H.; O’Gorman, W.E.; Au-Yeung, A.; et al. Peripheral T cell expansion predicts tumour infiltration and clinical response. Nature 2020, 579, 274–278. [Google Scholar] [CrossRef]
  57. Liu, Z.; Liu, C.; Xiao, M.; Han, Y.; Zhang, S.; Xu, B. Bioinformatics Analysis of the Prognostic and Biological Significance of ZDHHC-Protein Acyltransferases in Kidney Renal Clear Cell Carcinoma. Front. Oncol. 2020, 10, 565414. [Google Scholar] [CrossRef]
  58. Ghatalia, P.; Gordetsky, J.; Kuo, F.; Dulaimi, E.; Cai, K.Q.; Devarajan, K.; Bae, S.; Naik, G.; Chan, T.A.; Uzzo, R.; et al. Prognostic impact of immune gene expression signature and tumor infiltrating immune cells in localized clear cell renal cell carcinoma. J. Immunother. Cancer 2019, 7, 139. [Google Scholar] [CrossRef] [Green Version]
  59. Thorsson, V.; Gibbs, D.L.; Brown, S.D.; Wolf, D.; Bortone, D.S.; Ou Yang, T.-H.; Porta-Pardo, E.; Gao, G.F.; Plaisier, C.L.; Eddy, J.A.; et al. The Immune Landscape of Cancer. Immunity 2018, 48, 812–830.e14. [Google Scholar] [CrossRef] [Green Version]
  60. Lane, A.N.; Fan, T.W.-M. Regulation of mammalian nucleotide metabolism and biosynthesis. Nucleic Acids Res. 2015, 43, 2466–2485. [Google Scholar] [CrossRef] [Green Version]
  61. Meléndez-Rodríguez, F.; Urrutia, A.A.; Lorendeau, D.; Rinaldi, G.; Roche, O.; Böğürcü-Seidel, N.; Muelas, M.O.; Ciller, C.M.; Turiel, G.; Bouthelier, A.; et al. HIF1α Suppresses Tumor Cell Proliferation through Inhibition of Aspartate Biosynthesis. Cell Rep. 2019, 26, 2257–2265.e4. [Google Scholar] [CrossRef] [Green Version]
  62. Sullivan, L.B.; Gui, D.Y.; Hosios, A.M.; Bush, L.N.; Freinkman, E.; Vander Heiden, M.G. Supporting Aspartate Biosynthesis Is an Essential Function of Respiration in Proliferating Cells. Cell 2015, 162, 552–563. [Google Scholar] [CrossRef] [Green Version]
  63. Lieu, E.L.; Nguyen, T.; Rhyne, S.; Kim, J. Amino acids in cancer. Exp. Mol. Med. 2020, 52, 15–30. [Google Scholar] [CrossRef]
  64. Zhao, Y.; Zhang, J.; Wang, S.; Jiang, Q.; Xu, K. Identification and Validation of a Nine-Gene Amino Acid Metabolism-Related Risk Signature in HCC. Front. Cell Dev. Biol. 2021, 9, 731790. [Google Scholar] [CrossRef]
  65. Hakimi, A.A.; Reznik, E.; Lee, C.-H.; Creighton, C.J.; Brannon, A.R.; Luna, A.; Aksoy, B.A.; Liu, E.M.; Shen, R.; Lee, W.; et al. An Integrated Metabolic Atlas of Clear Cell Renal Cell Carcinoma. Cancer Cell 2016, 29, 104–116. [Google Scholar] [CrossRef] [Green Version]
  66. Shroff, E.H.; Eberlin, L.S.; Dang, V.M.; Gouw, A.M.; Gabay, M.; Adam, S.J.; Bellovin, D.I.; Tran, P.T.; Philbrick, W.M.; Garcia-Ocana, A.; et al. MYC oncogene overexpression drives renal cell carcinoma in a mouse model through glutamine metabolism. Proc. Natl. Acad. Sci. USA 2015, 112, 6539–6544. [Google Scholar] [CrossRef] [Green Version]
  67. Sharma, S.; Kelly, T.K.; Jones, P.A. Epigenetics in cancer. Carcinogenesis 2010, 31, 27–36. [Google Scholar] [CrossRef]
  68. Sandoval, J.; Esteller, M. Cancer epigenomics: Beyond genomics. Curr. Opin. Genet. Dev. 2012, 22, 50–55. [Google Scholar] [CrossRef]
  69. Das, P.M.; Singal, R. DNA methylation and cancer. J. Clin. Oncol. Off. J. Am. Soc. Clin. Oncol. 2004, 22, 4632–4642. [Google Scholar] [CrossRef] [Green Version]
  70. Lasseigne, B.N.; Brooks, J.D. The Role of DNA Methylation in Renal Cell Carcinoma. Mol. Diagn. Ther. 2018, 22, 431–442. [Google Scholar] [CrossRef]
  71. Mehdi, A.; Riazalhosseini, Y. Epigenome Aberrations: Emerging Driving Factors of the Clear Cell Renal Cell Carcinoma. Int. J. Mol. Sci. 2017, 18, 1774. [Google Scholar] [CrossRef] [PubMed] [Green Version]
  72. Cancer Genome Atlas Research, N. Comprehensive molecular characterization of clear cell renal cell carcinoma. Nature 2013, 499, 43–49. [Google Scholar] [CrossRef] [Green Version]
  73. Borcherding, N.; Vishwakarma, A.; Voigt, A.P.; Bellizzi, A.; Kaplan, J.; Nepple, K.; Salem, A.K.; Jenkins, R.W.; Zakharia, Y.; Zhang, W. Mapping the immune environment in clear cell renal carcinoma by single-cell genomics. Commun. Biol. 2021, 4, 122. [Google Scholar] [CrossRef] [PubMed]
  74. Wang, Q.; Hu, J.; Kang, W.; Wang, J.; Xiang, Y.; Fu, M.; Gao, H.; Huang, Z. Tumor microenvironment immune subtypes for classification of novel clear cell renal cell carcinoma profiles with prognostic and therapeutic implications. Medicine 2021, 100, e24949. [Google Scholar] [CrossRef] [PubMed]
  75. Nakano, O.; Sato, M.; Naito, Y.; Suzuki, K.; Orikasa, S.; Aizawa, M.; Suzuki, Y.; Shintaku, I.; Nagura, H.; Ohtani, H. Proliferative activity of intratumoral CD8(+) T-lymphocytes as a prognostic factor in human renal cell carcinoma: Clinicopathologic demonstration of antitumor immunity. Cancer Res. 2001, 61, 5132–5136. [Google Scholar] [PubMed]
  76. Qi, Y.; Xia, Y.; Lin, Z.; Qu, Y.; Qi, Y.; Chen, Y.; Zhou, Q.; Zeng, H.; Wang, J.; Chang, Y.; et al. Tumor-infiltrating CD39+CD8+ T cells determine poor prognosis and immune evasion in clear cell renal cell carcinoma patients. Cancer Immunol. Immunother. 2020, 69, 1565–1576. [Google Scholar] [CrossRef] [PubMed]
  77. Giraldo, N.; Becht, E.; Pagès, F.; Skliris, G.P.; Verkarre, V.; Vano, Y.A.; Mejean, A.; Saint-Aubert, N.; Lacroix, L.; Natario, I.; et al. Orchestration and Prognostic Significance of Immune Checkpoints in the Microenvironment of Primary and Metastatic Renal Cell Cancer. Clin. Cancer Res. 2015, 21, 3031–3040. [Google Scholar] [CrossRef] [PubMed] [Green Version]
  78. Choi, E.; Whiteman, K.; Pai, T.; Hickman, T.; Johnson, T.; Friedman, T.; Parikh, A.; Gilbert, M.; Shen, B.; Weiss, G.J.; et al. Abstract 2184: BOXR1030: A first-in-class CAR T-cell therapy co-expressing GOT2 enhances T-cell metabolic function for the treatment of GPC3-positive solid tumors. Immunology 2020, 80, 2184. [Google Scholar] [CrossRef]
Figure 1. GOT2 expression levels in pan-cancer (TCGA dataset). The box plot comparing specific GOT2 expression in tumor samples (red plot) and paired normal tissues (blue plot) was derived from the TIMER database (* p < 0.05, ** p < 0.01, *** p < 0.001). TPM: transcripts per million.
Cimb 44 00169 g001
Figure 2. Expression of GOT2 in KIRC and normal patients. (A) Differential expression of GOT2 between KIRC samples from TCGA database (Red, n = 523 samples) and normal human kidney samples from GTEx database (Blue, n = 100 samples). (* p < 0.05, *** p < 0.001) (B) Significant downregulation of GOT2 protein level in the CPTAC KIRC cohort, analyzed by UALCAN. KIRC: n = 110; Normal samples: n = 84. Z-values represent standard deviations from the median across samples. (C) Representative images of immunohistochemical (IHC) staining of GOT2 protein in normal kidney tissue (Patient ID: 2067; Staining: medium; Intensity: moderate; Quantity: 75–25%; Location: cytoplasmic/membranous) and KIRC tissue (Patient ID: 2176; Staining: low; Intensity: weak; Quantity: >75%; Location: cytoplasmic/membranous) from the HPA database. Scale bars: left, 100 μm; right, 25 μm. Antibody used in both samples: HPA018139.
Cimb 44 00169 g002
Figure 3. Association between GOT2 expression and the clinicopathological features of KIRC patients. Box plots of GOT2 mRNA expression according to: (A) KIRC stages (Stages 1, 2, 3 and 4). (B) gender (male, female). (C) KIRC grades (1, 2, 3 and 4). (D) clear cell renal cell carcinoma (ccRCC) good risk (ccA) and poor risk (ccB) subtype classification. (E) nodal metastasis status. GOT2 protein expression was differentially expressed in (F) clinical stages and (G) tumor grade ** p < 0.01, *** p < 0.001. GOT2 expression in the KIRC cohort (TCGA) according to (H) VHL mutation status, (I) PBRM1 mutation status and (J) SETD2 mutation status, ** p < 0.01, *** p < 0.001.
Cimb 44 00169 g003
Figure 4. Kaplan–Meier survival analysis demonstrating the relationship between GOT2 expression and prognosis in KIRC patients. Overexpression of GOT2 mRNA prolonged (A) OS (n = 258) and (B) DFS (Disease-Free Survival; n = 258) of KIRC patients. (C) High expression of GOT2 protein prolonged OS of KIRC patients (n = 528) (p = 0.023). HR, hazard ratio; OS, overall survival; GOT2, Glutamic-Oxaloacetic Transaminase 2; KIRC, Kidney Renal Clear Cell Carcinoma.
Cimb 44 00169 g004
Figure 5. Chromosomal distribution of the methylation probes associated with GOT2. Upper panel: Circos plot depicting the genomic information of GOT2 (16q21) and the probes used in this study. Lower panel: Segment plot showing the detailed information of genomic locations of each probe of GOT2, highlighting CpG island, N shelf, S Shore and Open Sea. The coverage of the promoter region is displayed as the red region (red box), which includes eight probes (cg08348831, cg13626907, cg14863484, cg09082840, cg16406345, cg08578141, cg10055227 and cg08950929). Numbers below represent the genomic length scale (1 kb).
Cimb 44 00169 g005
Figure 6. Dynamics of DNA methylation across all probes of GOT2 in KIRC. Heat map showing the methylation levels of GOT2 among different CpGs sites (probes) integrating ethnicity, race, age, vital status, and genomic regions of CpG sites (UCSC) from KIRC. Red to blue scale indicates high to low methylation levels.
Cimb 44 00169 g006
Figure 7. Hypermethylation of GOT2 leads to downregulated expression in KIRC. (A) Differential methylation level of eighth GOT2 probes (cg08348831, cg13626907, cg14863484, cg09082840, cg16406345, cg08578141, cg10055227 and cg08950929) between KIRC patients (n = 313) and normal samples (n = 157) from TCGA. (B) Spearman’s correlation between methylation level (β-values, 450 k array) and mRNA level (Log2-scaled, TPM + 1) of GOT2 in KIRC samples from TCGA.
Cimb 44 00169 g007
Figure 8. Association of GOT2 expression, with immune subtypes and immune cell infiltration. (A) GOT2 mRNA levels in TCGA-KIRC immune subtypes. C1: wound healing subtype (n = 7), C2: INF-γ dominant (n = 20), C3: inflammatory (n = 445), C4: lymphocyte depleted (n = 27), C5: immunologically quiet (n = 3), C6: TGF-ꞵ dominant (n = 16). One-way ANOVA p-value = 1.2 × 10⁻⁴. (B) GOT2 expression in different immune cells types in KIRC samples from TCGA and normal samples from TCGA and GTEx.
Cimb 44 00169 g008
Figure 9. Expression of GOT2 in scRNA-seq landscapes. (A) Heatmap of GOT2 expression displayed heterogeneity in different clusters of cells in KIRC_GSE111360 [55] and KIRC_GSE139555 datasets [56]. (B) Expression of GOT2 in GSE111360 (upper panel) and in GSE139555 (lower panel) datasets after Uniform Manifold Approximation and Projection (UMAP) processing. Violin diagrams depict the GOT2 expression in different immune cells across each dataset analyzed.
Cimb 44 00169 g009
Figure 10. The expression source of the signature genes was revealed by single-cell analysis (GSE111360 dataset). The signature was composed of GOT2, LAG3, CTLA4, EOMES, LGALS9, CD96, HAVCR2, PDCD1, TIGIT, and TOX.
Cimb 44 00169 g010
Table 1. Correlation of GOT2 mRNA expression and clinical outcomes in KIRC from TCGA database.
Clinicopathological CharacteristicsnHazard Ratio (95% CI)Logrank p
Stage
12651.67 (0.92–3.03)8.94 × 10⁻²
2570.29 (0.06–1.31)8.56 × 10⁻²
31230.35 (0.74–2.39)3.47 × 10⁻¹
4820.56 (0.32–0.97)3.50× 10⁻²
Gender
Female1860.62 (0.36–1.05)7.45 × 10⁻²
Male3440.71 (0.47–1.06)9.56 × 10⁻²
Grade
114--
22271.51 (0.8–2.84)2.04 × 10⁻¹
32060.53 (0.33–0.85)7.90 ×10⁻³
4750.64 (0.35–1.19)1.60 × 10⁻¹
Mutation burden
High1681.34 (0.77–2.34)2.94 × 10⁻¹
Low1642.28 (1.04–4.99)3.49× 10⁻²
Race
White4590.72 (0.5–1.02)6.17× 10⁻²
Asian8--
Black/African American560.39 (0.12–1.29)1.10 × 10⁻¹
Hemoglobin result
Elevated51.73 (0.1076–27.8905)6.98 × 10⁻¹
Normal1840.70 (0.3784–1.3129)2.70 × 10⁻¹
Low2611.22 (0.8484–1.7628)2.81 × 10⁻¹
Laterality
Right2801.12 (0.7181–1.7561)6.11 × 10⁻¹
Left2480.71 (0.4721–1.0682)1.00 × 10⁻¹
Bilateral4--
Serum calcium result
Elevated100.65 (0.1599–2.6446)5.48 × 10⁻¹
Low2030.79 (0.5749–1.5257)7.92 × 10⁻¹
Normal1500.62 (0.376–1.0547)7.88 × 10⁻²
Bold numbers indicate a statistically significant correlation with a p-value less than 0.05. Abbreviations: CI = confidence interval.
Table 2. List of the 17 probes analyzed. CGI: CpG islands.
ProbeChromosomeStartEndCGI Position
cg04793118chr165870797458707975Open Sea
cg06070269chr165871823558718236Open Sea
cg06624121chr165871824758718248Open Sea
cg04471375chr165871826158718262Open Sea
cg06302295chr165873098258730983N Shelf
cg08348831chr165873395958733960Island
cg13626907chr165873396358733964Island
cg14863484chr165873410658734107Island
cg09082840chr165873426458734265Island
cg16406345chr165873435058734351Island
cg08578141chr165873436158734362Island
cg10055227chr165873441658734417Island
cg08950929chr165873442358734424Island
cg00028829chr165873450758734508S Shore
cg10140957chr165873457358734574S Shore
cg13883681chr165873466158734662S Shore
cg08987251chr165873520058735201S Shore
Publisher’s Note: MDPI stays neutral with regard to jurisdictional claims in published maps and institutional affiliations.

