Article

Curtobacterium spp. and Curtobacterium flaccumfaciens: Phylogeny, Genomics-Based Taxonomy, Pathogenicity, and Diagnostics

1
Shemyakin-Ovchinnikov Institute of Bioorganic Chemistry, Russian Academy of Sciences, Miklukho-Maklaya Str., 16/10, 117997 Moscow, Russia
2
Limnological Institute, Siberian Branch of Russian Academy of Sciences, Ulan-Batorskaya Str., 3, 664033 Irkutsk, Russia
3
Department of Plant Protection, Russian State Agrarian University—Moscow Timiryazev Agricultural Academy, Timiryazevskaya Str., 49, 127434 Moscow, Russia
4
Moscow Institute of Physics and Technology, Federal University, Institutskiy per., 9, 141701 Dolgoprudny, Moscow Oblast, Russia
5
Agrobiotechnology Department, Agrarian and Technological Institute, RUDN University, Miklukho-Maklaya Str., 6, 117198 Moscow, Russia
*
Authors to whom correspondence should be addressed.
Curr. Issues Mol. Biol. 2022, 44(2), 889-927; https://doi.org/10.3390/cimb44020060
Submission received: 6 December 2021 / Revised: 19 January 2022 / Accepted: 8 February 2022 / Published: 11 February 2022
(This article belongs to the Section Molecular Microbiology)

Abstract

:
The genus of Curtobacterium, belonging to the Microbacteriaceae family of the Actinomycetales order, includes economically significant pathogenic bacteria of soybeans and other agricultural crops. Thorough phylogenetic and full-genome analysis using the latest genomic data has demonstrated a complex and contradictory taxonomic picture within the group of organisms classified as the Curtobacterium species. Based on these data, it is possible to delineate about 50 new species and to reclassify a substantial part of the Curtobacterium strains. It is suggested that 53 strains, including most of the Curtobacterium flaccumfaciens pathovars, can compose a monophyletic group classified as C. flaccumfaciens. A genomic analysis using the most recent inventory of bacterial chromosomal and plasmid genomes deposited to GenBank confirmed the possible role of Microbacteriaceae plasmids in pathogenicity and demonstrated the existence of a group of related plasmids carrying virulence factors and possessing a gene distantly related to DNA polymerase found in bacteriophages and archaeal and eukaryotic viruses. A PCR diagnostic assay specific to the genus Curtobacterium was developed and tested. The presented results assist in the understanding of the evolutionary relations within the genus and can lay the foundation for further taxonomic updates.

1. Introduction

Since the definition of the genus Curtobacterium, in 1972 [1], the representatives of these microbacteria have been isolated from numerous plants and environmental samples. For a long time, the genus Curtobacterium comprised eight validated species, recently accompanied by a number of proposed species and unclassified strain groups. Phytopathogenic strains causing the wilting and rotting of various legumes (Fabaceae) and ornamental plants have been established as a separate species, C. flaccumfaciens, and further subdivided into several pathovars, depending on the host plants and physiological properties [2,3]. Meanwhile, most described Curtobacterium spp. are not known to cause any disease of plants from which they were primarily isolated [4]. Many strains have been isolated as endophytes in sugarcane [5], grapevines [6], maize [7], sorghum [8], tomatoes [9], coffee [10], black peppers [11], strawberries [12], citrus fruits [13], poplars [14] and eucalyptus [15] and have been found in oil brines [5] and marine sediments [7].
Therefore, the role of Curtobacterium spp. in plant pathogenesis worldwide and the links between genomic features and virulence with respect to plants used for taxonomic distribution need elaboration and revision.
It is difficult to unravel the structure of the complex genus Curtobacterium using data acquired from previous taxonomic studies. Polyphasic studies largely depend on the 16S rRNA gene [16], but despite their usefulness for resolving taxonomic questions in the past, one or a few household genes contain only a limited number of informative characteristics and, thus, can yield phylogenetic trees that lack the resolution to distinguish between closely related species [17]. Classifications based on whole-genome sequences and associated bioinformatic tools provide a significant change in the reliability of phylogenomic trees [17].
New taxonomic technologies often raise the question as to whether discrepancies associated with earlier phylogenetic structures were caused by conflicts between the phenotype, single genes or entire genomes or by data interpretation, such as those between the different algorithms of a taxonomic analysis [18]. In phylogenetic systematics, only monophyletic taxa can be accepted in taxonomic classifications [19].
The present study was designed to provide an improved framework for the classification of the genus Curtobacterium based on the principles of phylogenetic systematics applied for genome comparison. A comprehensive sampling of publicly available whole-genome sequences of strains representing the genus Curtobacterium was used to construct genome-scale phylogenetic trees and to address the following questions:
(a)
Is there any conflict between the phylogenies calculated from whole-genome sequences and the current classification of the genus Curtobacterium?
(b)
Which species within the genus Curtobacterium need to be revised because they are evidently nonmonophyletic?
Another important question concerns the relatedness between the mechanisms of pathogenicity of curtobacteria and their taxonomy and phylogeny. The genomes of Curtobacterium plasmids have been shown to contain possible virulence genes, and the effect of mobile elements and gene exchange could reveal the ways of the emergence of pathogenic strains and pathovars [20,21,22,23]. In this study, Curtobacterium plasmids were studied in the context of the genomics of pathogenicity.
In addition, this research concerns the development of existing diagnostic methods to better correspond to the Curtobacterium taxonomy and genomic data. The abbreviations in the text below are as follows: C.Curtobacterium, C. f.Curtobacterium flaccumfaciens, C. fpfflaccumfaciens pv. flaccumfaciens and C. f. pv.—Curtobacterium flaccumfaciens pathovars.

2. Materials and Methods

2.1. Genomes’ Annotation and Comparison

Bacterial chromosomal and plasmid genomes were downloaded from the NCBI Genome database [24]. Chromosomal genomes were annotated with Prokka [25], using the default settings of Prodigal [26] for finding open reading frames (ORFs) and Barrnap [27] for rRNA gene detection. The plasmid genomes were annotated manually, using Geneiuos [28], Glimmer [29] and Prodigal [26] for ORF detection. Functional assignments of plasmid genes were made using a BLAST homology search [30] on the NCBI nr/nt database and custom databases using a HMM-HMM search with HHpred [31] and Phyre2 [32], and using an InterPro [33] search.
A genome sequence comparison and a visualisation of the annotated plasmid genomes were made with EasyFig [34], applying TBLASTX [30].

2.2. ANI Calculation and Clustering

The average nucleotide identity (ANI) was calculated using OrthoANIu [35]. The data obtained were clustered using the Phylogeny.fr server [36], applying the BIONJ algorithm [37] to the distance matrix. The BIONJ dendrogram was visualised using the iTol server [38].

2.3. Phylogenetic Analysis of rRNAs, Ribosomal Proteins, gyrB, parE, rpoA and rpoB

Genes sequences of the rRNAs, ribosomal proteins, gyrB, parE, rpoA and rpoB were extracted from the annotated genomes and aligned with MAFFT [39] with L-INS-i algorithms and other default settings. The concatenation of the sequences was carried out using Geneious tools [28]. Phylogenetic trees were constructed using maximum likelihood methods implemented in MEGA X [40] and RAxML [41] software packages, applying Tamura-Nei [42] and General Time Reversible (GTR) [43] nucleotide substitution models.

2.4. Phylogenetic Analysis of Core Genome

The core genes’ concatenated alignment was obtained with the Panaroo pipeline [44] using Prokka annotated genomes, (--core_threshold = 0.95 --aligner clustal) settings, and with other parameters set to default. Phylogenetic inference was performed by RAxML using the GTR-CAT nucleotide substitution model [41].

2.5. Protein Structure Modelling

Protein structure modelling was performed in two steps. First, the structure was predicted using AlphaFold 2.0 [45] with default settings, I-TASSER [46,47] with default settings, Phyre2 [32] in intensive modelling mode and Rosetta [48] using RoseTTAFold modelling mode [49]. The accuracy of prediction of the best-scoring models obtained by the methods listed above was estimated using ModFold8 [50], and the model with the highest global model quality score was used for the refinement of the structure using ReFOLD3 [51] in the next step. The quality of the prediction of the resulting structure was also estimated by ModFold8 [50]. Similar experimentally obtained structures were found by the HHpred [31], Phyre2 [32] and I-TASSER [47] servers. The superimposition and visualisation of the structures were achieved using PyMOL v.2 [52].

2.6. Primer Design

The phylogenetic analysis showed that the 23S rRNA sequence could be used to differentiate Curtobacterium from other genera with fairly good reliability. To develop primers, the 23S rRNA sequences of all the available Curtobacterium strains and a set of unrelated strains were aligned using MAFFT [39]. Then, following the alignment, a conserved and unique plot for Curtobacterium was manually determined. Oligonucleotides for the amplification of this region were optimised using Primer3Plus [53].

2.7. Bacterial Strains and Growth Conditions

A total of 81 bacterial strains, listed in Table S1, were used in the research. Twenty-two strains were purchased from the All-Russian Collection of Microorganisms (Pushchino, Moscow Oblast, Russia). Another 23 strains were isolated from the affected plants using a semi-selective medium for the isolation of Curtobacterium [54]. The remaining strains were taken from the collection of phytopathogenic bacteria of the Laboratory of Molecular Bioengineering of the Institute of Bioorganic Chemistry of the Russian Academy of Sciences (Moscow, Russia), used in previous research [55,56].
Routine cultivation of the strains was carried out on YD medium (yeast extract—10 g/L, dextrose—20 g/L, and agar 15 g/L) at a temperature of 28 °C. Long-term storage of the strains was carried out at −80 °C in 30% glycerol.

2.8. DNA Isolation

A GeneJET Genomic DNA Purification Kit (Thermo Scientific, Waltham, MA, USA) was used to isolate genomic DNA following the manufacturer’s instructions. The concentration of purified DNA was measured using a NanoProteometer N60 spectrophotometer (NanoProteometer, Munich, Germany). On average, the DNA amount in the samples was ~20 ng.

2.9. Polymerase Chain Reaction (PCR)

Conventional PCR was performed using a BioRad T100 ThermalCycler (Bio-Rad, Hercules, CA, USA) in a volume of 25 μL. Each reaction contained five μL of ScreenMix (Evrogen, Moscow, Russia), 0.3 mM of each primer, and 20 ng of template DNA.
The thermal cycling mode was 94 °C for 300 s, followed by 30 cycles of 94 °C for 30 s, 65 °C for 10 s, and 72 °C for 20 s, with a circuit extension at 72 °C for 5 min. PCR products were visualised by electrophoresis (1.5% agarose gel with the addition of ethidium bromide and 1× TAE buffer). A 1-kb ladder length marker (Evrogen) was used to determine the size of the DNA fragments.

2.10. Test Plasmid Construction

To construct a test plasmid, the target sequence was first amplified in the Cff VKM Ac-1923 (← DSM 20129) strain. After the resulting PCR, the product was purified using the Qiagen MinElute PCR Purification kit (Qiagen, Dusseldorf, Germany) and ligated into the pDrive vector (Qiagen) using the Qiagen PCR Cloning kit. The correctness of the insertion was checked using Sanger sequencing.

2.11. qPCR Conditions

PCR was performed in a final volume of 10 μL. The reaction mixture included 2 μL of Evrogen qPCRmix-HS SYBR, 0.3 mM of each primer, and 20 ng of template DNA. The final concentration of dNTP was 0.12 mM, and the concentration of magnesium was 3 mM. Thermal cycling was performed on a LightCycler 96 (Roche, Basel, Switzerland) in the following mode: 94 °C for 300 s, then 45 cycles of 94 °C for 10 s, 65 °C for 10 s, and 72 °C for 10 s. All experiments were carried out in duplicate per run and repeated twice. Thus, there were four technical replicates. The processing of the amplification curves and calculation of the threshold cycles were carried out using Roche software. Reactions with water were used as a negative control and with a test plasmid as a positive control.
For the experiment to determine the detection sensitivity, tenfold dilutions of the test plasmid and genomic DNA Ac-1923 (← DSM 20129) were prepared. PCR was performed with each dilution in the same way as described above.

3. Results

3.1. Curtobacterium Genomes in GenBank Database, Mislabelled Strains, and Curtobacterium flaccumfaciens Pathogenic Strains

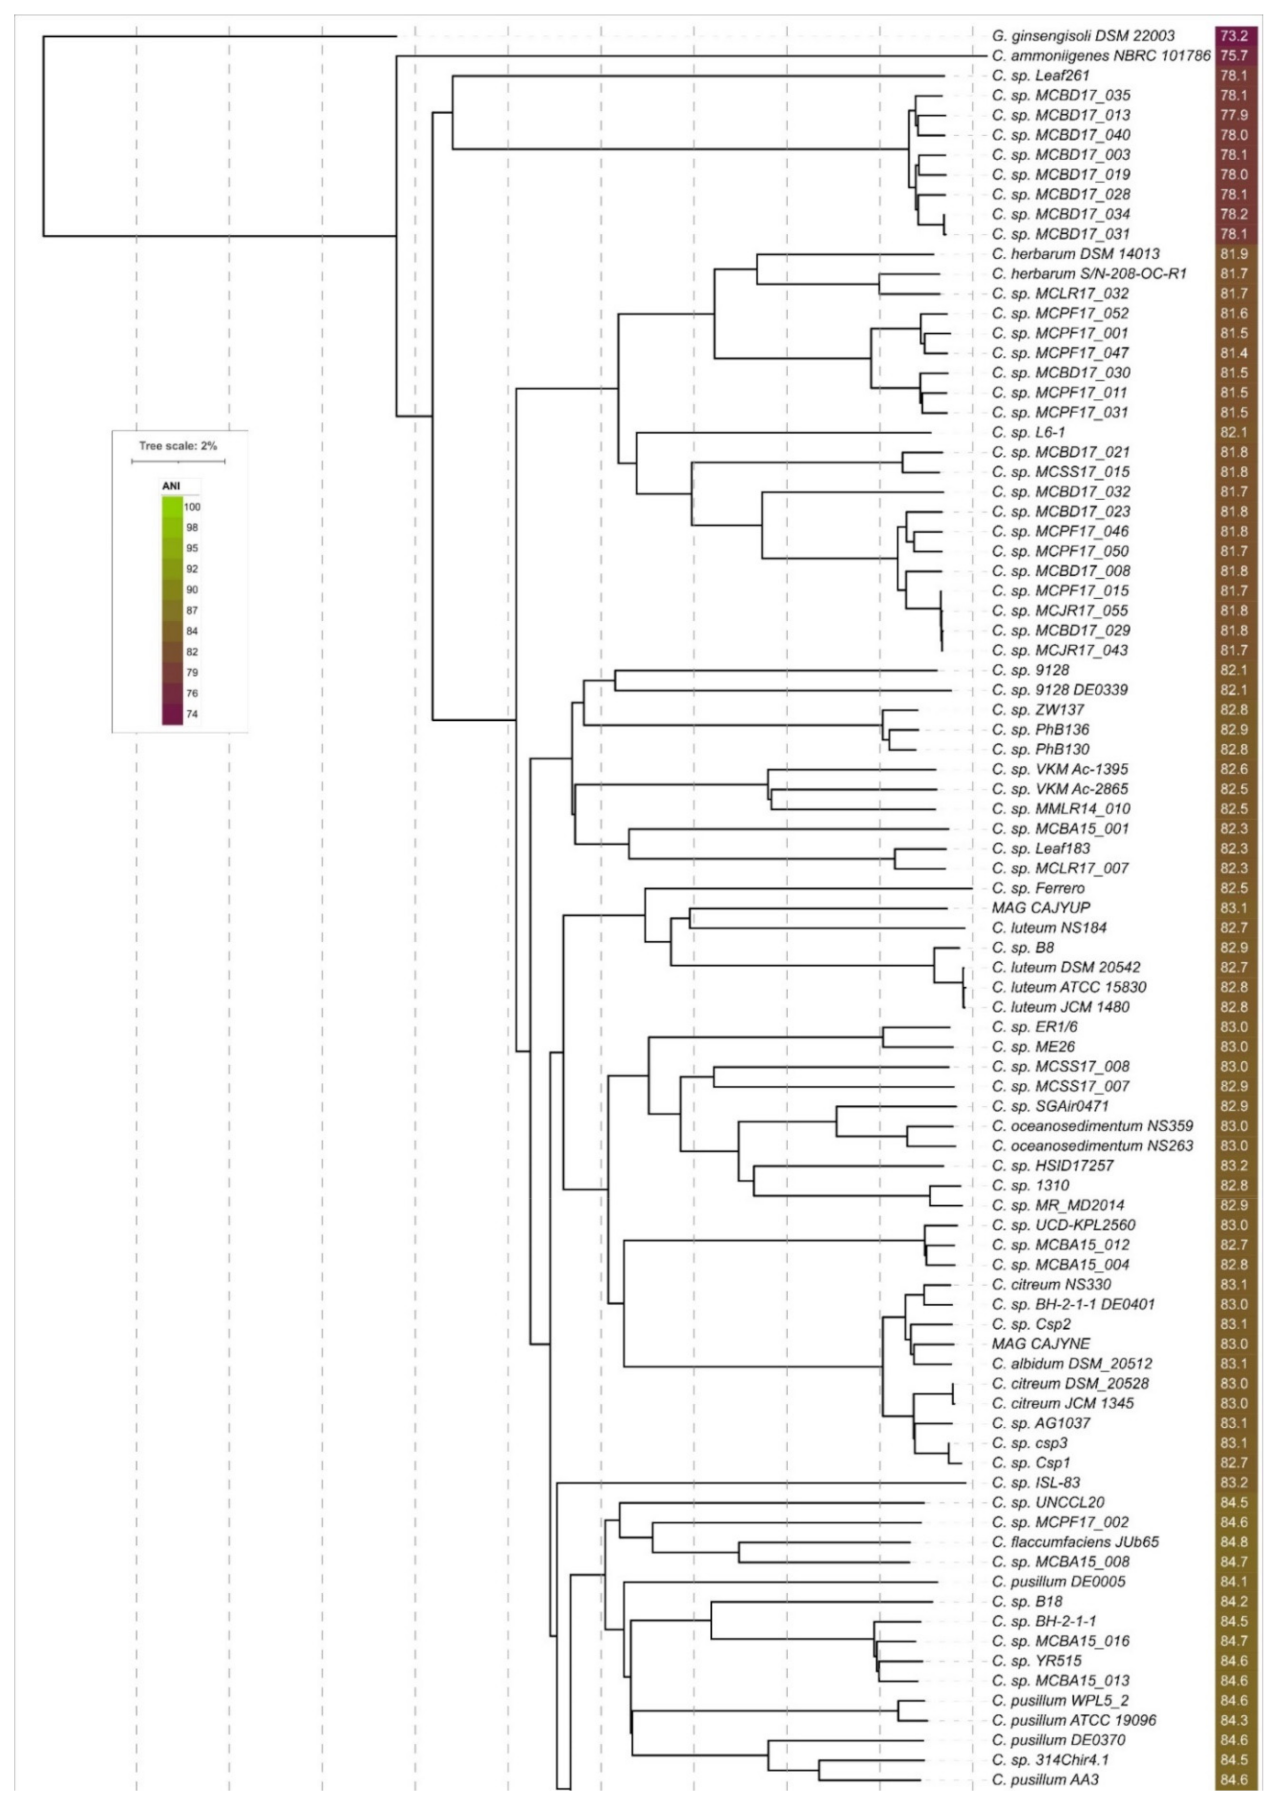
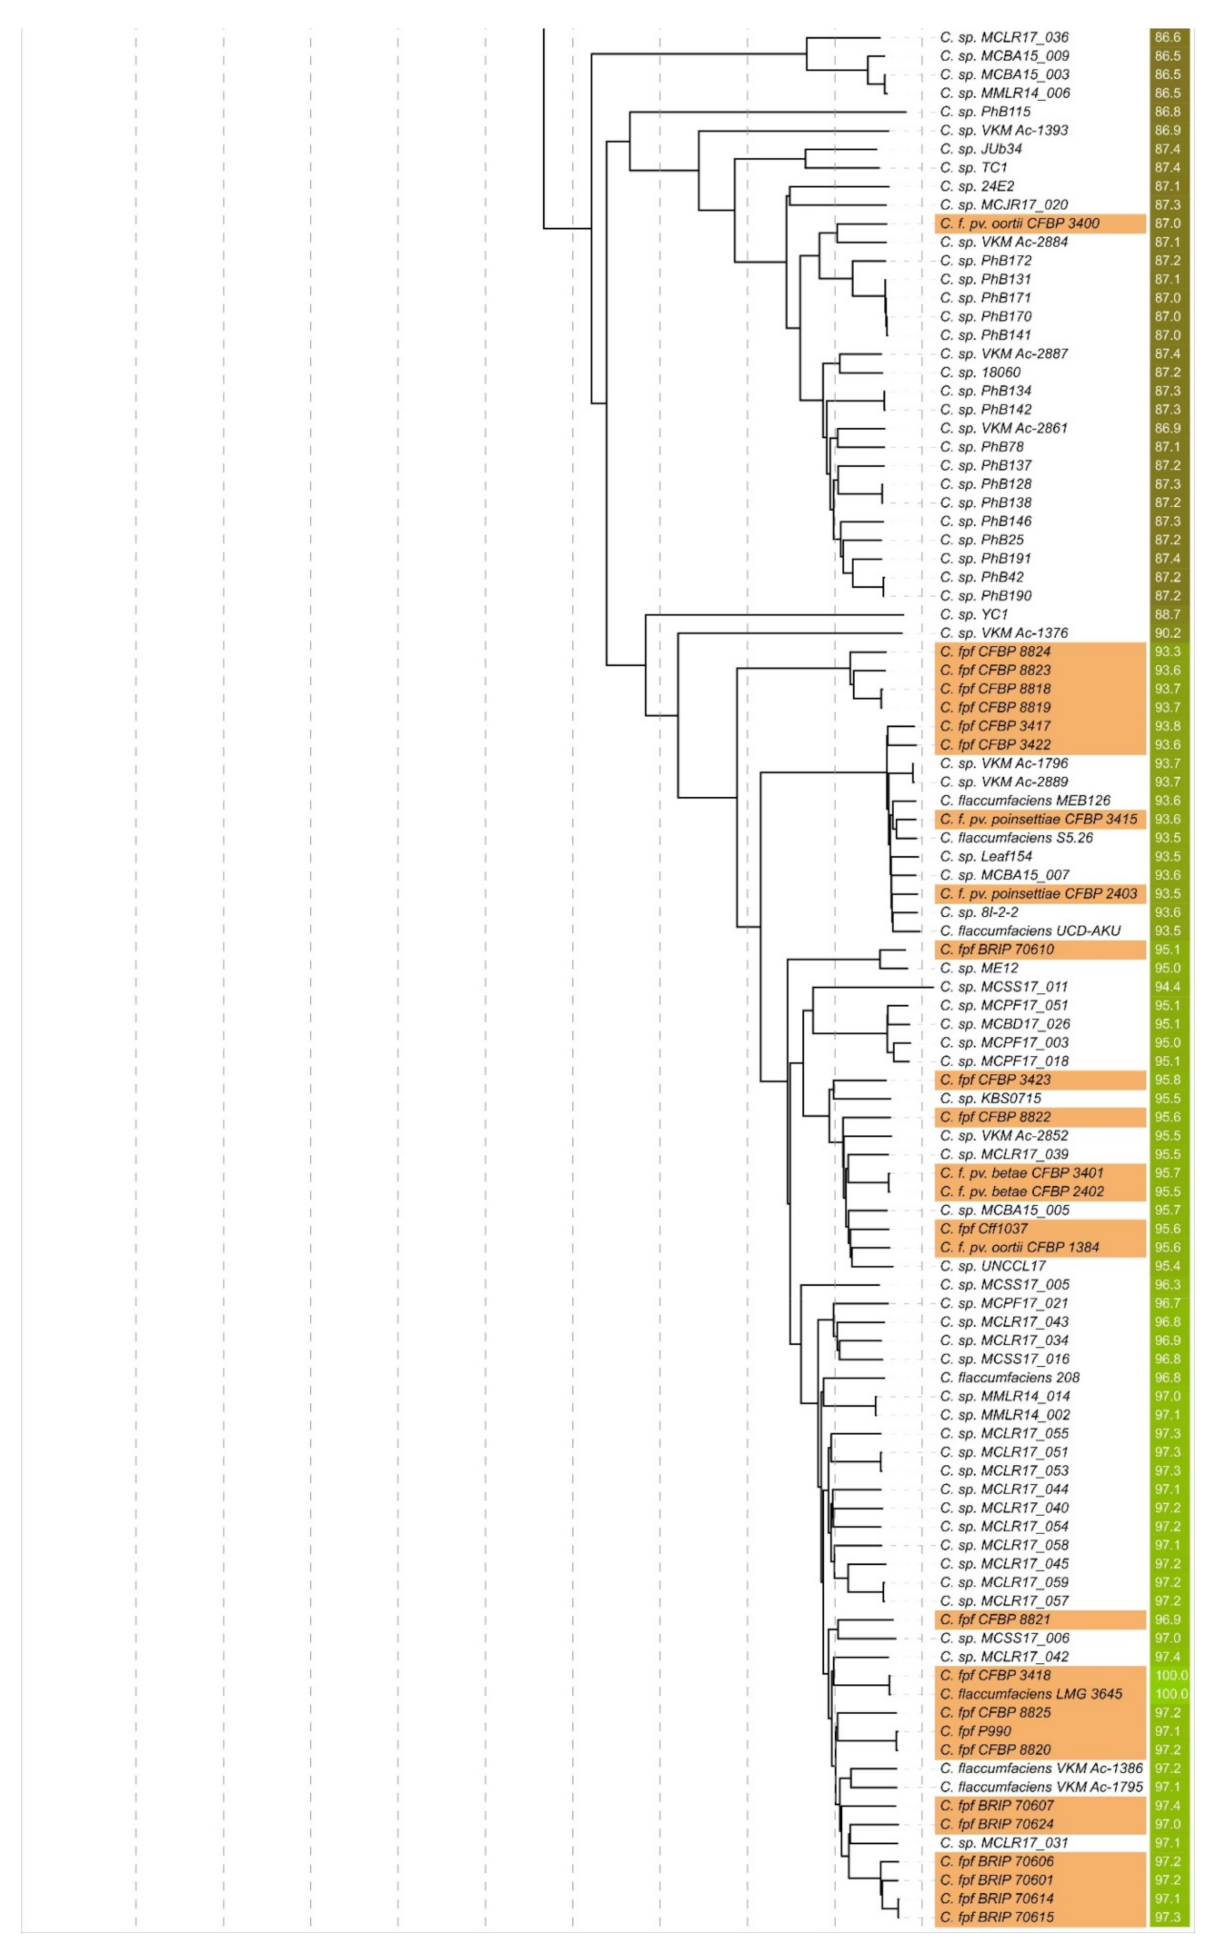
As of October 2021, the NCBI Genome database [24] contained drafts and complete genomes of 191 strains attributed as Curtobacterium, including two metagenome assemblies. Most of the strains were unclassified on the species level; 35 strains were classified as Curtobacterium flaccumfaciens, including 27 pathovars; and seven strains were classified as representatives of seven other Curtobacterium species (C. albidum, C. ammoniigenes, C. citreum, C. herbarum, C. luteum, C. oceanosedimentum, and C. pusillum). The preliminary analysis demonstrated that one of these strains, Curtobacterium S6, had the lowest average nucleotide identity (ANI) value, i.e., about 69% of all the other Curtobacterium strains. The phylogenetic analysis using 16S rRNA and 23S rRNA sequences of the closest homologues belonging to different Microbacteriaceae genera placed strain S6-1 distantly from the Curtobacterium clade (data not shown). Seemingly, this strain has been misclassified and might possibly represent a novel genus. Thus, only 190 genomes can be considered as Curtobacterium spp. (Figure 1).
It is difficult to estimate the number of C. flaccumfaciens pathogenic strains deposited in the genome database confidently, since the majority of the deposited strains have not been tested in biological experiments. However, the data available in the literature makes it possible to distinguish at least 28 pathogenic strains (Table 1).

3.2. ANI Analysis

Although the current taxonomy still relies on the classification system designed by Carolus Linnaeus, the use of criteria such as the genome index of the average nucleotide identity (ANI) can assist taxonomy [57,58,59]. The proposed minimal standards [60] and the regular practice of species delineation include ANI calculations and a multilocus phylogenetic analysis (MLPA). These standards apply to the ANI cut-off score of >95%, which indicates that strains belong to the same species [61,62,63]. The ANI data correlate well with DNA–DNA hybridisation results, and the recommended cut-off point of 70% DDH for species demarcation corresponds to 95% ANI [64,65]. A number of software packages can be used for calculations of ANI, including orthoANIu [35], Jspecies [65], ANI calculator [66], FastANI [62] and Gegenees [67]. Calculations with different packages can yield slightly different results [61].
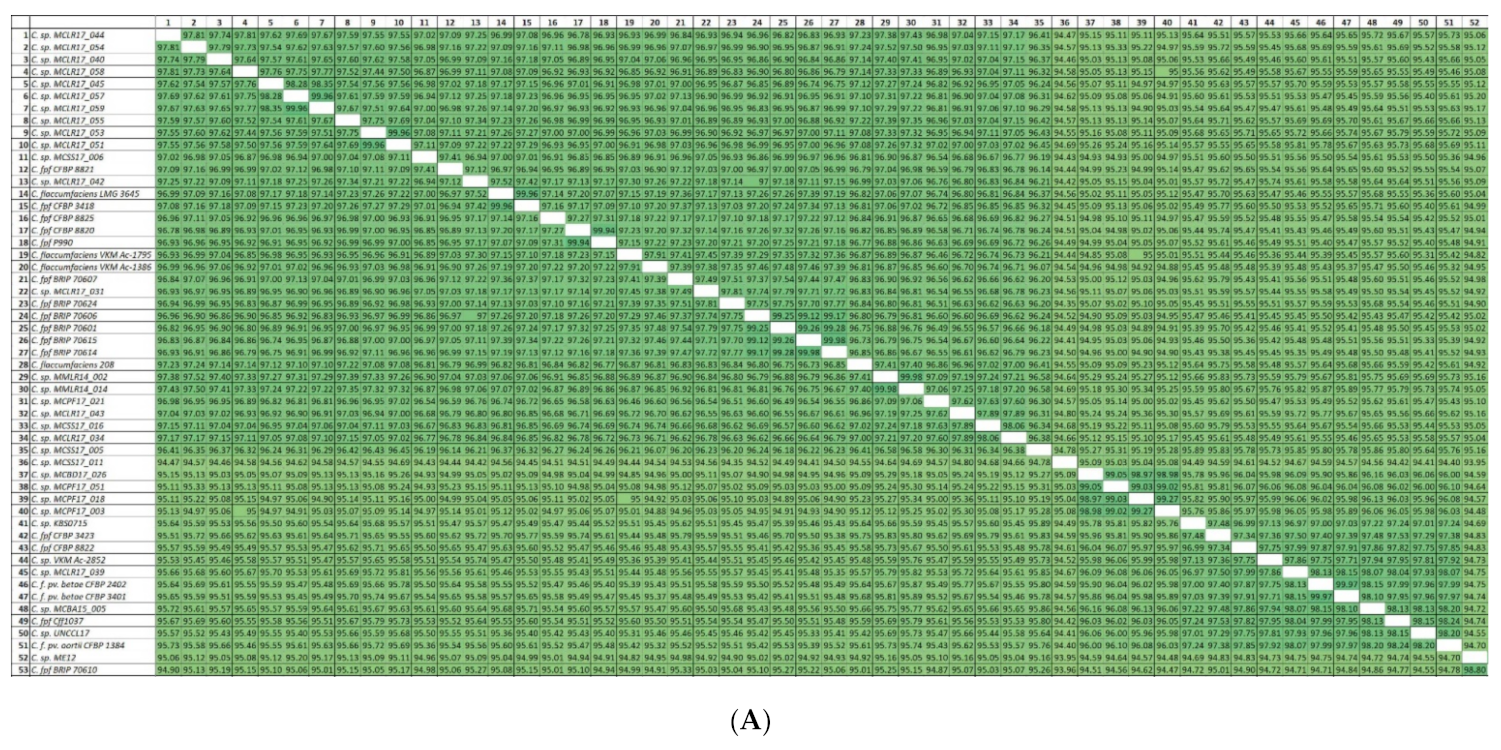
In this study, the orthoANIu pipeline was used for the assessment of ANI. The advantage of orthoANIu is fast and accurate calculations due to the employment of the Usearch tool [68]. ANI values have been calculated for all 190 Curtobacterium genomes (Supplementary Figure S2) and used for BIONJ clustering (Figure 2). The dendrogram places most C. flaccumfaciens strains, including the type strains C. fpf CFBP 3418 and C. f. LMG 3645 and other strains with confirmed pathogenicity, into a distinct clade containing 69 strains with an ANI value above 92.5% compared to C. flaccumfaciens-type strains. The strain labelled as C. f. pv. oortii CFBP 3400, however, was placed in other clades distant from the other C. flaccumfaciens strains. These results indicate that the results of whole-genome based calculations do not match the present taxonomic classification of C. flaccumfaciens strains.
Interestingly, the ANI value of C. ammoniigenes NBRC 101786, compared to other Curtobacterium strains (75–76%, Supplementary Figure S1), was almost as low as the ANI value of Gryllotalpicola ginnsengisoli DSM 22003 (72–74%). According to the analysis of 3500 genomes representing type strains of species from >850 bacterial or archaeal genera [69], the ANI values of the prokaryotic genus demarcation boundaries have a mean of 73.98% (25% quartile, 70.85%; 75% quartile, 76.56%).

3.3. 16 S, 23S, and Concatenated Ribosomal RNA Genes Phylogeny

Genomic loci encoding ribosomal RNAs are often used for evolutionary phylogenetic analysis and species delineation [70,71,72]. As well as in other bacteria [73], the 16S rRNA and 23S rRNA genes of Curtobacterium are located in one operon, together with 5S rRNA, and are separated by internal transcribed spacer (ITS) regions. The majority of 16 complete Curtobacterium genomes contain three rRNA operons, and several complete genomes contain four copies of rRNA operons. In the latter case, two operons are located next to each other and are separated by the 1300–2200 base pairs (bp) region and are located in one direction. The average length of Curtobacterium 16S rRNA is about 1530 bases, and the average length of 23S rRNA is about 3120 nucleotides.
The copies of rRNA genes belonging to the same genome are often not identical. To conduct the phylogenetic analysis, the rRNA gene, which has an identical copy (copies), was chosen. If all the sequences were different and shared the same, or the adjacent, clade, the sequences with the least sum of branch lengths to the root of draft trees were chosen for the final tree.
The 16S sequence of C. fpf CFBP 3423 was found to be identical to Moraxella osloensis YV1 16S rRNA, which could have been the result of sample contamination and assembly error. Furthermore, this gene was not located in a common operon, together with the 23S and 5S rRNA genes. One of the 23S sequences of C. sp. HSID17257 was 100% identical to a Cryptococcus neoformans complex 25S rRNA and showed a high level of similarity with rRNA genes found in plasmids (Actinomyces oris strain FDAARGOS_1051 plasmid unnamed, Enterobacter sp. T2 plasmid unnamed, and Acinetobacter baumannii VB2139 plasmid pVB2139_3) and several bacteria.
The results of phylogenetic analysis of 16S rRNA genes belonging to 185 Curtobacterium strains (Supplementary Figures S2 and S3) raised doubts as to the employment of 16S phylogeny for Curtobacterium species delineation. A 16S maximum likelihood phylogeny could not distinguish the clades of Curtobacterium strains reliably—the bootstrap supporting values were often significantly lower than 50%. The use of different phylogeny inferring methods and nucleotide substitution models (RAxML, MrBayes, MEGA, TN93, GTR, TN93 + G + I, GTR + G + I, etc.) did not improve the robustness of inference and resulted in a similar consensus tree topology. This can be due to the low difference between the 16S rRNA sequences—the pairwise identity (the percentage of pairwise residues that are identical in the alignment, including gap versus non-gap residues but excluding gap versus gap residues) of the 16S rRNA alignment was as high as 99.4%.
The phylogenetic analysis of 23S rRNA genes belonging to 178 Curtobacterium strains (Supplementary Figures S4 and S5) seems to have been more informative, due to a bigger difference between the sequences (the pairwise identity of the 23S rRNA alignment was as high as 96.8%). The supporting bootstrap values were higher than in the case of 16S trees, and the composition of the clades revealed was often similar to the composition of ANI clusters (Figure 2). It seems, however, that the 23S was not able to describe the entire complexity of taxonomic and evolutionary relations within the Curtobacterium genus. The concatenated 16S and 23S rRNA genes’ phylogeny (Supplementary Figures S6 and S7) did not provide any improvement compared to the phylogeny of the single genes.

3.4. gyrB, parE, rpoA, rpoB, and Concatenated Genes Phylogeny

Conservative genes coding for proteins, mainly related to DNA processing (i.e., replication and transcription) and their concatenation, can be efficiently used for high-resolution phylogenetic analysis [74,75,76,77,78,79]. In this study, the nucleotide sequences of the following genes and their concatenation were used: gyrase subunit B (gyrB), topoisomerase IV subunit B (parE) evolutionarily related to gyrase B, DNA-directed RNA polymerase subunit α (rpoA), and DNA-directed RNA polymerase subunit β (rpoB). All the genes were found in single copies in almost all genome assemblies.
The phylogenetic trees of all the genes listed above (Supplementary Figures S8–S15) featured the overall resolution and bootstrap supporting values that were significantly higher than those in the rRNA phylogenetic trees. The composition of the revealed clades was close to the corresponding clades of the ANI tree, supporting the suggestion of the rarity of horizontal exchange events associated with the genes analysed. The gene parE encoding topoisomerase IV subunit B demonstrated good phylogenetic potential resolving the tree topology slightly better, and with a little better bootstrap support, than the gyrB, rpoA, and rpoB analyses, presumably because of the greater divergence of parE. The pairwise identities of the alignments were 91.4% for gyrB (189 sequences), 89.2% for parE (189 sequences), 96.6% for rpoA (189 sequences), and 95.7% for rpoB (188 sequences). It appears that a low number of variable sites hampers the fidelity and informativeness of the phylogeny.
The multilocus phylogenetic analysis (MLPA) (Supplementary Figures S16 and S17) employed the concatenated alignments of gyrB, parE, rpoA, and rpoB and demonstrated a higher resolution and better bootstrap support than the single genes phylogenies and, moreover, the rRNA phylogenies. The topologies of the MLPA trees and the compositions of the clades supported with high bootstrap values were close to those of the ANI tree (Figure 2). This concatenated tree did not, however, properly resolve the branches that were close to the root of the tree.

3.5. Ribosomal Proteins Phylogeny

The phylogenetic analysis based on the amino acid and nucleic acid sequences of ribosomal proteins (r-proteins) was shown to contain a reliable phylogenetic signal at a wide range of taxonomic depths, which was not significantly affected by mutational saturation or lateral gene transfer [80,81,82,83]. The phylogenetic studies made it possible to efficiently reveal the evolutionary and taxonomic relations between both distant, and closely related, organisms [84,85,86,87].
In this research, the concatenated nucleotide sequences of r-proteins extracted from reannotated genomes were used. The list of r-proteins genes used for concatenation comprised 46 genes: rplA-rplF, rplI-rplP, rplR-rplY, rpmA, rpmB, rpmD, rpmE2, rpmG2, rpmH-rpmJ, rpsA-rpsD, rpsG-rpsO, rpsQ, rpsS, and rpsT. The total length of the concatenated alignment was 21,202 bases; the pairwise identity was 92.4%.
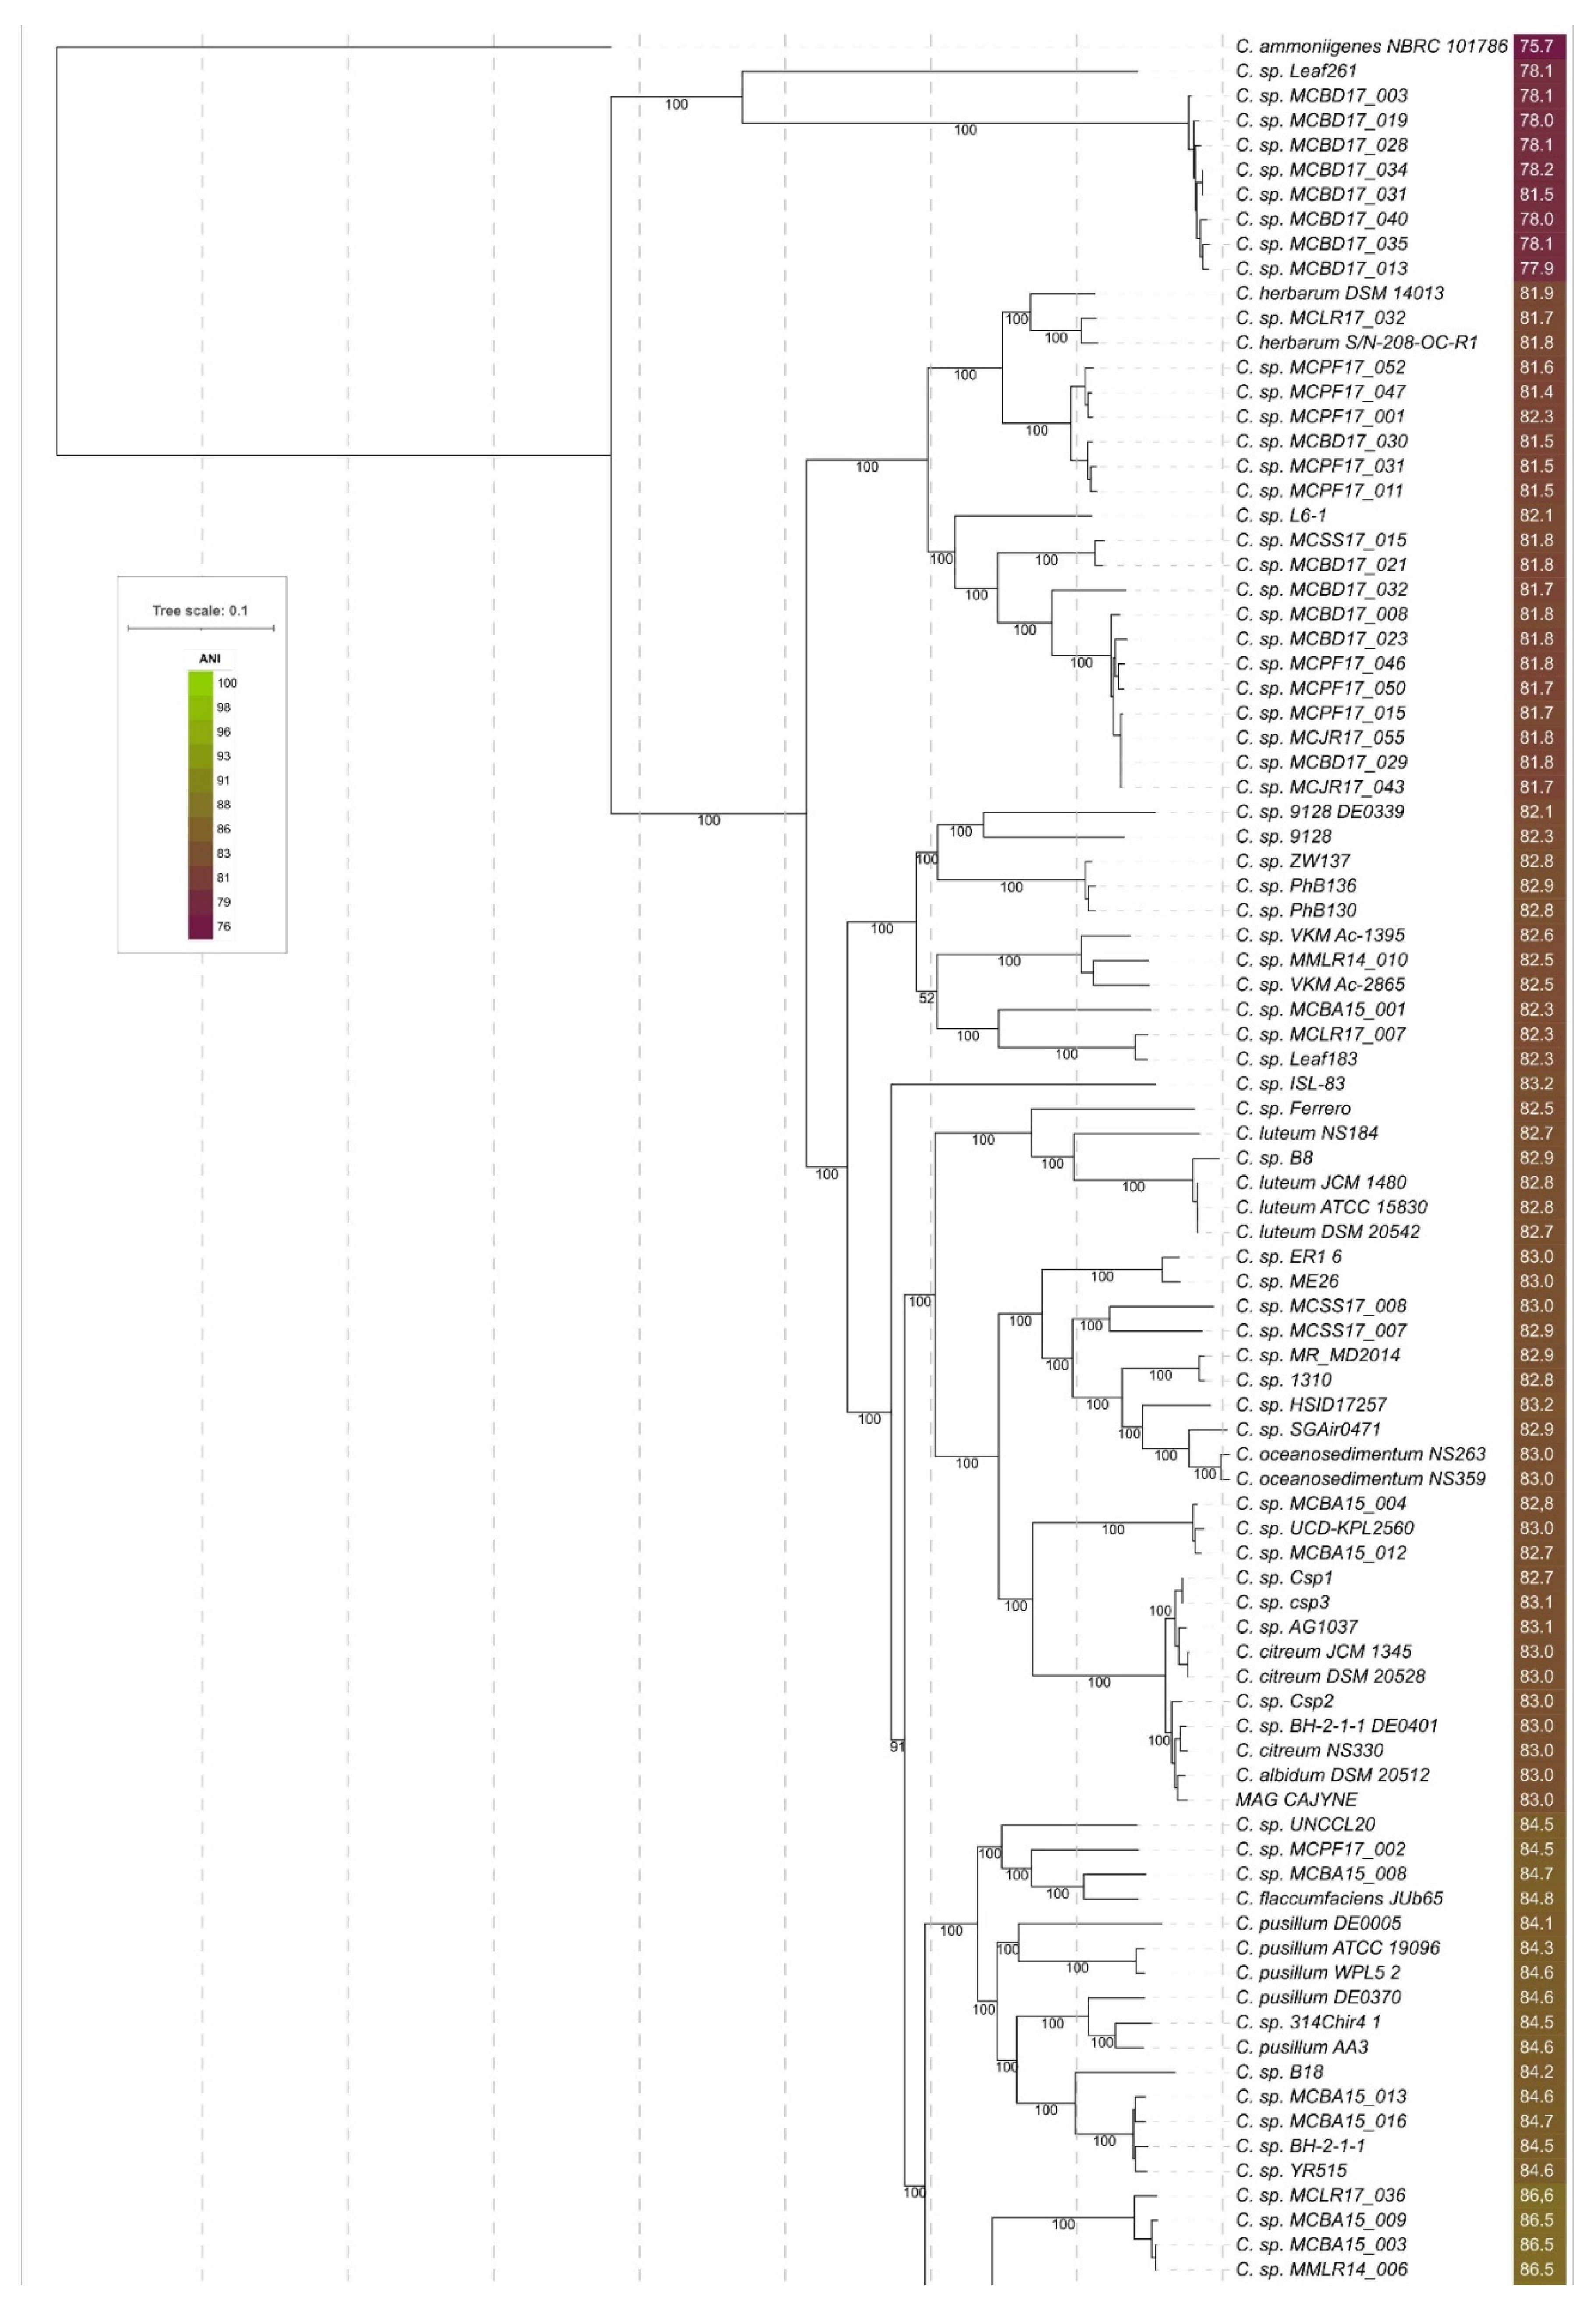
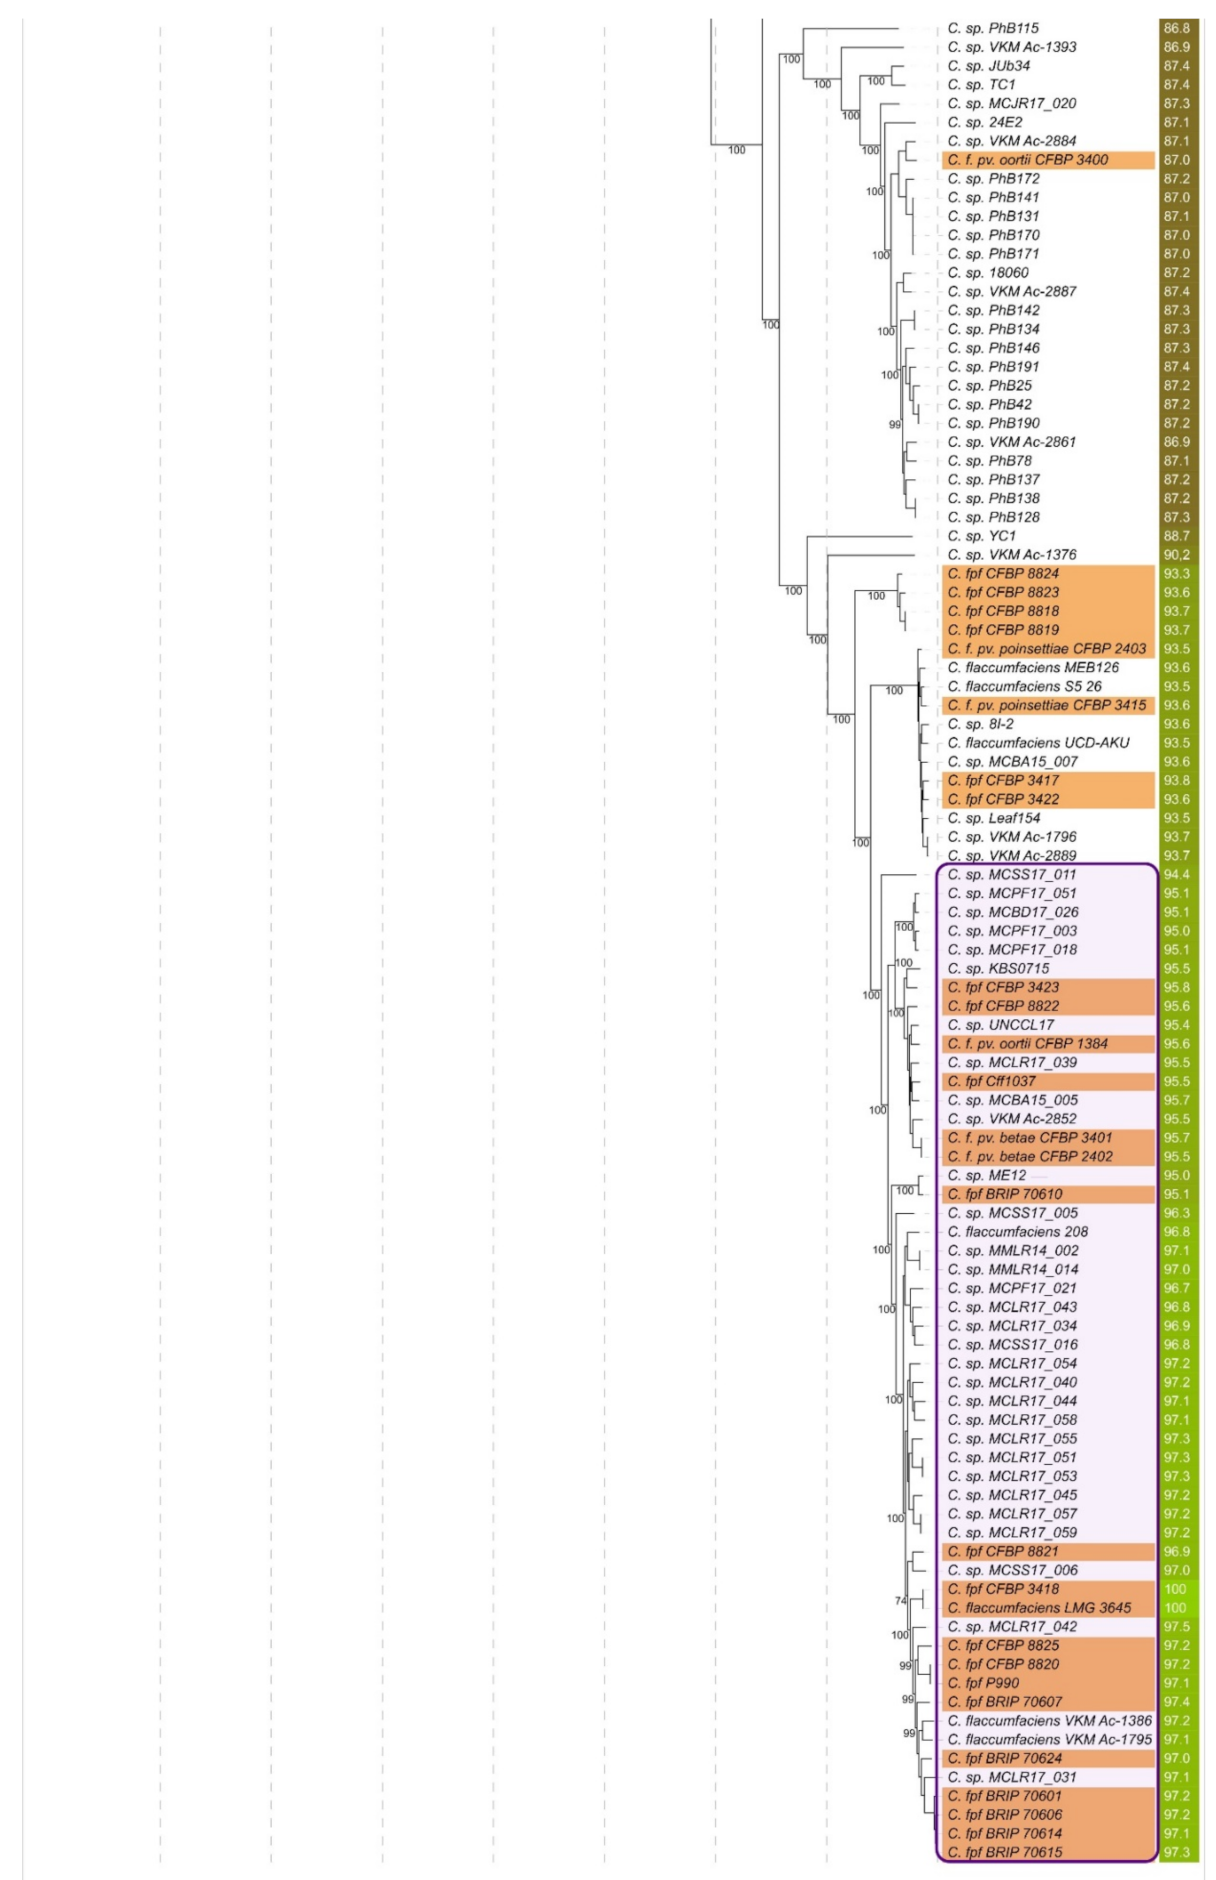
The resulting best-scoring phylogenetic tree obtained with RAxML (Figure 3) demonstrated bootstrap support that was significantly higher than that of the rRNA trees (Supplementary Figures S2–S7), four conservative genes’ trees, and four concatenated genes’ MLPA trees. The composition of clades, including the clade containing the strains classified as C. flaccumfaciens, was very close to the ANI tree (Figure 2).

3.6. Multigene-Based Phylogenomic Analysis

The employment of large-scale phylogenetic analyses involving many orthologous genes provides a substantial number of opportunities for the phylogeny and taxonomy of prokaryotes [60,88,89,90]. The multigene-based phylogenomic analysis was conducted using the core genes’ alignment, obtained with pangenome pipeline Panaroo, which uses a graph-based algorithm to share information between genomes, allowing improvements to annotation calls and the clustering of orthologues and paralogues within the pangenome [44]. The definition of a core (≥0.95) was applied, and 506 genes were found by the pipeline using all 190 reannotated genomes. The total length of the concatenated alignment was 502,785 bases, and the pairwise identity was 82.7%.
The ML best-scoring phylogenetic tree is shown in Figure 4. The tree demonstrates high bootstrap support and a topology that is similar to the topologies of ANI and r-protein trees. The compositions of the clades within the range of 95% ANI species cut-off are identical to those of the ANI tree (Figure 2).

3.7. Possible Taxonomy Revisions Based on ANI and Phylogenetic Analysis

Applying the criterion of full-genome similarity measured by ANI, which requires ≥95% identity and requirements of cladistics, which, in turn, demands the monophyleticity of taxa and using the results obtained by ANI calculations and phylogenetic analysis with high confidence, it is possible to propose the updates in the taxonomy of genus Curtobacterium that are shown in Table 2.

3.7.1. Genomospecies 1. Curtobacterium flaccumfaciens

Starting at the root of the core genome (Figure 4) or r-protein (Figure 3) trees, the monophyletic group of 53 strains, containing most phytopathogenic strains, can be classified as “Curtobacterium flaccumfaciens” (Figure 5A). The group includes the strains currently classified as C. f., C. fpf, C. f. pv. Betae, C. f. pv. Oortii, and unclassified strains. The type strain can be replaced with another to maintain an ANI that is higher than the 95% threshold. This could be the strain CFBP 3423 or a different one. It appears that several subspecies might be established within this group.

3.7.2. Genomospecies 2

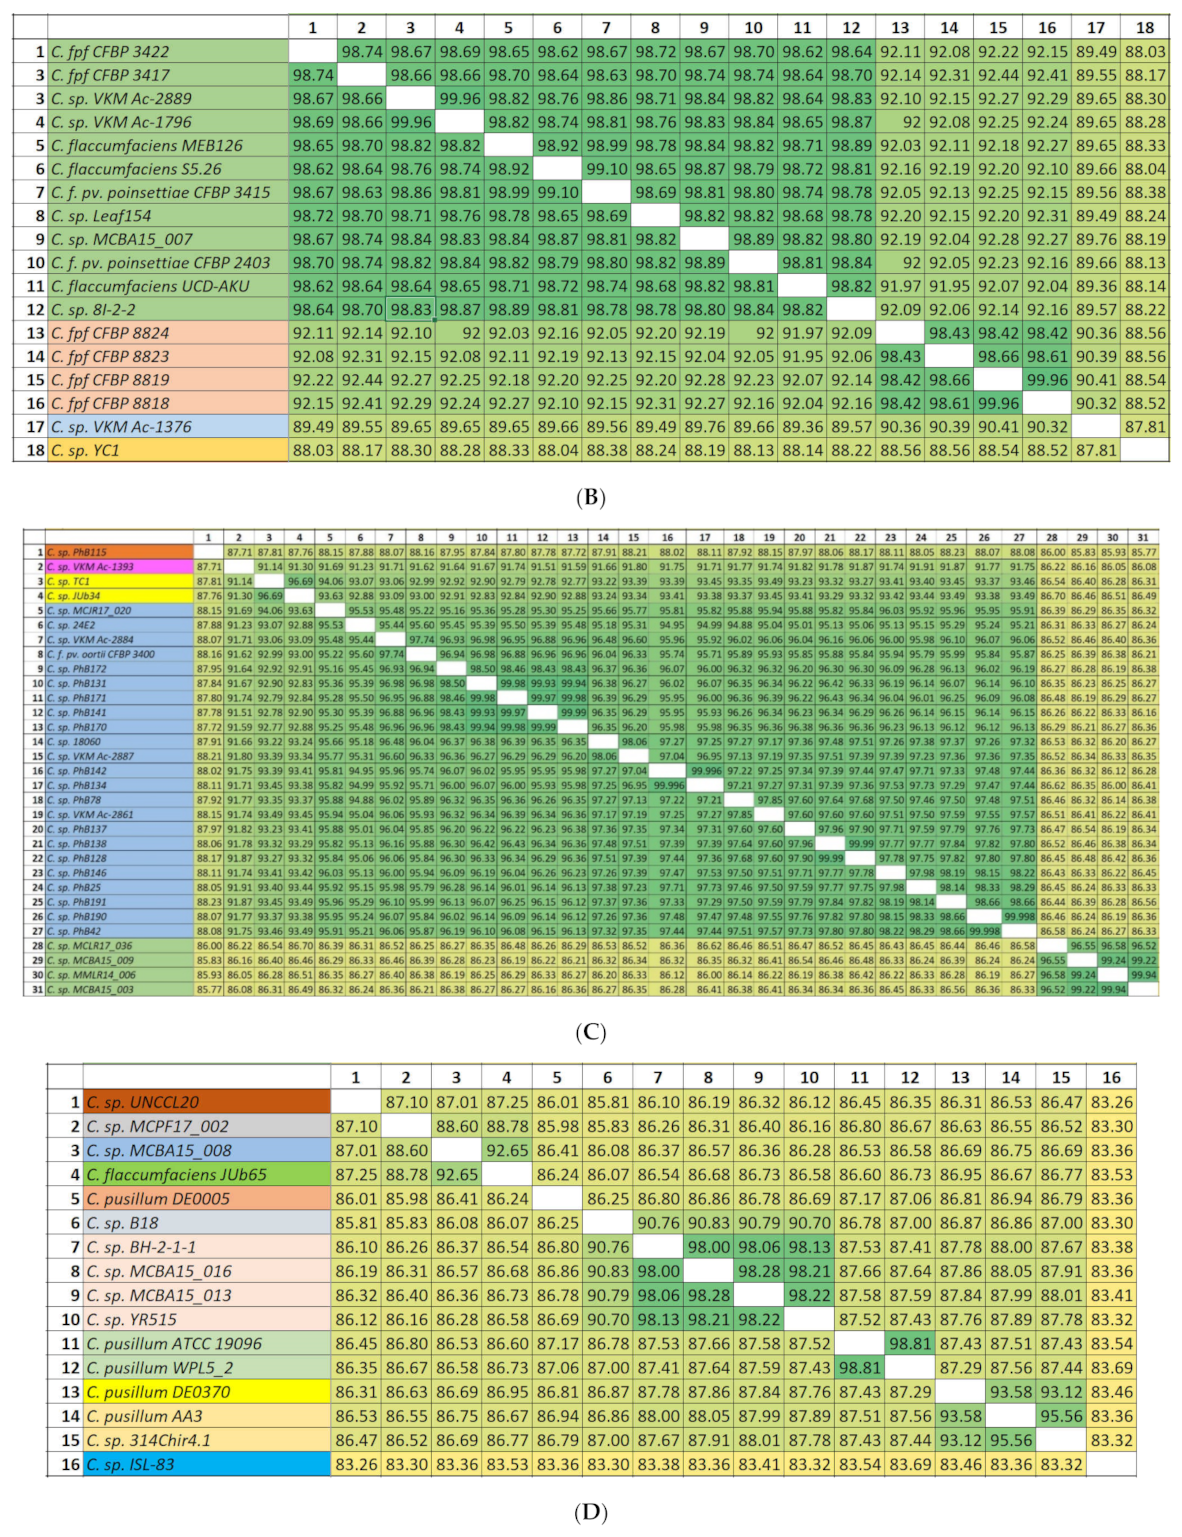
The group of 12 strains comprising the strains currently classified as C. f., C. fpf, C. f. pv. Poinsettiae, and unclassified strains (Figure 5B). To satisfy the requirement of ANI ≥ 95%, any of these strains can be suggested to be the type strain.

3.7.3. Genomospecies 3–5

The group of four strains close to Species 2 phylogenetically and by ANI and comprising pathogenic strains C. fpf CFBP 8818, C. fpf CFBP 8819, C. fpf CFBP 8823, and C. fpf CFBP 8824 can be classified as a new genomospecies (Species 3), as well strains C. sp. VKM Ac-1376 (Species 4) and C. sp. YC1 (Species 5) (Figure 5B). The proposed genomospecies 1–5 include all the strains currently classified as Curtobacterium flaccumfaciens, except two.

3.7.4. Genomospecies 6–10

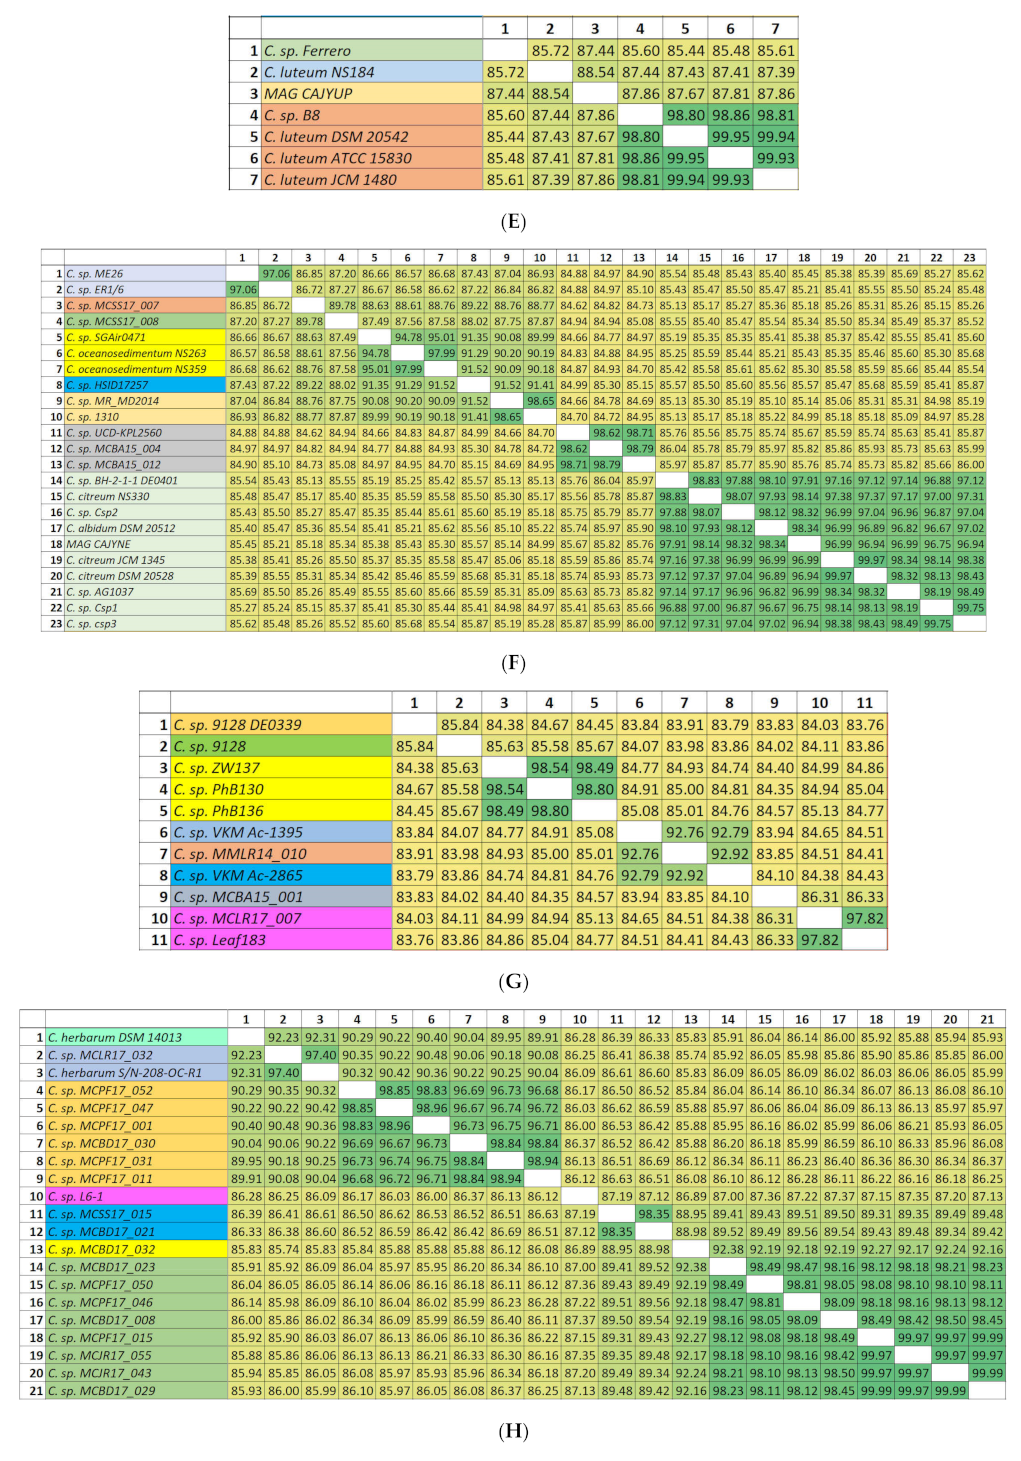
The proposed genomospecies 6–10 constitute two related clades of phylogenetic trees (Figure 3 and Figure 4) and adjacent clusters of the ANI matrix (Figure 5C). These proposed species include one classified strain C. f. pv. oortii CFBP 3400 and 30 unclassified Curtobacterium strains.

3.7.5. Genomospecies 11–21

The proposed genomospecies 11–20 belong to a single clade of phylogenetic trees (Figure 3 and Figure 4) and have ANI distance values that are large enough to distinguish them (Figure 5D). These species comprise five strains currently classified as C. pusillum, the strain labelled as C. flaccumfaciens JUb65, and ten unclassified Curtobacterium strains. Taking into account the genetic distances and phylogenetic data, the strains, currently classified as C. pusillum, should be assigned to three distinct species.

3.7.6. Genomospecies 21–24

The phylogenetic trees’ clade and ANI matrix cluster (Figure 5E), comprising proposed genomospecies 21–24, contain seven strains, five of which are currently classified as C. luteum. One strain is unclassified, and one strain represents a metagenome assembly. It appears that the strains, currently classified as C. luteum, should be assigned to two different species.

3.7.7. Genomospecies 26–33

Twenty-three strains, including the strains currently classified as C. albidum, C. citreum, C. oceanosedimentum, an unclassified draft genome, and a metagenome assembly, constitute a clade on phylogenetic trees (Figure 2, Figure 3 and Figure 4 and Figure 5F) and can be assigned to at least eight genomospecies. It is proposed that the strain C. sp. SGAir0471, as well as two strains labelled as C. oceanosedimentum, should be classified as C. oceanosedimentum, but the closeness of ANI to 95% requires further analysis of the taxonomic positions of C. sp. SGAir0471. It appears that the strains currently classified as C. albidum DSM 20512 and C. citreum should be assigned to one species.

3.7.8. Genomospecies 34–41

The clade containing proposed genomospecies 34–41 comprises 11 unclassified strains (Figure 5G).

3.7.9. Genomospecies 42–48

Twenty-three strains, including the strains currently classified as C. herbarum and 19 unclassified strains, can be assigned to seven species. It appears that, according to ANI and phylogenetic data, the strains, currently classified as C. herbarum, should be assigned to two distinct species.

3.7.10. Genomospecies 49, 50

These two proposed genomospecies represent deeply rooted branches, which, nevertheless, may be assigned to the genus of Curtobacterium, according to the genomic data. The ANI values of the representatives of these species are about 78% compared to other proposed species. Genomospecies 49 contains eight unclassified strains (Figure 5I), and genomospecies 50 contains one unclassified strain.

3.7.11. C. ammoniigenes NBRC 101786

According to the results of core genome phylogeny and ANI clustering, C. ammoniigenes NBRC 101786 represents the strain closest to the root of the trees. The ANI values of C. ammoniigenes NBRC 101786 are about 75–76% compared to other Curtobacterium strains. The taxonomic assignment of C. ammoniigenes should be the subject of a separate discussion. It might be possible to elevate this species to the level of a genus, taking into account biological and biochemical data.

3.8. Curtobacterium Plasmid pCff1 and Curtobacterium Plasmids

As of October 2021, there were ten Curtobacterium plasmid genomes in the NCBI Genome database (Table 3). They comprise a giant plasmid pCPAA3 featuring a genome of 567,298-bp size, five relatively large plasmids with genomes of 77–147 kbp, a medium-sized plasmid pTC5 of 42-kbp genome size, and two relatively small plasmids of 22–25 kbp. Interestingly, the two latter plasmids possess a GC content as low as about 32–35%, while the remaining plasmids are characterised by a GC content close to that of most Curtobacterium chromosomes (about 65–72%). The genomes of the plasmids with a low GC contain multiple repeats, CTTT, CCTTTT, and similar, with the overweight of the thymine residues.
The plasmids pCff1 and pCff113 attract special interest because of virulence proteins reported to be encoded in their genomes [23]. These plasmids have prominent within-genome similarities, with a linear plasmid, pCSL1, occurring in Clavibacter sepedonicus strain ATCC33113 [23].
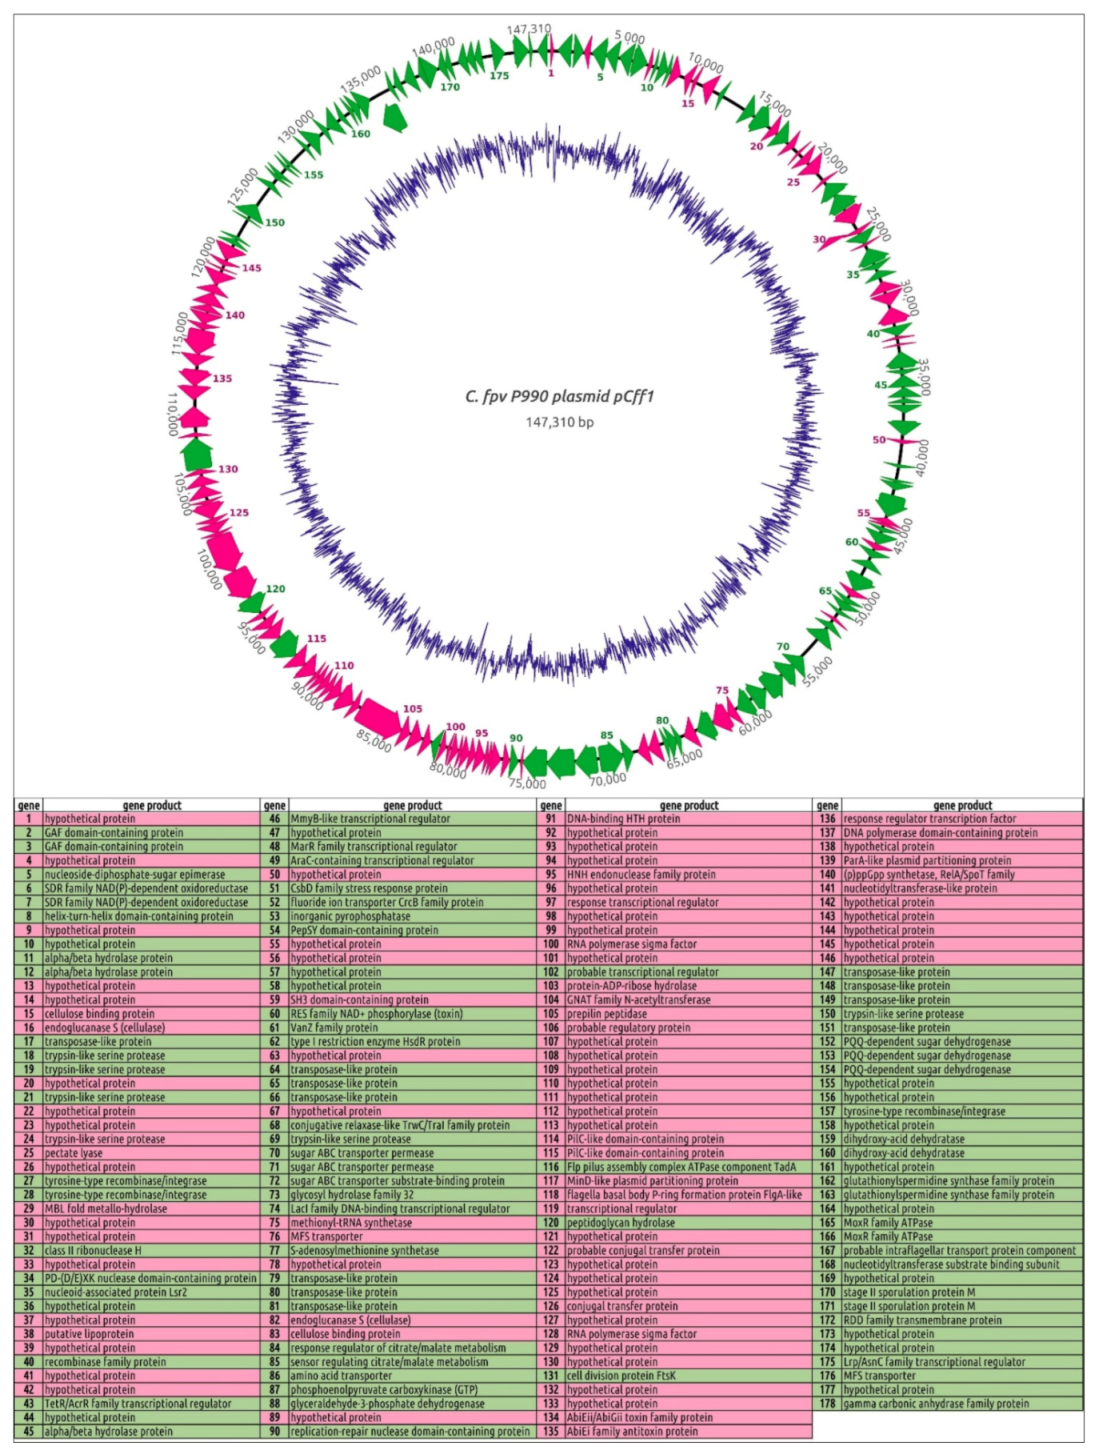
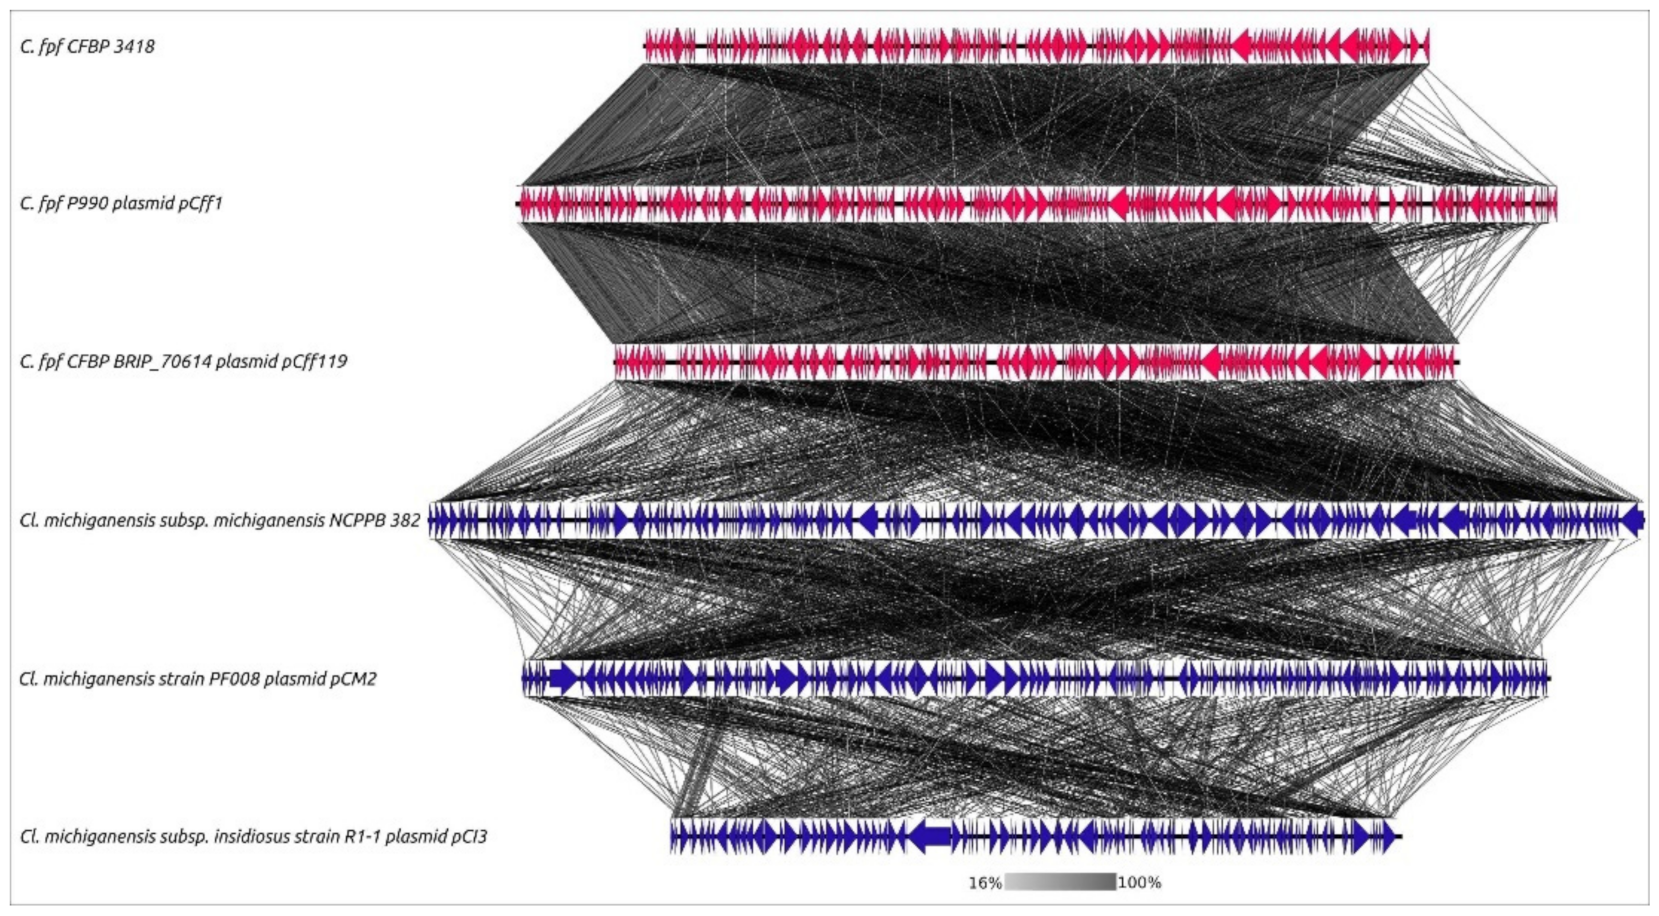
The genome of pCff1 was reannotated using Prokka [25] and a thorough BLAST and HMM-HMM motif comparison involving NCBI and custom BLAST databases and databases offered by the HHpred [31], InterPro [33], and Phyre2 [32] servers (Figure 6). The reannotation predicted 178 open reading frames (ORFs). The list of genes that may be related to virulence includes a pectate lyase gene, two adjacent genes of cellulases and cellulose-binding proteins, six genes of trypsin-like serine proteases, and seven genes of putative hydrocarbon hydrolases. A BLAST search on these genes demonstrated the presence of their homologues in most, or all, pathogenic curtobacteria, while the majority of genes presumably not related with virulence were also found in the genomes of strains with pathogenicity not confirmed (Figure 6). Interestingly, close homologues of Curtobacterium trypsin proteases were found in pathovars of Xanthomonas campestris and Xanthomonas citri. Homologues of several supposed virulence genes were also found in phytopathogenic Clavibacter, Dickeya, and other phytopathogenic bacteria. Distant homologues of pectate lyase were found to be encoded by the genomes of phytopathogenic nematodes.
The pCff1 genome also contains the genes of conjugation apparatus, a toxin–antitoxin system, DNA repair and restriction, and several transposases.
The sequence search on pCff1 demonstrated the presence of extended homologous regions in chromosomes of 13 Curtobacterium strains with confirmed pathogenicity, Curtobacterium sp. PhB130 and PhB136 chromosomes, and Curtobacterium plasmids pCff113 and pCff119 (Figure 7). In addition, the homology search and sequence alignments demonstrated the partial collinearity of pCff1 with Clavibacter plasmids pCI3 (genome length 80,801 bp), pCM2 (133,237 bp), and pVQ28-1 (89,287 bp).

3.9. pCff1 Putative DNA Polymerase Analysis

HMM–HMM motif comparison found meaningful similarities between gene product 137 of plasmid pCff1 and DNA polymerases of Bacillus phage φ29 [91] (HHpred [31] probability: 98.47%, E-value: 3.1 × 10⁻⁵); an unusual lemon-shaped archaeal virus Salterprovirus His1 (HHpred probability: 98.32%, E-value: 1.4 × 10⁻⁴); Streptococcus phage Cp-1 (HHpred probability: 98.19%, E-value: 2.6 × 10⁻⁴); human adenovirus C (HHpred probability: 97.91%, E-value: 1.3 × 10⁻³); and other bacterial, archaeal, and eukaryotic viruses. Significant similarities between phage φ29 and pCff1 gp137 were also shown by the I-TASSER homology modelling server [47] (TM-score 0.844, RMSD 1.35 Å), as well as more distant similarities with other viral DNA polymerases. However, the BLAST search did not reveal homologues of gp137 among the sequences, other than Actinomycete hypothetical proteins.
The structure of gp137 has been predicted using several approaches—homology modelling with Phyre2 and I-TASSER and deep learning algorithms implemented in AlphaFold2 [45] and RoseTTAFold [49]. According to the ModFOLD8 model quality assessment, the latter two demonstrated high predictive accuracy, which far exceeded that of homology modelling. The ModFOLD8 global model quality score was 0.1870 for Phyre2, 0.2188 for I-TASSER, 0.3804 for AlphaFold2, and 0.3720 for RoseTTAFold. The AlphaFold2 model refolded with ReFOLD3 [51] is shown in Figure 8. The final ModFOLD8 global model quality score was 0.3937, with high confidence and a p-value of 4.523 × 10⁻³; the predicted average residue error was 8.16 Å (Supplementary Figure S18).
A comparison of the predicted structure of plasmid pCff1 gp137 and phage φ29 demonstrates an overall similarity and the presence of similarly located cavities and tunnels in both proteins, which can be used in DNA binding and processing.
It is noteworthy that the genome of giant plasmids pCPAA3 also encodes for putative DNA polymerases. The BLAST search and HMM–HMM motif comparison predicted the presence of the genes of DNA polymerase III subunits α, ε, and κ. Furthermore, the pCPAA3 genome encodes a protein showing distant homology with the temperate Siphoviridae Clavibacter phage CN1A large subunit of terminase.

3.10. Curtobacterium PCR Diagnostics and Genus-Specific Primers

The unavailability of a selective medium for isolating Curtobacterium causes substantial difficulties for isolating new strains and studies of the biodiversity of Curtobacterium sp. The use of a semi-selective medium, in practice, still led to the isolation of visually similar bacterial strains from plants that did not belong to Curtobacterium sp. To simplify the selection procedure for field isolates of Curtobacterium, a set of genus-specific primers are proposed for the initial assessment of isolated samples using the qPCR method.
For the development of a diagnostic kit, a 23S rRNA region was chosen, which seemed to be conservative for Curtobacterium and differed from the outer groups. To amplify the selected genus-specific region, oligonucleotides were designed, the sequences of which are shown in Table 4.
To check the correctness of the identification with the designed primers, the assay was tested on the set of the strains indicated in Table S2.
The set of strains included 22 Curtobacterium strains purchased from the All-Russian Collection of Microorganisms (VKM) (No. 1–22) and eight Curtobacterium strains isolated by the authors from infected plants (No. 23–30), as well as 15 strains isolated according to the same protocol but which turned out to be representatives of other genera (No. 31–45). Additionally, a set of strains isolated from rotting plants was tested to confirm the absence of false-positive amplification with common phytopathogenic bacteria such as Clavibacter, Pseudomonas, Xanthomonas, Pectobacterium, Dickeya, and others (No. 46–81). To check the correctness of the amplification, the PCR product was sequenced for five random samples.
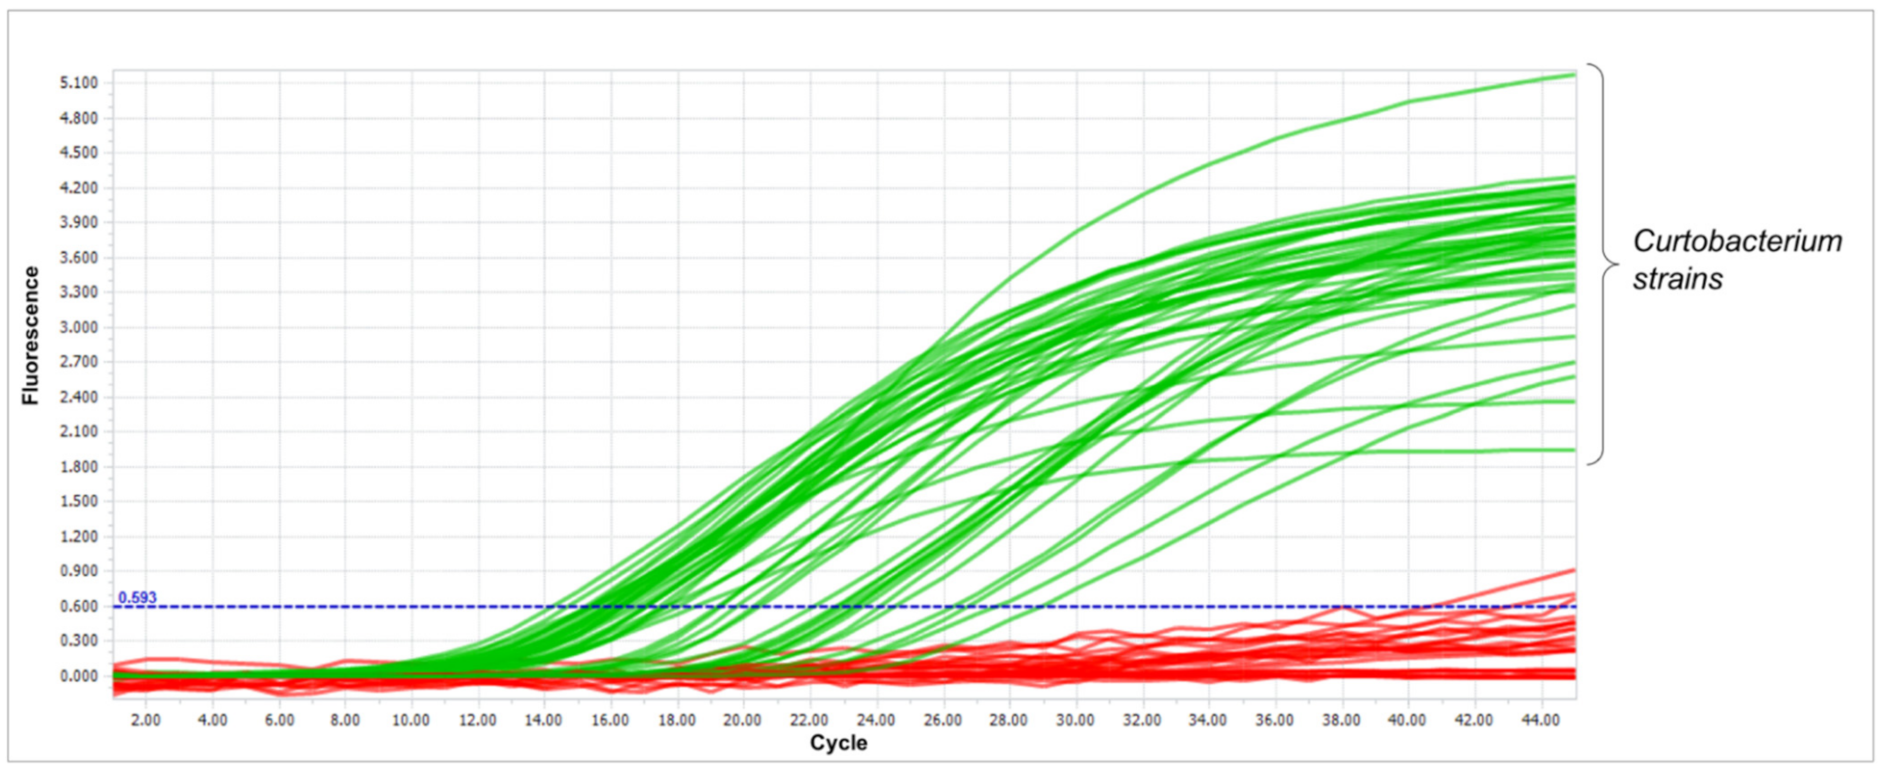
The qPCR results are shown in Table S2, and an example of the amplification curves is shown in Figure 9. As can be seen from the data obtained, a positive signal was observed for all Curtobacterium strains, while no amplification was observed for non-Curtobacterium isolates.
According to the results obtained, amplification proceeded quite selectively, making it possible to differentiate Curtobacterium isolates from other microbiota found in infected plants, including closely related Microbacteria.
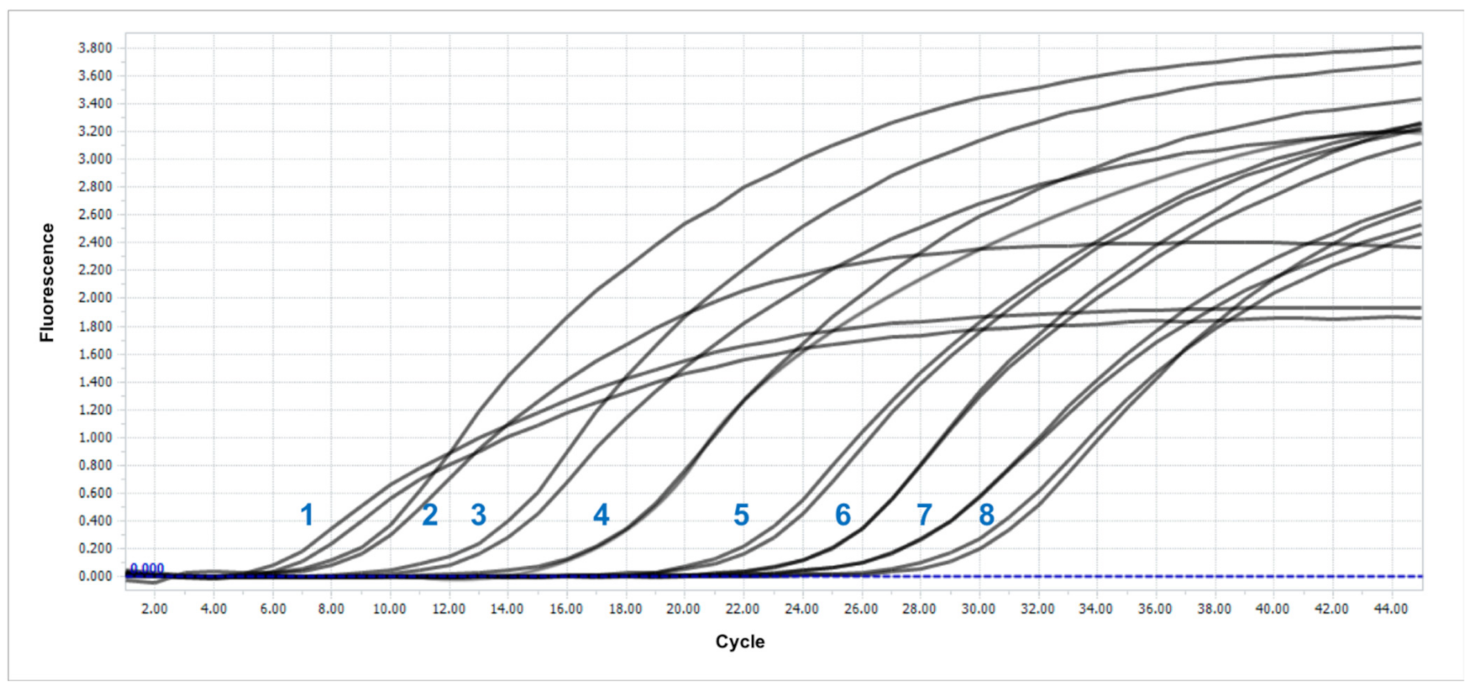
Additionally, for the qPCR detection system, the efficiency and sensitivity of the detection were evaluated. For greater accuracy in calculating the number of copies in the medium, a test plasmid was constructed. For this purpose, an amplified fragment of the target 23S rRNA region was ligated to the pDrive vector. With the resulting plasmid and the genomic DNA of the C. flaccumfaciens Ac-1923 (← DSM 20129) strain, serial tenfold dilutions and qPCR were conducted. The amplification curves for the plasmid experiment are shown in Figure 10.
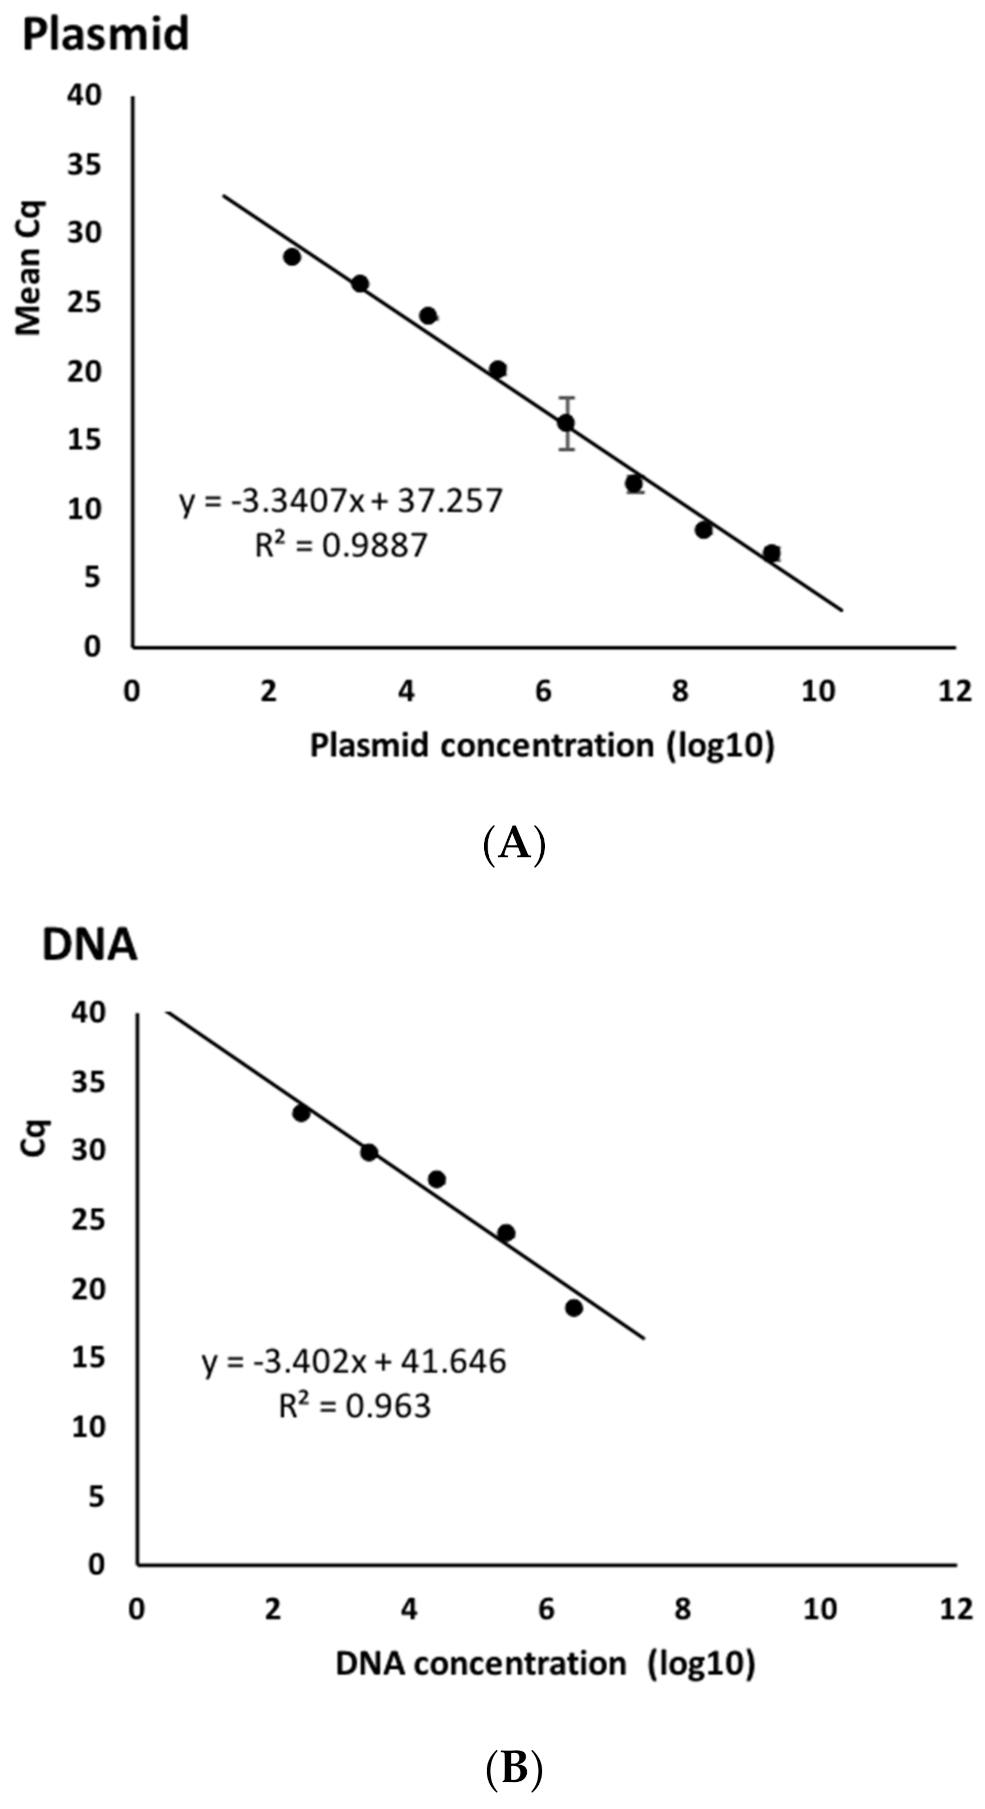
The Cq values obtained made it possible to plot a graph of the dependence of the threshold cycle on the logarithm of the DNA concentration per reaction. The data obtained are presented in Table 5 and Figure 11. The figure shows that the standard curves obtained were linear, with slopes of 3.34 and 3.4 for the plasmid and genomic DNA, respectively. Thus, the PCR efficiency was 99.25 and 96.76%. The LoD in both cases was comparable and amounted to ≈103 cfu/mL, which is a normal sensitivity for such detection systems.

4. Discussion

4.1. Challenges of Curtobacterium Taxonomic Classification

The genus Curtobacterium (family Microbacteriaceae) was defined by Yamada and Komagata in 1972 for a group of motile Brevibacteria [1]. It comprises a wide range of bacteria isolated from different environments and plants, including eight approved species:
  • C. albidum (Komagata and Iizuka 1964). Yamada and Komagata 1972 homotypic synonym: Brevibacterium albidum Komagata and Iizuka 1964 [1,92];
  • C. ammoniigenes (Aizawa et al. 2007 [93]);
  • C. citreum (Komagata and Iizuka 1964). Yamada and Komagata 1972 [1,92];
  • C. flaccumfaciens (Hedges 1922). Collins and Jones described this species as a plant pathogen with six recognised pathovars [3];
  • C. herbarum (Behrendt et al. 2002 [94]);
  • C. luteum (Komagata and Iizuka 1964). Yamada and Komagata 1972 [1,92];
  • C. oceanosedimentum—approved as a homotypic synonym: Flavobacterium oceanosedimentum Carty and Litchfield 1978 [95];
  • C. pusillum (Iizuka and Komagata 1965). Yamada and Komagata 1972 [1,92].
Other species have been proposed but not yet approved, such as C. glycinis from Glycine max, C. gossypii from Gossypium hirsutum, and C. oryzae sp. from Oryza sativa [96].
In the current work, 190 genomes of Curtobacterium spp. available at the NCBI Genome database were analysed using different bioinformatic methods. Deposited complete and draft genomes include 35 strains classified as C. flaccumfaciens, only 27 of which are identified as C. flaccumfaciens pathovars with confirmed virulence to a certain host plant. Seven genomes were classified as being representatives of other Curtobacterium species: C. albidum, C. ammoniigenes, C. citreum, C. herbarum, C. luteum, C. oceanosedimentum, and C. pusillum (Figure 1). Thus, 77.9% (148) of available genomes of Curtobacterium spp. have not yet been identified to a certain species. The relatively large number of sequenced genomes of C. flaccumfaciens (18.4%) can be explained by the status of C. fpf as an emerging and regulated plant pathogen that is spreading rapidly worldwide and that occurs worldwide in legume-producing countries.
The results of a phylogenetic analysis using ANI and conventional 16S rRNA and 23S rRNA genes showed limited applicability to the definition of species within the genus Curtobacterium. It is probable that this limitation is the major reason for the uncertain taxonomic positioning of 148 analysed genomes.
Using the sequences of concatenated conservative genes coding for DNA processing proteins (gyrB, parE, rpoA, and rpoB) produced phylogenetic trees with significantly higher resolution and bootstrap supporting values than the rRNA phylogenetic analysis. The topology of these trees (Supplementary Figures S8–S15) suggests the rare occurrence of horizontal exchange events among the chosen genes.
A phylogenetic analysis based on concatenated nucleotide sequences of 46 ribosomal proteins (r-proteins) extracted from reannotated genomes was used. The resulting best-scoring phylogenetic tree obtained with RAxML (Figure 4) demonstrated bootstrap support that was significantly higher than that of all other trees (Supplementary Figures S2–S7). The composition of the clades, including the clade containing the strains classified as Curtobacterium flaccumfaciens, was very close to that of the ANI tree (Figure 2).
Applying the criterion of full-genome similarity as measured by ANI, which requires ≥95% identity and requirements for the monophyleticity of taxa, and using the results obtained by ANI calculations and phylogenetic analysis with a high level of confidence, a more detailed taxonomy of genus Curtobacterium with 51 potential genomospecies can be proposed (Table 2). A group of 53 monophyletic strains can be assigned to the species C. flaccumfaciens, which can include both pathogenic and non-pathogenic strains. All results presented in this work indicate the necessity for taxonomic revisions within the genus of Curtobacterium and correlate with previous genomic studies.
Chen et al. [22] analysed 45 strains from the NCBI GenBank database designated as Curtobacterium spp. The ANI values in pairs of these strains varied from 75% to 99% and, using standard criteria based on ANI and dDDH [97], showed that only four strains belonged to C. flaccumfaciens sensu stricto among the evaluated genome sequences. The strains UNCCL17 and MCBA15-005 were phylogenetically closely related to C. flaccumfaciens, but it is likely that they belong to a novel species. According to Reference [22], sensu stricto C. flaccumfaciens strains were clustered in a monophyletic clade showing 97% ANI with one another.
MLSA based on housekeeping genes recA, gyrB, ppK, atpD, dnaK, and rpoB was used to investigate the phylogenetic relationships among 84 strains of C. flaccumfaciens, which were distributed among four pathovars (C. flaccumfaciens pv. flaccumfaciens, poinsettiae, oortii, and betae) and isolated from host plants over a period of 77 years from North America, South America, Europe, and Asia. The C. flaccumfaciens strains were grouped into three main clusters. Colony colour aside, the three clusters did not correlate with pathovar affiliation, isolation date, geographical location, or isolation host. Thus, the pv. flaccumfaciens strains, pathogenic on beans, were scattered among the three clusters as diverse as other Curtobacterium species. Strains from the same pathovars (hosts of isolation) were placed in different clusters, irrespective of their geographical origin [98].
A core genome phylogeny of 50 genomes [99] provided evidence that Curtobacterium spp. strains with glycosyl hydrolases (GHs) and, thus, with the potential for being degraders of cellulose and other polysaccharides, were not phylogenetically related to the type strain of C. flaccumfaciens, because they shared only 85% ANI. Furthermore, strains GD1, BH-2-1-1, MCBA15_013, and YR515 probably belong to separate species that are currently unnamed.
Chen et al. [22] evaluated 45 bacterial strains designated as C. flaccumfaciens in the literature and found the genetic diversity within the group to be greater than had so far been described. Only two strains, MMLR14-002 and MMLR14-014, were identified as being members of C. flaccumfaciens, while the remaining strains needed to be reclassified as novel taxa.
Recently, MLST, using the sequences of five housekeeping genes (i.e., atpD, gyrB, ppk, recA, and rpoB), revealed that the three strains, MCBA15-007, MEB126, and UCD-AKU, were phylogenetically closely related to the type strain of the poinsettia (Euphorbia pulcherrima) pathogen (pv. poinsettiae) ICMP 2566T, while the strains MCBA15-005 and UNCCL17 were phylogenetically closely related to the type strain of the sugar beet pathogen (pv. betae) ICMP 2594T [21]. The authors indicated that the plant pathogenic members of C. flaccumfaciens must be attributed to different species, reinforcing the need to reconsider the taxonomy of phytopathogenic members of the species. Thus, previous evaluations of Curtobacterium strains using genome sequences or MLST/MLSA have illustrated the presence of strain groups that are different enough from type strains of the eight validated species for new unnamed species to be claimed.
Jain et al. [62] computed the pairwise average nucleotide identity (ANI) of 91,761 microbial genomes and found that the ANI values calculated from the 8 billion comparisons showed a strong bimodal distribution concentrated at 83 and 95%, with a wide gap between these two peaks. The authors concluded that a clear genetic discontinuum and species boundary were evident from the unprecedented large-scale ANI analysis and claimed that the 95% ANI threshold represented an accurate threshold for demarcating almost all currently named prokaryotic species. Murray et al. [100] argued that the creation of a universal genetic boundary among the named species in the current NCBI taxonomy was questionable and that it resulted from substantially biased sampling in genome sequencing. They urged caution against being excessively confident in using 95% ANI for microbial species delineation, since the high benchmarks reported in the paper were inflated by the use of highly redundant genomes. Microbes occupying narrow ecological niches and with a limited dispersal rate (e.g., obligate intracellular bacteria) may develop genetic clusters. Free living microbes exploring different habitats are more likely to exhibit a genetic continuum. Selection is also unlikely to produce a universal genetic boundary, as microbial species are unique in nature, with each species subject to its own evolutionary and ecological forces [100].
In answer to the critics of the general concept of Jain et al. [62], the authors said that some bacterial populations “show large intrapopulation sequence diversity, probably due to unique ecological niche(s) they have occupied for long evolutionary times compared to other marine taxa (i.e., they lack direct competition), and thus this threshold is around 90–92% ANI for these populations. In contrast, several more recently emerged pathogens like Bacillus anthracis show limited intrapopulation species diversity (ANI values > 99%). Hence, the area of genetic discontinuity may vary, depending on the taxa considered and their unique ecophysiologic and evolutionary characteristics, and 95% ANI appears to be the genetic level that distinguishes most natural discrete populations and named species, but not necessarily all.”
It was concluded that, “for these reasons, taxon descriptions should not be based on a single metric or threshold but the careful investigation of ecological and functional data together with genetic relatedness (e.g., ANI values)” [101].

4.2. Curtobacterium Plasmids and Pathogenicity

The occurrence of pCff1-related plasmids in the pathogenic strains of Curtobacterium and Clavibacter strains appears to be related to their virulence. The important role of plasmids has been shown for many phytopathogenic bacteria [102,103,104,105]. The analysis of, and homology search on, the genes of those plasmids indicated their presence mainly in virulent strains with pathogenicity confirmed. The occurrence of putative virulence genes in strains with no confirmed pathogenicity may be explained by the lack of experimentation on their pathogenic behaviour, their past lifestyle, and other benefits from the presence of such genes. For example, the presence of enzymes that assist in the use of plant cell walls and polymers present in the integuments of hosts is related to both saprotrophic nutrition and pathogenic lifestyle [106,107]. However, if such enzymes are useful for saprophytes, they may be obligate for pathogens.
Discovery of the gene that encodes the protein structurally similar to viral DNA polymerase I (which belongs to family B DNA polymerases) raises important questions about the origin and evolution of pCff1-related plasmids. A plasmid-encoded DNA polymerase is an unusual event for bacteria and archaea, but several incidents, including actinomycetes, have been reported [108,109,110,111,112]. Plasmid DNA polymerase genes are not unusual for plasmids of fungal mitochondria [113,114,115,116,117,118], including the mitochondria of a phytopathogenic fungus Claviceps purpurea [119]. Additionally, DNA polymerases are encoded in some temperate bacteriophages like N15, which persist like a linear plasmid in a host cell [120]. It is noteworthy that mitochondrial plasmid and phage N15 polymerases appear to belong to family B DNA polymerases.
The homologues of pCff1 putative DNA polymerase have been detected only in chromosomal and plasmid genomes of actinomycetes. The relatedness of pCff1 putative DNA polymerase with the DNA polymerases of bacteriophages and archaeal and eukaryotic viruses have been revealed with the HMM–HMM motif comparison and structure modelling. These analyses have demonstrated that pCff1 putative DNA polymerase is more similar to the phage DNA polymerase. It is possible to hypothesise about the comparatively ancient origin and divergence of this protein. It is necessary to study the functioning of this enzyme experimentally. It might be suggested that the pCff1 putative DNA polymerase I could participate in the initial stages of replication, as has been reported in the context of some other plasmids [121,122,123].

4.3. Curtobacterium spp. PCR Diagnostics

The current study has seen, for the first time, the development of a genus-specific primer set for the diagnosis of Curtobacterium. The set makes it possible to differentiate Curtobacterium from representatives of other microbiota of an infected plant, which is an urgent applied problem. Primers for the species-specific detection of Cff have previously been described in the literature [124], but there have been no kits for genus-specific diagnostics. The high level of efficiency of PCR with the test system developed and with a sufficiently low detection limit have been shown experimentally. The values are comparable to those for similar qPCR systems for other genera of phytopathogens [125].
The resulting test system can become a valuable and easy-to-use tool for rapidly assessing the strains isolated from a diseased plant. In addition, the sensitivity of detection should allow the use of this method for assessing plant extracts for the presence of a pathogen, even in asymptomatic plants.

5. Conclusions

ANI comparisons and the phylogenetic analysis of ribosomal and core proteins testify to the necessity for global taxonomic revisions within the genus of Curtobacterium. Based on these data, it is possible to discuss the delineation of up to several dozen genomospecies. A monophyletic group of 53 strains can be assigned to the species of Curtobacterium flaccumfaciens, which can include both pathogenic and non-pathogenic strains. The pathogenicity of Curtobacterium and other Microbacteriaceae can be related to a group of plasmids carrying virulence factors and featuring the presence of a gene distantly related to viral DNA polymerase I. The recent increase in genomic data challenges widespread diagnostic methods. The presented genus-specific PCR diagnostic kit developed and tested in the present work may serve as a good complementary tool for further studies of Curtobacterium strains

Supplementary Materials

The following are available online at https://www.mdpi.com/article/10.3390/cimb44020060/s1: Figure S1: ANI matrix using 190 Curtobacterium genomes obtained with orthoANIu and clustered using BioNJ. Figure S2: Consensus tree obtained with MEGA using 16S rRNA genes of representatives of Curtobacterium and Gryllotalpicola ginnsengisoli DSM 22003 used as an outgroup. Bootstrap support values are shown near their branches as a percentage of 1000 replicates. The branches with bootstrap support of less than 50% were collapsed. Figure S3: Best-scoring tree obtained with RAxML using 16S rRNA genes of representatives of Curtobacterium and Gryllotalpicola ginnsengisoli DSM 22003 used as an outgroup. Bootstrap support values are shown near their branches as a percentage of 1000 replicates. The scale bar shows 0.005 estimated substitutions per site. Figure S4: Consensus tree obtained with MEGA using 23S rRNA genes of representatives of Curtobacterium and Gryllotalpicola ginnsengisoli DSM 22003 used as an outgroup. Bootstrap support values are shown near their branches as a percentage of 1000 replicates. The branches with bootstrap support of less than 50% were collapsed. Figure S5: Best-scoring tree obtained with RAxML using 23S rRNA genes of representatives of Curtobacterium and Gryllotalpicola ginnsengisoli DSM 22003 used as an outgroup. Bootstrap support values are shown near their branches as a percentage of 1000 replicates. The scale bar shows 0.01 estimated substitutions per site. Figure S6: Consensus tree obtained with MEGA using concatenated 16S and 23S rRNA genes of representatives of Curtobacterium and Gryllotalpicola ginnsengisoli DSM 22003 used as an outgroup. Bootstrap support values are shown near their branches as a percentage of 1000 replicates. The branches with bootstrap support of less than 50% were collapsed. Figure S7: Best-scoring tree obtained with RAxML using concatenated 16S and 23S rRNA genes of representatives of Curtobacterium and Gryllotalpicola ginnsengisoli DSM 22003 used as an outgroup. Bootstrap support values are shown near their branches as a percentage of 1000 replicates. The scale bar shows 0.01 estimated substitutions per site. Figure S8: Consensus tree obtained with MEGA using gyrB nucleotide sequences of representatives of Curtobacterium and Gryllotalpicola ginnsengisoli DSM 22003 used as an outgroup. Bootstrap support values are shown near their branches as a percentage of 1000 replicates. The branches with bootstrap support lower than 50% were collapsed. Figure S9: Best-scoring tree obtained with RAxML using gyrB nucleotide sequences of representatives of Curtobacterium and Gryllotalpicola ginnsengisoli DSM 22003 used as an outgroup. Bootstrap support values are shown near their branches as a percentage of 1000 replicates. The scale bar shows 0.05 estimated substitutions per site. Figure S10: Consensus tree obtained with MEGA using parE nucleotide sequences of representatives of Curtobacterium and Gryllotalpicola ginnsengisoli DSM 22003 used as an outgroup. Bootstrap support values are shown near their branches as a percentage of 1000 replicates. The branches with bootstrap support of less than 50% were collapsed. Figure S11: Best-scoring tree obtained with RAxML using parE nucleotide sequences of representatives of Curtobacterium and Gryllotalpicola ginnsengisoli DSM 22003 used as an outgroup. Bootstrap support values are shown near their branches as a percentage of 1000 replicates. The scale bar shows 0.1 estimated substitutions per site. Figure S12: Consensus tree obtained with MEGA using rpoA nucleotide sequences of representatives of Curtobacterium and Gryllotalpicola ginnsengisoli DSM 22003 used as an outgroup. Bootstrap support values are shown near their branches as a percentage of 1000 replicates. The branches with bootstrap support of less than 50% were collapsed. Figure S13: Best-scoring tree obtained with RAxML using rpoA nucleotide sequences of representatives of Curtobacterium and Gryllotalpicola ginnsengisoli DSM 22003 used as an outgroup. Bootstrap support values are shown near their branches as a percentage of 1000 replicates. The scale bar shows 0.05 estimated substitutions per site. Figure S14: Consensus tree obtained with MEGA using rpoB nucleotide sequences of representatives of Curtobacterium and Gryllotalpicola ginnsengisoli DSM 22003 used as an outgroup. Bootstrap support values are shown near their branches as a percentage of 1000 replicates. The branches with bootstrap support of less than 50% were collapsed. Figure S15: Best-scoring tree obtained with RAxML using rpoB nucleotide sequences of representatives of Curtobacterium and Gryllotalpicola ginnsengisoli DSM 22003 used as an outgroup. Bootstrap support values are shown near their branches as a percentage of 1000 replicates. The scale bar shows 0.05 estimated substitutions per site. Figure S16: Consensus tree obtained with MEGA using gyrB, parE, rpoB, and rpoB concatenated nucleotide sequences of representatives of Curtobacterium and Gryllotalpicola ginnsengisoli DSM 22003 used as an outgroup. Bootstrap support values are shown near their branches as a percentage of 1000 replicates. The branches with bootstrap support lower than 50% were collapsed. Figure S17: Best-scoring tree obtained with RAxML using gyrB, parE, rpoB, and rpoB concatenated nucleotide sequences of representatives of Curtobacterium and Gryllotalpicola ginnsengisoli DSM 22003 used as an outgroup. Bootstrap support values are shown near their branches as a percentage of 1000 replicates. The scale bar shows 0.1 estimated substitutions per site. Figure S18: (A) Predicted structure of putative DNA polymerase from C. fpf P990 plasmid pCff1 obtained with Alphafold and refined with ReFOLD coloured based on a rainbow gradient scheme, where the N-terminus of the polypeptide chain is coloured blue, and the C-terminus is coloured red. (B) ModFOLD 3D view of per-residue accuracy of the model of putative DNA polymerase from C. fpf P990 plasmid pCff1. The model is coloured based on a rainbow gradient scheme, where the residues with the lowest predicted residue errors are coloured blue, and the residues with the highest predicted residue errors are coloured red. (C) ModFOLD residue error plot. Table S1: List of bacterial strains used for the PCR development. Table S2: List of Curtobacterium genomes deposited in the NCBI GenBank database, as of October 2021.

Author Contributions

Conceptualisation, P.E., A.I. and A.L.; methodology, P.E. and A.L.; validation, K.M.; formal analysis, P.E., A.L., R.T., A.I. and M.S.; investigation, P.E., A.L., R.T., A.T., M.S. and A.I.; resources, K.M.; data curation, P.E. and A.L.; writing—original draft preparation, P.E. and A.L.; writing—review and editing, A.I. and K.M.; visualisation, P.E. and A.L.; and supervision, A.I. and K.M. All authors have read and agreed to the published version of the manuscript.

Funding

This research was supported by the Russian Science Foundation, grant #21-16-00047.

Institutional Review Board Statement

Not applicable.

Informed Consent Statement

Not applicable.

Conflicts of Interest

The authors declare no conflict of interest.

References

  1. Yamada, K.; Komagata, K. Taxonomic Studies on Coryneform Bacteria. J. Gen. Appl. Microbiol. 1972, 18, 417–431. [Google Scholar] [CrossRef] [Green Version]
  2. Hedges, F. A Bacterial Wilt of the Bean Caused by Bacterium flaccumfaciens Nov. sp. Science 1922, 55, 433–434. [Google Scholar] [CrossRef] [PubMed] [Green Version]
  3. Collins, M.D.; Jones, D.Y. 1983 Reclassification of Corynebacterium Flaccumfaciens, Corynebacterium Betae, Corynebacterium Oortii and Corynebacterium Poinsettiae in the Genus Curtobacterium, as Curtobacterium flaccumfaciens Comb. Nov. Microbiology 1983, 129, 3545–3548. [Google Scholar] [CrossRef] [Green Version]
  4. Komagata, K.; Suzuki, K.I. Genus Curtobacterium. In Bergeys Manual of Systematic Bacteriology; Springer: Baltimore, MD, USA, 1986; Volume 2, pp. 1313–1317. [Google Scholar]
  5. Magnani, G.S.; Didonet, C.M.; Cruz, L.M.; Picheth, C.F.; Pedrosa, F.O.; Souza, E.M. Diversity of Endophytic Bacteria in Brazilian Sugarcane. Genet. Mol. Res. GMR 2010, 9, 250–258. [Google Scholar] [CrossRef] [PubMed]
  6. West, E.R.; Cother, E.J.; Steel, C.C.; Ash, G.J. The Characterization and Diversity of Bacterial Endophytes of Grapevine. Can. J. Microbiol. 2010, 56, 209–216. [Google Scholar] [CrossRef]
  7. Pereira, S.I.A.; Castro, P.M.L. Diversity and Characterization of Culturable Bacterial Endophytes from Zea Mays and Their Potential as Plant Growth-Promoting Agents in Metal-Degraded Soils. Environ. Sci. Pollut. Res. 2014, 21, 14110–14123. [Google Scholar] [CrossRef] [PubMed]
  8. Zinniel, D.K.; Lambrecht, P.; Harris, N.B.; Feng, Z.; Kuczmarski, D.; Higley, P.; Ishimaru, C.A.; Arunakumari, A.; Barletta, R.G.; Vidaver, A.K. Isolation and Characterization of Endophytic Colonizing Bacteria from Agronomic Crops and Prairie Plants. Appl. Environ. Microbiol. 2002, 68, 2198–2208. [Google Scholar] [CrossRef] [PubMed] [Green Version]
  9. Enya, J.; Shinohara, H.; Yoshida, S.; Tsukiboshi, T.; Negishi, H.; Suyama, K.; Tsushima, S. Culturable Leaf-Associated Bacteria on Tomato Plants and Their Potential as Biological Control Agents. Microb. Ecol. 2007, 53, 524–536. [Google Scholar] [CrossRef]
  10. Vega, F.E.; Pava-Ripoll, M.; Posada, F.; Buyer, J.S. Endophytic Bacteria in Coffea arabica L. J. Basic Microbiol. 2005, 45, 371–380. [Google Scholar] [CrossRef]
  11. Aravind, R.; Kumar, A.; Eapen, S.J.; Ramana, K.V. Endophytic Bacterial Flora in Root and Stem Tissues of Black Pepper (Piper Nigrum L.) Genotype: Isolation, Identification and Evaluation against Phytophthora capsici. Lett. Appl. Microbiol. 2009, 48, 58–64. [Google Scholar] [CrossRef]
  12. De Melo Pereira, G.V.; Magalhães, K.T.; Lorenzetii, E.R.; Souza, T.P.; Schwan, R.F. A Multiphasic Approach for the Identification of Endophytic Bacterial in Strawberry Fruit and Their Potential for Plant Growth Promotion. Microb. Ecol. 2012, 63, 405–417. [Google Scholar] [CrossRef]
  13. Araújo, W.L.; Marcon, J.; Maccheroni, W.; van Elsas, J.D.; van Vuurde, J.W.L.; Azevedo, J.L. Diversity of Endophytic Bacterial Populations and Their Interaction with Xylella Fastidiosa in Citrus Plants. Appl. Environ. Microbiol. 2002, 68, 4906–4914. [Google Scholar] [CrossRef] [Green Version]
  14. Ulrich, K.; Ulrich, A.; Ewald, D. Diversity of Endophytic Bacterial Communities in Poplar Grown under Field Conditions. FEMS Microbiol. Ecol. 2008, 63, 169–180. [Google Scholar] [CrossRef] [Green Version]
  15. Procópio, R.E.L.; Araújo, W.L.; Maccheroni, W.; Azevedo, J.L. Characterization of an Endophytic Bacterial Community Associated with Eucalyptus spp. Genet. Mol. Res. GMR 2009, 8, 1408–1422. [Google Scholar] [CrossRef]
  16. Montero-Calasanz, M.d.C.; Meier-Kolthoff, J.P.; Zhang, D.-F.; Yaramis, A.; Rohde, M.; Woyke, T.; Kyrpides, N.C.; Schumann, P.; Li, W.-J.; Göker, M. Genome-Scale Data Call for a Taxonomic Rearrangement of Geodermatophilaceae. Front. Microbiol. 2017, 8, 2501. [Google Scholar] [CrossRef] [Green Version]
  17. Breider, S.; Scheuner, C.; Schumann, P.; Fiebig, A.; Petersen, J.; Pradella, S.; Klenk, H.-P.; Brinkhoff, T.; Göker, M. Genome-Scale Data Suggest Reclassifications in the Leisingera-Phaeobacter Cluster Including Proposals for Sedimentitalea Gen. Nov. and Pseudophaeobacter Gen. Nov. Front. Microbiol. 2014, 5, 416. [Google Scholar] [CrossRef]
  18. Klenk, H.-P.; Göker, M. En Route to a Genome-Based Classification of Archaea and Bacteria? Syst. Appl. Microbiol. 2010, 33, 175–182. [Google Scholar] [CrossRef]
  19. Hennig, W. Phylogenetic Systematics. Annu. Rev. Entomol. 1965, 10, 97–116. [Google Scholar] [CrossRef]
  20. Vaghefi, N.; Adorada, D.L.; Huth, L.; Kelly, L.A.; Poudel, B.; Young, A.; Sparks, A.H. Whole-Genome Data from Curtobacterium flaccumfaciens Pv. flaccumfaciens Strains Associated with Tan Spot of Mungbean and Soybean Reveal Diverse Plasmid Profiles. Mol. Plant-Microbe Interact. 2021, 34, 1216–1222. [Google Scholar] [CrossRef]
  21. Osdaghi, E.; Taghavi, S.M.; Calamai, S.; Biancalani, C.; Cerboneschi, M.; Tegli, S.; Harveson, R.M. Phenotypic and Molecular-Phylogenetic Analysis Provide Novel Insights into the Diversity of Curtobacterium flaccumfaciens. Phytopathology 2018, 108, 1154–1164. [Google Scholar] [CrossRef] [Green Version]
  22. Chen, G.; Khojasteh, M.; Taheri-Dehkordi, A.; Taghavi, S.M.; Rahimi, T.; Osdaghi, E. Complete Genome Sequencing Provides Novel Insight Into the Virulence Repertories and Phylogenetic Position of Dry Beans Pathogen Curtobacterium flaccumfaciens Pv. Flaccumfaciens. Phytopathology 2021, 111, 268–280. [Google Scholar] [CrossRef] [PubMed]
  23. O’Leary, M.L.; Gilbertson, R.L. Complete Genome Sequence Resource of a Strain of Curtobacterium flaccumfaciens Pv. Flaccumfaciens, the Causal Agent of Bacterial Wilt of Common Bean, from Turkey. Phytopathology 2020, 110, 2010–2013. [Google Scholar] [CrossRef] [PubMed]
  24. NCBI. Home—Genome. Available online: https://www.ncbi.nlm.nih.gov/genome (accessed on 11 November 2021).
  25. Seemann, T. Prokka: Rapid Prokaryotic Genome Annotation. Bioinform. Oxf. Engl. 2014, 30, 2068–2069. [Google Scholar] [CrossRef] [PubMed]
  26. Hyatt, D.; Chen, G.-L.; LoCascio, P.F.; Land, M.L.; Larimer, F.W.; Hauser, L.J. Prodigal: Prokaryotic Gene Recognition and Translation Initiation Site Identification. BMC Bioinform. 2010, 11, 119. [Google Scholar] [CrossRef] [Green Version]
  27. Seemann, T. Barrnap. Available online: https://github.com/tseemann/barrnap (accessed on 27 November 2021).
  28. Geneious|Bioinformatics Software for Sequence Data Analysis. Available online: https://www.geneious.com/ (accessed on 11 November 2021).
  29. Delcher, A.L.; Bratke, K.A.; Powers, E.C.; Salzberg, S.L. Identifying Bacterial Genes and Endosymbiont DNA with Glimmer. Bioinform. Oxf. Engl. 2007, 23, 673–679. [Google Scholar] [CrossRef]
  30. Altschul, S.F.; Gish, W.; Miller, W.; Myers, E.W.; Lipman, D.J. Basic Local Alignment Search Tool. J. Mol. Biol. 1990, 215, 403–410. [Google Scholar] [CrossRef]
  31. Gabler, F.; Nam, S.-Z.; Till, S.; Mirdita, M.; Steinegger, M.; Söding, J.; Lupas, A.N.; Alva, V. Protein Sequence Analysis Using the MPI Bioinformatics Toolkit. Curr. Protoc. Bioinform. 2020, 72, e108. [Google Scholar] [CrossRef]
  32. Kelley, L.A.; Mezulis, S.; Yates, C.M.; Wass, M.N.; Sternberg, M.J.E. The Phyre2 Web Portal for Protein Modeling, Prediction and Analysis. Nat. Protoc. 2015, 10, 845–858. [Google Scholar] [CrossRef] [Green Version]
  33. Mitchell, A.L.; Attwood, T.K.; Babbitt, P.C.; Blum, M.; Bork, P.; Bridge, A.; Brown, S.D.; Chang, H.-Y.; El-Gebali, S.; Fraser, M.I.; et al. InterPro in 2019: Improving Coverage, Classification and Access to Protein Sequence Annotations. Nucleic Acids Res. 2019, 47, D351–D360. [Google Scholar] [CrossRef] [Green Version]
  34. Sullivan, M.J.; Petty, N.K.; Beatson, S.A. Easyfig: A Genome Comparison Visualizer. Bioinformatics 2011, 27, 1009–1010. [Google Scholar] [CrossRef]
  35. Lee, I.; Ouk Kim, Y.; Park, S.-C.; Chun, J. OrthoANI: An Improved Algorithm and Software for Calculating Average Nucleotide Identity. Int. J. Syst. Evol. Microbiol. 2016, 66, 1100–1103. [Google Scholar] [CrossRef] [PubMed]
  36. Dereeper, A.; Guignon, V.; Blanc, G.; Audic, S.; Buffet, S.; Chevenet, F.; Dufayard, J.-F.; Guindon, S.; Lefort, V.; Lescot, M.; et al. Phylogeny.Fr: Robust Phylogenetic Analysis for the Non-Specialist. Nucleic Acids Res. 2008, 36, W465–W469. [Google Scholar] [CrossRef] [PubMed]
  37. Gascuel, O. BIONJ: An Improved Version of the NJ Algorithm Based on a Simple Model of Sequence Data. Mol. Biol. Evol. 1997, 14, 685–695. [Google Scholar] [CrossRef] [PubMed] [Green Version]
  38. Letunic, I.; Bork, P. Interactive Tree Of Life (ITOL) v5: An Online Tool for Phylogenetic Tree Display and Annotation. Nucleic Acids Res. 2021, 49, W293–W296. [Google Scholar] [CrossRef]
  39. Katoh, K.; Misawa, K.; Kuma, K.; Miyata, T. MAFFT: A Novel Method for Rapid Multiple Sequence Alignment Based on Fast Fourier Transform. Nucleic Acids Res. 2002, 30, 3059–3066. [Google Scholar] [CrossRef] [Green Version]
  40. Kumar, S.; Stecher, G.; Li, M.; Knyaz, C.; Tamura, K. MEGA X: Molecular Evolutionary Genetics Analysis across Computing Platforms. Mol. Biol. Evol. 2018, 35, 1547–1549. [Google Scholar] [CrossRef]
  41. Stamatakis, A. RAxML Version 8: A Tool for Phylogenetic Analysis and Post-Analysis of Large Phylogenies. Bioinform. Oxf. Engl. 2014, 30, 1312–1313. [Google Scholar] [CrossRef]
  42. Tamura, K.; Nei, M. Estimation of the Number of Nucleotide Substitutions in the Control Region of Mitochondrial DNA in Humans and Chimpanzees. Mol. Biol. Evol. 1993, 10, 512–526. [Google Scholar] [CrossRef]
  43. Nei, M.; Kumar, S. Molecular Evolution and Phylogenetics; Oxford University Press: Oxford, NY, USA, 2000; ISBN 978-0-19-513585-5. [Google Scholar]
  44. Tonkin-Hill, G.; MacAlasdair, N.; Ruis, C.; Weimann, A.; Horesh, G.; Lees, J.A.; Gladstone, R.A.; Lo, S.; Beaudoin, C.; Floto, R.A.; et al. Producing Polished Prokaryotic Pangenomes with the Panaroo Pipeline. Genome Biol. 2020, 21, 180. [Google Scholar] [CrossRef]
  45. Jumper, J.; Evans, R.; Pritzel, A.; Green, T.; Figurnov, M.; Ronneberger, O.; Tunyasuvunakool, K.; Bates, R.; Žídek, A.; Potapenko, A.; et al. Highly Accurate Protein Structure Prediction with AlphaFold. Nature 2021, 596, 583–589. [Google Scholar] [CrossRef]
  46. Yang, J.; Yan, R.; Roy, A.; Xu, D.; Poisson, J.; Zhang, Y. The I-TASSER Suite: Protein Structure and Function Prediction. Nat. Methods 2015, 12, 7–8. [Google Scholar] [CrossRef] [PubMed] [Green Version]
  47. Zhang, Y. I-TASSER Server for Protein 3D Structure Prediction. BMC Bioinform. 2008, 9, 40. [Google Scholar] [CrossRef] [PubMed] [Green Version]
  48. Raman, S.; Vernon, R.; Thompson, J.; Tyka, M.; Sadreyev, R.; Pei, J.; Kim, D.; Kellogg, E.; DiMaio, F.; Lange, O.; et al. Structure Prediction for CASP8 with All-Atom Refinement Using Rosetta. Proteins 2009, 77, 89–99. [Google Scholar] [CrossRef] [Green Version]
  49. Baek, M.; DiMaio, F.; Anishchenko, I.; Dauparas, J.; Ovchinnikov, S.; Lee, G.R.; Wang, J.; Cong, Q.; Kinch, L.N.; Schaeffer, R.D.; et al. Accurate Prediction of Protein Structures and Interactions Using a Three-Track Neural Network. Science 2021, 373, 871–876. [Google Scholar] [CrossRef] [PubMed]
  50. McGuffin, L.J.; Aldowsari, F.M.F.; Alharbi, S.M.A.; Adiyaman, R. ModFOLD8: Accurate Global and Local Quality Estimates for 3D Protein Models. Nucleic Acids Res. 2021, 49, W425–W430. [Google Scholar] [CrossRef] [PubMed]
  51. Adiyaman, R.; McGuffin, L.J. ReFOLD3: Refinement of 3D Protein Models with Gradual Restraints Based on Predicted Local Quality and Residue Contacts. Nucleic Acids Res. 2021, 49, W589–W596. [Google Scholar] [CrossRef] [PubMed]
  52. PyMOL|Pymol.Org. Available online: https://pymol.org/2/ (accessed on 11 November 2021).
  53. Primer3Plus. Available online: https://primer3plus.com/ (accessed on 25 November 2021).
  54. Maringoni, A.C.; Camara, R.C.; Souza, V.L. Semi-Selective Culture Medium for Curtobacterium flaccumfaciens Pv. Flaccumfaciens Isolation from Bean Seeds. Seed Sci. Technol. 2006, 34, 117–124. [Google Scholar] [CrossRef]
  55. Lukianova, A.A.; Evseev, P.V.; Stakheev, A.A.; Kotova, I.B.; Zavriev, S.K.; Ignatov, A.N.; Miroshnikov, K.A. Development of QPCR Detection Assay for Potato Pathogen Pectobacterium Atrosepticum Based on a Unique Target Sequence. Plants 2021, 10, 355. [Google Scholar] [CrossRef]
  56. Lukianova, A.; Evseev, P.; Tokmakova, A.; Ignatov, A.; Miroshnikov, K. Analysis of Updated Pectobacteriaceae Sequences Highlights the Need for Taxonomy Revisions. In Proceedings of the 2021 IEEE Ural-Siberian Conference on Computational Technologies in Cognitive Science, Genomics and Biomedicine (CSGB), Novosibirsk-Yekaterinburg, Russia, 26–28 May 2021; pp. 320–324. [Google Scholar]
  57. Sentausa, E.; Fournier, P.-E. Advantages and Limitations of Genomics in Prokaryotic Taxonomy. Clin. Microbiol. Infect. Off. Publ. Eur. Soc. Clin. Microbiol. Infect. Dis. 2013, 19, 790–795. [Google Scholar] [CrossRef] [Green Version]
  58. Thompson, C.C.; Chimetto, L.; Edwards, R.A.; Swings, J.; Stackebrandt, E.; Thompson, F.L. Microbial Genomic Taxonomy. BMC Genomics 2013, 14, 913. [Google Scholar] [CrossRef] [Green Version]
  59. Rosselló-Móra, R.; Amann, R. Past and Future Species Definitions for Bacteria and Archaea. Syst. Appl. Microbiol. 2015, 38, 209–216. [Google Scholar] [CrossRef]
  60. Chun, J.; Oren, A.; Ventosa, A.; Christensen, H.; Arahal, D.R.; da Costa, M.S.; Rooney, A.P.; Yi, H.; Xu, X.-W.; De Meyer, S.; et al. Proposed Minimal Standards for the Use of Genome Data for the Taxonomy of Prokaryotes. Int. J. Syst. Evol. Microbiol. 2018, 68, 461–466. [Google Scholar] [CrossRef]
  61. Figueras, M.J.; Beaz-Hidalgo, R.; Hossain, M.J.; Liles, M.R. Taxonomic Affiliation of New Genomes Should Be Verified Using Average Nucleotide Identity and Multilocus Phylogenetic Analysis. Genome Announc. 2014, 2, e00927-14. [Google Scholar] [CrossRef] [Green Version]
  62. Jain, C.; Rodriguez-R, L.M.; Phillippy, A.M.; Konstantinidis, K.T.; Aluru, S. High Throughput ANI Analysis of 90K Prokaryotic Genomes Reveals Clear Species Boundaries. Nat. Commun. 2018, 9, 5114. [Google Scholar] [CrossRef] [Green Version]
  63. Zhang, Y.; Qiu, S. Examining Phylogenetic Relationships of Erwinia and Pantoea Species Using Whole Genome Sequence Data. Antonie Leeuwenhoek 2015, 108, 1037–1046. [Google Scholar] [CrossRef]
  64. Goris, J.; Konstantinidis, K.T.; Klappenbach, J.A.; Coenye, T.; Vandamme, P.; Tiedje, J.M. DNA-DNA Hybridization Values and Their Relationship to Whole-Genome Sequence Similarities. Int. J. Syst. Evol. Microbiol. 2007, 57, 81–91. [Google Scholar] [CrossRef] [Green Version]
  65. Richter, M.; Rosselló-Móra, R. Shifting the Genomic Gold Standard for the Prokaryotic Species Definition. Proc. Natl. Acad. Sci. USA 2009, 106, 19126–19131. [Google Scholar] [CrossRef] [Green Version]
  66. Kostas Lab|ANI Calculator. Available online: http://enve-omics.ce.gatech.edu/ani/ (accessed on 12 November 2021).
  67. Ågren, J.; Sundström, A.; Håfström, T.; Segerman, B. Gegenees: Fragmented Alignment of Multiple Genomes for Determining Phylogenomic Distances and Genetic Signatures Unique for Specified Target Groups. PLoS ONE 2012, 7, e39107. [Google Scholar] [CrossRef]
  68. USEARCH Download. Available online: https://drive5.com/usearch/download.html (accessed on 12 November 2021).
  69. Barco, R.A.; Garrity, G.M.; Scott, J.J.; Amend, J.P.; Nealson, K.H.; Emerson, D. A Genus Definition for Bacteria and Archaea Based on a Standard Genome Relatedness Index. mBio 2020, 11, e02475-19. [Google Scholar] [CrossRef] [Green Version]
  70. Mysara, M.; Vandamme, P.; Props, R.; Kerckhof, F.-M.; Leys, N.; Boon, N.; Raes, J.; Monsieurs, P. Reconciliation between Operational Taxonomic Units and Species Boundaries. FEMS Microbiol. Ecol. 2017, 93. [Google Scholar] [CrossRef]
  71. Ludwig, W.; Schleifer, K.H. Bacterial Phylogeny Based on 16S and 23S RRNA Sequence Analysis. FEMS Microbiol. Rev. 1994, 15, 155–173. [Google Scholar] [CrossRef] [PubMed]
  72. Větrovský, T.; Baldrian, P. The Variability of the 16S RRNA Gene in Bacterial Genomes and Its Consequences for Bacterial Community Analyses. PLoS ONE 2013, 8, e57923. [Google Scholar] [CrossRef] [PubMed] [Green Version]
  73. Espejo, R.T.; Plaza, N. Multiple Ribosomal RNA Operons in Bacteria; Their Concerted Evolution and Potential Consequences on the Rate of Evolution of Their 16S RRNA. Front. Microbiol. 2018, 9, 1232. [Google Scholar] [CrossRef] [PubMed]
  74. Yamamoto, S.; Harayama, S. PCR Amplification and Direct Sequencing of GyrB Genes with Universal Primers and Their Application to the Detection and Taxonomic Analysis of Pseudomonas Putida Strains. Appl. Environ. Microbiol. 1995, 61, 1104–1109. [Google Scholar] [CrossRef] [Green Version]
  75. Huang, W.M. Bacterial Diversity Based on Type II DNA Topoisomerase Genes. Annu. Rev. Genet. 1996, 30, 79–107. [Google Scholar] [CrossRef]
  76. Park, H.K.; Yoon, J.W.; Shin, J.W.; Kim, J.Y.; Kim, W. RpoA Is a Useful Gene for Identification and Classification of Streptococcus Pneumoniae from the Closely Related Viridans Group Streptococci. FEMS Microbiol. Lett. 2010, 305, 58–64. [Google Scholar] [CrossRef] [Green Version]
  77. Soler, L.; Figueras, M.J.; Chacón, M.R.; Guarro, J.; Martinez-Murcia, A.J. Comparison of Three Molecular Methods for Typing Aeromonas Popoffii Isolates. Antonie Leeuwenhoek 2003, 83, 341–349. [Google Scholar] [CrossRef]
  78. Küpfer, M.; Kuhnert, P.; Korczak, B.M.; Peduzzi, R.; Demarta, A. Genetic Relationships of Aeromonas Strains Inferred from 16S RRNA, GyrB and RpoB Gene Sequences. Int. J. Syst. Evol. Microbiol. 2006, 56, 2743–2751. [Google Scholar] [CrossRef] [Green Version]
  79. Fang, Y.; Wang, Y.; Liu, Z.; Dai, H.; Cai, H.; Li, Z.; Du, Z.; Wang, X.; Jing, H.; Wei, Q.; et al. Multilocus Sequence Analysis, a Rapid and Accurate Tool for Taxonomic Classification, Evolutionary Relationship Determination, and Population Biology Studies of the Genus Shewanella. Appl. Environ. Microbiol. 2019, 85, e03126-18. [Google Scholar] [CrossRef] [Green Version]
  80. Ramulu, H.G.; Groussin, M.; Talla, E.; Planel, R.; Daubin, V.; Brochier-Armanet, C. Ribosomal Proteins: Toward a next Generation Standard for Prokaryotic Systematics? Mol. Phylogenet. Evol. 2014, 75, 103–117. [Google Scholar] [CrossRef]
  81. Wolf, Y.I.; Rogozin, I.B.; Grishin, N.V.; Tatusov, R.L.; Koonin, E.V. Genome Trees Constructed Using Five Different Approaches Suggest New Major Bacterial Clades. BMC Evol. Biol. 2001, 1, 8. [Google Scholar] [CrossRef]
  82. Roberts, E.; Sethi, A.; Montoya, J.; Woese, C.R.; Luthey-Schulten, Z. Molecular Signatures of Ribosomal Evolution. Proc. Natl. Acad. Sci. USA 2008, 105, 13953–13958. [Google Scholar] [CrossRef] [Green Version]
  83. Jolley, K.A.; Bliss, C.M.; Bennett, J.S.; Bratcher, H.B.; Brehony, C.; Colles, F.M.; Wimalarathna, H.; Harrison, O.B.; Sheppard, S.K.; Cody, A.J.; et al. Ribosomal Multilocus Sequence Typing: Universal Characterization of Bacteria from Domain to Strain. Microbiol. Read. Engl. 2012, 158, 1005–1015. [Google Scholar] [CrossRef]
  84. Yutin, N.; Puigbò, P.; Koonin, E.V.; Wolf, Y.I. Phylogenomics of Prokaryotic Ribosomal Proteins. PLoS ONE 2012, 7, e36972. [Google Scholar] [CrossRef] [Green Version]
  85. Martini, M.; Lee, I.-M.; Bottner, K.D.; Zhao, Y.; Botti, S.; Bertaccini, A.; Harrison, N.A.; Carraro, L.; Marcone, C.; Khan, A.J.; et al. Ribosomal Protein Gene-Based Phylogeny for Finer Differentiation and Classification of Phytoplasmas. Int. J. Syst. Evol. Microbiol. 2007, 57, 2037–2051. [Google Scholar] [CrossRef]
  86. Pem, D.; Jeewon, R.; Selcuk, F.; Ulukapi, M.; Bhat, J.; Doilom, M.; Lumyong, S.; Hyde, K.D. Ribosomal and Protein Gene Phylogeny Reveals Novel Saprobic Fungal Species From Juglans Regia and Urtica Dioica. Front. Microbiol. 2020, 11, 1303. [Google Scholar] [CrossRef]
  87. Ciccarelli, F.D.; Doerks, T.; von Mering, C.; Creevey, C.J.; Snel, B.; Bork, P. Toward Automatic Reconstruction of a Highly Resolved Tree of Life. Science 2006, 311, 1283–1287. [Google Scholar] [CrossRef] [Green Version]
  88. Inglin, R.C.; Meile, L.; Stevens, M.J.A. Clustering of Pan- and Core-Genome of Lactobacillus Provides Novel Evolutionary Insights for Differentiation. BMC Genomics 2018, 19, 284. [Google Scholar] [CrossRef]
  89. Wu, M.; Scott, A.J. Phylogenomic Analysis of Bacterial and Archaeal Sequences with AMPHORA2. Bioinform. Oxf. Engl. 2012, 28, 1033–1034. [Google Scholar] [CrossRef]
  90. Segata, N.; Börnigen, D.; Morgan, X.C.; Huttenhower, C. PhyloPhlAn Is a New Method for Improved Phylogenetic and Taxonomic Placement of Microbes. Nat. Commun. 2013, 4, 2304. [Google Scholar] [CrossRef]
  91. Blanco, L.; Salas, M. Replication of Phage Phi 29 DNA with Purified Terminal Protein and DNA Polymerase: Synthesis of Full-Length Phi 29 DNA. Proc. Natl. Acad. Sci. USA 1985, 82, 6404–6408. [Google Scholar] [CrossRef] [PubMed] [Green Version]
  92. Komagata, K.; Iizuka, K. Studies on the Microorganisms of Cereal Grains. Part VII. New Species of Brevibacterium Isolated from Rice. J. Agr. Chem. Soc. 1964, 38, 496–502. [Google Scholar]
  93. Aizawa, T.; Ve, N.B.; Kimoto, K.I.; Iwabuchi, N.; Sumida, H.; Hasegawa, I.; Sasaki, S.; Tamura, T.; Kudo, T.; Suzuki, K.I.; et al. Curtobacterium ammoniigenes sp. nov., an Ammonia-Producing Bacterium Isolated from Plants Inhabiting Acidic Swamps in Actual Acid Sulfate Soil Areas of Vietnam. Int. J. Syst. Evol. Microbiol. 2007, 57, 1447–1452. [Google Scholar] [CrossRef] [PubMed] [Green Version]
  94. Behrendt, U.; Ulrich, A.; Schumann, P.; Naumann, D.; Suzuki, K. 2002 Diversity of Grass-Associated Microbacteriaceae Isolated from the Phyllosphere and Litter Layer after Mulching the Sward; Polyphasic Characterization of Subtercola pratensis sp. nov., Curtobacterium herbarum sp. nov. and Plantibacter flavus Gen. Nov., sp. Nov. Int. J. Syst. Evol. Microbiol. 2002, 52, 1441–1454. [Google Scholar] [CrossRef] [PubMed] [Green Version]
  95. Carty, C.E.; Litchfield, C.D. Characterization of a New Marine Sedimentary Bacterium as Flavobacterium Oceanosedimentum Sp. Nov. Int. J. Syst. Bacteriol. 1978, 28, 561–566. [Google Scholar] [CrossRef] [Green Version]
  96. Seaton, S.; Lemaire, J.; Inderbitzin, P.; Knight-Connoni, V.; White, J.F.; Trujillo, M.E. Curtobacterium glycinis sp. nov. from Glycine max, Curtobacterium gossypii sp. nov. from Gossypium hirsutum and Curtobacterium oryzae sp. nov. from Oryza sativa, Three New Curtobacterium Species and Endophytes from Agricultural Crops. bioRxiv 2021. [Google Scholar] [CrossRef]
  97. Kim, M.; Oh, H.-S.; Park, S.-C.; Chun, J. Towards a Taxonomic Coherence between Average Nucleotide Identity and 16S RRNA Gene Sequence Similarity for Species Demarcation of Prokaryotes. Int. J. Syst. Evol. Microbiol. 2014, 64, 346–351. [Google Scholar] [CrossRef]
  98. Gonçalves, R.M.; Balbi-Peña, M.I.; Soman, J.M.; Maringoni, A.C.; Taghouti, G.; Fischer-Le Saux, M.; Portier, P. Genetic Diversity of Curtobacterium flaccumfaciens Revealed by Multilocus Sequence Analysis. Eur. J. Plant Pathol. 2019, 154, 189–202. [Google Scholar] [CrossRef]
  99. Dimkić, I.; Bhardwaj, V.; Carpentieri-Pipolo, V.; Kuzmanović, N.; Degrassi, G. The Chitinolytic Activity of the Curtobacterium Sp. Isolated from Field-Grown Soybean and Analysis of Its Genome Sequence. PLoS ONE 2021, 16, e0259465. [Google Scholar] [CrossRef]
  100. Murray, C.S.; Gao, Y.; Wu, M. Re-Evaluating the Evidence for a Universal Genetic Boundary among Microbial Species. Nat. Commun. 2021, 12, 4059. [Google Scholar] [CrossRef]
  101. Rodriguez-R, L.M.; Jain, C.; Conrad, R.E.; Aluru, S.; Konstantinidis, K.T. Reply to: “Re-Evaluating the Evidence for a Universal Genetic Boundary among Microbial Species”. Nat. Commun. 2021, 12, 4060. [Google Scholar] [CrossRef]
  102. Schierstaedt, J.; Bziuk, N.; Kuzmanović, N.; Blau, K.; Smalla, K.; Jechalke, S. Role of Plasmids in Plant-Bacteria Interactions. Curr. Issues Mol. Biol. 2019, 30, 17–38. [Google Scholar] [CrossRef]
  103. Wolter, L.A.; Wietz, M.; Ziesche, L.; Breider, S.; Leinberger, J.; Poehlein, A.; Daniel, R.; Schulz, S.; Brinkhoff, T. Pseudooceanicola Algae Sp. Nov., Isolated from the Marine Macroalga Fucus Spiralis, Shows Genomic and Physiological Adaptations for an Algae-Associated Lifestyle. Syst. Appl. Microbiol. 2021, 44, 126166. [Google Scholar] [CrossRef]
  104. Sundin, G.W. Genomic Insights into the Contribution of Phytopathogenic Bacterial Plasmids to the Evolutionary History of Their Hosts. Annu. Rev. Phytopathol. 2007, 45, 129–151. [Google Scholar] [CrossRef]
  105. Brader, G.; Compant, S.; Vescio, K.; Mitter, B.; Trognitz, F.; Ma, L.-J.; Sessitsch, A. Ecology and Genomic Insights into Plant-Pathogenic and Plant-Nonpathogenic Endophytes. Annu. Rev. Phytopathol. 2017, 55, 61–83. [Google Scholar] [CrossRef]
  106. Leger, R.J.S.; Joshi, L.; Roberts, D.W. Adaptation of Proteases and Carbohydrates of Saprophytic, Phytopathogenic and Entomopathogenic Fungi to the Requirements of Their Ecological Niches. Microbiol. Read. Engl. 1997, 143 Pt 6, 1983–1992. [Google Scholar] [CrossRef] [Green Version]
  107. Inácio, F.D.; Ferreira, R.O.; de Araujo, C.A.V.; Brugnari, T.; Castoldi, R.; Peralta, R.M.; Souza, C.G.M. de Proteases of Wood Rot Fungi with Emphasis on the Genus Pleurotus. BioMed Res. Int. 2015, 2015, e290161. [Google Scholar] [CrossRef] [Green Version]
  108. Gill, S.; Krupovic, M.; Desnoues, N.; Béguin, P.; Sezonov, G.; Forterre, P. A Highly Divergent Archaeo-Eukaryotic Primase from the Thermococcus Nautilus Plasmid, PTN2. Nucleic Acids Res. 2014, 42, 3707–3719. [Google Scholar] [CrossRef]
  109. Sarkisian, N.N.; Antonian, R.G.; Svetlova, M.P.; Ktsoian, Z.A.; Tomilin, N.V. [R-factor from the natural strain of Salmonella derby carrying a DNA-polymerase gene]. Biokhimiia Mosc. Russ. 1985, 50, 673–679. [Google Scholar]
  110. Kolkenbrock, S.; Naumann, B.; Hippler, M.; Fetzner, S. A Novel Replicative Enzyme Encoded by the Linear Arthrobacter Plasmid PAL1. J. Bacteriol. 2010, 192, 4935–4943. [Google Scholar] [CrossRef] [Green Version]
  111. Goldsmith, M.; Sarov-Blat, L.; Livneh, Z. Plasmid-Encoded MucB Protein Is a DNA Polymerase (Pol RI) Specialized for Lesion Bypass in the Presence of MucA’, RecA, and SSB. Proc. Natl. Acad. Sci. USA 2000, 97, 11227–11231. [Google Scholar] [CrossRef] [PubMed] [Green Version]
  112. Tark, M.; Tover, A.; Tarassova, K.; Tegova, R.; Kivi, G.; Hõrak, R.; Kivisaar, M. A DNA Polymerase V Homologue Encoded by TOL Plasmid PWW0 Confers Evolutionary Fitness on Pseudomonas Putida under Conditions of Environmental Stress. J. Bacteriol. 2005, 187, 5203–5213. [Google Scholar] [CrossRef] [PubMed] [Green Version]
  113. Kim, E.K.; Jeong, J.H.; Youn, H.S.; Koo, Y.B.; Roe, J.H. The Terminal Protein of a Linear Mitochondrial Plasmid Is Encoded in the N-Terminus of the DNA Polymerase Gene in White-Rot Fungus Pleurotus Ostreatus. Curr. Genet. 2000, 38, 283–290. [Google Scholar] [CrossRef]
  114. Andrade, B.S.; Taranto, A.G.; Góes-Neto, A.; Duarte, A.A. Comparative Modeling of DNA and RNA Polymerases from Moniliophthora Perniciosa Mitochondrial Plasmid. Theor. Biol. Med. Model. 2009, 6, 22. [Google Scholar] [CrossRef] [Green Version]
  115. Fukuda, K.; Maebuchi, M.; Takata, H.; Gunge, N. The Linear Plasmid PDHL1 from Debaryomyces Hansenii Encodes a Protein Highly Homologous to the PGKL1-Plasmid DNA Polymerase. Yeast Chichester Engl. 1997, 13, 613–620. [Google Scholar] [CrossRef]
  116. Hermanns, J.; Osiewacz, H.D. The Linear Mitochondrial Plasmid PAL2-1 of a Long-Lived Podospora Anserina Mutant Is an Invertron Encoding a DNA and RNA Polymerase. Curr. Genet. 1992, 22, 491–500. [Google Scholar] [CrossRef]
  117. Li, Q.; Nargang, F.E. Two Neurospora Mitochondrial Plasmids Encode DNA Polymerases Containing Motifs Characteristic of Family B DNA Polymerases but Lack the Sequence Asp-Thr-Asp. Proc. Natl. Acad. Sci. USA 1993, 90, 4299–4303. [Google Scholar] [CrossRef] [Green Version]
  118. Jung, G.H.; Leavitt, M.C.; Ito, J. Yeast Killer Plasmid PGKL1 Encodes a DNA Polymerase Belonging to the Family B DNA Polymerases. Nucleic Acids Res. 1987, 15, 9088. [Google Scholar] [CrossRef] [Green Version]
  119. Oeser, B.; Tudzynski, P. The Linear Mitochondrial Plasmid PClK1 of the Phytopathogenic Fungus Claviceps Purpurea May Code for a DNA Polymerase and an RNA Polymerase. Mol. Gen. Genet. MGG 1989, 217, 132–140. [Google Scholar] [CrossRef]
  120. Ravin, N.V. N15: The Linear Phage-Plasmid. Plasmid 2011, 65, 102–109. [Google Scholar] [CrossRef]
  121. Jannière, L.; Bidnenko, V.; McGovern, S.; Ehrlich, S.D.; Petit, M.A. Replication Terminus for DNA Polymerase I during Initiation of PAM Beta 1 Replication: Role of the Plasmid-Encoded Resolution System. Mol. Microbiol. 1997, 23, 525–535. [Google Scholar] [CrossRef]
  122. Díaz, A.; Lacks, S.A.; López, P. Multiple Roles for DNA Polymerase I in Establishment and Replication of the Promiscuous Plasmid PLS1. Mol. Microbiol. 1994, 14, 773–783. [Google Scholar] [CrossRef]
  123. Allen, J.M.; Simcha, D.M.; Ericson, N.G.; Alexander, D.L.; Marquette, J.T.; Van Biber, B.P.; Troll, C.J.; Karchin, R.; Bielas, J.H.; Loeb, L.A.; et al. Roles of DNA Polymerase I in Leading and Lagging-Strand Replication Defined by a High-Resolution Mutation Footprint of ColE1 Plasmid Replication. Nucleic Acids Res. 2011, 39, 7020–7033. [Google Scholar] [CrossRef] [Green Version]
  124. Guimaraĕs, P.M.; Palmano, S.; Smith, J.J.; Grossi de Sá, M.F.; Saddler, G.S. Development of a PCR Test for the Detection of Curtobacterium flaccumfaciens Pv. Flaccumfaciens. Antonie Van Leeuwenhoek 2001, 80, 1–10. [Google Scholar] [CrossRef]
  125. Zijlstra, C.; De Haas, L.G.; Krijger, M.; Verstappen, E.; Warris, S.; de Haan, E.; van der Wolf, J. Development and Evaluation of Two TaqMan Assays for Generic Detection of Dickeya Species. Eur. J. Plant Pathol. 2020, 156, 311–316. [Google Scholar] [CrossRef] [Green Version]
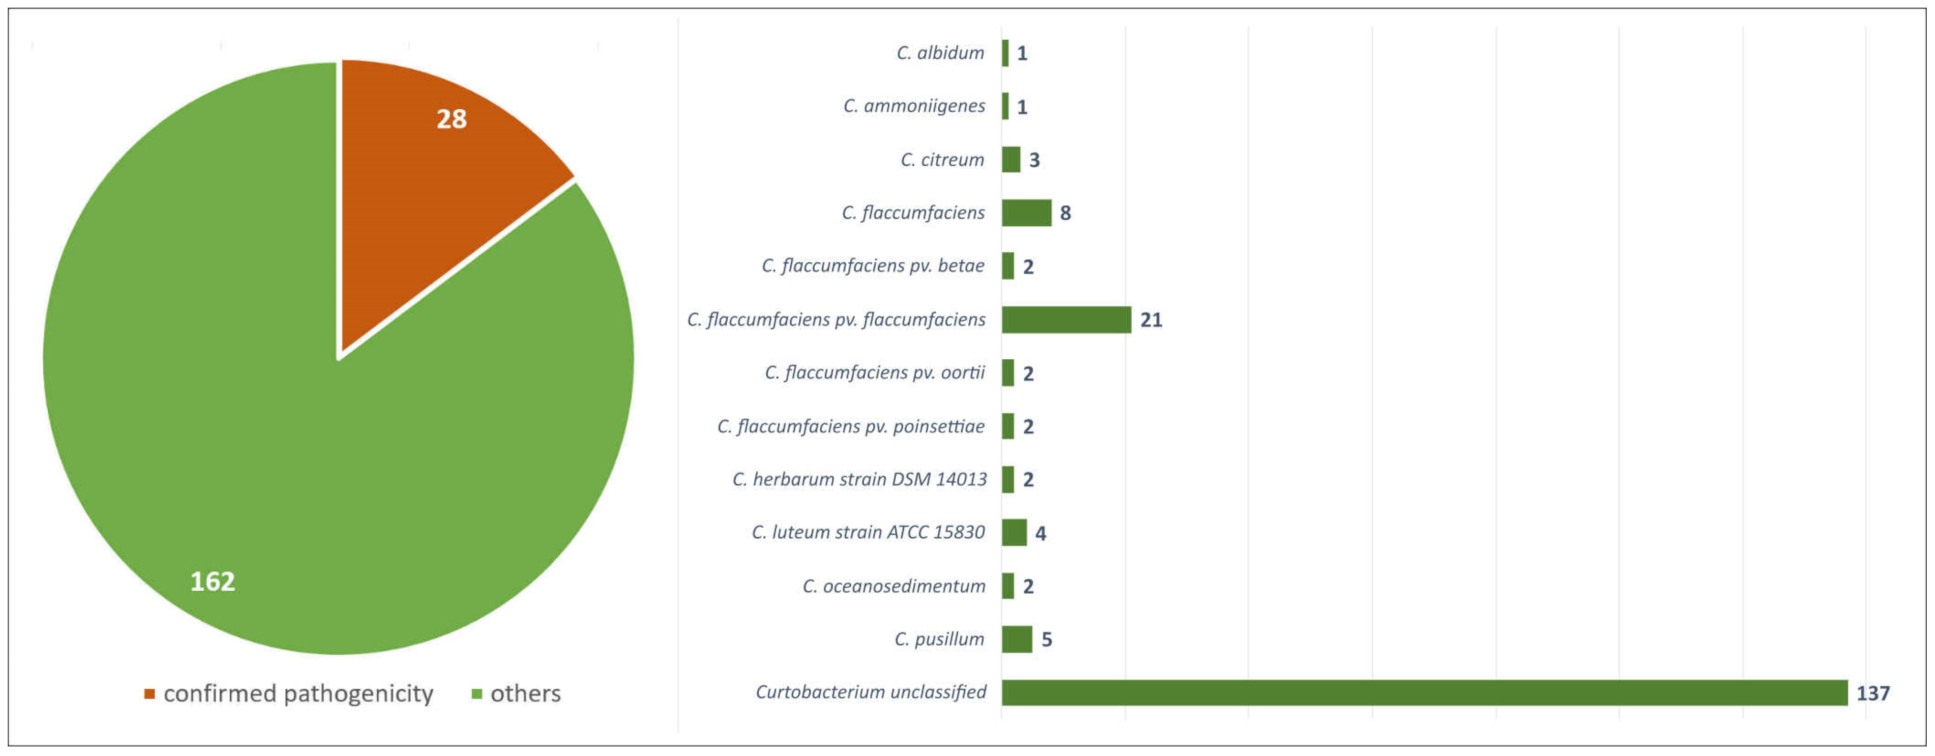
Figure 1. Statistics on 190 Curtobacterium genomes deposited in the NCBI database as of October 2021.
Cimb 44 00060 g001
Figure 2. ANI tree plotted applying BioNJ clustering on 190 Curtobacterium genomes and Gryllotalpicola ginnsengisoli DSM 22003. The abbreviations are as follows: C.—Curtobacterium, G.—Gryllotalpicola, C. f.Curtobacterium flaccumfaciens, and C. fpfflaccumfaciens pv. flaccumfaciens. The C. fpf strains with confirmed pathogenicity are coloured yellow-orange. The scale bar shows 2% calculated genetic distance obtained by ANI calculations, and the trees were rooted to Gryllotalpicola ginnsengisoli DSM 22003. ANI values compared to the C. fpf CFBP 3418-type strain are shown to the right of the organism’s name and coloured according to a heat map scale.
Cimb 44 00060 g002aCimb 44 00060 g002b
Figure 3. Best-scoring phylogenetic trees obtained with RAxML using concatenated nucleotide sequences’ alignments of ribosomal proteins extracted from 190 Curtobacterium genomes and Gryllotalpicola ginnsengisoli DSM 22003. The abbreviations are as follows: C.—Curtobacterium, G.—Gryllotalpicola, C. f.Curtobacterium flaccumfaciens, and C. fpfflaccumfaciens pv. flaccumfaciens. The C. fpf strains with confirmed pathogenicity are coloured yellow-orange. ANI values compared to the C. fpf CFBP 3418-type strain are shown to the right of the organism’s name and coloured according to a heat map scale. Bootstrap support values are shown near the branches of the rectangular tree as a percentage of 1000 replicates. The scale bar shows 0.05 estimated substitutions per site and the tree was rooted to Gryllotalpicola ginnsengisoli DSM 22003.
Cimb 44 00060 g003aCimb 44 00060 g003b
Figure 4. Best-scoring phylogenetic trees obtained with RAxML using 190 Curtobacterium genomes. The abbreviations are as follows: C.Curtobacterium, C. f.Curtobacterium flaccumfaciens, and C. fpfflaccumfaciens pv. flaccumfaciens. The C. fpf strains with confirmed pathogenicity are coloured yellow-orange. The group of 53 strains outlined with violet constitutes a possible reclassified species of C. flaccumfaciens, based on the ANI and phylogeny results. ANI values compared to the C. fpf CFBP 3418-type strain are shown to the right of the organism’s name and coloured according to a heat map scale. Bootstrap support values are shown near the branches of the rectangular tree as a percentage of 1000 replicates. The scale bar shows 0.1 estimated substitutions per site, and the tree was rooted to Curtobacterium ammoniigenes NBRC 101786.
Cimb 44 00060 g004aCimb 44 00060 g004b
Figure 5. ANI matrix obtained by BioNJ clustering on 190 Curtobacterium genomes. (A) Group of strains proposed to be classified as Curtobacterium flaccumfaciens. (BI) Clusters of strains containing proposed distinct genomospecies belonging to the genus of Curtobacterium. The strains which are coloured the same colour on the same image can be classified as representatives of the same genomospecies (Table 2). The abbreviations are as follows: C.—Curtobacterium, C. f.Curtobacterium flaccumfaciens, and C. fpfflaccumfaciens pv. flaccumfaciens.
Cimb 44 00060 g005aCimb 44 00060 g005bCimb 44 00060 g005cCimb 44 00060 g005d
Figure 6. Circular genomic map and functional assignments of the Curtobacterium flaccumfaciens pv. flaccumfaciens P990 plasmid pCff1. In total, 178 protein-coding genes are shown as coloured blocks. The genes found in genomes of strains with confirmed pathogenicity in 50% or more of the total BLASTP search results on 190 Curtobacterium genomes are coloured green. The other genes are coloured light magenta. The direction of transcription is shown by arrows. The GC content of the genome sequence is indicated by the internal blue line.
Cimb 44 00060 g006
Figure 7. Genome sequence comparison among six Curtobacterium and Clavibacter plasmids and chromosome regions exhibiting co-linearity as detected by TBLASTX. The percentage of the sequence similarity is indicated by the intensity of the grey colour. Vertical blocks between analysed sequences indicate regions with at least 16% similarity. The abbreviations are as follows: C.—Curtobacterium, Cl.Clavibacter, and C. fpfflaccumfaciens pv. flaccumfaciens.
Cimb 44 00060 g007
Figure 8. (A) Predicted structure of putative DNA polymerase from C. fpf P990 plasmid pCff1, the experimentally found structure of Bacillus phage φ29 DNA polymerase B complexed with DNA (PDB structure 2PY5) and their superimposition (RMSD 5.8 Å). The models are coloured based on a rainbow gradient scheme, where the N-terminus of the polypeptide chain is coloured blue, and the C-terminus is coloured red. (B) Superimposition of the predicted structure of putative DNA polymerase from plasmid pCff1, the predicted structure of pCff1 putative DNA polymerase and the experimentally found structure of φ29 DNA polymerase complexed with DNA using the protein surfaces. The arrows indicate the presence of similarly located cavities and tunnels in both proteins.
Cimb 44 00060 g008
Figure 9. Amplification curves were obtained from the experiment to assess the selectivity of qPCR. The Curtobacterium strains are marked in green. Strains of other genera are marked in red.
Cimb 44 00060 g009
Figure 10. Amplification curves of tenfold dilutions of the test plasmid. The numbers represent the corresponding dilution shown in Table 5.
Cimb 44 00060 g010
Figure 11. Standard curves obtained for dilutions of plasmid (A) and genomic (B) DNA.
Cimb 44 00060 g011
Table 1. Curtobacterium flaccumfaciens strains with confirmed pathogenicity.
NCBI AccessionStrainIsolation SourceSource
JABMCFC. f. strain LMG 3645 = CFBP3418beans1957 Klement, Z.
JAHEXDC. f. pv. betae strain CFBP 2402beet1955 Keyworth, W.G.
JAHEWWC. f. pv. betae strain CFBP 3401beetKeyworth, W.
JAFJLXC. f. pv. flaccumfaciens strain BRIP 70601mungbeanVaghefi, N.
CP074439C. f. pv. flaccumfaciens strain BRIP:70606mungbean-
JAFJLWC. f. pv. flaccumfaciens strain BRIP 70607mungbean-
JAFJLVC. f. pv. flaccumfaciens strain BRIP 70610mungbean-
CP071883C. f. pv. flaccumfaciens strain BRIP 70614mungbean-
JAFJLUC. f. pv. flaccumfaciens strain BRIP 70615mungbean-
JAFJLTC. f. pv. flaccumfaciens strain BRIP 70624mungbean-
PUEZC. f. pv. flaccumfaciens strain CFBP3418beans1957 Klement, Z.
JAHEWXC. f. pv. flaccumfaciens strain CFBP 3417beans1958 Lelliott, R.A
JAHEWYC. f. pv. flaccumfaciens strain CFBP 3422beans1956 Schuster, M.L.
JAHEWZC. f. pv. flaccumfaciens strain CFBP 3423beans1957 Schuster, M.L.
JAHEWTC. f. pv. flaccumfaciens strain CFBP 8818tomato2015 Osdaghi, E.
JAHEWSC. f. pv. flaccumfaciens strain CFBP 8819tomato-
JAHEWRC. f. pv. flaccumfaciens strain CFBP 8820tomato-
JAHEWQC. f. pv. flaccumfaciens strain CFBP 8821tomato-
JAHEWPC. f. pv. flaccumfaciens strain CFBP 8822tomato-
JAHEWOC. f. pv. flaccumfaciens strain CFBP 8823tomato2015 Osdaghi, E.
JAHEWNC. f. pv. flaccumfaciens strain CFBP 8824tomato-
JAHEWMC. f. pv. flaccumfaciens strain CFBP 8825tomato-
CP041259C. f. pv. flaccumfaciens strain Cff1037beans2015 Osdaghi, E.
CP045287C. f. pv. flaccumfaciens strain P990dry beans2015 Osdaghi, E.
JAHEXCC. f. pv. oortii strain CFBP 1384tulip1967 Barendsen, H.
JAHEXAC. f. pv. oortii strain CFBP 3400arum lily1990 Janse, J.D.
JAHEXBC. f. pv. poinsettiae strain CFBP 2403euphorbiaStarr, M.P.
JAHEWUC. f. pv. poinsettiae strain CFBP 3415euphorbiaDye, D.
Table 2. Suggested Curtobacterium species based on the genomic data.
SpeciesStrains
Genomospecies 1. C. flaccumfaciensC. f. pv. betae CFBP 2402, C. f. pv. betae CFBP 3401, C. f. pv. oortii CFBP 1384, C. flaccumfaciens 208, C. flaccumfaciens LMG 3645, C. flaccumfaciens VKM Ac-1386, C. flaccumfaciens VKM Ac-1795, C. fpf BRIP 70601, C. fpf BRIP 70606, C. fpf BRIP 70607, C. fpf BRIP 70610, C. fpf BRIP 70614, C. fpf BRIP 70615, C. fpf BRIP 70624, C. fpf CFBP 3418, C. fpf CFBP 3423, C. fpf CFBP 8820, C. fpf CFBP 8821, C. fpf CFBP 8822, C. fpf CFBP 8825, C. fpf Cff1037, C. fpf P990, C. sp. KBS0715, C. sp. MCBA15_005, C. sp. MCBD17_026, C. sp. MCLR17_031, C. sp. MCLR17_034, C. sp. MCLR17_039, C. sp. MCLR17_040, C. sp. MCLR17_042, C. sp. MCLR17_043, C. sp. MCLR17_044, C. sp. MCLR17_045, C. sp. MCLR17_051, C. sp. MCLR17_053, C. sp. MCLR17_054, C. sp. MCLR17_055, C. sp. MCLR17_057, C. sp. MCLR17_058, C. sp. MCLR17_059, C. sp. MCPF17_003, C. sp. MCPF17_018, C. sp. MCPF17_021, C. sp. MCPF17_051, C. sp. MCSS17_005, C. sp. MCSS17_006, C. sp. MCSS17_011, C. sp. MCSS17_016, C. sp. ME12, C. sp. MMLR14_002, C. sp. MMLR14_014, C. sp. UNCCL17, C. sp. VKM Ac-2852
Genomospecies 2C. f. pv. poinsettiae CFBP 2403, C. f. pv. poinsettiae CFBP 3415, C. flaccumfaciens MEB126, C. flaccumfaciens S5.26, C. flaccumfaciens UCD-AKU, C. fpf CFBP 3417, C. fpf CFBP 3422, C. sp. 8I-2-2, C. sp. Leaf154, C. sp. MCBA15_007, C. sp. VKM Ac-1796, C. sp. VKM Ac-2889
Genomospecies 3C. fpf CFBP 8818, C. fpf CFBP 8819, C. fpf CFBP 8823, C. fpf CFBP 8824
Genomospecies 4C. sp. VKM Ac-1376
Genomospecies 5C. sp. YC1
Genomospecies 6C. sp. PhB115
Genomospecies 7C. sp. VKM Ac-1393
Genomospecies 8C. sp. JUb34, C. sp. TC1
Genomospecies 9C. f. pv. oortii CFBP 3400, C. sp. 18060, C. sp. 24E2, C. sp. MCJR17_020, C. sp. PhB128, C. sp. PhB131, C. sp. PhB134, C. sp. PhB137, C. sp. PhB138, C. sp. PhB141, C. sp. PhB142, C. sp. PhB146, C. sp. PhB170, C. sp. PhB171, C. sp. PhB172, C. sp. PhB190, C. sp. PhB191, C. sp. PhB25, C. sp. PhB42, C. sp. PhB78, C. sp. VKM Ac-2861, C. sp. VKM Ac-2884, C. sp. VKM Ac-2887
Genomospecies 10C. sp. MCBA15_003, C. sp. MCBA15_009, C. sp. MCLR17_036, C. sp. MMLR14_006
Genomospecies 11C. sp. UNCCL20
Genomospecies 12C. sp. MCPF17_002
Genomospecies 13C. sp. MCBA15_008
Genomospecies 14C. flaccumfaciens JUb65
Genomospecies 15C. pusillum DE0005
Genomospecies 16C. sp. B18
Genomospecies 17C. sp. BH-2-1-1, C. sp. MCBA15_013, C. sp. MCBA15_016, C. sp. YR515
Genomospecies 18C. pusillum ATCC 19096, C. pusillum WPL5_2
Genomospecies 19C. pusillum DE0370
Genomospecies 20C. pusillum AA3, C. sp. 314Chir4.1
Genomospecies21C. sp. ISL-83
Genomospecies 22C. sp. Ferrero
Genomospecies 23C. luteum NS184
Genomospecies 24Metagenome assembly accession CAJYUP
Genomospecies 25C. luteum ATCC 15830, C. luteum DSM 20542, C. luteum JCM 1480, C. sp. B8
Genomospecies 26C. sp. ER1/6, C. sp. ME26
Genomospecies 27C. sp. MCSS17_007
Genomospecies 28C. sp. MCSS17_008
Genomospecies 29C. oceanosedimentum NS263, C. oceanosedimentum NS359, C. sp. SGAir0471
Genomospecies 30C. sp. HSID17257
Genomospecies 31C. sp. 1310, C. sp. MR_MD2014
Genomospecies 32C. sp. MCBA15_004, C. sp. MCBA15_012, C. sp. UCD-KPL2560
Genomospecies 33C. albidum DSM 20512, C. citreum DSM 20528, C. citreum JCM 1345, C. citreum NS330, C. sp. AG1037, C. sp. BH-2-1-1 DE0401, C. sp. Csp1, C. sp. Csp2, C. sp. csp3, Metagenome assembly accession CAJYNE
Genomospecies 34C. sp. 9128 DE0339
Genomospecies 35C. sp. 9128
Genomospecies36C. sp. PhB130, C. sp. PhB136, C. sp. ZW137
Genomospecies 37C. sp. VKM Ac-1395
Genomospecies 38C. sp. MMLR14_010
Genomospecies 39C. sp. VKM Ac-2865
Genomospecies 40C. sp. MCBA15_001
Genomospecies 41C. sp. Leaf183, C. sp. MCLR17_007
Genomospecies 42C. herbarum DSM 14013
Genomospecies 43C. herbarum S/N-208-OC-R1, C. sp. MCLR17_032
Genomospecies 44C. sp. MCBD17_030, C. sp. MCPF17_001, C. sp. MCPF17_011, C. sp. MCPF17_031, C. sp. MCPF17_047, C. sp. MCPF17_052
Genomospecies 45C. sp. L6-1
Genomospecies 46C. sp. MCBD17_021, C. sp. MCSS17_015
Genomospecies 47C. sp. MCBD17_032
Genomospecies 48C. sp. MCBD17_008, C. sp. MCBD17_023, C. sp. MCBD17_029, C. sp. MCJR17_043, C. sp. MCJR17_055, C. sp. MCPF17_015, C. sp. MCPF17_046, C. sp. MCPF17_050
Genomospecies 49C. sp. MCBD17_003, C. sp. MCBD17_013, C. sp. MCBD17_019, C. sp. MCBD17_028, C. sp. MCBD17_031, C. sp. MCBD17_034, C. sp. MCBD17_035, C. sp. MCBD17_040
Genomospecies 50C. sp. Leaf261
Genomospecies 51/GenusC. ammoniigenes NBRC 101786
Table 3. Curtobacterium plasmid genomes deposited in the NCBI Genome database as of October 2021.
NCBI AccessionPlasmid% GCSequence LengthTopology
CP018784C. pusillum strain AA3 plasmid pCPAA366.7%567,298circular
CP041260C. fpf strain Cff1037 plasmid pCff11366.1%113,440linear
CP045288C. fpf strain P990 plasmid pCff166.1%147,310circular
CP045289C. fpf strain P990 plasmid pCff232.3%25,142circular
CP045290C. fpf strain P990 plasmid pCff335.3%22,293circular
CP066342C. sp. YC1 plasmid pCspYC167.0%77,217circular
CP071884C. fpf strain BRIP:70614 plasmid pCff11966.0%119,821linear
CP074440C. fpf strain BRIP:70606 plasmid pCff11966.0%119,808linear
CP081962C. sp. TC1 plasmid pTCL65.6%163,762circular
CP081963C. sp. TC1 plasmid pTCS67.8%41,985circular
Table 4. Primers and PCR product sequence for the genus-specific detection of Curtobacterium.
NameSequenceTmProduct Size
Curto-F2GAAATGGTGTTATGGCCGGAT61.5 °C275 bp
Curto-D-RACGGGTTAACCTCGCCACA61.5 °C
Product Sequence
GAAATGGTGTTATGGCCGGATGTGTATCCCAAGTAGCACGGGGCCCGAGAAATCCCGTGTGAATCTGTCAGGACCACCTGATAAGCCTAAATACTCCCAGATGACCGATAGCGGACAAGTACCGTGAGGGAAAGGTGAAAAGTACCCCGGGAGGGGAGTGAAATAGTACCTGAAACCGTTTGCTTACAAACCGTCGGAGCCTCCTTGTAGGGGTGACGGCGTGCCTTTTGAAGAATGAGCCTGCGAGTTAGTGATATGTGGCGAGGTTAACCCGT
Table 5. Detection sensitivity of the test plasmid and genomic DNA.
PlasmidGenomic DNA
ConcentrationMean
Cq
SDConcentrationMean
Cq
SD
12.18 × 1096.760.452.59 × 10618.610.03
22.18 × 1088.50.272.59 × 10524.010.09
32.18 × 10711.820.542.59 × 10427.950.23
42.18 × 10616.211.92.59 × 10329.930.08
52.18 × 10520.10.332.59 × 10232.660.09
62.18 × 10423.950.0125.9--
72.18 × 10326.370.012.59--
82.18 × 10228.330.03---
921.8-----
Publisher’s Note: MDPI stays neutral with regard to jurisdictional claims in published maps and institutional affiliations.