Abstract
Sebastiscus species, marine rockfishes, are of essential economic value. However, the genomic data of this genus is lacking and incomplete. Here, whole genome sequencing of all species of Sebastiscus was conducted to provide fundamental genomic information. The genome sizes were estimated to be 802.49 Mb (S. albofasciatus), 786.79 Mb (S. tertius), and 776.00 Mb (S. marmoratus) by using k-mer analyses. The draft genome sequences were initially assembled, and genome-wide microsatellite motifs were identified. The heterozygosity, repeat ratios, and numbers of microsatellite motifs all suggested possibly that S. tertius is more closely related to S. albofasciatus than S. marmoratus at the genetic level. Moreover, the complete mitochondrial genome sequences were assembled from the whole genome data and the phylogenetic analyses genetically supported the validation of Sebastiscus species. This study provides an important genome resource for further studies of Sebastiscus species.
1. Introduction
The genus Sebastiscus is an interesting and commercial rockfish that mainly distributes in the Western Pacific []. Despite their diversity, abundance, and economic importance, our understanding of the relationships within the genus remains limited. Three species have been recognized from Sebastiscus viz., Sebastiscus albofasciatus (Lacepede, 1802), Sebastiscus marmoratus (Cuvier and Valenciennes, 1829), and Sebastiscus tertius (Barsukov and Chen, 1978) [,,]. Additionally, S. tertius was generally misidentified as S. marmoratus in the Chinese mainland coastal waters in the last decades because of the similar morphological characteristics. It is also worth noting that S. marmoratus is widely distributed in the northwestern Pacific Ocean and the remaining species are likely to be confined to the warm waters of East Asia and Indonesia [,]. Recently, combined with morphological and DNA-barcoding approaches, this species was determined in the Chinese mainland coastal waters as a new record species []. Although the external morphology of the S. tertius and S. marmoratus is more similar than S. albofasciatus, recent studies have shown that S. tertius is more closely related to S. albofasciatus than S. marmoratus at the genetic level []. As a result, it further reveals that the evolutionary relationship of Sebastiscus fishes is necessary to make a deeper comparison and discussion of their genes. However, the limited genetic information and the lack of the genomic data of Sebastiscus have impeded the relevant evolutionary and genomic studies of this genus.
As the next-generation, high-throughput sequencing (NGS) has been developing rapidly over recent decades, the whole genome sequencing (WGS) and various molecular genetic tools have become efficient strategies for generating genomic resources and widely applied in genomic and evolutionary studies of marine fish species [,,,,]. To further compare the genomes of different Sebastiscus species, complete genome data were obtained by NGS and used to assemble the genome, estimate genome size, identify simple sequence repeats (SSRs), and extract the mitogenome. These data will be the basis of a fundamental genomic resource for extending our current knowledge of Sebastiscus genome organization and difference. In addition, these data also provide a foundation for future genomic studies of Sebastiscus species.
2. Results
2.1. Genome Sequencing, K-Mer Analysis, and Genome Assembly
A total of 40.14 Gb (S. albofasciatus, sequencing depth ~50×), 41.93 Gb (S. tertius, sequencing depth ~53×), and 87.55 Gb (S. marmoratus, sequencing depth ~112×) clean data were generated by whole genome sequencing. The amount of clean data, Q20, Q30, and GC content of clean data are shown in Table 1 and Figure 1. After a quality control and data filtering analysis, the clean data were used for k-mer analysis. The 19-mer frequency distribution derived from the sequencing reads is plotted in Figure 2. The k-mer analyses showed that the peaks of 19-mer distribution of three rockfishes were at 21×, 22×, and 83×, respectively (Table 2; Figure 2). Additionally, the estimated genome sizes of S. albofasciatus, S. tertius, and S. marmoratus were 802.49 Mb, 786.79 Mb, and 776.00 Mb by calculation, respectively. The heterozygosity ratio and repeat ratio are also shown in Table 2.

Table 1.
Quality control information of sequencing data.
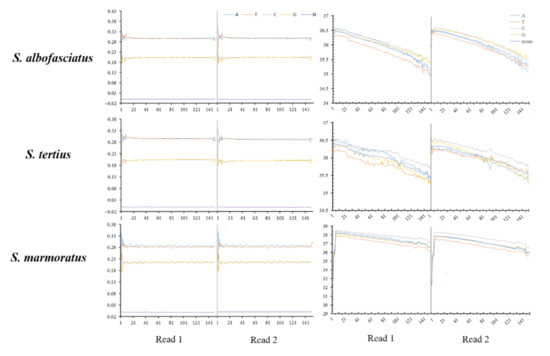
Figure 1.
Distribution figure of sequencing quality and GC content of clean data.
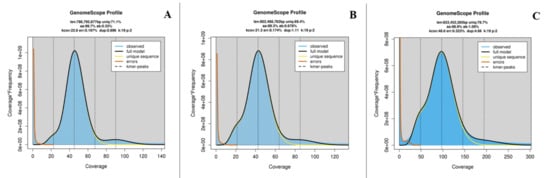
Figure 2.
K-mer (19-mer) analysis for estimating the genome size of S. albofasciatus (A), S. tertius (B), and S. marmoratus (C). The X-axis is depth and the Y-axis is the proportion that represents the frequency at that depth.
Table 2.
Statistics of 17-mer analysis.
The filtered clean data was used for the draft genome assembling. The total length, total number of sequences, max length of sequences, length of N50, and length of N90 of three rockfishes are shown in Table 3 at the contig and scaffold levels. By comparison, the N50 length and N90 length of sequences of S. marmoratus genome were smaller than S. albofasciatus and S. tertius, while the lengths of max of S. marmoratus genome were relatively larger than those of other Sebastiscus, especially for the length of contig.
Table 3.
Statistics of assembled draft genome sequences.
2.2. Identification of Microsatellite Motifs
A total of 346,510, 382,140, and 319,533 microsatellite motifs were identified for three rockfishes based on the assembled draft genome sequences (Table 4). The microsatellite distribution frequencies in S. albofasciatus, S. tertius, and S. marmoratus genomes were estimated to be about 556.8, 602.4, and 516.9 microsatellites per Mb. In the three genomes, the microsatellites motif types of S. albofasciatus included 36.45% mononucleotide, 50.30% dinucleotide, 11.78% trinucleotide, 1.33% tetranucleotide, 0.13% pentanucleotide, 0.02% hexanucleotide repeats; and S. tertius had 37.93% mononucleotide, 49.12% dinucleotide, 11.48% trinucleotide, 1.34% tetranucleotide, 0.11% pentanucleotide, and 0.01% hexanucleotide repeats; while the frequencies were 37.43%, 50.12%, 11.31%, 0.10%, and 0.02% for mono-, di-, tri-, tetra-, penta-, hexanucleotide repeats in the S. marmoratus genome (Figure 3). Among the microsatellite motif profiles of three rockfish genomes, the dinucleotide repeat motifs were similar to each other and the AC/CA/GT/TG repeats were the most abundant, accounting for about 67.00% (Figure 4A–C). Of the trinucleotide repeat motifs, the repeat times that were more than 1000 included 14, 16, 13 different microsatellite motifs, respectively, accounting for more than 50.00% (Figure 4D–F). However, the tetranucleotide repeat motifs showed significant differences: the genomes of S. albofasciatus and S. tertius included about 25 tetranucleotide repeat motifs that were more than 50 repetitions, but S. marmoratus only had 3 (Figure 4G–I).
Table 4.
Microsatellite motif types detected in this study.
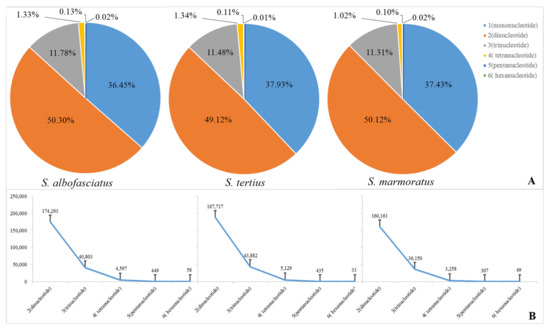
Figure 3.
(A) Frequency of identified microsatellite motif types. (B) Quantity of identified microsatellite motifs.
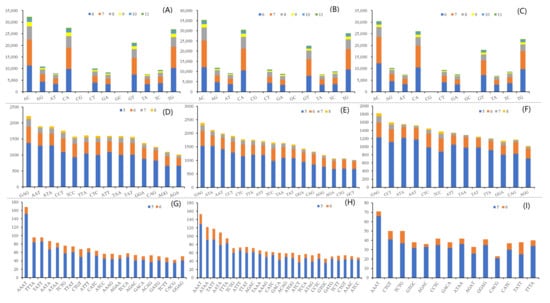
Figure 4.
The distribution of identified microsatellite motifs. (A–C) Frequency of different dinucleotide microsatellite motifs. (D–F) Frequency of different trinucleotide microsatellite motifs (>1000). (G–I) Frequency of different tetranucleotide microsatellite motifs (>40). The squares in different colors with particular numbers represent different repeat times.
2.3. Mitogenome Assembly and Phylogenetic Analysis
The complete mitochondrial genomes of S. albofasciatus (Accession no. MZ902351), S. tertius (Accession no. MZ902352), and S. marmoratus (Accession no. MZ902353) in GenBank were 16,790, 16,797, and 17,208 bp in length, respectively (Figure 5). The size variation of the three mitogenomes was mainly caused by the differences in the lengths of the non-coding regions. The mitogenome of three Sebastiscus all contained the typical 37 genes (13 PCGs, 22 tRNAs, and 2 rRNAs), 1 control region, and 1 L-strand replication region (OL). Most mitochondrial genes were encoded on the H-strand, except for ND6 and eight tRNA (Glu, Ala, Asn, Cys, Tyr, Ser-UCN, Gln, and Pro) genes that were encoded on the L-strand. The nucleotide composition of S. albofasciatus, S. tertius, and S. marmoratus mitogenomes had a higher A + T bias of 54.73%, 54.69%, and 54.97%, respectively, and both showed positive AT-skew and negative GC-skew (Figure 6; Table S1).
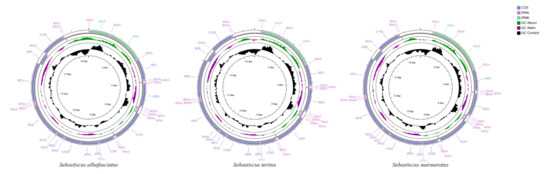
Figure 5.
Mitochondrial genome maps of S. tertius, S. albofasciatus, and S. marmoratus. Genes encoded on the heavy or light strands are shown outside or inside the circular gene map, respectively.
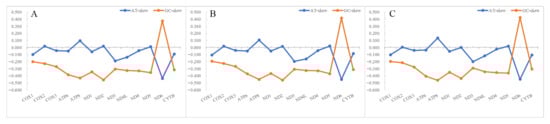
Figure 6.
The nucleotide skewness of three species of Sebastiscus. (A) S. tertius; (B) S. albofasciatus; (C) S. marmoratus. The incomplete T--/TA- of the stop codon is not included.
Phylogenetic relationships were reconstructed based on the sequences of 13 PCGs of 27 mitogenomes using NJ and ML methods. The phylogenetic trees constructed by two methods were consistent with high intermediate bootstrap values and the topological structure of the two phylogenetic trees was entirely the same (Figure 7). Moreover, six Sebastiscus sequences formed a monophyletic group either in the NJ or ML analyses. S. tertius formed a sister group with S. albofasciatus and together had a sister relationship with S. marmoratus, which is consistent with previous studies [].
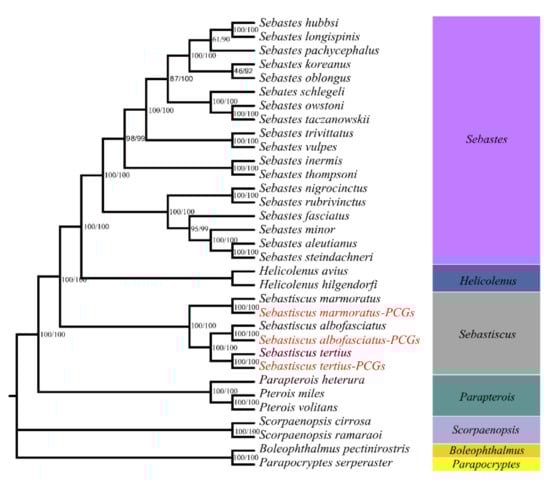
Figure 7.
Phylogenetic tree of 25 Scorpaenidae sequences constructed by neighbor-joining (NJ) and maximum likelihood (ML) methods based on concatenated sequences of 13 PCGs. Boleophthalmus pectinirostris and Parapocryptes serperaster were used as the outgroup. The species in red Latin name indicates the sequences generated in this study.
3. Discussion
Prior to this study, the genetic information about Sebastiscus was only limited to S. marmoratus and the mitochondrial genome sequences of other Sebastiscus species [,,,]. In recent years, genomic technology has developed rapidly with the application of NGS technology, which provides an affordable way to solve a wide range of questions [,,]. As a result, more and more non-model marine fish species have been sequenced and studied by genome survey sequencing [,,]. In the present study, we reported the genome survey of all Sebastiscus species by the whole genome sequencing for the first time. Moreover, the microsatellite motifs were identified, and the complete mitochondrial genomes were also assembled, all of which could provide a valid reference in future genome and molecular marker research for marine fishes.
The k-mer analyses suggested that the genome sizes of Sebastiscus were 802.49 Mb (S. albofasciatus), 786.79 Mb (S. tertius), and 776.00 Mb (S. marmoratus), respectively. From the results, the genome size of S. marmoratus (776.00 Mb, k = 19) was lower than the previous study (796.25 Mb, k = 21) []. This might be explained by the accuracy of different parameters or the intraspecific genome size variation, which caused discrepancies in results [,,]. Besides the variation in genome size, both the heterozygosity ratio and repeat ratio in S. marmoratus were relatively larger than other Sebastiscus species. The higher heterozygosity of S. marmoratus also suggested that S. marmoratus had higher population genetic variability than the other two. The difference between the former and the latter may account for one of the genetic differences between species. In a word, the genome survey analyses in the present study provided fundamental and valuable information in genomics and molecular biology of Sebastiscus.
For the genome assembly, lower heterozygosity showed that all the genomes of three Sebastiscus were relatively simple and all Sebastiscus species would be preferable for the development of a draft genome in future studies [,]. It is consistent with previous research about Sebastiscus []. This is the first genome survey comparison of all species in Sebastiscus genus and the assembled genome sequences in this study can be useful for further genomic studies.
Molecular markers are an ideal form of genetic marker. In addition to facilitating detection, multiple allele polymorphism, and codominant inheritance, molecular markers also possess advantages that are not found in rapid fragment length polymorphism (RFLP) and amplified fragment length polymorphism (AFLP) markers []. All Sebastiscus genomes appeared capable of developing tremendous SSR markers, which would help to solve the problem that SSR markers only could be derived from the genome data in S. marmoratus []. The frequency of SSR repetitions decreases exponentially with the length of SSR repetitions, as longer mutations have higher mutation rates []. This is consistent with the result that the number of repetitions is inversely proportional to the length of repetitions reported by Chen et al. (2010) []. Moreover, the number and type of SSR markers were lower than those of other Sebastiscus species, especially in tetranucleotide microsatellite motifs of S. marmoratus. It might be due to S. marmoratus producing the genetic mutations during evolution, which eventually formed the new Sebastiscus species and generated the genome-wide difference. Statistical analysis of the differences in the quantity and types of SSRs in Sebastiscus and an initial exploration of the genome data provided a foundation for the further construction of high-density genetic maps of rockfishes.
The whole genome sequencing data also included extranuclear genome like mitochondria []. The mitochondrial genomes of three Sebastiscus species were assembled from the whole genome sequencing data by using Mitofinder software. The result of phylogenetic tree based on 13 PCGs also revealed the accuracy of the mitochondrial genome assemblies by the method. Mitochondrial genomes have become a powerful molecule marker for species classification, population genetics, molecular systematic geography, molecular ecology, and other fields [,,,,]. However, short mitochondrial gene fragments still harbor some limitations in discussing and resolving more complicated phylogenetic relationships in many fish lineages []. For these limitations, the longer DNA sequences liked protein-coding genes in complete mitochondrial genomes which have additional informative sites will have better ways to solve these higher-level relationships and deeper branches thoroughly []. The same topology generated by different methods proved it. We suggest that a cost-effective method to assemble mitochondrial genomes should be widely used in future genome survey studies.
4. Materials and Methods
4.1. Sample Collection and Preservation
The samples of S. tertius and S. marmoratus were collected using hook-and-line fishing from the coastal waters of Taizhou in China (coordinates: 28.54° N, 121.64° E) during December 2020 and Qingdao in China (coordinates: 35.76° N, 120.20° E) during May 2018, and S. albofasciatus originated from Kozagawa in Japan (coordinates: 33.41° N, 135.75° E) during June 2019, respectively. All samples were identified based on morphological characteristics [] and one random individual was chosen per species—for genome sequencing. Muscle tissues were stored in 95% ethanol at −80 °C for further study.
4.2. Genome Survey Sequencing
Total genomic DNA was extracted using a standard phenol-chloroform method for muscle tissue. DNA was treated with RNase A to produce pure, RNA-free DNA. Two paired-end DNA libraries were constructed with insert size of 350 bp, and then sequenced using the Illumina HiSeq 4000 platform following the manufacturer’s protocol. The library construction and sequencing were performed at Biomarker Technologies in Beijing. The whole genome sequencing data were deposited in the Short Read Archive (SRA) database (http://www.ncbi.nlm.nih.gov/sra/ accessed on 18 July 2021) under accession numbers PRJNA746673, PRJNA746685, and PRJNA722703, respectively.
4.3. K-Mer Analysis and Genome Assembly
The genomic size and heterozygosity were estimated using k-mer analysis method. After removing low quality reads, all clean data were used to perform k-mer analysis, using the 350 bp library data and K = 19 to build the profile. Based on the results of the k-mer analysis, information on peak depth and the number of predicted best k-mer were obtained and used to estimate the size of the genome. Its relationship was expressed by using the following algorithm []: genome size = k-mer_num/peak_depth, where k-mer_num is the total number of predicted best k-mer, and peak_depth is the expected value of the k-mer depth. Additionally, the heterozygosity ratio and repeat sequence ratio were estimated following the description in [], based on the k-mer analysis. K-mer analyses were performed using software GCE v1.0.0 []. The clean reads were assembled into contigs in software SOAPdenovo v2.01 [] with a k-mer of 41 by applying the de Bruijn graph structure. The paired-end information was then used to join the unique contigs into scaffolds.
4.4. Microsatellite Identification
The number and types of microsatellites can be identified by analyzing the genome sequence. The software MIcroSAtellite (MISA, http://pgrc.ipk-gatersleben.de/misa/ accessed on 20 July 2021) was used to identify microsatellite motifs in the de novo draft genome sequences [,].
4.5. Mitogenome Assembly and Phylogenetic Analysis
The filtered clean data were assembled and mapped to complete mitogenome sequence using Mitofinder []. All complete mitogenomes were preliminarily annotated and the mitochondrial genome map was drawn by Mitofish (https://mitofish.aori.u-tokyo.ac.jp, accessed on 24 July 2021) [,].
In order to discuss and verify the accuracy of the mitogenome sequence, mitogenomes of previously sequenced Scorpaenidae (22 species) and Gobiidae (2 species, the outgroup taxon) were used in the phylogenetic analysis. We used the nucleotide sequences of the 13 protein-coding genes (PCGs, including ND1, ND2, COI, COII, ATP8, ATP6, COIII, ND3, ND4L, ND4, ND5, ND6, and CYTB) as the dataset to construct the phylogenetic tree. Sequences were aligned using SeqMan from DNAStar software (USA). The optimal model for nucleotide sequences was estimated by MEGA X []. The GTR + G + I model was considered to be the best one for phylogenetic tree construction since it captured the minimum values of Bayesian Information Criterion (BIC) and Akaike Information Criterion (AIC). The Maximum Likelihood (ML) phylogenetic tree was constructed by MEGA X software with 1000 replicates of bootstrap.
5. Conclusions
In the present study, the first genome survey study of all Sebastiscus species was performed based on whole genome sequencing data of three different individuals. The genome sizes of Sebastiscus were 802.49 Mb, 786.79 Mb, and 776.00 Mb, respectively. Then, comparative analyses among the three species were also investigated to reveal possible interspecific differences. The heterozygosity, microsatellite, and other data all showed that the external morphology of the S. marmoratus and S. tertius is more similar, but S. tertius is more closely related to S. albofasciatus at the genetic level. This will provide a meaningful reference for future research on the origin and evolution of the Sebastiscus genus. Moreover, the mitochondrial genome assembly and phylogenetic analysis were integrated into our genome survey study. The result of the phylogenetic tree also proved the accuracy of the mitochondrial genome assemblies through the method. This can be used to provide an important genome resource for further studies of Sebastiscus species. In addition, we suggested that further studies should be continued by high-quality whole genome sequences of Sebastiscus based on the combination of “Illumina + PacBio + Hi-C” techniques, to provide valuable information for genomic and evolutionary biology studies.
Supplementary Materials
The following are available online at https://www.mdpi.com/article/10.3390/cimb43030141/s1, Table S1: Base composition of Sebastiscus mitochondrial genomes.
Author Contributions
Data curation, C.J. and T.G.; formal analysis, C.J. and T.Y. (Tianyan Yang); methodology, T.G.; writing—original draft, C.J.; writing—review and editing, T.Y. (Tianyan Yang), T.Y. (Takashi Yanagimoto), and T.G. All authors have read and agreed to the published version of the manuscript.
Funding
This study was supported by the National Key R&D Program of China (2019YFD0901303) and National Natural Science Foundation of China (No. 41776171).
Institutional Review Board Statement
Ethical review and approval were waived for this study, due to the samples were dead before retrieved.
Informed Consent Statement
Not applicable.
Data Availability Statement
The data presented in this study are openly available in Short Read Archive (SRA) database, reference number [PRJNA746673, PRJNA746685, and PRJNA722703].
Acknowledgments
We sincerely thank the reviewers for their critique and suggestions. Besides, we sincerely thank Qi Liu for the data analysis guidance.
Conflicts of Interest
The authors have declared that no competing interests exist.
References
- Jordan, D.S.; Starks, E.C. A review of the Japanese fishes of the family of Agonidae. Proc. U. S. Natl. Mus. 1904, 27, 575–599. [Google Scholar] [CrossRef]
- Lacepède, B.G.E. Histoire Naturelle des Poissons; Plassan: Paris, France, 1802; Volume 4. [Google Scholar]
- Cuvier, G.; Valenciennes, A. Histoire Naturelle des Poissons. Livre Quatrième; Levrault: Paris, France, 1829; Volume 4. [Google Scholar]
- Barsukov, V.V.; Chen, L.C. Review of the subgenus Sebastiscus (Sebastes, Scorpaenidae) with a description of a new species. Voprosy Ikhtiol 1978, 18, 195–210. [Google Scholar]
- Nakabo, T.; Kai, Y. Sebastidae. Fishes of Japan with Pictorial Keys to the Species, 3rd ed.; Nakabo, T., Ed.; Tokai University Press: Hadano, Japan, 2013; pp. 1933–1938. [Google Scholar]
- Morishita, S.; Kawai, T.; Motomura, H. Sebastiscus vibrantus, a new species of rockfish (Sebastidae) from Indonesia and Taiwan. Ichthyol. Res. 2018, 65, 423–432. [Google Scholar] [CrossRef]
- Jia, C.H.; Gao, T.X.; Xu, S.Y.; Song, N. A new record of Sebastiscus tertius (Scorpaenoidei: Sebastidae) in Chinese mainland coastal waters in morphological characters and DNA barcoding. Oceanol. Limnol. Sin. 2020, 51, 252–259, (In Chinese with English abstract). [Google Scholar] [CrossRef]
- Jia, C.; Zhang, X.; Xu, S.; Yang, T.; Yanagimoto, T.; Gao, T. Comparative analysis of the complete mitochondrial genomes of three rockfishes (Scorpaeniformes, Sebastiscus) and insights into the phylogenetic relationships of Sebastidae. Biosci. Rep. 2020, 40, BSR20203379. [Google Scholar] [CrossRef] [PubMed]
- Yu, L.; Liu, Y.; Liu, J. Gene-associated microsatellite markers confirm panmixia and indicate a different pattern of spatially varying selection in the endangered Japanese eel Anguilla japonica. J. Oceanol. Limnol. 2020, 38, 1572–1583. [Google Scholar] [CrossRef]
- Nikolic, N.; Duthoy, S.; Destombes, A.; Bodin, N.; West, W.; Puech, A.; Bourjea, J. Discovery of genome-wide microsatellite markers in Scombridae: A pilot study on Albacore Tuna. PLoS ONE 2015, 10, e0141830. [Google Scholar] [CrossRef] [Green Version]
- Venkatesh, B.; Kirkness, E.F.; Loh, Y.H.; Halpern, A.L.; Lee, A.P.; Johnson, J.; Dandona, N.; Viswanathan, L.D.; Tay, A.; Venter, J.C.; et al. Survey sequencing and comparative analysis of the Elephant Shark (Callorhinchus milii) Genome. PLoS Biol. 2007, 5, e101. [Google Scholar] [CrossRef]
- Xu, S.Y.; Song, N.; Xiao, S.J.; Gao, T.X. Whole genome survey analysis and microsatellite motif identification of Sebastiscus marmoratus. Biosci. Rep. 2020, 40, BSR20192252. [Google Scholar] [CrossRef] [PubMed] [Green Version]
- You, X.X.; Shan, X.X.; Shi, Q. Research advances in the genomics and applications for molecular breeding of aquaculture animals. Aquaculture 2020, 526, 735357. [Google Scholar] [CrossRef]
- Xu, T.J.; Cheng, Y.Z.; Liu, X.Z.; Shi, G.; Wang, R.X. The complete mitochondrial genome of the marbled rockfish Sebastiscus marmoratus (Scorpaeniformes, Scorpaenidae): Genome characterization and phylogenetic considerations. Mol. Biol. 2011, 45, 434–445. [Google Scholar] [CrossRef]
- Xu, S.; Yanagimoto, T.; Song, N.; Cai, S.; Gao, T.; Zhang, X. Population genomics reveals possible genetic evidence for parallel evolution of Sebastiscus marmoratus in the northwestern Pacific Ocean. Open Biol. 2019, 9, 190028. [Google Scholar] [CrossRef] [PubMed] [Green Version]
- Tao, W.; Yuan, J.; Zhou, L.; Sun, L.; Sun, Y.; Yang, S.; Li, M.; Zeng, S.; Huang, B.; Wang, D. Characterization of gonadal transcriptomes from Nile tilapia (Oreochromis niloticus) reveals differentially expressed genes. PLoS ONE 2013, 8, e63604. [Google Scholar] [CrossRef] [PubMed] [Green Version]
- Tian, C.; Li, Z.; Dong, Z.; Huang, Y.; Du, T.; Chen, H.; Jiang, D.; Deng, S.; Zhang, Y.; Wanida, S.; et al. Transcriptome analysis of male and female mature gonads of silver sillago (Sillago sihama). Genes 2019, 10, 129. [Google Scholar] [CrossRef] [PubMed] [Green Version]
- Zhou, Y.L.; Wu, J.J.; Wang, Z.W.; Li, G.H.; Zhou, L.; Gui, J.F. Microsatellite polymorphism and genetic differentiation of different populations screened from genome survey sequencing in red-tail catfish (Hemibagrus wyckioides). Aquac. Rep. 2021, 19, 100614. [Google Scholar] [CrossRef]
- Huang, Y.; Jiang, D.; Li, M.; Mustapha, U.F.; Tian, C.; Chen, H.; Huang, Y.; Deng, S.; Wu, T.; Zhu, C.; et al. Genome survey of male and female spotted scat (Scatophagus argus). Animals 2019, 9, 1117. [Google Scholar] [CrossRef] [Green Version]
- Li, Z.; Tian, C.; Huang, Y.; Lin, X.; Wang, Y.; Jiang, D.; Zhu, C.; Chen, H.; Li, G. A first insight into a draft genome of silver sillago (Sillago sihama) via genome survey sequencing. Animals 2019, 9, 756. [Google Scholar] [CrossRef] [Green Version]
- Chen, B.; Sun, Z.; Lou, F.; Gao, T.; Song, N. Genomic characteristics and profile of microsatellite primers for Acanthogobius ommaturus by genome survey sequencing. Biosci. Rep. 2020, 40, BSR20201295. [Google Scholar] [CrossRef]
- Matsuba, C.; Merilä, J. Genome size variation in the common frog Rana temporaria. Hereditas 2006, 143, 155–158. [Google Scholar] [CrossRef] [PubMed]
- Jeffery, N.W.; Hultgren, K.; Chak, S.T.; Gregory, R.; Rubenstein, D.R. Patterns of genome size variation in snapping shrimp. Genome 2016, 59, 393–402. [Google Scholar] [CrossRef] [Green Version]
- Chor, B.; Horn, D.; Goldman, N.; Levy, Y.; Massingham, T. Genomic DNA k-mer spectra: Models and modalities. Genome Biol. 2009, 10, R108. [Google Scholar] [CrossRef] [Green Version]
- Marcais, G.; Kingsford, C. A fast, lock-free approach for efficient parallel counting of occurrences of k-mers. Bioinformatics 2011, 27, 764–770. [Google Scholar] [CrossRef] [PubMed] [Green Version]
- Li, G.Q.; Song, L.X.; Jin, C.Q.; Li, M.; Gong, S.P.; Wang, Y.F. Genome survey and SSR analysis of Apocynum venetum. Biosci. Rep. 2019, 39, BSR20190146. [Google Scholar] [CrossRef] [Green Version]
- Katti, M.V.; Ranjekar, P.K.; Gupta, V.S. Differential distribution of simple sequence repeats in eukaryotic genome sequences. Mol. Biol. Evol. 2001, 18, 1161–1167. [Google Scholar] [CrossRef] [Green Version]
- Chen, M.; Tan, Z.; Zeng, G.; Peng, J. Comprehensive analysis of simple sequence repeats in pre-miRNAs. Mol. Biol. Evol. 2010, 27, 2227–2232. [Google Scholar] [CrossRef] [PubMed] [Green Version]
- Xu, S.Y.; Zhang, H.; Gao, T.X. Comprehensive whole genome survey analyses of male and female brown-spotted flathead fish platycephalus sp.1. Genomics 2020, 112, 4742–4748. [Google Scholar] [CrossRef] [PubMed]
- Groves, P.; Shields, G.F. Phylogenetics of the Caprinae based on cytochrome b sequence. Mol. Phylogenet. Evol. 1996, 5, 467–476. [Google Scholar] [CrossRef]
- Yan, C.J.; Duanmu, X.Y.; Zeng, L.; Liu, B.; Song, Z.Y. Mitochondrial DNA: Distribution, mutations, and elimination. Cells 2019, 8, 379. [Google Scholar] [CrossRef] [Green Version]
- Nielsen, J.L.; Graziano, S.L.; Seitz, A.C. Fine-scale population genetic structure in Alaskan Pacific halibut (Hippoglossus stenolepis). Conserv. Genet. 2010, 11, 999–1012. [Google Scholar] [CrossRef]
- Cheng, J.; Ma, G.Q.; Miao, Z.Q.; Shui, B.N.; Gao, T.X. Complete mitochondrial genome sequence of the spiny head croaker Collichthys lucidus (Perciformes, Sciaenidae) with phylogenetic considerations. Mol. Biol. Rep. 2012, 39, 4249–4259. [Google Scholar] [CrossRef]
- Zhang, L.; Cai, Y.Y.; Yu, D.N.; Storey, K.B.; Zhang, J.Y. Gene characteristics of the complete mitochondrial genomes of Paratoxodera polyacantha and Toxodera hauseri (Mantodea: Toxoderidae). PeerJ 2018, 6, e4595. [Google Scholar] [CrossRef] [PubMed] [Green Version]
- Stepien, C.A. Molecular Systematics of Fishes. In Molecules and Morphology in Studies of Fish Evolution; Carol, A.S., Thomas, D.K., Eds.; Academic Press: San Diego, CA, USA, 1997; pp. 1–11. [Google Scholar] [CrossRef]
- Miya, M.; Nishida, M. Use of mitogenomic information in teleostean molecular phylogenetics: A tree-based exploration under the maximum parsimony optimality criterion. Mol. Phylogenet. Evol. 2000, 17, 437–455. [Google Scholar] [CrossRef] [PubMed]
- Katoh, M.; Tokimura, M. Genetic and morphological identification of Sebastiscus tertius in the East China Sea (Scorpaeniformes: Scorpaenidae). Ichthyol. Res. 2001, 48, 247–255. [Google Scholar] [CrossRef]
- Liu, B.; Shi, Y.; Yuan, J.; Hu, X.; Zhang, H.; Li, N.; Li, Z.; Chen, Y.; Mu, D.; Fan, W. Estimation of genomic characteristics by analyzing k-mer frequency in de novo genome projects. Quant. Biol. 2013, 35, 62–67. [Google Scholar] [CrossRef]
- Luo, R.B.; Liu, B.H.; Xie, Y.L.; Li, Z.Y.; Huang, W.H.; Yuan, J.Y.; He, G.Z.; Chen, Y.X.; Pan, Q.; Liu, Y.J.; et al. SOAPdenovo2: An empirically improved memory-efficient short-read de novo assembler. GigaScience 2012, 1, 18. [Google Scholar] [CrossRef]
- Beier, S.; Thiel, T.; Münch, T.; Scholz, U.; Mascher, M. MISA-web: A web server for microsatellite prediction. Bioinformatics 2017, 33, 2583–2585. [Google Scholar] [CrossRef] [Green Version]
- Jordan, D.; Tao, Y.; Godwin, I.; Henzell, R.; Cooper, M.; McIntyre, C. Exploiting EST databases for the development and characterization of gene-derived SSR-markers in barley (Hordeum vulgare L.). Theor. Appl. Genet. 2003, 106, 411–422. [Google Scholar] [CrossRef]
- Allio, R.; Schomaker-Bastos, A.; Romiguier, J.; Prosdocimi, F.; Nabholz, B.; Delsuc, F. Mitofinder: Efficient automated large-scale extraction of mitogenomic data in target enrichment phylogenomics. Mol. Ecol. Resour. 2020, 20, 892–905. [Google Scholar] [CrossRef] [Green Version]
- Lawson Handley, L.; Read, D.S.; Winfield, I.J.; Kimbell, H.; Johnson, H.; Li, J.; Hahn, C.; Blackman, R.; Wilcox, R.; Donnelly, R.; et al. MitoFish and MitoAnnotator: A mitochondrial genome database of fish with an accurate and automatic annotation pipeline. Mol. Biol. Evol. 2013, 30, 2531–2540. [Google Scholar] [CrossRef]
- Sato, Y.; Miya, M.; Fukunaga, T.; Sado, T.; Iwasaki, W. MitoFish and MiFish Pipeline: A mitochondrial genome database of fish with an analysis pipeline for environmental DNA metabarcoding. Mol. Biol. Evol. 2018, 35, 1553–1555. [Google Scholar] [CrossRef]
- Kumar, S.; Stecher, G.; Tamura, K. MEGA X: Molecular evolutionary genetics analysis across computing platforms. Mol. Biol. Evol. 2018, 6, 1870–1874. [Google Scholar] [CrossRef] [PubMed]
Publisher’s Note: MDPI stays neutral with regard to jurisdictional claims in published maps and institutional affiliations. |
© 2021 by the authors. Licensee MDPI, Basel, Switzerland. This article is an open access article distributed under the terms and conditions of the Creative Commons Attribution (CC BY) license (https://creativecommons.org/licenses/by/4.0/).