Article

Elements’ Content in Stream Sediment and Wildfire Ash of Suburban Areas in West Attica (Greece)

by
Maria Doufexi
,
Dimitra E. Gamvroula
and
Dimitrios E. Alexakis
*
Laboratory of Geoenvironmental Science and Environmental Quality Assurance, Department of Civil Engineering, School of Engineering, University of West Attica, 250 Thivon & P. Ralli Str., 12241 Athens, Greece
*
Author to whom correspondence should be addressed.
Water 2022, 14(3), 310; https://doi.org/10.3390/w14030310
Submission received: 18 December 2021 / Revised: 15 January 2022 / Accepted: 17 January 2022 / Published: 20 January 2022
(This article belongs to the Section Water Quality and Contamination)

Abstract

:
The composition of sediments and other materials occurring in streams, geochemical processes within the drainage basin, and various land uses are among the main factors influencing stream water composition. Stream sediment and wildfire ash samples were gathered from the area studied. The applied methodology consists of aqua regia and Diethylene-Triamine-Penta-Acetic acid (DTPA) chemical extraction; Cation Exchange Capacity (CEC), pH, and soil organic matter (OM) determination; a Geographic Information System (GIS) database; factor analysis; and determination of the contamination factor (CF) for the assessment of contamination degree. This study aimed to evaluate the elements’ content in stream sediments of Kineta and Nea Peramos areas (West Attica, Greece) and investigate any relationship between elements (aqua regia and DTPA extracted) in stream sediment and ash in wildfire and flood-impacted areas. The stream sediments’ properties, the bioavailable forms of copper (Cu), iron (Fe), manganese (Mn) and zinc (Zn), and the total content of other potentially toxic elements in wildfire ash samples, are discussed. This research estimated moderate contamination for FeDTPA, MnDTPA and ZnDTPA in stream sediments of the study area. Contamination for CuDTPA and moderate contamination for ZnDTPA in the stream sediments of the Nea Peramos area was recorded. Factor analysis results suggested that the contents of FeDTPA, MnDTPA, CuDTPA and ZnDTPA in the study area’s stream sediments may affect the chemistry of stream water.

1. Introduction

Stream and river sediments are an active part of the drainage basin, reflecting the geological and anthropogenic contamination sources [1,2,3,4]. The European Commission has recognized the importance of contaminated sediments as a water quality problem across the European countries. Trace elements may be added to an aquatic ecosystem either by natural (e.g., weathering of rocks and sediments) [5] or anthropogenic sources (wastewater, fossil fuel combustion, atmospheric pollutant deposition) [6,7]. Trace element contents originate from erosion, rock-water interaction and topsoil leaching [8,9], and riparian and floodplain interactions [10,11]. The concentration of trace elements accumulated in stream sediments may increase after a forest fire or a flooding event [12,13,14,15,16]. Swindle et al. [17] reported that water-soluble components of ash, which remains on the soil surface after fires, can leach into the soil and be transported through runoff, and particulate residues can be transported via erosion and runoff. Walling [18] and Glaser et al. [19] concluded that a strong interaction between stream sediment and suspended particles exists. Moreover, according to Walling [18] and Glaser et al. [19] the suspension load consequently represents a mixture of particles from different locations, mobilization history within catchment area, and anthropogenic or natural sources.
The study area is situated between latitudes 37°57′ and 38°00′ and longitudes 23°12′ and 23°24′. It includes Kineta and Nea Peramos areas, located about 55 and 35 km west of Athens, respectively (Figure 1).
The present research deals with stream sediment and geochemical properties in western Attica areas affected by wildfire (Kineta area) and flood (Nea Peramos area). The wildfire event on 23 July 2018 in the Kineta area burned houses and settlements and thousands of hectares of forestry, while the flooding event on 15 November 2017 in the Nea Peramos area resulted in significant damage to houses, stores, and the harbor (Figure 1). The primary geological formations in the areas studied include sandstones, dolomites, marls, marly formations with Mn-oxides, limestones, serpentinites, manganese ore deposits, peridotite bodies, schists, and volcanic rocks [20,21,22,23,24,25,26].
This study aimed to: (a) record the present elements’ content in stream sediments in the area studied; and (b) evaluate the stream sediments’ contamination in the study area.

2. Materials and Methods

2.1. Sampling

A total of twenty-six sediments (depth 0–10 cm) and five wildfire ash samples were gathered from streams located in the West Attica region (Figure 1). Twenty-two sediment samples and five ash samples were collected from the Kineta stream on 18, 24, and 26 September 2018 (Sampling sites S1–S22), and four sediment samples were collected from the Nea Peramos stream on 25 November 2017 (Sampling sites S23–S26) (Figure 1). Stream sediment samples were collected using a hammer and a polypropylene shovel. Ash samples were gathered in streams within the boundary of the wildfire-impacted area using plastic tools. All samples were stored in clean polyethene (PE) bags.

2.2. Pretreatment of Sediment and Ash Samples

Pretreatment of stream sediment and wildfire ash samples was performed at the Laboratory of Geoenvironmental Science and Environmental Quality Assurance of the University of West Attica. All samples were dried indoors at room temperature (<25 °C) for seven days and sieved first to <2 mm and second to <0.2 mm using a nylon sieve. Then, fine-grained sediment samples were stored in clean polyethene bags for the determination of the extracted elements (Cu, Fe, Mn, and Zn) by Diethylene-Triamine-Penta-Acetic Acid (DTPA) and the measurement of sediment properties (pH, OM, and CEC). Contact with metallic components was avoided throughout laboratory procedures to prevent metal cross-contamination.

2.3. Grain Size Distribution

The size distribution of stream sediment particles (sand < 0.02–2 mm); silt < 0.002–0.02 mm; clay < 0.002 mm) was estimated using the method established by Bouyoucos [30] for eight stream sediment samples (n = 8).

2.4. Measurement of Physicochemical Stream Sediment Properties

CEC in stream sediment samples was determined by the barium chloride extraction method [31]. The detection limit of this method (LOD) is equal to 0.0214 mmol/L. According to this method [31], 2.5 g of each stream sediment sample was sieved at 0.2 mm, placed into 50 mL polyethene tubes, and then 30 mL BaCl2 was added. Then, the mixture of stream sediment and BaCl2 was shaken for 60 min and inserted into a centrifuge for 10 min. After 10 min, the tubes were removed by centrifugation, and the supernatants were discarded. The concentrated BaCl2 addition, agitation, centrifugation, and removal of supernatants were repeated two more times. After the third repetition, 30 mL of diluted BaCl2 were added to tubes which were shaken overnight. A day later, the tubes were removed from the stirrer and inserted in the centrifuge for 10 min. Consequently, the supernatants were removed, and 30 mL MgSO4 was added. The next day, centrifugation was carried out, and the supernatants were collected.
Stream sediment pH was determined in the water-saturated sample by adding distilled water using a Mettler Toledo FE20 Benchtop pH meter, which was calibrated using pH 4.01 and 7.01 buffer solutions (at 25 °C) provided by Merck® (Darmstadt, Germany). An in-house reference soil material (pH value 7.42) was applied to check the precision and accuracy of pH measurements found within international limits.
OM content (% wt) in stream sediment samples was measured by the dichromate oxidation method [32]. This method for the analysis of OM does not have a specific LOD. According to this method, 0.2 g of each fine-grained stream sediment sample was placed into 500 mL conical flasks, and 10 mL K2Cr2O7 was added. After the mixture of sediment and K2Cr2O7 was agitated, 20 mL concentrated H2SO4 was added, shaken for 1 min and left to stand for 30 min. Finally, approximately 200 mL of distilled water, 10 mL of concentrated H3PO4, and 1 mL of diphenylamine indicator were added, and the excess of K2Cr2O7 was titrated with FeSO4 until the change of the indicator color from blue to green. During the OM measurement in sediments, a quality control sample was analyzed as reference material. This material is a soil sample for which the OM content was known (approximately 4 wt %) because it was measured many times at laboratory conditions.
The homogenized < 0.2 mm stream sediment fraction was treated with the DTPA extraction method [33]. According to this method, 25 g of each stream sediment sample was placed in 250 mL conical flasks, and then 50 mL DTPA was added. After the mixture of sediment and DTPA was shaken for 120 min, the solution was filtered, and the supernatant was collected in polyethene bottles. The supernatants were analyzed for Cu, Fe, Mn, and Zn by atomic absorption spectroscopy (AAS) using a Varian SpectrAA 220 model. The soil reference materials purchased from the NIST (Nationals Institute of Standards and Technology), SRM 2710 and SRM 2711, and an in-house soil reference material were applied to monitor the procedure of chemical measurements. The element’s content of soil reference samples was routinely measured to determine analytical errors (accuracy < 10%). For every ten measurements of element content in samples, a duplicate measurement was performed to estimate the precision of chemical analysis (precision 2–3%). The LODs CuDTPA, MnDTPA, FeDTPA, and ZnDTPA were 0.05, 0.125, 0.05 and 0.03 (mg L−1), respectively.

2.5. Determination of Elements in Wildfire Ash

The wildfire ash samples were digested in a graphite heating block with an aliquot of the aqua-regia acid solution (HCl:HNO3, 3:1 v/v). After cooling, the solution was diluted to 12.5 mL with deionized water, and mixed and analyzed for Ag, Al, As, Be, Bi, Ca, Cd, Co, Cr, Cu, Fe, Ga, Hg, K, La, Mg, Mn, Ni, P, S, Sb, Sc, Sr, Th, Ti, Tl, U, V, W, and Zn by ICP-AES (inductively coupled plasma-atomic emission spectrometry). The analytical results were corrected for inter-element spectral interferences. The laboratory measurements of elements in ash were conducted at Analytical Laboratories (ALS) OMAC Laboratories Limited in Galway, Ireland (ISO 17025:2005 Accredited) [34].

2.6. Data Treatment and Spatial Representation

The statistical treatment of the dataset was conducted using Microsoft Excel® (Redmond, Washington, DC, USA) and IBM SPSS® Statistics (International Business Machines Corporation; Statistical Product and Service Solutions; Armonk, NY, USA) for Windows. The univariate statistics of the geochemical (CuDTPA, FeDTPA, MnDTPA, and ZnDTPA) and physicochemical properties (OM, CEC, and pH) datasets were calculated. The statistical analysis revealed that CuDTPA, FeDTPA, MnDTPA, and ZnDTPA were positively skewed because the arithmetic means were more significant than the median. A logarithmic (base 10) transformation was applied to normalize this effect. The dataset of West Attica stream sediment was examined for outlying values using Tukey boxplots [35]. Outlying values were omitted, and the Cumulative Distribution Frequency (CDF) diagrams were constructed. Then, threshold values are calculated through CDF diagrams. The determination of the threshold values aims to investigate contamination due to anthropogenic and geological sources. The dataset of stream sediments was treated by the statistical techniques of R-mode factor analysis applying the varimax-raw rotational technique with Kaiser Normalization to determine the common origin of the elements. The multivariate statistics analysis was applied for CEC, OM, CuDTPA, FeDTPA, MnDTPA, and ZnDTPA. The selection of the above-mentioned parameters was based on the anthropogenic activities, ore composition, and lithology of the West Attica region. All maps in this study were created using the ArcMap 10.4 GIS (ESRI®) software platform (Environmental Systems Research Institute; Redlands, CA, USA). The natural breaks procedure was applied to select the score classes. The statistical parameters of the aqua regia extracted elements in ash samples were evaluated by comparing their content to Sediment Quality Criteria.

3. Results and Discussion

3.1. Physicochemical Properties of Stream Sediments

The grain size analysis of the stream sediment samples showed that sand dominates in Kineta and Nea Peramos stream sediments, and silt and clay follow with lower percentages. Specifically, the median content values amount to 65.78% sand, 21.70% silt, and 11.38% clay in Kineta area stream sediments, and differ in percentage terms from the values of Nea Peramos area, which correspond to 13.63% clay, 21.43% silt and 64.94% sand. By plotting the above values on a triangular diagram, it was concluded that the stream sediments of the area studied can be classified as Sandy Loam (SL) [36]. The pH values in sediments of West Attica ranged from 7.30 to 8.28 and 7.17 to 7.68 for Kineta and Nea Peramos streams, respectively (Table 1).
The results showed that sediment pH values were near neutral to slightly alkaline. The slightly alkaline pH value is due to the strong buffering capacity of the carbonates in the sediment fraction [37]. Values of pH recorded in stream sediments in wildfire-impacted areas did not show a significant statistical difference (p-value = 0.35 > 0.05). Specifically, a low pH increases from 7.63 to 7.67 was observed in sediment samples (Table 1). This increase is because the wildfire-impacted areas contained burned OM particles, either low or high quantities, which are transported in streams, increasing sediment pH. According to Faria et al. [38], the burned OM is derived from the oxidation of soil OM and the loss of hydroxyl groups (OH), which is provoked by the wildfire event and the decomposition process of organic acids. The mean pH value in stream sediment of the non-flood-impacted area was 7.68 (Table 1). Moreover, Vincent et al. [39] reported a decrease in pH value in sediments collected from the flood-impacted area of Asaba (Nigeria), which was explained by acid production during sediment resuspension in floodwater, while alkaline sediment decreases pH, and acid sediment increases pH, during a flooding event.
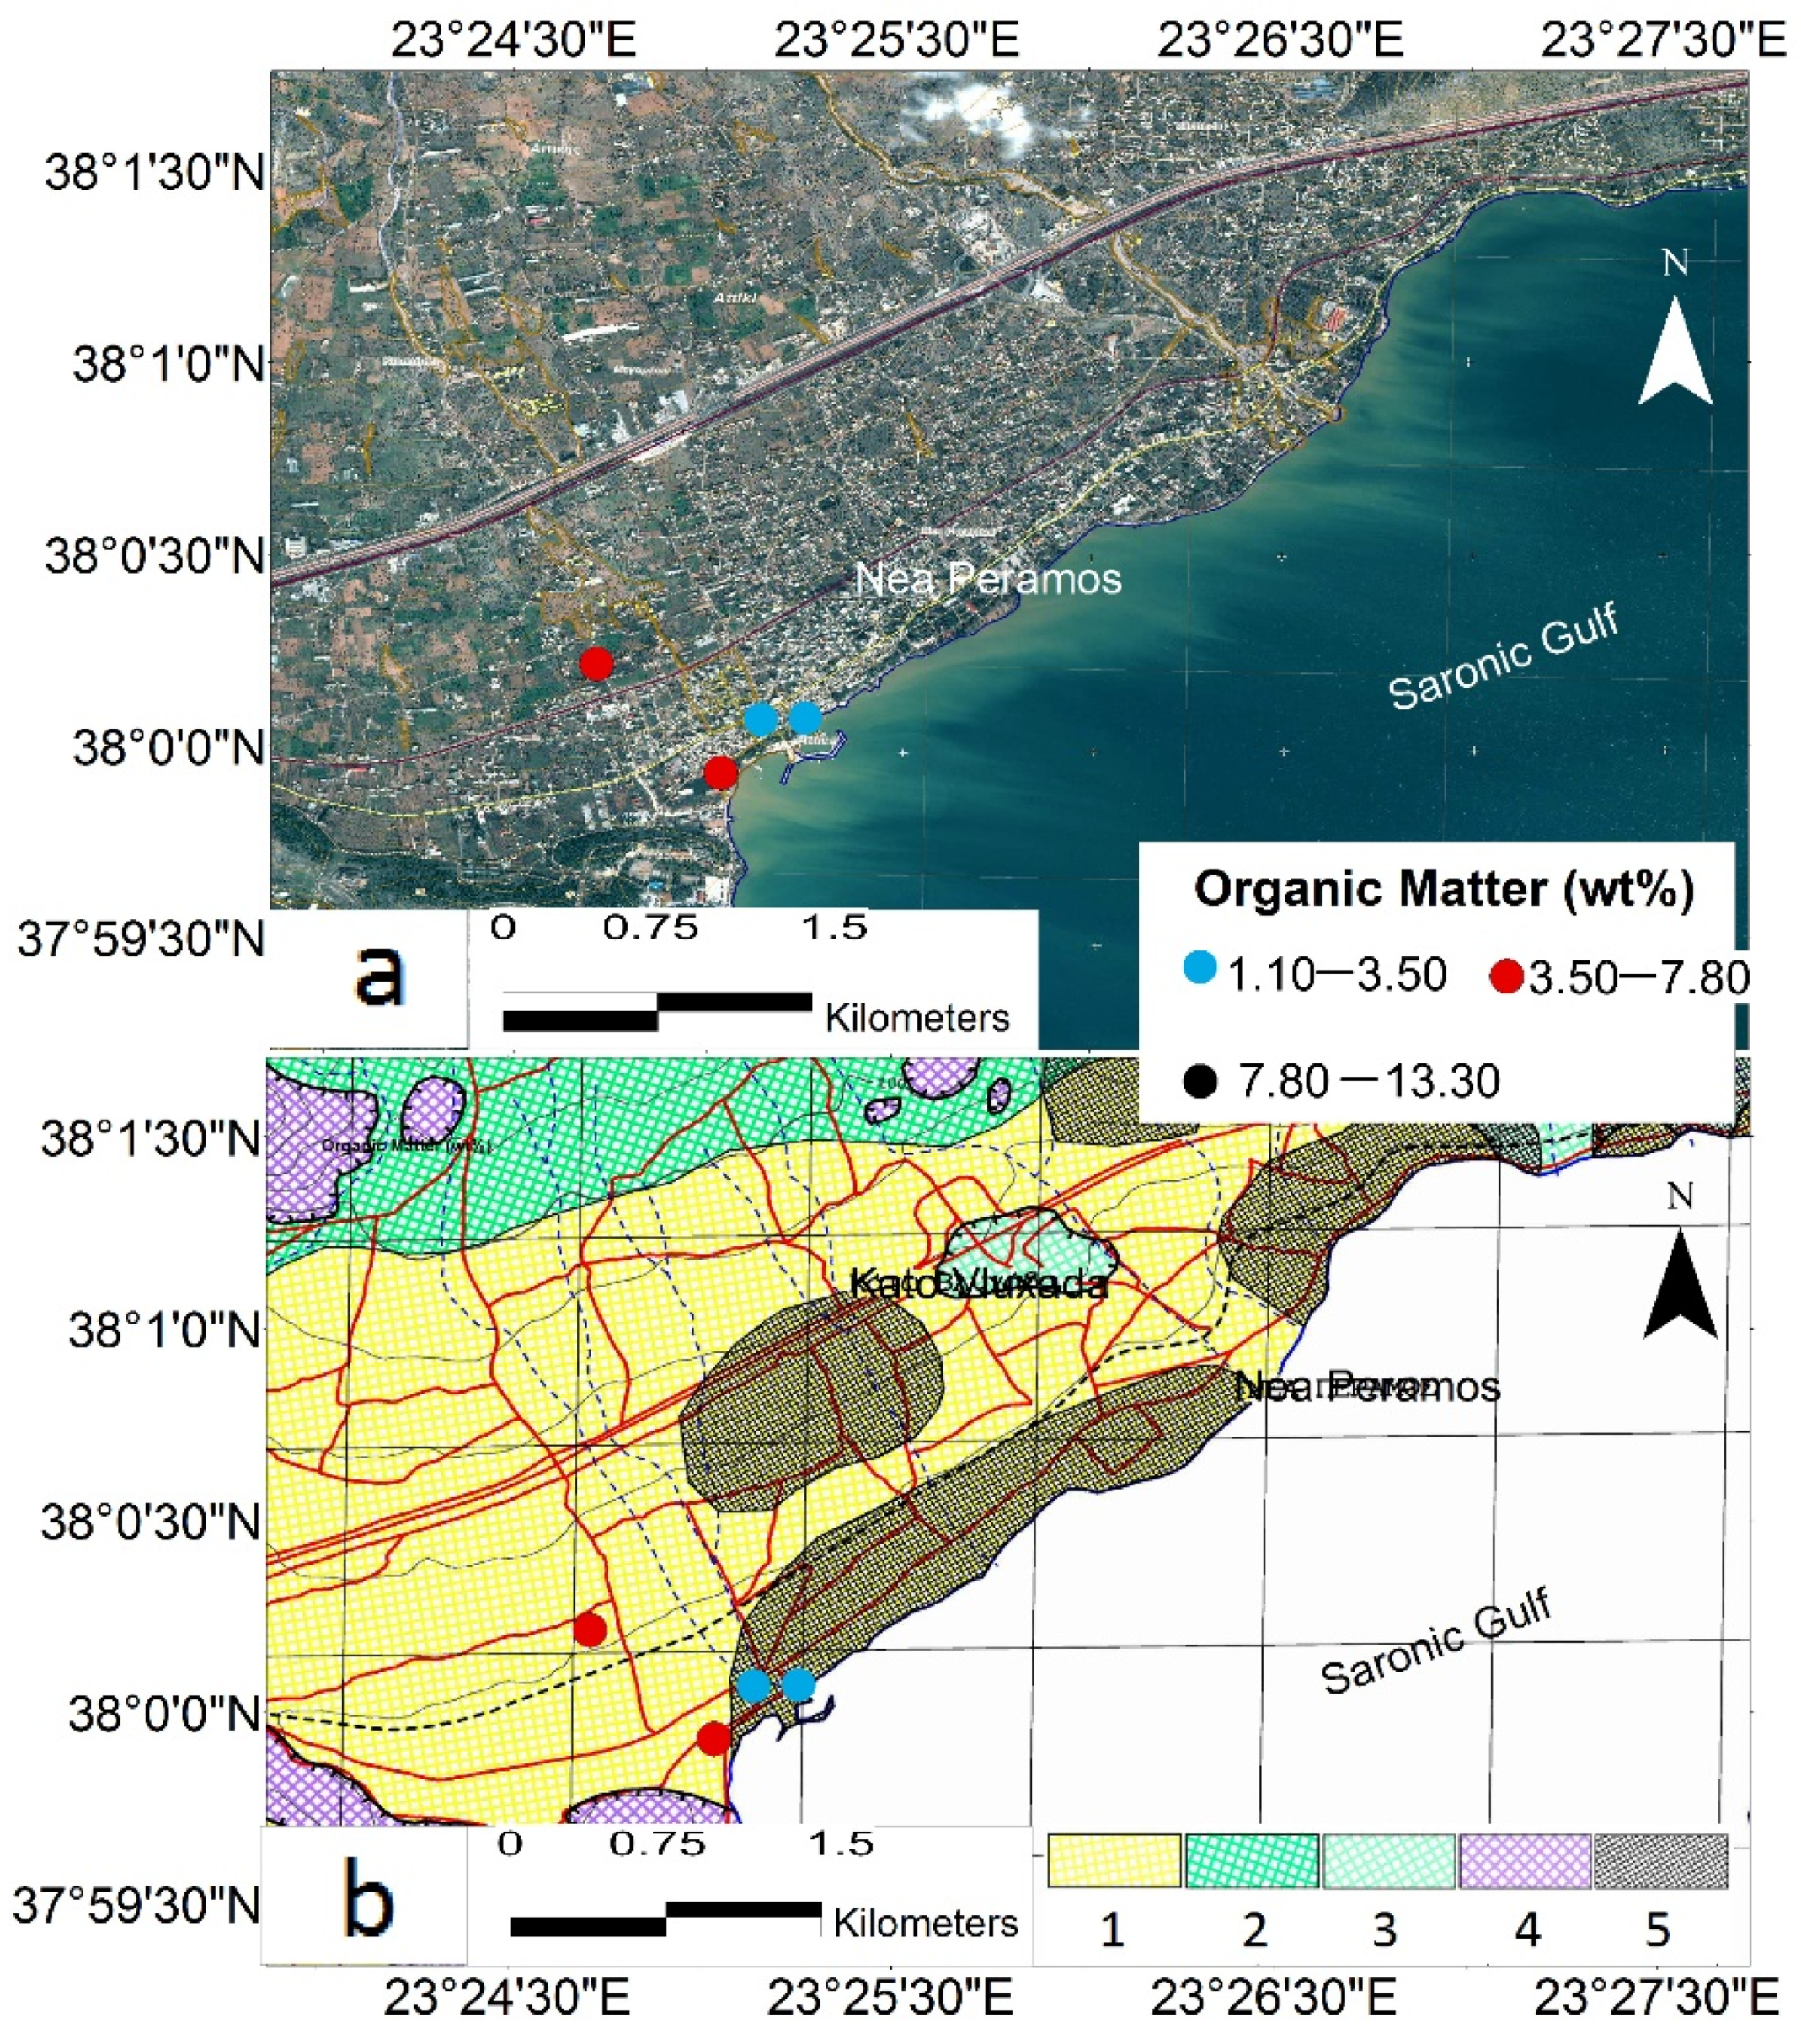
Organic matter content in sediment ranged from 1.10 to 13.30 wt% and 1.10 to 6.04 wt% in Kineta and Nea Peramos streams, respectively (Figure 2 and Figure 3). A comparison between the mean value of OM in the sediment of wildfire impacted (8.00 wt%) and non-impacted areas (8.81 wt%) of Kineta revealed a non-significant statistical increase (p-value = 0.29 > 0.05), which is explained by the presence of ash removed from forest soil after a wildfire and transported into streams. The OM content in stream sediment of flood-impacted areas of Nea Peramos was lower than the OM content in stream sediment of non-impacted areas because soil OM such as organic acids or humus is diluted in water, resulting in a decrease in its concentration in the particulate phase [39]. Moreover, De Marco et al. [40], who performed experimental fires in a Mediterranean maquis (south-western Italy), reported that burned soils presented higher concentrations of OM than control soils over the whole period of study. In Nea Peramos streams, the flood-impacted area showed high OM content in sediment (Figure 3).
Cation Exchange Capacity (CEC) ranged from 14.1 to 38.7 cmol Mg2+ Κg−1 and from 4.04 to 14.1 cmol Mg2+ Κg−1 in stream sediments of Kineta and Nea Peramos areas, respectively (Table 1). According to the classification proposed by Hazelton and Murphy [41], the CEC values of stream sediments in the Kineta area are classified from moderate to high, whereas CEC values of stream sediments are classified as low for the Nea Peramos area. Moreover, the comparison of CEC mean values between non-wildfire-impacted (24.7 cmol Mg2+ Κg−1) and impacted (24.8 cmol Mg2+ Κg−1) areas showed an increase of 0.32%, which is explained by the increase in negative charges and consequently the retention of more cations [42,43], but this difference was not statistically significant (p-value = 0.49 > 0.05). However, an analysis of the sampling sites of the Kineta area showed that some sites presented low CEC, whereas OM content in the sediment was high. This is attributed mainly to the clay content in sediment because the CEC value is controlled by, among other factors, the negative charges of clay minerals [44]. Moreover, concerning the Nea Peramos stream sediments, a significant decrease in CEC was observed in non-flood-impacted (13.2 cmol Mg2+ Kg−1) compared to impacted areas (9.23 cmol Mg2+ Κg−1), which can be attributed to the low OM content in sediments of flood-impacted areas [45].

3.1.1. DTPA-Extractable Elements Content in Stream Sediments

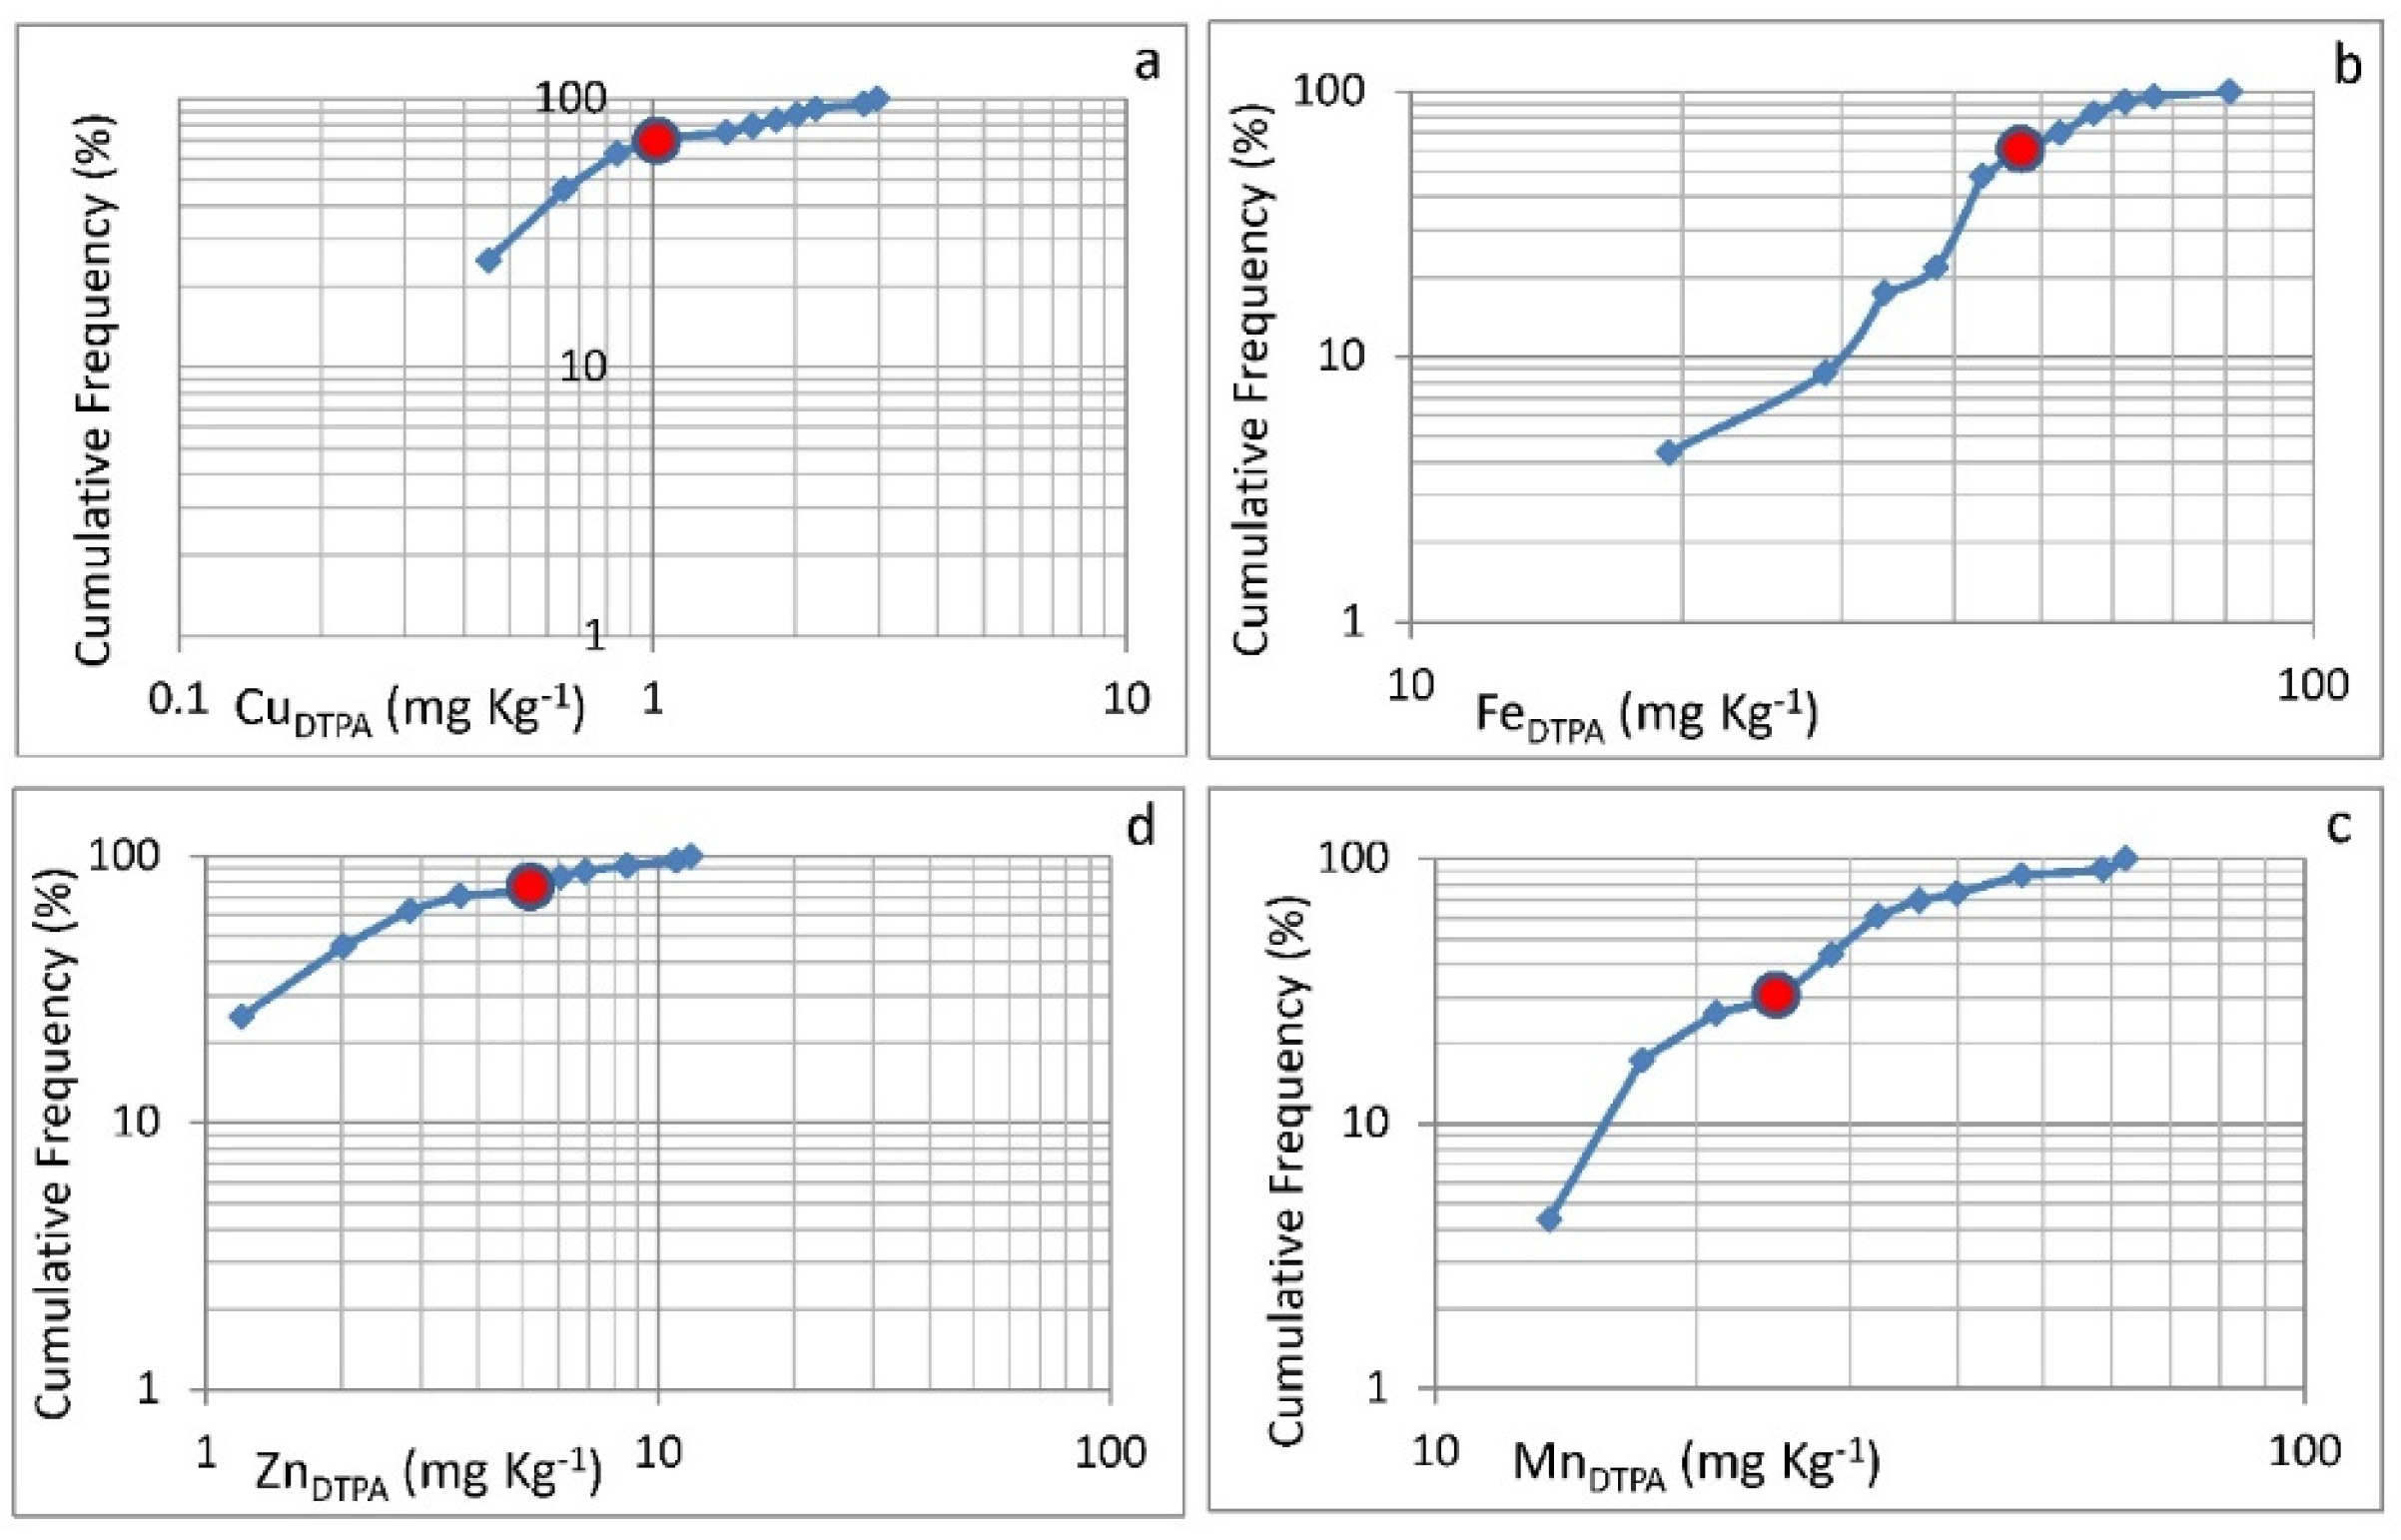
The mean contents of CuDTPA and ZnDTPA were higher in stream sediment in wildfire-impacted areas compared to non-impacted areas (Table 1). However, the statistical difference of these elements was not significant (p-values = 0.11 and 0.09 for CuDTPA and ZnDTPA, respectively). The mean value of MnDTPA content was lower in the sediment of wildfire-impacted areas than areas that were non-impacted by wildfire, without statistical significance (p-value = 0.34 > 0.05). The MnDTPA content in soils affected by wildfire can be attributed to the decomposition of forest species leaves, which releases Mn [46]. Moreover, the mean values of FeDTPA and MnDTPA content in stream sediment were higher in areas impacted by flooding compared to FeDTPA and MnDTPA content in sediment of area not impacted by flooding, whereas the mean values of CuDTPA and ZnDTPA in stream sediment collected from flood-impacted areas were decreased compared to the corresponding values in stream sediments of non-impacted areas. According to the univariate statistical analysis, the threshold values of FeDTPA, MnDTPA, CuDTPA, and ZnDTPA of the West Attica stream sediments were extracted from the Cumulative Frequency Diagrams (CDF) using criteria as breaks and inflection points (Figure 4). Threshold values for CuDTPA, FeDTPA, MnDTPA, and ZnDTPA were 1, 38, 24.8, and 5 mg Κg−1, respectively (Figure 4).
The contamination factor (CF) was estimated by the average and threshold value of each element according to the following mathematical equation proposed by Hakanson [47]:
CF = C m C n
where Cm is the average content of trace metals, and Cn is the threshold concentration of each element.
The results showed that CF varied from 1 to 3 in Kineta stream sediments for FeDTPA, MnDTPA, and ZnDTPA and CF < 1 in Nea Peramos stream sediments for FeDTPA and MnDTPA. Conversely, the CF of CuDTPA was classified as significant contamination (3 < CF < 6) in Nea Peramos stream sediments, whereas it was found to be low in Kineta sediments (Table 2).

3.1.2. Elements Content in Ash

The most abundant element in ash collected in the streams of the area studied was Ca (17%), with Mg (4.03%), Fe (2.40%), and Al (1.21%) also present in elevated concentrations. In contrast, the elements found in lowest contents were Cd (0.65 μg Kg−1), Be (0.65 μg Kg−1), and Sb (2 μg Kg−1) (Table 3).
The mean values in ash collected in the streams of the study area for Ca, Cd, Co, Cr, Cu, Fe, Ga, La, Mg, Ni, S, Sc, and Sr were higher than the median values in ash collected in the drainage basin of the area studied, as reported by Alexakis [12] (Table 3), highlighting the variation in element concentration within the ash. Wan et al. [48] reported that the median value of trace elements content in ash samples collected from the southern California Thomas fire were the following (in mg Kg−1): As (5.39), Cd (0.77), Cr (50.7), Cu (74), Ni (33.3), and Zn (225), which are higher only for Cu and Zn compared to the corresponding mean values of the study area (Table 3). The oxide and hydroxides of Ca, Mg, and P were abundant in ash samples collected in the area studied. Similar findings were reported by Perreira and Ubeda [49] and Silva et al. [50], who studied wildfire ash composition in the Lisbon region (Portugal) and District of Aveiro (Portugal), respectively. The effect of ash leaching on stream chemistry in the Kineta area may increase, among others, the K+ content in seawater of Saronic Gulf. Despite the fact that any increase in the K+ content in seawater would likely be transient, it may influence the biological activity along the coast of the Kineta area. Swindle et al. [17], who studied the effects of wildfires and ash leaching on stream chemistry in Southern California, reported that direct input of large amounts of stream sediments and ash that have an elevated content of extractable K+ may increase the K+ content in seawater. According to Swindle et al. [17], increases in the K+ content in seawater of the California coast may influence marine organisms. Because the ash samples collected in the Kineta area were not chemically analyzed for the water-soluble concentration of major and trace elements, the solubility of elements in six composite ash samples provided by Harper et al. [51] was adopted. According to this convention, the following water-soluble concentrations of elements in ash of the Kineta area were estimated as follows: Al (<0.002%), As (0.09–0.67 mg Kg−1), Ca (0.01–0.61%), Cd (<0.02 mg Kg−1), Cu (0.16–4.13 mg Kg−1), Fe (0.001%), Mg (<1.03%), Mn (0.05–3.46 mg Kg−1), Ni (2.06–21.39 mg Kg−1), and Zn (<8.64 mg Kg−1). The calculated water-soluble elements suggest that a noticeable amount of potentially toxic elements is released by rainwater from wildfire ash and finally transported to Saronic Gulf.
The mean concentrations for Ca, Co, Cd, Cr, Cu, Fe, Mg, Ni, P, Sr, and Zn in the ash of the study area are higher than the corresponding values in the mean sediment reported by Salminen et al. [52] (Table 3). The mean contents for As, Cd, Cr, Cu, Fe, Mn, and Ni in wildfire ash in the Kineta area exceed the Sediment Quality Criteria [53] (Table 3). Therefore, wildfire ash constitutes a contamination source for the stream sediments of the area studied.

3.1.3. Evaluating Elements’ Contamination Sources in Stream Sediments

Factor analysis (KMO = 0.678 and Barlett test <0.001) with principal component extraction and varimax rotation with Kaiser Normalization explained in terms of two factors the distribution of the element in the stream sediments of the study area (n = 26). The total cumulative variance of the studied dataset was 80.8% (Table 4).
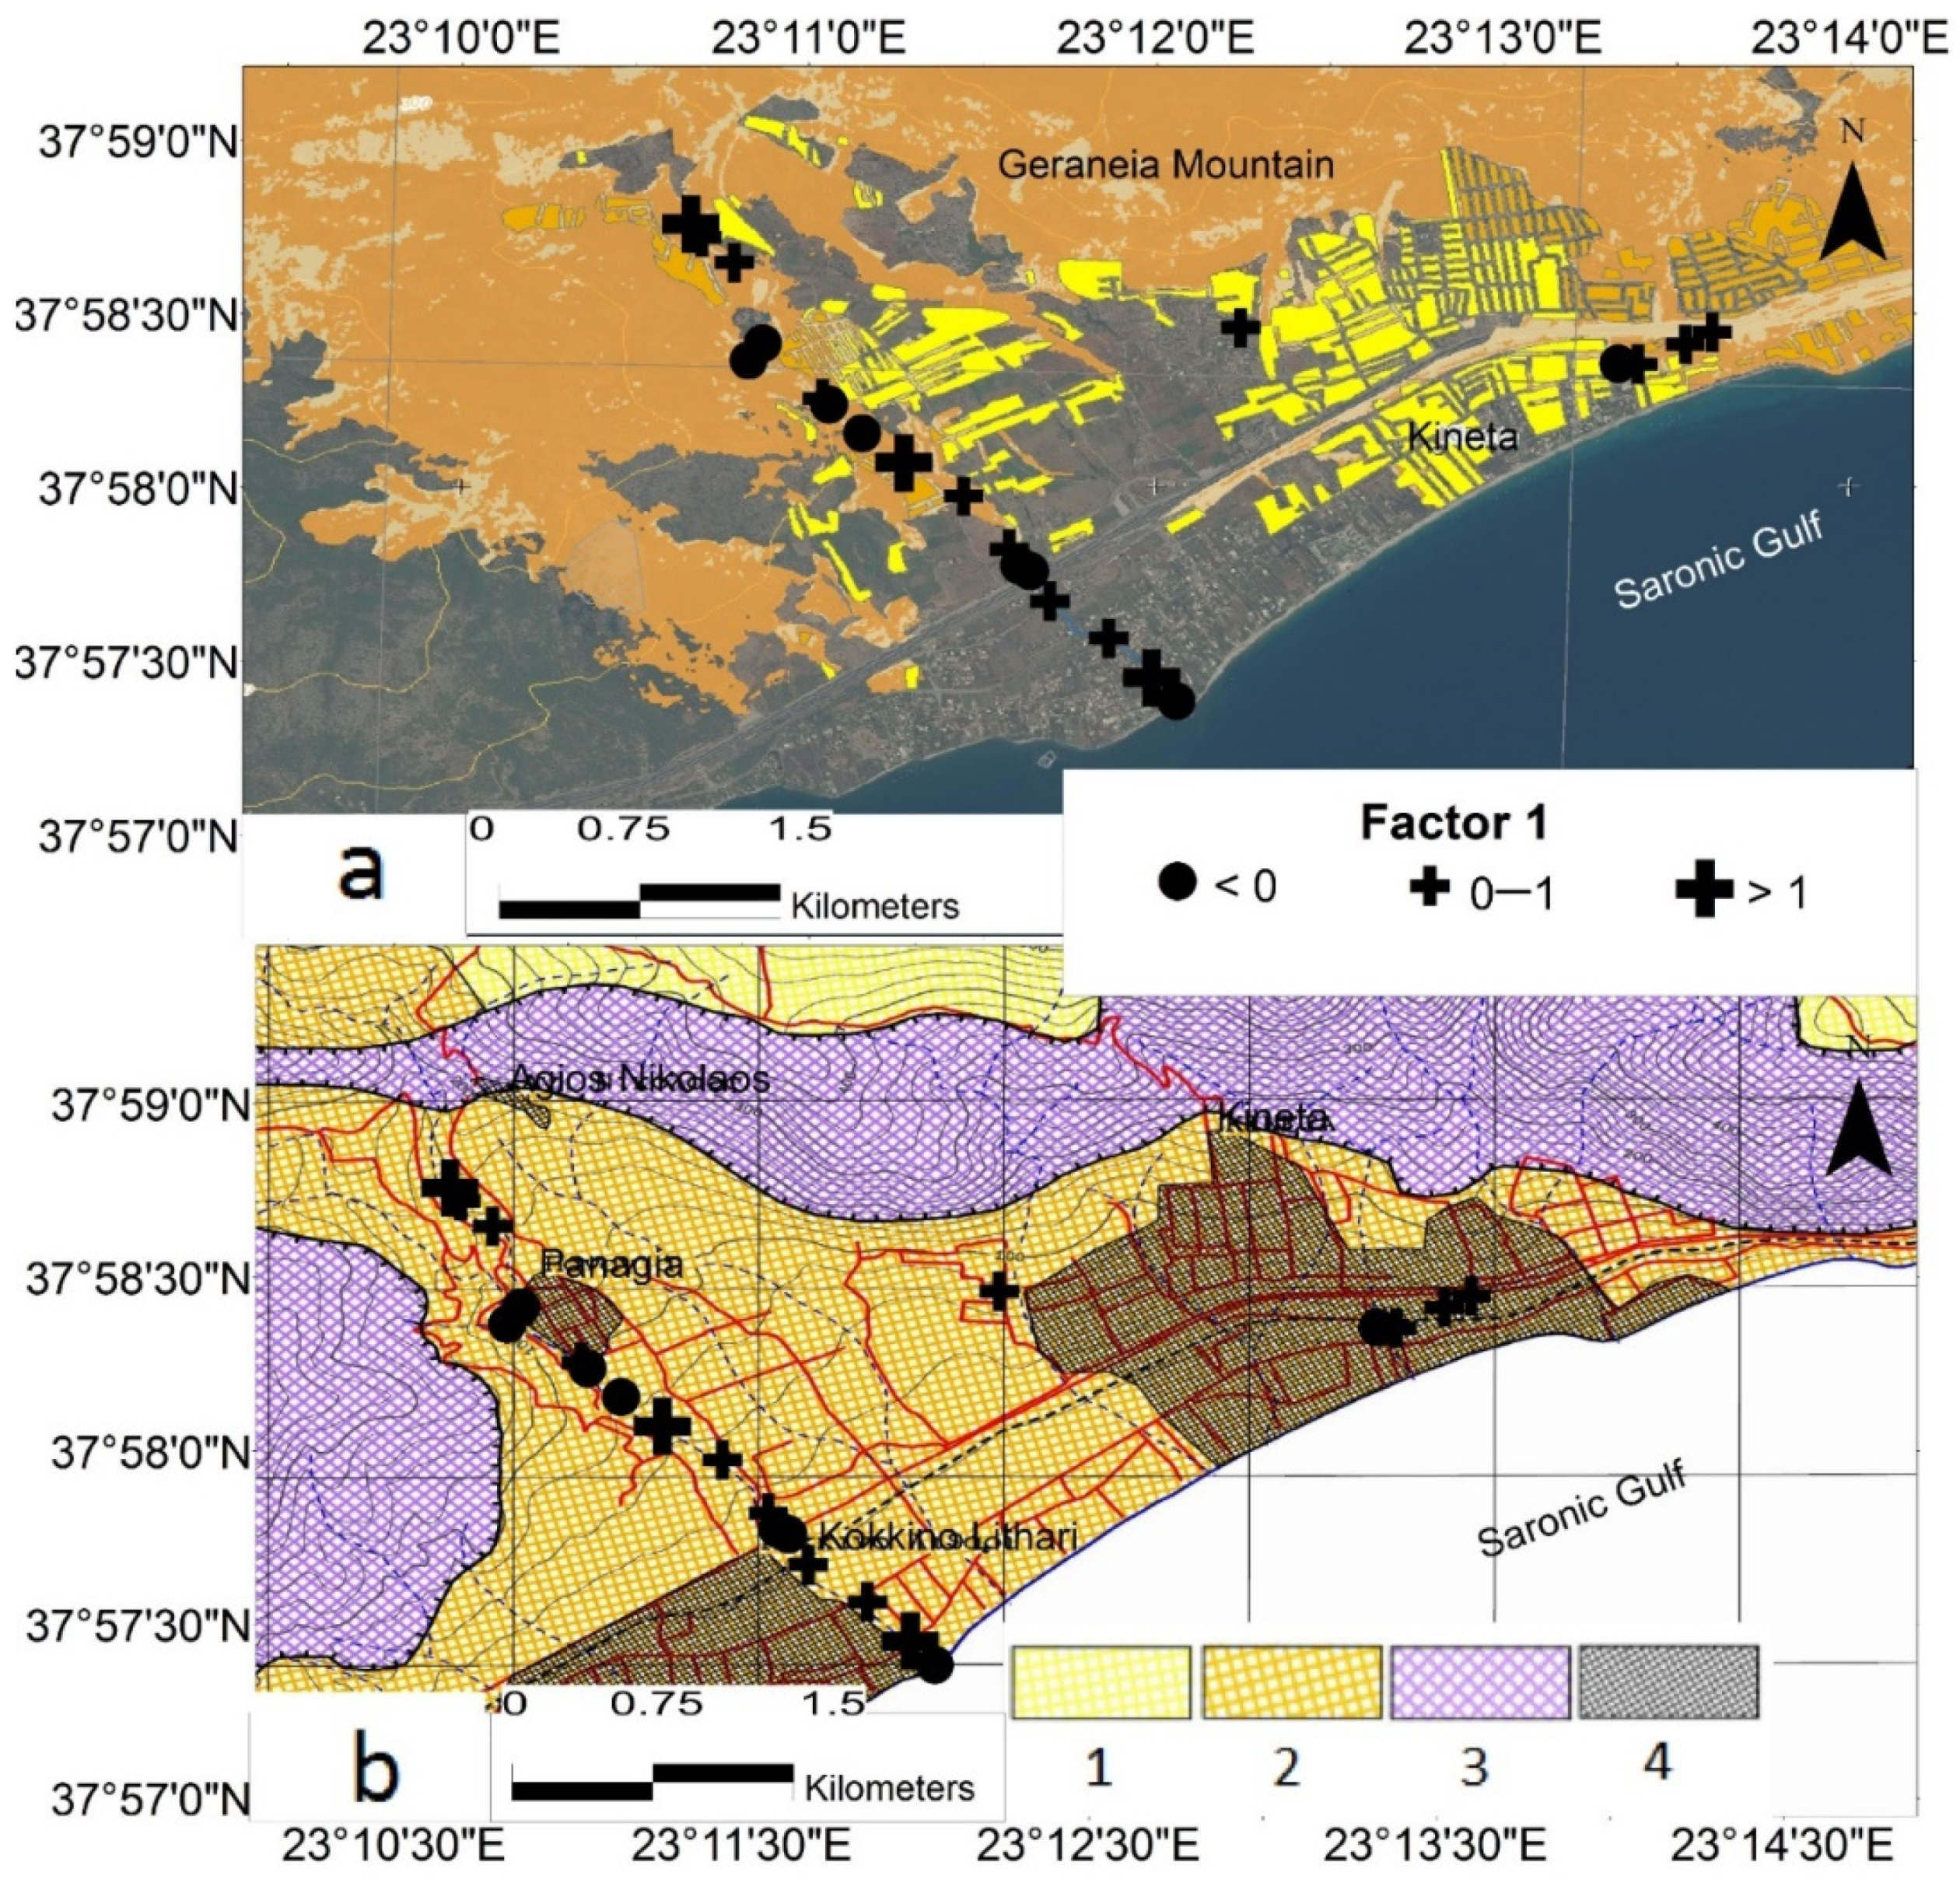
Factor 1 represents 50% of the total variance with high positive loadings (greater than +0.800) for FeDTPA, MnDTPA, OM, and CEC (Table 4). Factor 1 revealed the relation existing between OM and CEC. Alexakis et al. [54] conducted a soil geochemical survey in the wildfire-impacted area of Kineta and reported the same existing relation between OM and CEC. Furthermore, many researchers in other case studies [55,56] have also reported a similar relation. Iron and Mn are known to occur in the marl formations outcropping in the Kineta area [20,21,54]; therefore, Factor 1 is attributed mainly to the contribution of wildfire events to the remobilization of Mn oxides. Many researchers have reported similar findings [12,54,57,58,59,60] for Mn content in forest soil after wildfires. Gamvroula et al. [22] reported that the presence of Mn in soil and water at the Megara basin can be attributed to the Mn oxides present within Neogene deposits and the weathering products of Neogene deposits. Higher positive loadings (greater than +0.800) for FeDTPA, MnDTPA, OM, and CEC were recorded in the Kineta area (Figure 5). Lower positive loadings for FeDTPA, MnDTPA, OM, and CEC were observed in flood-impacted and non-impacted areas (Figure 6).
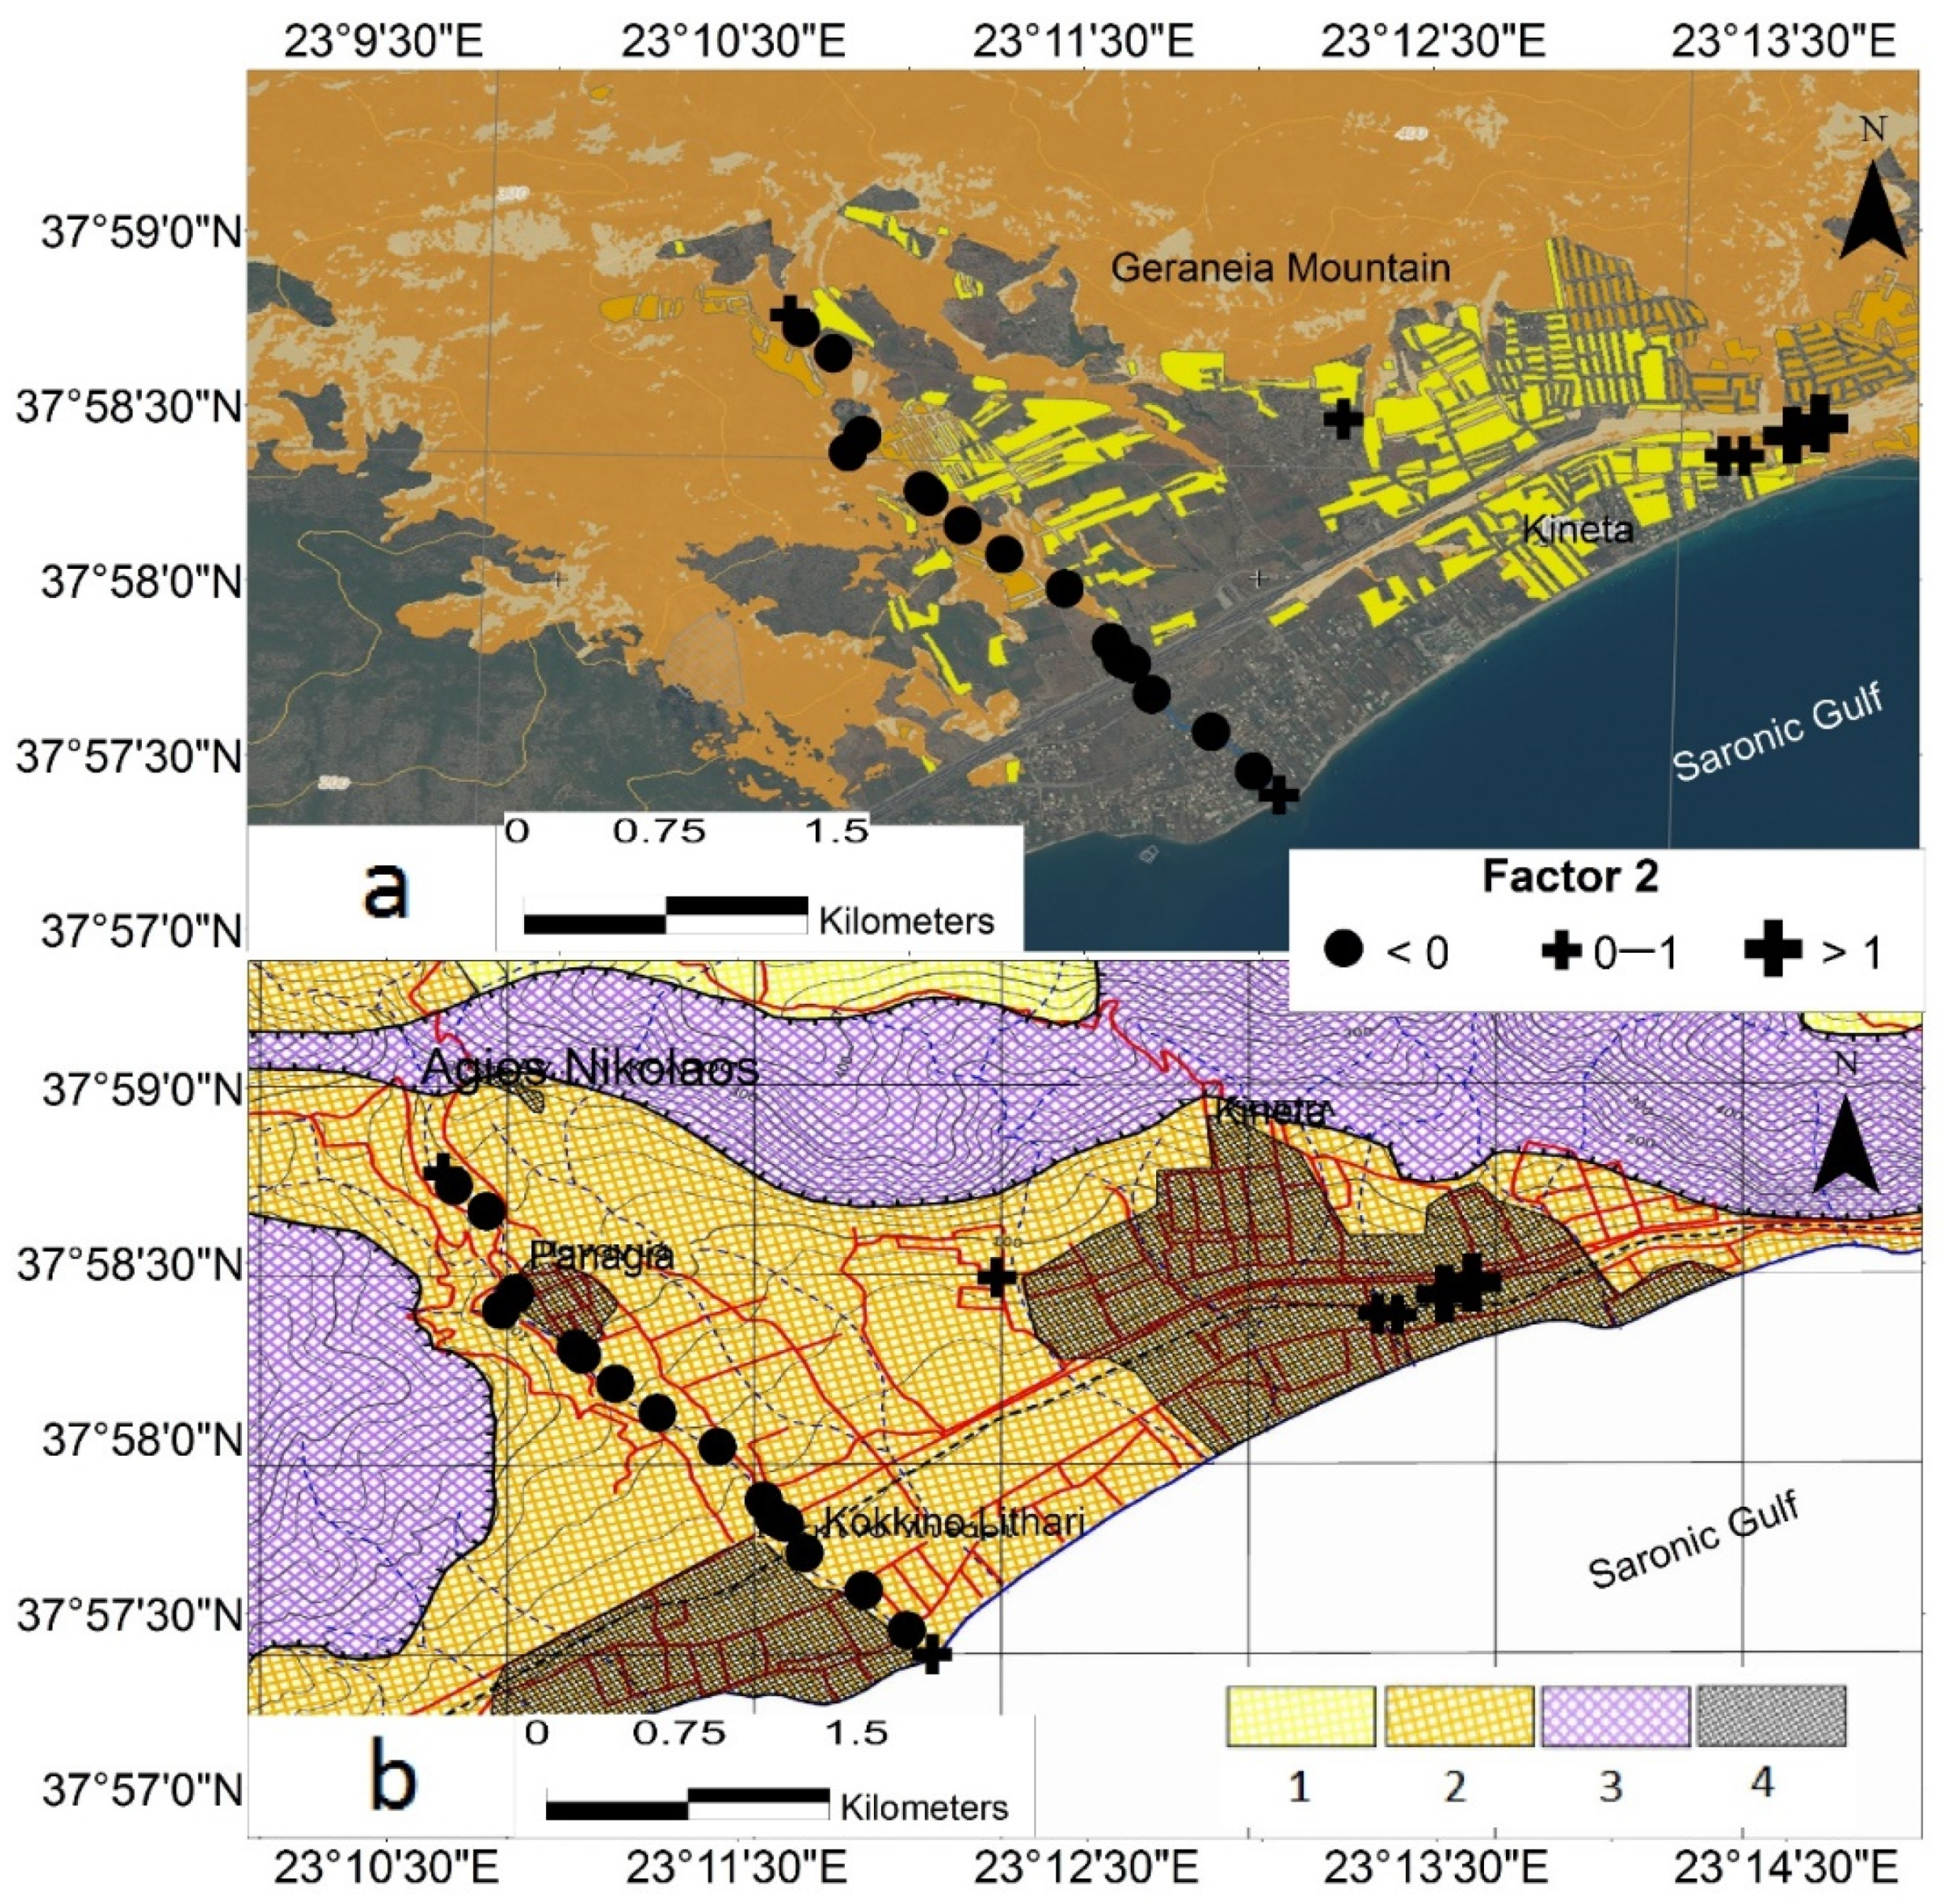
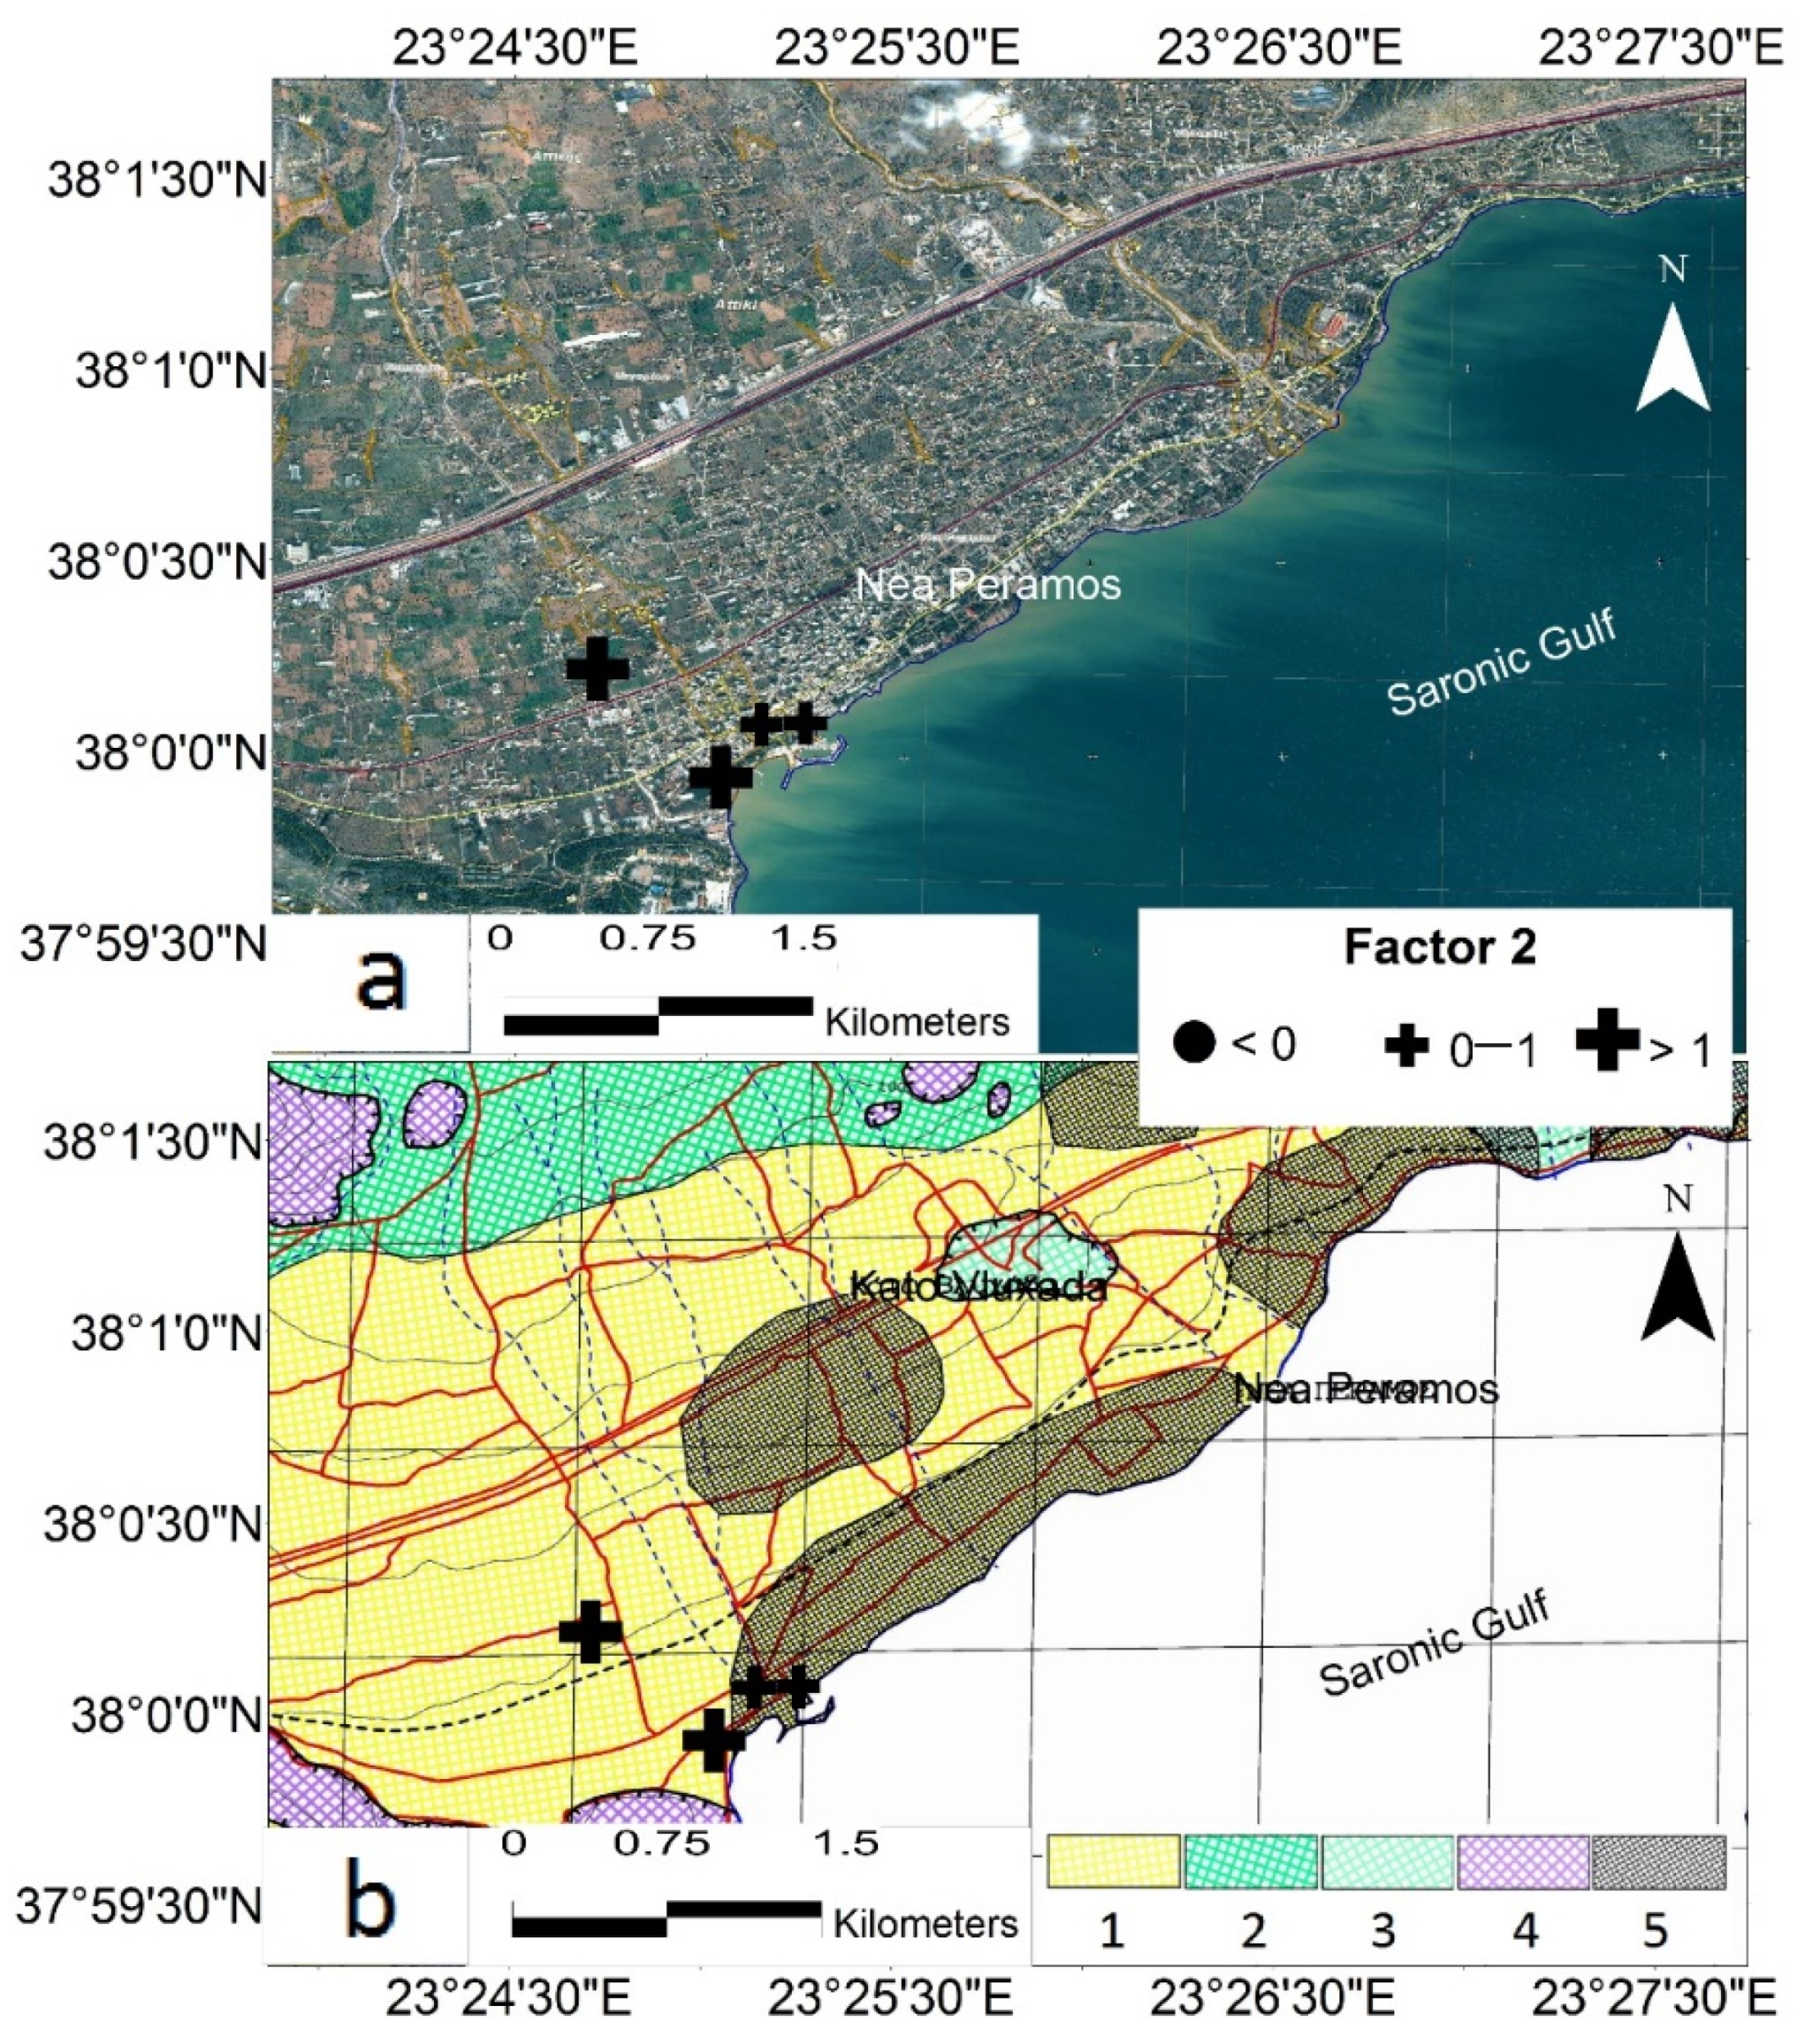
Factor 2 represents 30.8% of the total variance with high positive loadings (greater than +0.850) for CuDTPA and ZnDTPA and low negative loading (−0.377) for MnDTPA. The high positive loadings of CuDTPA and ZnDTPA showed that these elements play a principal role in explaining Factor 2. The higher positive loadings (greater than +0.370), which correspond to the high concentration of CuDTPA and ZnDTPA, were observed in the wildfire-impacted area of Kineta (Figure 7). Similarly, stream sediment samples collected from Nea Peramos streams present higher positive loadings (greater than +0.370) (Figure 8). This means that the CuDTPA and ZnDTPA contents recorded in the stream sediments of the study area can be attributed to the area’s geogenic sources.
Factor analysis results revealed high positive loadings of FeDTPA, MnDTPA, CuDTPA, and ZnDTPA, which suggested that these element contents in the study area’s stream sediments may affect the chemistry of stream water. Swindle et al. [17], who studied the effects of wildfires and ash leaching on composition of stream water in the Santa Ynez Mountains (Southern California, USA), reported that, after the wildfire, the concentration of all major cations (K+, Na+, Ca2+, Mg2+) increased in stream water collected near the fire perimeter following the first storm of the season.

4. Conclusions

The Kineta streams presented a low degree of contamination, whereas Nea Peramos streams were moderately contaminated. The Cdeg of Kineta streams (Cdeg = 5.18) was lower than Cdeg of Nea Peramos streams (Cdeg = 7.84). A GIS elaboration showed that the contamination in Kineta streams is due to both wildfire and geogenic sources such as OM and Fe-Mn oxides for MnDTPA and FeDTPA, whereas CuDTPA and ZnDTPA contamination in Kineta streams is mainly attributed to wildfire. Moreover, CuDTPA and ZnDTPA content in stream sediment can be attributed to the decomposition of OM and the dissolution of Mn oxides. Wildfire ash in the study area contains potentially toxic elements (As, Cd, Cr, Cu, Fe, Mn, and Ni), which show content higher than the Sediment Quality Criteria. Moreover, the mean ash concentrations for Ca, Co, Cd, Cr, Cu, Fe, Mg, Ni, P, Sr, and Zn exceed the corresponding values of the mean sediment. The geochemical composition of stream sediments collected in the area studied is controlled mainly by events of wildfire and flood, in addition to the geogenic sources of the West Attica region, resulting in the variation in the elements’ distribution in stream sediments. Ash in the Kineta streams may increase the potentially toxic elements’ content in stream sediment and, subsequently, contaminated material may be transported to the Saronic Gulf.

Author Contributions

Conceptualization, D.E.A.; methodology, D.E.A. and D.E.G.; software, map production, figures development, M.D.; validation, formal analysis, investigation, D.E.A. and M.D.; resources, M.D. and D.E.A.; data curation, M.D., D.E.G. and D.E.A.; writing—original draft preparation, writing—review and editing, D.E.A. and D.E.G.; supervision, D.E.A. All authors have read and agreed to the published version of the manuscript.

Funding

The expenses of consumables and laboratory measurements are financially supported by the MSc Programme of the University of West Attica, titled: “Policies and Applied Methods for the Protection of the Environment”.

Data Availability Statement

Data that support the findings of this study are available from the corresponding author upon reasonable request.

Acknowledgments

Authors much acknowledge the Director of the MSc Programme, Georgios K. Varelidis for his support.

Conflicts of Interest

The authors declare no conflict of interest.

References

  1. Robotham, J.; Old, G.; Rameshwaran, P.; Sear, D.; Gasca-Tucker, D.; Bishop, J.; Old, J.; McKnight, D. Sediment and Nutrient Retention in Ponds on an Agricultural Stream: Evaluating Effectiveness for Diffuse Pollution Mitigation. Water 2021, 13, 1640. [Google Scholar] [CrossRef]
  2. Alvarenga, P.; Guerreiro, N.; Simões, I.; Imaginário, M.J.; Palma, P. Assessment of the Environmental Impact of Acid Mine Drainage on Surface Water, Stream Sediments, and Macrophytes Using a Battery of Chemical and Ecotoxicological Indicators. Water 2021, 13, 1436. [Google Scholar] [CrossRef]
  3. Hao, J.; Ren, J.; Fang, H.; Tao, L. Identification Sources and High-Risk Areas of Sediment Heavy Metals in the Yellow River by Geographical Detector Method. Water 2021, 13, 1103. [Google Scholar] [CrossRef]
  4. Leko Kos, M.; Tadić, L. The Field-Scale Investigation of the Low Mobility of Drainage Canal Sediments Polluted by Copper in Lowland Area of Croatia. Water 2021, 13, 677. [Google Scholar] [CrossRef]
  5. Sakan, M.S.; Dordevic, S.D.; Trifunovic, S.S. Geochemical and statistical methods in the evaluation of trace elements contamination: An application on canal sediments. Pol. J. Environ. Stud. 2011, 20, 187–189. [Google Scholar]
  6. Mantei, E.J.; Foster, M.V. Heavy metals in stream sediments: Effect of human activities. Environ. Geol. Water Sci. 1991, 18, 95–104. [Google Scholar] [CrossRef]
  7. Benamar, M.A.; Toumert, S.; Tobbeche, A.T.; Chalabi, A. Assessment of the state of pollution by heavy metals in the surfacial sediments of Algeris Bay. Appl. Radiat. Isot. 1999, 50, 975–980. [Google Scholar] [CrossRef]
  8. Papadopoulou-Vrynioti, Κ.; Alexakis, D.; Bathrellos, G.D.; Skilodimou, H.D.; Vryniotis, D.; Vassiliades, E.; Gamvroula, D. Distribution of trace elements in stream sediments of Arta plain (western Hellas): The influence of geomorphological parameters. J. Geoch Explor. 2013, 134, 17–26. [Google Scholar] [CrossRef]
  9. Alexakis, D.; Gamvroula, D. Arsenic, chromium, and other potentially toxic elements in the rocks and sediments of Oropos-Kalamos basin, Attica, Greece. Appl. Environ. Soil Sci. 2014, 2014, 718534. [Google Scholar] [CrossRef] [Green Version]
  10. Shaheen, S.M.; Rinklebe, J. Geochemical fractions of chromium, copper, and zinc and their vertical distribution in floodplain soil profiles along the Central Elbe River, Germany. Geoderma 2014, 228–229, 142–159. [Google Scholar] [CrossRef]
  11. Gassama, N.; Curie, F.; Vanhooydonck, P.; Bourrain, X.; Widory, D. Determining the Regional Geochemical Background for Dissolved Trace Metals and Metalloids in Stream Waters: Protocol, Results and Limitations—The Upper Loire River Basin (France). Water 2021, 13, 1845. [Google Scholar] [CrossRef]
  12. Alexakis, D. Suburban areas in flames: Dispersion of potentially toxic elements from burned vegetation and buildings. Estimation of the associated ecological and human health risk. Environ. Res. 2020, 183, 109153. [Google Scholar] [CrossRef]
  13. Bing, H.; Zhou, J.; Wu, Y.; Wang, X.; Sun, H.; Li, R. Current state, sources and Potential risk of heavy metals in sediments of three gorges reservoir, China. Environ. Pollut. 2016, 214, 485–496. [Google Scholar] [CrossRef]
  14. Das, P.; Kumar, M.; Sarma, K.P. Speciation of heavy metals in surface sentiment of the Brahmaputra river, Assam, India. J. Environ. Res. Dev. 2015, 9, 944–952. [Google Scholar]
  15. Omwene, P.I.; Öncel, M.S.; Çelen, M.; Kobya, M. Heavy metal pollution and spatial distribution in surface sediments of Mustafakemalpaşa stream located in the world’s largest borate basin (Turkey). Chemosphere 2018, 208, 782–792. [Google Scholar] [CrossRef]
  16. Sekabira, K.; Origa, H.O.; Basamba, T.A.; Mutumba, G.; Kakudidi, E. Assessment of heavy metal pollution in the urban stream sediments and its tributaries. Int. J. Environ. Sci. Technol. 2010, 7, 435–446. [Google Scholar] [CrossRef] [Green Version]
  17. Swindle, C.; Shankin-Clarke, P.; Meyerhof, M.; Carlson, J.; Melack, J. Effects of Wildfires and Ash Leaching on Stream Chemistry in the Santa Ynez Mountains of Southern California. Water 2021, 13, 2402. [Google Scholar] [CrossRef]
  18. Walling, D.E. Tracing suspended sediment sources in catchments and river systems. Sci. Total Environ. 2005, 344, 159–184. [Google Scholar] [CrossRef] [PubMed]
  19. Glaser, C.; Zarfl, C.; Rügner, H.; Lewis, A.; Schwientek, M. Analyzing Particle-Associated Pollutant Transport to Identify In-Stream Sediment Processes during a High Flow Event. Water 2020, 12, 1794. [Google Scholar] [CrossRef]
  20. Bezes, C. New Neotectonic Map of Greece. Sheet 420_4200 (1:25.000). 2011. Available online: http://geolokarta.blogspot.com/search/label/Kineta (accessed on 24 April 2021).
  21. Bezes, C. New Neotectonic Map of Greece. Sheet 440_4200 (1:25.000). 2011. Available online: http://geolokarta.blogspot.com/search/label/Megara (accessed on 24 April 2021).
  22. Gamvroula, D.; Alexakis, D.; Stamatis, G. Diagnosis of groundwater quality and assessment of contamination sources in the Megara basin (Attica, Greece). Arab. J. Geosci. 2013, 6, 2367–2381. [Google Scholar] [CrossRef]
  23. Kaplanis, A.; Koukouvelas, I.; Xypolias, P.; Kokkalas, S. Kinematics and ophiolite obduction in the Gerania and Helicon Mountains, central Greece. Tectonophysics 2013, 595–596, 215–234. [Google Scholar] [CrossRef]
  24. Alexakis, D. Human health risk assessment associated with Co, Cr, Mn, Ni and V contents in agricultural soils from a Mediterranean site. Arch. Agron. Soil Sci. 2016, 62, 359–373. [Google Scholar] [CrossRef]
  25. Alexakis, D.; Gamvroula, D.; Theofili, E. Environmental availability of potentially toxic elements in an agricultural Mediterranean site. Environ. Eng. Geosci. 2019, 25, 169–178. [Google Scholar] [CrossRef]
  26. Alexakis, D. Contaminated land by wildfire effect on ultramafic soil and associated human health and ecological risk. Land 2020, 9, 409. [Google Scholar] [CrossRef]
  27. Google Earth. Greece, World Imagery. Available online: https://earth.google.com/web (accessed on 17 December 2021).
  28. Copernicus-Emergency Management Service-Mapping (EMS). EMSR257: Flood in Attica, Greece. 2017. Available online: https://emergency.copernicus.eu/mapping/list-of-components/EMSR257 (accessed on 15 April 2019).
  29. Copernicus-Emergency Management Service-Mapping (EMS). EMSR300: Forest Fires in Attica, Greece. 2018. Available online: https://emergency.copernicus.eu/mapping/list-of-components/EMSR300 (accessed on 18 September 2018).
  30. Bouyoucos, G.J. Hydrometer method improved for making particle size analysis of soils. Agron. J. 1962, 54, 464–465. [Google Scholar] [CrossRef]
  31. Hendershot, W.H.; Duquette, M. A simple barium chloride method for determining cation exchange capacity and exchangeable cations. Soil Sci. Soc. Am. J. 1986, 50, 605–608. [Google Scholar] [CrossRef]
  32. Walkley, A.; Black, I.A. An examination of the Degtjareff method for determining soil organic matter and a proposed modification of the chromic acid titration method. Soil Sci. 1934, 37, 29–38. [Google Scholar] [CrossRef]
  33. Lindsay, W.L.; Norvell, W.A. Development of a DTPA soil test for zinc, iron, manganese and copper. Soil Sci. Soc. Am. J. 1978, 42, 421–428. [Google Scholar] [CrossRef]
  34. ISO 11466:1995. Soil Quality–Extraction of Trace Elements Soluble in Aqua Regia; International Organization for Standardization: Geneva, Switzerland, 1995. [Google Scholar]
  35. Tukey, J.W. Exploratory Data Analysis, 1st ed.; Addison-Wesley: Boston, MA, USA, 1977; p. 712. [Google Scholar]
  36. College of Tropical Agriculture and Human Resources (CTAHR). Available online: https://www.ctahr.hawaii.edu/mauisoil/a_factor_ts.aspx (accessed on 30 January 2021).
  37. Alexakis, D. Diagnosis of stream sediment quality and assessment of toxic element contamination sources in East Attica. Environ. Earth Sci. 2011, 63, 1369–1393. [Google Scholar] [CrossRef]
  38. Faria, S.R.; De La Rosa, J.M.; Knicker, H.; Gonzalez-Perez, J.A.; Keizer, J.J. Molecular characterization of wildfire impacts on organic matter in eroded sediments and topsoil in Mediterranean Eucalypt stands. Catena 2015, 135, 29–37. [Google Scholar] [CrossRef]
  39. Vincent, A.; Osakwe, A.S.; Osaro, K.I.; Weltime, O.M. Post flooding effect on soil quality in Nigeria: The Asaba, Onitsha experience. Open J. Soil Sci. 2014, 4, 72–80. [Google Scholar]
  40. De Marco, A.; Gentile, A.E.; Arena, C.; De Santo, A.V. Organic matter, nutrient content and biological activity in burned and unburned soils of a Mediterranean maquis area of southern Italy. Int. J. Wildland Fire 2005, 14, 365–377. [Google Scholar] [CrossRef]
  41. Hazelton, P.; Murphy, B. Interpreting Soil Test Results. What Do All the Numbers Mean? 2nd ed.; CSIRO: Canberra, Australia, 2007; p. 160. [Google Scholar]
  42. Ahmad, Z.A.; Nur, A.S.; Nadzhratul, H. Influential factors on the levels of cation exchange capacity in sediment at Langat River. Arab. J. Geosci. 2012, 6, 3049–3058. [Google Scholar]
  43. Ketterings, Q.; Reid, S.; Rao, R. Cation Exchange Capacity (CEC); Department of Crop and Soil Sciences and College of Agriculture and Life Sciences: Ithaca, NY, USA, 2007; Available online: http://nmsp.cals.cornell.edu (accessed on 17 May 2021).
  44. Saengkul, C.; Pakkong, P.; Sawangwong, P. Effect of sediment characteristics on sorption of 137Cs at the sediment-water interface. IOSR J. Environ. Sci. Toxicol. Food Technol. 2013, 4, 122–125. [Google Scholar]
  45. Ubuoh, E.A.; Uka, A.; Egbe, C. Effects of flooding on soil quality in Abaliki agroecological zone of South-Eastern State, Nigeria. J. Environ. Chem. Ecotoxicol. Res. 2016, 1, 20–32. [Google Scholar]
  46. Parra, J.G.; Rivero, V.C.; Lopez, T.I. Forms of Mn in soils affected by a forest fire. Sci. Total Environ. 1996, 188, 231–236. [Google Scholar] [CrossRef]
  47. Hakanson, L. An ecological risk index for aquatic pollution control. A sedimentological approach. Water Res. 1980, 14, 975–1001. [Google Scholar] [CrossRef]
  48. Wan, X.; Li, C.; Parikh, S.C. Chemical composition of soil-associated ash from the southern California Thomas Fire and its potential inhalation risks to farmworkers. J. Environ. Manag. 2021, 278, 111570. [Google Scholar] [CrossRef] [PubMed]
  49. Pereira, P.; Ubeda, X. Spatial distribution of heavy metals released from ashes after a wildfire. J. Environ. Eng. Landsc. Manag. 2010, 18, 13–22. [Google Scholar] [CrossRef]
  50. Silva, V.; Pereira, J.L.; Campos, I.; Keizer, J.J.; Goncalves, F.; Abrantes, N. Toxicity assessment of aqueous extracts of ash from forest fires. Catena 2015, 135, 401–408. [Google Scholar] [CrossRef]
  51. Harper, A.; Santin, C.; Doerr, S.H.; Froyd, C.; Albini, D.; Otero, X.; Vinas, L.; Perez-Fernandez, B. Chemical composition of wildfire ash produced in contrasting ecosystems and its toxicity to Daphnia magna. Int. J. Wildl. Fire 2019, 28, 726–737. [Google Scholar] [CrossRef] [Green Version]
  52. Salminen, R.; Batista, M.J.; Bidovec, M.; Demetriades, A.; De Vivo, B.; De Vos, W.; Duris, M.; Gilucis, A.; Gregorauskiene, V.; Halamic, J.; et al. FOREGS Geochemical Atlas of Europe Part 1. Background Information, Methodology and Maps. Geol. Surv. Finl. Espoo 2005. Available online: http://weppi.gtk.fi/publ/foregsatlas/ (accessed on 17 December 2021).
  53. Kennedy, N.D.; Wheeler, P.D.; Wilson, P. Compilation of Sediment and Soil Standards Criteria & Guidelines. State of California, the Resources Agency and Department of Water Resources, 1995. Available online: https://www.scribd.com/document/371350899/Compilation-of-Soil-and-Sediment-Standards-Criteria-and-Guidelines-February-1995 (accessed on 21 May 2021).
  54. Alexakis, D.; Kokmotos, I.; Gamvroula, D.; Varelidis, G. Wildfire effects on soil quality. Application on a suburban area of West Attica (Greece). Geosci. J. 2021, 25, 243–253. [Google Scholar] [CrossRef]
  55. Breeuwsma, A.; Wosten, J.H.M.; Vleeshouwer, J.J.; Van Slobbe, A.M.; Bouma, J. Derivation of land qualities to assess environmental problems from soil surveys. Soil Sci. Soc. Am. J. 1986, 50, 186–190. [Google Scholar] [CrossRef]
  56. Appelo, C.A.J.; Postma, D. Geochemistry, Groundwater and Pollution, 2nd ed.; Balkema, A.A., Ed.; CRC Press: Leiden, The Netherland, 2005; p. 647. [Google Scholar]
  57. Garcia-Marco, S.; Gonzalez-Prieto, S. Short and medium term effects of fire and firefighting chemicals on soil micronutrient availability. Sci. Total Environ. 2008, 407, 297–303. [Google Scholar] [CrossRef] [PubMed] [Green Version]
  58. Close, D.C.; Davidson, N.J.; Swanborough, P.W.; Corkrey, R. Does low-intensity surface fire increase water- and nutrient–availability to overstorey Eucalyptus gomphocephala? Plant Soil 2011, 349, 203–214. [Google Scholar] [CrossRef]
  59. Gómez-Rey, M.X.; González-Prieto, S.J. Short and medium term effects of a wildfire and two emergency stabilization treatments on the availability of macronutrients and trace elements in topsoil. Sci. Total Environ. 2014, 493, 251–261. [Google Scholar] [CrossRef] [Green Version]
  60. Campos, I.; Abrantes, N.; Keizer, J.J.; Vale, C.; Pereira, P. Major and trace elements in soils and ashes of eucalypt and pine forest plantations in Portugal following a wildfire. Sci. Total Environ. 2016, 572, 1363–1376. [Google Scholar] [CrossRef]
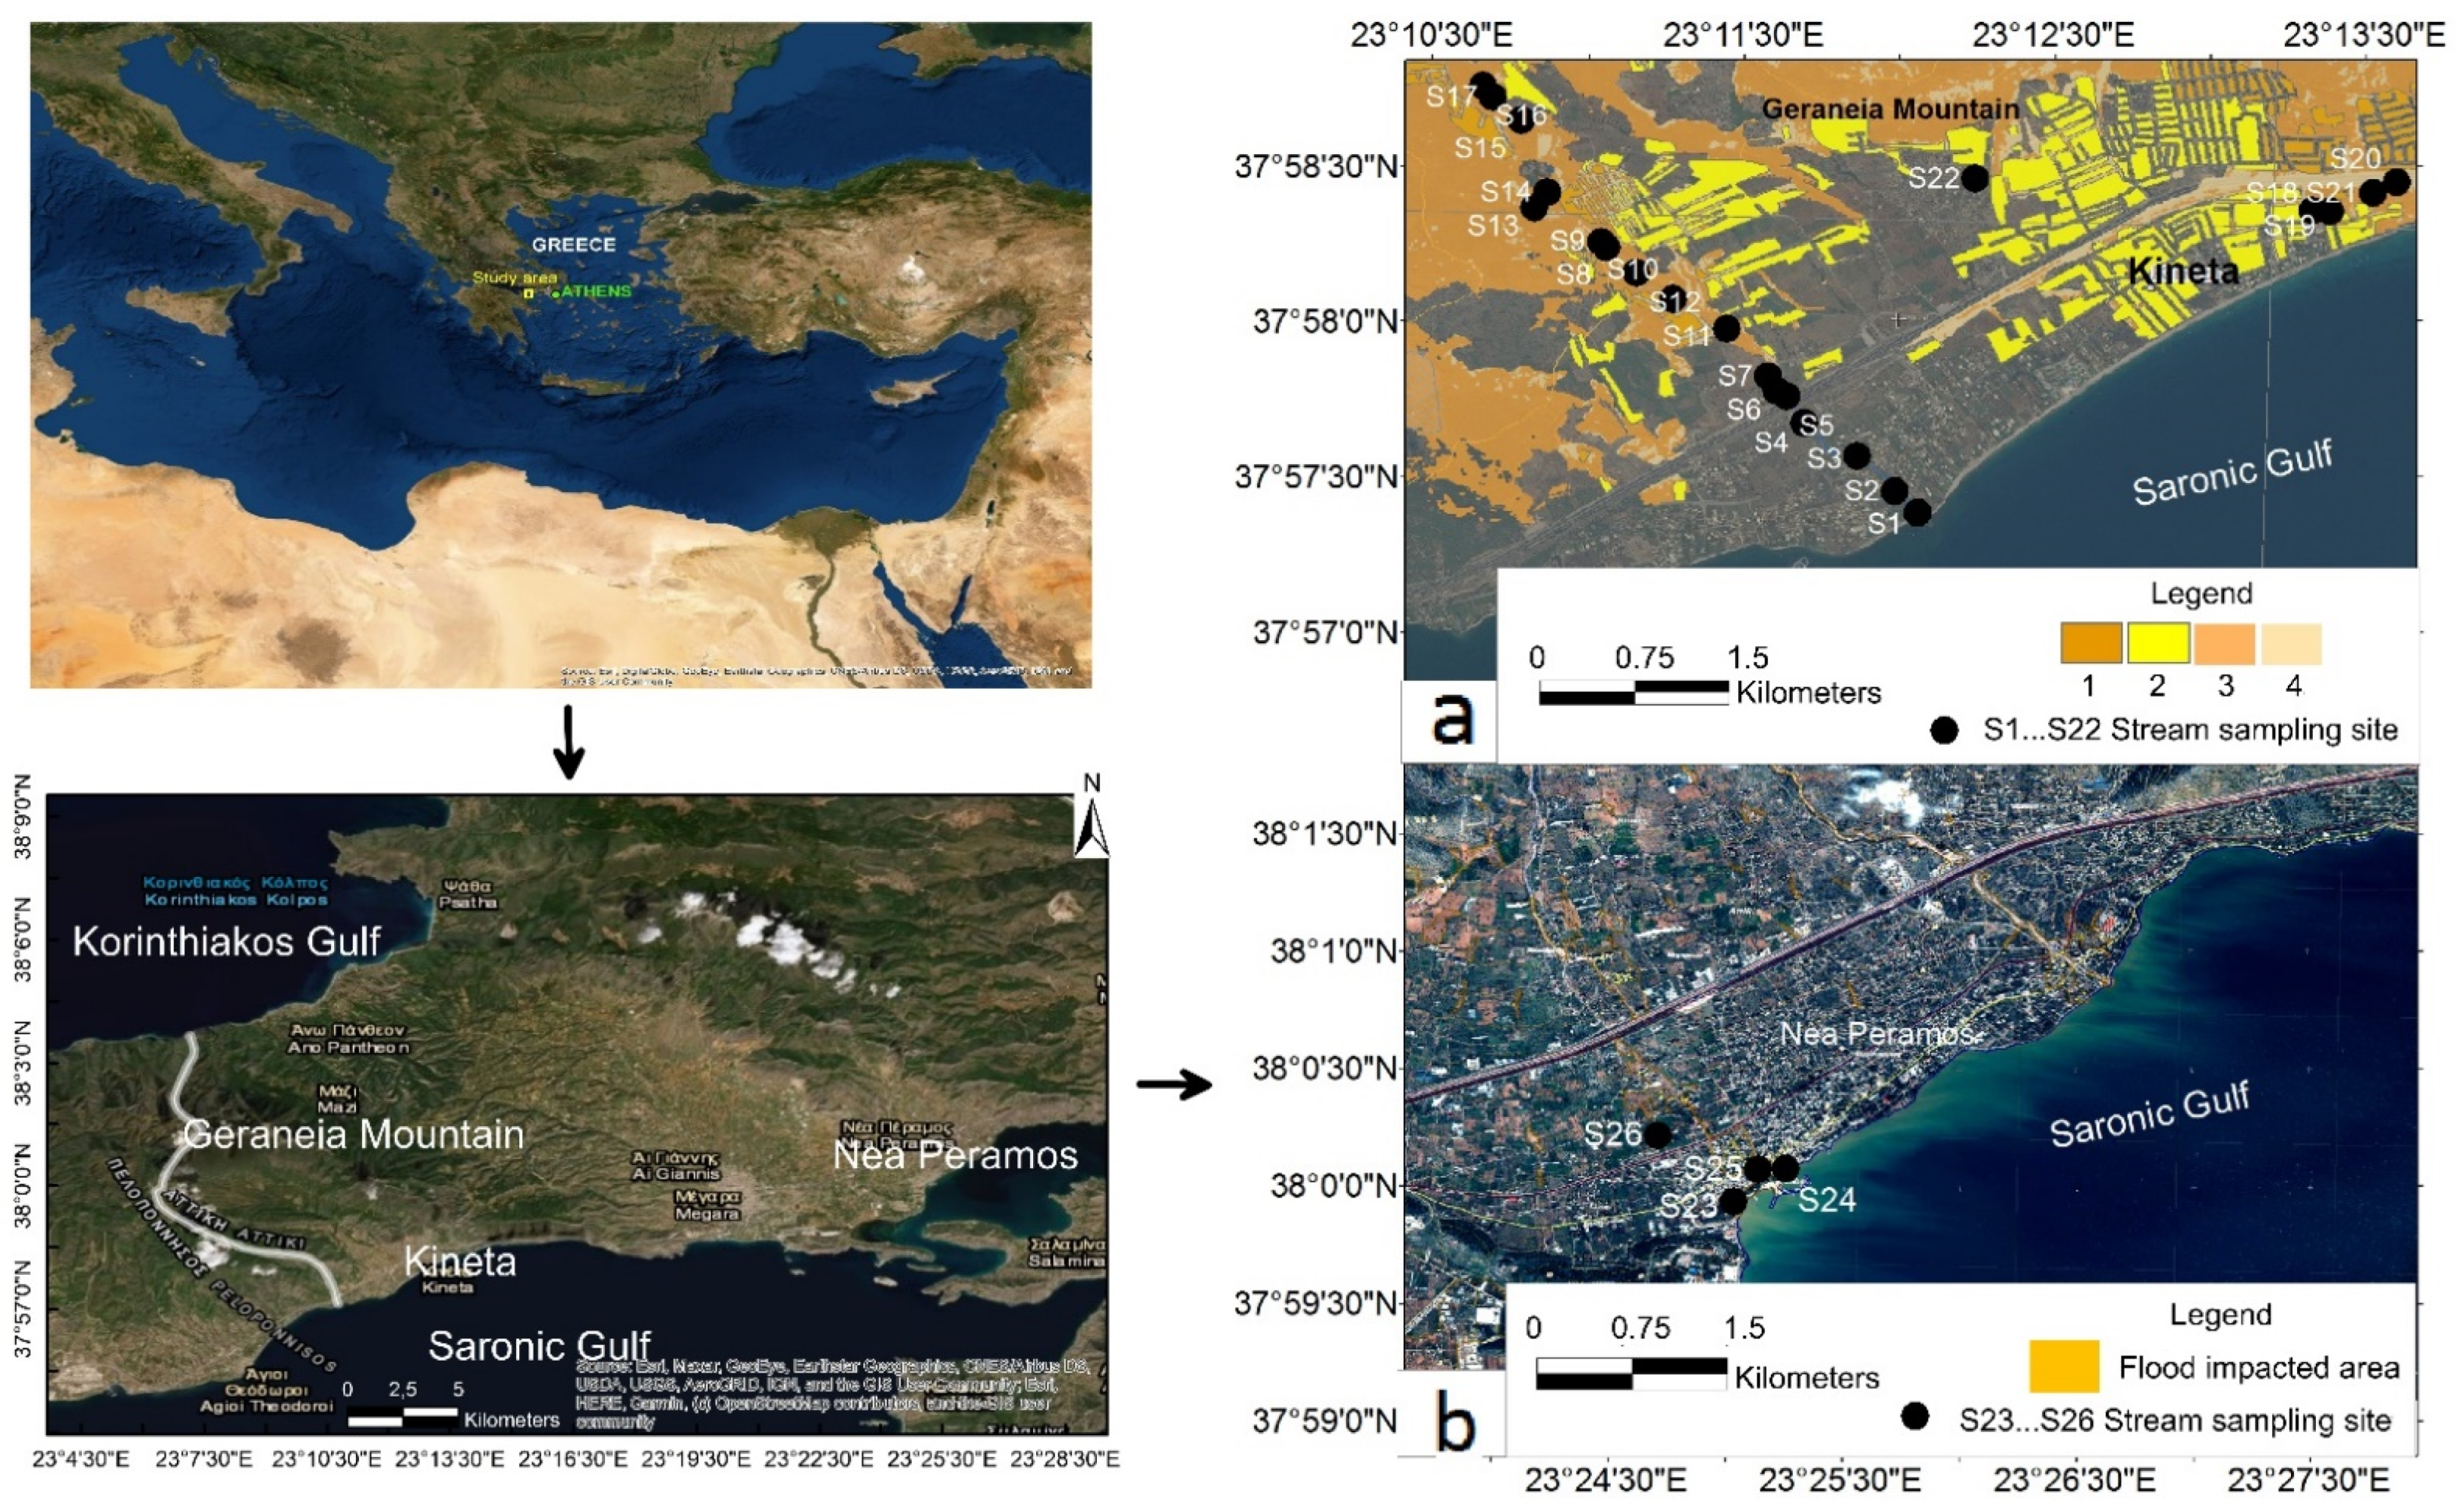
Figure 1. Location map of sampling sites of stream sediment in (a) Kineta area, and (b) Nea Peramos area. (Explanation for legend shown on Kineta area (1a)—1: Damaged buildings, 2: Possibly damaged buildings, 3: Wildfire impacted area, 4: Wildfire possibly impacted area). Modified from Google [27] and Copernicus EMS [28,29].
Water 14 00310 g001
Figure 2. Symbol plot of OM content in stream sediments of Kineta area compared with wildfire-impacted area (a) and geology (b). (Legend and explanations for 2a are shown on caption of Figure 1a; explanation for formations shown on the geological map of Kineta area (Figure 2b)—1: Sandstones, marls, marly formations, conglomerates of Upper Miocene; 2: Marls, sandstones of Miocene; 3: Sandstones, dolomites of Upper Triassic; 4: Urban area). Modified by Bezes [20,21], Copernicus EMS [28,29].
Water 14 00310 g002
Figure 3. Symbol plot of OM content in stream sediments of Nea Peramos area compared with satellite image (a) and geology (b). (Explanation for geological formations shown on the geological map of Nea Peramos (Figure 2b)—1: Sandstones, marls, marly formations, conglomerates of Upper Miocene, 2: Schists; 3: Limestones Middle-Upper Cretaceous; 4: Limestones, dolomites; 5: Urban area), Modified by Bezes [20,21], Google [27] and Copernicus EMS [28,29].
Water 14 00310 g003
Figure 4. Cumulative probability plots (CDF diagrams) for (a) CuDTPA; (b) FeDTPA; (c) MnDTPA; and (d) ZnDTPA of the stream sediments of the study area (n = 26) (red dots demonstrate threshold values).
Water 14 00310 g004
Figure 5. Symbol plot of Factor 1 scores (FeDTPA-MnDTPA-OM-CEC) for Kineta stream in comparison with soil condition (a) and geology (b). (Legend and explanations for 5a are shown in caption of Figure 1a; explanation for geological formations is shown in Figure 2b). Modified by Bezes [20,21] and Copernicus EMS [28,29].
Water 14 00310 g005
Figure 6. Symbol plot of Factor 1 scores (FeDTPA-MnDTPA-OM-CEC) for Nea Peramos stream in comparison with satellite image (a) and geology (b). (Explanation for geological formations is shown in Figure 3b). Modified by Bezes [20,21], Google [27] and Copernicus EMS [28,29].
Water 14 00310 g006
Figure 7. Symbol plot of Factor 2 scores (CuDTPA-ZnDTPA-MnDTPA) for Kineta stream in comparison with soil condition (a) and geology (b). (Legend and explanations for 7a are shown in caption of Figure 1a; explanation for geological formations is shown in Figure 2b). Modified by Bezes [20,21] and Copernicus EMS [28,29].
Water 14 00310 g007
Figure 8. Symbol plot of Factor 2 scores (CuDTPA-ZnDTPA-MnDTPA) for Nea Peramos stream in comparison with satellite image (a) and geology (b). (Explanation for geological formations is shown on Figure 3b). Modified by Bezes [20,21], Google [27] and Copernicus EMS [28,29].
Water 14 00310 g008
Table 1. Descriptive statistics of the physicochemical dataset of stream sediments in the area studied.
UnitsCECOMpHFeDTPAMnDTPACuDTPAZnDTPA
cmol Mg2+Kg−1wt%-mg Kg−1mg Kg−1mg Kg−1mg Kg−1
West Attica stream
n26262626262626
min4.041.107.171011.70.40.8
max38.713.38.289293.7853
mean22.5 ± 8.27.73 ± 3.757.63 ± 0.2250 ± 1939.8 ± 22.12 ± 26 ± 11
median22.27.277.634732.70.83
Kineta area (burned sites)
n14141414141414
min14.11.107.302918.30.40.8
max35.212.808.289293.7253
mean24.8 ± 6.48.81 ± 3.697.67 ± 0.2252 ± 1542.7 ± 22.91 ± 0.68 ± 14
median25.59.457.635135.40.93
Kineta area (unburned sites)
n8888888
min17.14.307.303826.30.41
max38.713.37.868679.426
mean25 ± 7.8.00 ± 3.017.6 ± 0.252 ± 1646.5 ± 19.50.7 ± 0.53 ± 2
median22.87.107.674641.00.62
Nea Peramos area (flooded sites)
n3333333
min4.041.107.171011.736
max14.16.007.708121.7811
mean9.23 ± 5.042.87 ± 2.727.45 ± 0.2742 ± 3616.5 ± 5.025 ± 38 ± 3
median9.541.507.473316.237
Nea Peramos area (non-flooded site)
n1111111
Measured Value13.24.907.681716.258
Table 2. Stream sediment contamination degree (Cdeg) of Kineta and Nea Peramos areas.
CuDTPAFeDTPAMnDTPAZnDTPACdeg
Mean of Kineta Streams0.95244.16
Mean of Nea Peramos Streams53516.48
Kineta CF0.91.371.781.25.25
Nea Peramos CF50.9200.6611.68.18
Table 3. Descriptive statistics of elements concentration in the ash of Kineta area (n = 5) compared to the median content of wildland ash of Kineta area [12] and corresponding levels provided from the literature [52,53]; DL: Detection limit; SD: Standard deviation; n.d.: not detected.
ElementDLMeanSDWildland Ash [12]Mean Sediment [52]Sediment Quality Criteria [53]
Al (wt %)0.0110.31.5210.2-
As (mg Kg−1)2931210.16
Be (mg Kg−1)100.70.070.72.03-
Ca (wt %)1017514.255.81-
Cd (mg Kg−1)0.50.70.10.600.5270.6
Co (mg Kg−1)128211411.20-
Cr (mg Kg−1)1131777292.8026
Cu (mg Kg−1)1322823.522.1016
Fe (wt %)0.012.41.12.242.252.12
Ga (mg Kg−1)10100n.d.12.1-
K (wt %)0.010.40.20.492.08-
La (mg Kg−1)101241041-
Mg (wt %)0.01413.071.77-
Mn (mg Kg−1)5532139612716460
Ni (mg Kg−1)155742115935.2016
P (mg Kg−1)102208230710950.174-
S (wt %)0.010.090.080.100.092-
Sb (mg Kg−1)22021.07-
Sc (mg Kg−1)1413.5--
Sr (mg Kg−1)1174146104171-
Ti (wt %)0.010.0200.030.685-
V (mg Kg−1)126228.568.3-
Zn (mg Kg−1)210878118.598120
Table 4. Varimax rotated component loadings of two factors and variance for West Attica stream sediments (n = 26).
Variable Factor 1Factor 2Communality
CuDTPA-0.8890.834
FeDTPA0.833-0.694
MnDTPA0.817−0.3370.781
ZnDTPA-0.9330.873
OM0.901-0.832
CEC0.884-0.836
Variance3.001.854.85
% Variance50.030.880.8
Publisher’s Note: MDPI stays neutral with regard to jurisdictional claims in published maps and institutional affiliations.