Abstract
Liver regeneration is a complicated biological process orchestrated by various liver resident cells. Hepatic cell proliferation and reconstruction of the hepatic architecture involve multiple signaling pathways. It has been reported that the Hh signal is involved in liver regeneration. However, the signal transduction pathways and cell types involved are ill studied. This study aimed to investigate hedgehog signal response cell types and the specific molecular mechanism involved in the process of liver regeneration. Partial hepatectomy (PH) of 70% was performed on ICR (Institute of Cancer Research) mice to study the process of liver regeneration. We found that the hedgehog signal was activated significantly after PH, including hedgehog ligands, receptors and intracellular signaling molecules. Ligand signals were mainly expressed in bile duct cells and non-parenchymal hepatic cells, while receptors were expressed in hepatocytes and some non-parenchymal cells. Inhibition of the hedgehog signal treated with vismodegib reduced the liver regeneration rate after partial hepatectomy, including inhibition of hepatic cell proliferation by decreasing Cyclin D expression and disturbing the cell cycle through the accumulation of Cyclin B. The current study reveals the important role of the hedgehog signal and its participation in the regulation of hepatic cell proliferation and the cell cycle during liver regeneration. It provides new insight into the recovery of the liver after liver resection.
1. Introduction
The liver is a special organ with a strong ability to regenerate. After partial hepatectomy (PH), the liver can recover its original mass within two weeks [1]. A large number of cytokines and signaling pathways function in this process, including the hepatocyte growth factor (HGF), epidermal growth factor (EGF), transforming growth factor-β (TGFβ) and the Wnt and Hh signal pathways [1,2,3,4]. Furthermore, liver regeneration is a very complicated process that requires stages of initiation, proliferation and termination. After PH, the liver rapidly changes and displays characteristics of portal venous pressure, increased expression of β-catenin and HGF and upregulation of other cytokines [5,6,7]. Many studies have shown that cell proliferation during liver regeneration peaks at about 48 h post-PH, which involves the replication of mature hepatocytes [2,8]. In some liver injury models such as chronic liver injury, hepatectomy and drug toxicity models, liver progenitor cells may be the main cell types contributing to liver regeneration, serving as the second defensive line of the liver [9]. Recent studies have indicated that hedgehog (Hh) signaling plays an important role in many types of chronic liver injury, and even in hepatocellular carcinoma [10,11,12,13,14]. In the process of liver fibrosis, Hh signaling could be activated in hepatic stellate cells (HSCs), promoting further activation and proliferation of HSCs, leading to fibrogenesis [15,16,17]. In some studies, HSCs were considered as epithelial progenitors in the liver [18].
Hh is a developmental morphogenic signal with two transmembrane receptors, Patched (PTC) and Smoothened (SMO). When Hh ligands bind to PTC, PTC relieves its inhibitory effect on SMO. SMO is a signaling transducer that causes the downstream uncoupling of the negative regulator Su(fu) protein from glioma-associated oncogene (GLI) transcription factors. The subsequent nuclear translocation and DNA binding of GLI1, GLI2 and possibly GLI3 are followed by the increased transcription of a number of genes, including PTC itself [19,20,21]. Many studies have demonstrated that Hh signaling is critical for the cell proliferation and differentiation of stem cells, progenitor cells and tumor cells [22,23,24]. Some studies indicated that Cyclin D was suppressed in SMO knock-out cells [10]. It has been demonstrated that Cyclin D was the downstream gene of the Hh signaling pathway [25,26]. In addition, PTC could interact with the phosphorylation of Cyclin B1 and then alter the localization of the maturation-promoting factor (MPF), which regulates cell cycle progression [27,28,29]. Cyclin B, as a mitotic cyclin, functions throughout mitosis. Successfully complete mitosis of the cell needs the degradation of Cyclin B regulated by the anaphase-promoting complex (APC/C) [30,31]. APC/C is a significant complex regulating cell division, of which the pivotal component Cdc20 is regulated by multiple checkpoint proteins, including MAD2, BUB3 and BUB1B [32,33]. However, the relationship between checkpoint proteins and Hh signaling remains poorly understood. Moreover, the more detailed roles of Hh signaling in cell proliferation and mitosis still require verification.
Since Hh signaling is involved in the cell cycle, it is worth asking whether it participates in liver regeneration. One study indicated that Hh is critical for normal liver regeneration. In a PH mouse model, treatment with the Hh inhibitor cyclopamine after 2/3 PH caused all the mice to die within 48 h [34], making it difficult to understand the mechanism of Hh in the inhibition of liver regeneration.
Vismodegib, which is structurally unrelated to cyclopamine, was the first Hh pathway inhibitor approved by the FDA (Food and Drug Administration) to be used in the treatment of basal cell carcinoma [35,36]. It inhibits Hh signaling by binding to SMO with high affinity and specificity. It also proved to be efficient in reducing TRAIL-mediated nonalcoholic liver injury [37] and attenuating liver fibrosis in bile duct ligated rats [38]. In addition, compared to the Gli-luc IC50 of cyclopamine of 500 nM, vismodegib had a much lower IC50 of 3 nM [39], which revealed the efficacy and safety of vismodegib. Our results show that SMO inhibition by vismodegib significantly decreased the liver regeneration rate without causing the death of mice. This reveals the important role of the Hh signal in liver regeneration after PH.
2. Materials and Methods
2.1. Animal Experiment
ICR male mice were used as a liver regeneration model, which were obtained from and maintained at the GIBH (Guangzhou Institutes of Biomedicine and Health) (Guangzhou, China) animal experimental center. Animal welfare and operation experiments were in accordance with the rules and regulations.
The PH protocol was based on that of Higgins and Anderson, with modifications [40,41]. The experimental group (9−11-week-old ICR male mice) was intragastrically administered vismodegib (20 mg/kg/day) (Selleck, Shanghai, China) for 3 days before PH and treated daily until sacrifice; sodium carboxymethylcellulose (CMC-NA) (Aladdin, Shanghai, China) was administered intragastrically to the control group. The mice were sacrificed at 1 day (n = 5), 2 days (n = 5), 3 days (n = 5), 7 days (n = 5) and 10 days (n = 5) after PH. Body weight was weighed every day until sacrifice. The resectioned part of the liver and the rest of the liver were weighed after PH and sacrifice, respectively. To study the rate of cell proliferation between the control and vismodegib groups, Edu (RiboBio, Guangzhou, China) was administered intraperitoneally (50 mg/kg weight) 2 h before sacrifice 36 h and 44 h after PH.
2.2. Real-time Quantitative PCR
Total RNA was isolated from liver tissue stored in liquid nitrogen by Trizol. Real-time PCR was performed with Bio-Rad CFX96 (BIO-RAD, Hercule, CA, USA). The experiment procedure was carried out according to the reagent instructions. Relative mRNA expression was analyzed by normalization with GAPDH (IGE, Guangzhou, China) in all genes. The sequence of primers is summarized in Supplementary Table S1.
2.3. Western Blot Analysis
Total protein was isolated from liver tissue by the RIPA (Radio Immunoprecipitation Assay) lysate (Beyotime, Guangzhou, China). Protein bands were separated by 10% SDS-PEGA (sodium dodecyl sulfate polyacrylamide gel electrophoresis) (Beyotime, Guangzhou, China) and transferred by the PVDF (polyvinylidene fluoride) membrane (Roche, Shanghai). Using 5% defatted milk (Beyotime, Guangzhou, China) blocked nonspecific binding, and the primary antibody was incubated at 4 °C overnight. Antibodies against GLI1 and GLI2 were purchased from GeneTex; Cyclin D and Cyclin B from Abcam; and Bub1b, Cdc20 and CDK2 from Poteintech.
2.4. Immunohistochemistry
Liver tissues were fixed with 4% paraformaldehyde (PFA) (Beyotime, Guangzhou) overnight and then cut into slices through paraffin embedding. Slice staining was followed by routine staining procedures with deparaffinization in xylene (Guangzhou Chemical Reagent Factory, Guangzhou, China), antigen unmasking in boiling sodium citrate buffer (Beyotime, Guangzhou, China) and incubation in 3% hydrogen peroxide (HARVEYBIO, Beijing, China) for fewer false positives and a clear background. The antibodies used were the same as those for the Western blot.
2.5. Isolation of Primary Hepatocytes and Flow Cytometry Analysis
Primary hepatocytes were isolated from normal and PHx mice through two-step collagenase digestion and differential centrifugation. Polyploid cells were analyzed using Hoechst 33342 staining (Beyotime, Guangzhou, China). Samples were measured on LSR Fortessa SORP and analyzed with Flow Jo.10 (https://www.flowjo.com/, accessed on 2 January 2022).
Statistical analysis—Statistical significance was determined with an unpaired, two-sided Student t test using GraphPad Prism 6 (https://www.graphpad.com/scientific-software/prism/, accessed on 2 January 2022). Data were presented as means ± SEM, and standard errors were considered statistically significant at * p ≤ 0.05, ** p ≤ 0.01 and *** p ≤ 0.001.
3. Results
3.1. Hedgehog Signal Activated after Partial Hepatectomy
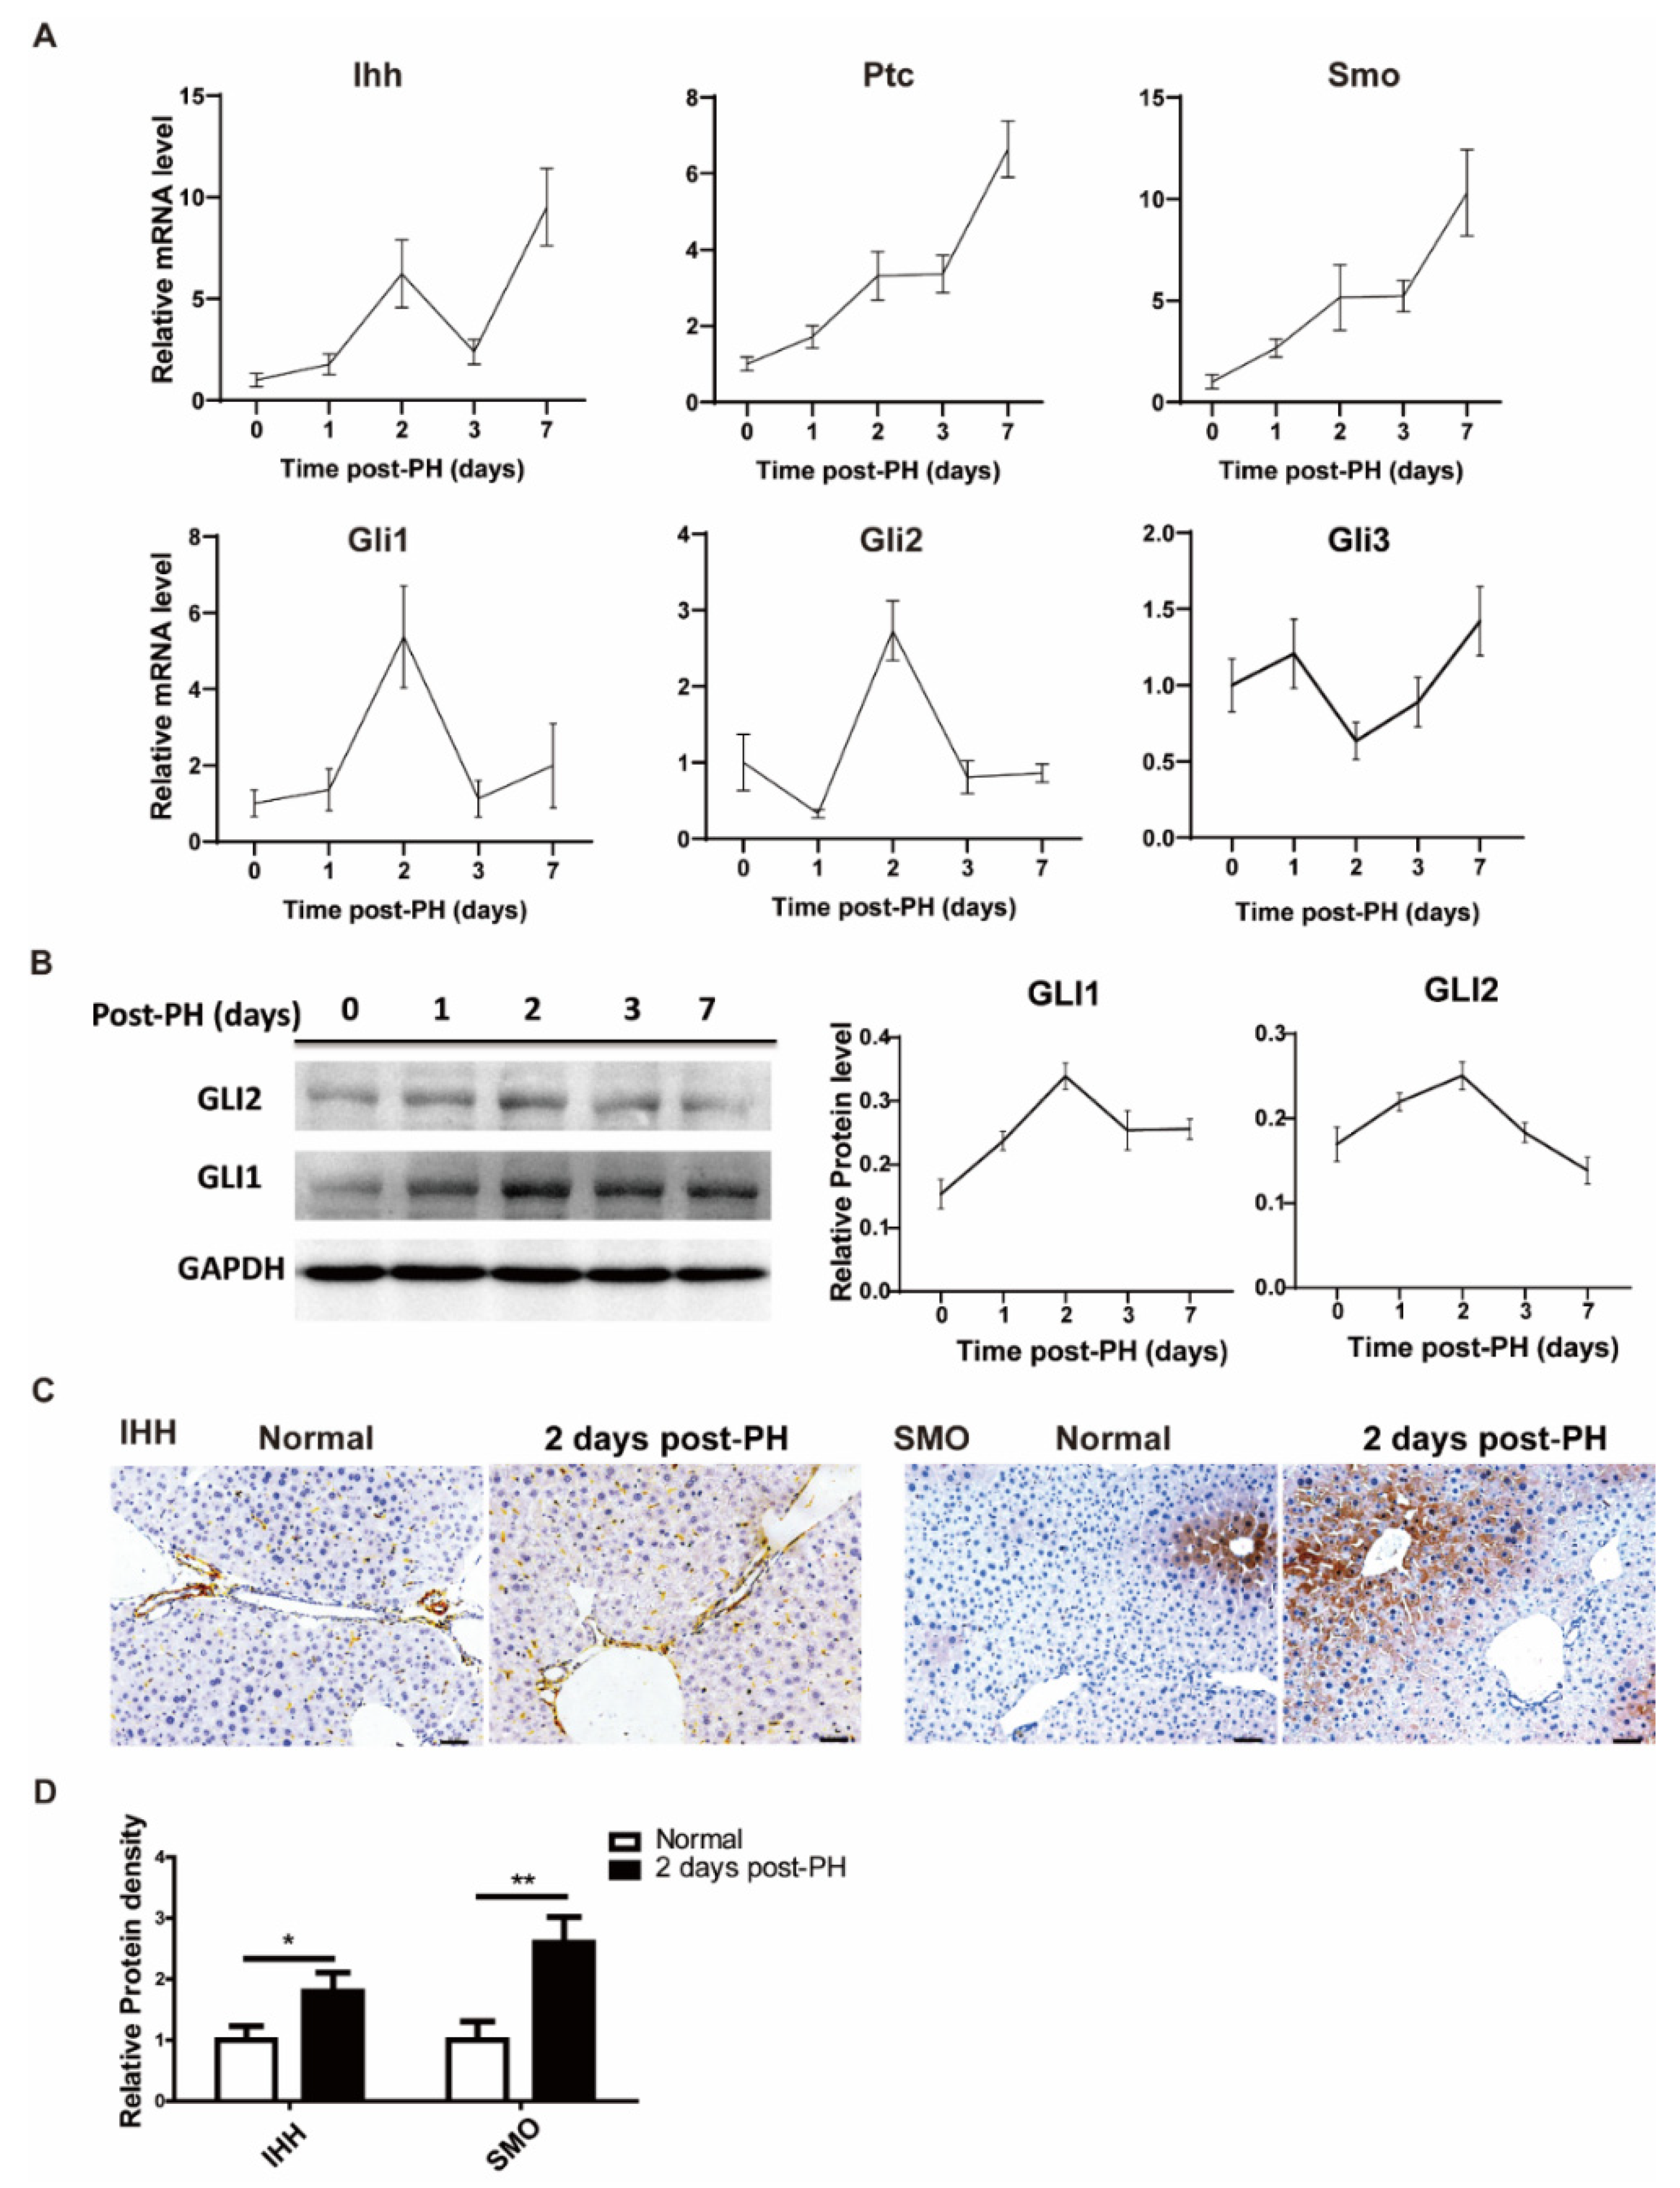
To investigate the changes in the Hh signal in the process of liver regeneration, 70% partial hepatectomy was performed on ICR mice, and liver tissue samples were collected at different time points (1, 2, 3 and 7 days). We first analyzed Hh signal-related expressions at the protein and mRNA levels. The results show that overall signal molecules were upregulated after PH at the mRNA level. Among them, the receptors (PTC and SMO were continuously increased during regeneration, and the ligand (IHH) had two high-expression points (2 days and 7 days after PH). Likewise, downstream activation signals such as GLI1 and GLI2 were significantly upregulated at 2 days after PH, while the downstream inhibition signal GLI3 was relatively downregulated 2 days after PH (Figure 1A). Correspondingly, GLI1 and GLI2 had similar trends in their mRNA and protein levels (Figure 1B). We next sought to determine specific cells expressing the Hh signal before and after PH. For this purpose, we stained tissue sections of normal and PH-induced mice using immunohistochemistry analysis. The results show that the Hh ligand, IHH, was mainly expressed in hepatic non-parenchymal cells (including endothelial cells and hepatic stellate cells) and bile duct cells of PH-induced mice; however, a mild expression was also observed in normal control mice. These results are consistent with the results obtained from mRNA analysis. On the other side, we observed a significant expression of the Hh receptor SMO in hepatocytes in addition to hepatic non-parenchymal cells, as shown in Figure 1C. Overall, this spatiotemporal appearance and synchronization of Hh signal molecules and receptors may imply that Hh signal molecules were secreted from hepatic non-parenchymal cells and bile duct cells and acted on hepatocytes to promote liver regeneration.
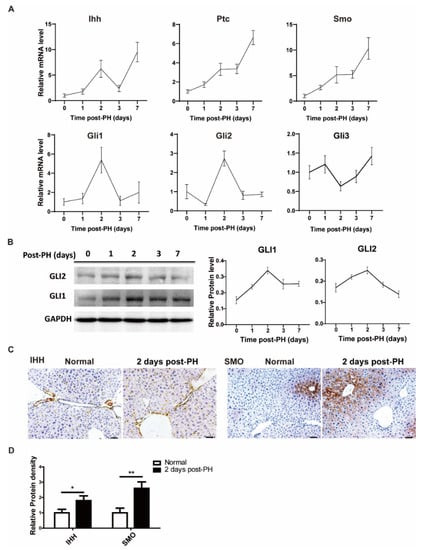
Figure 1.
Hedgehog signal activated after PH. (A) mRNA change trend of Hh signaling pathway (IHH, PTC, SMO, GLI1, GLI2, GLI3) in liver tissue of mice at different time points after PH (0, 1, 2, 3 and 7 days), n = 5. (B) Representative Western blot results of GLI1 and GLI2 in the liver tissues of mice at different time points after PH (0, 1, 2, 3 and 7 days). Western blot quantification analysis compared to GAPDH is shown in the line chart, n = 3. (C) Representative immunohistochemical results of IHH and SMO staining in liver of normal mice and two days after PH, bar means 50 µm. (D) Results of IHH and SMO immunohistochemical quantitative analysis, analyzed with Image J, 5 pictures for each group, n = 3. All data represent means ± SEM. * p < 0.05, ** p < 0.01 vs. control group.
3.2. Vismodegib Suppresses the Rate of Liver Regeneration after PH
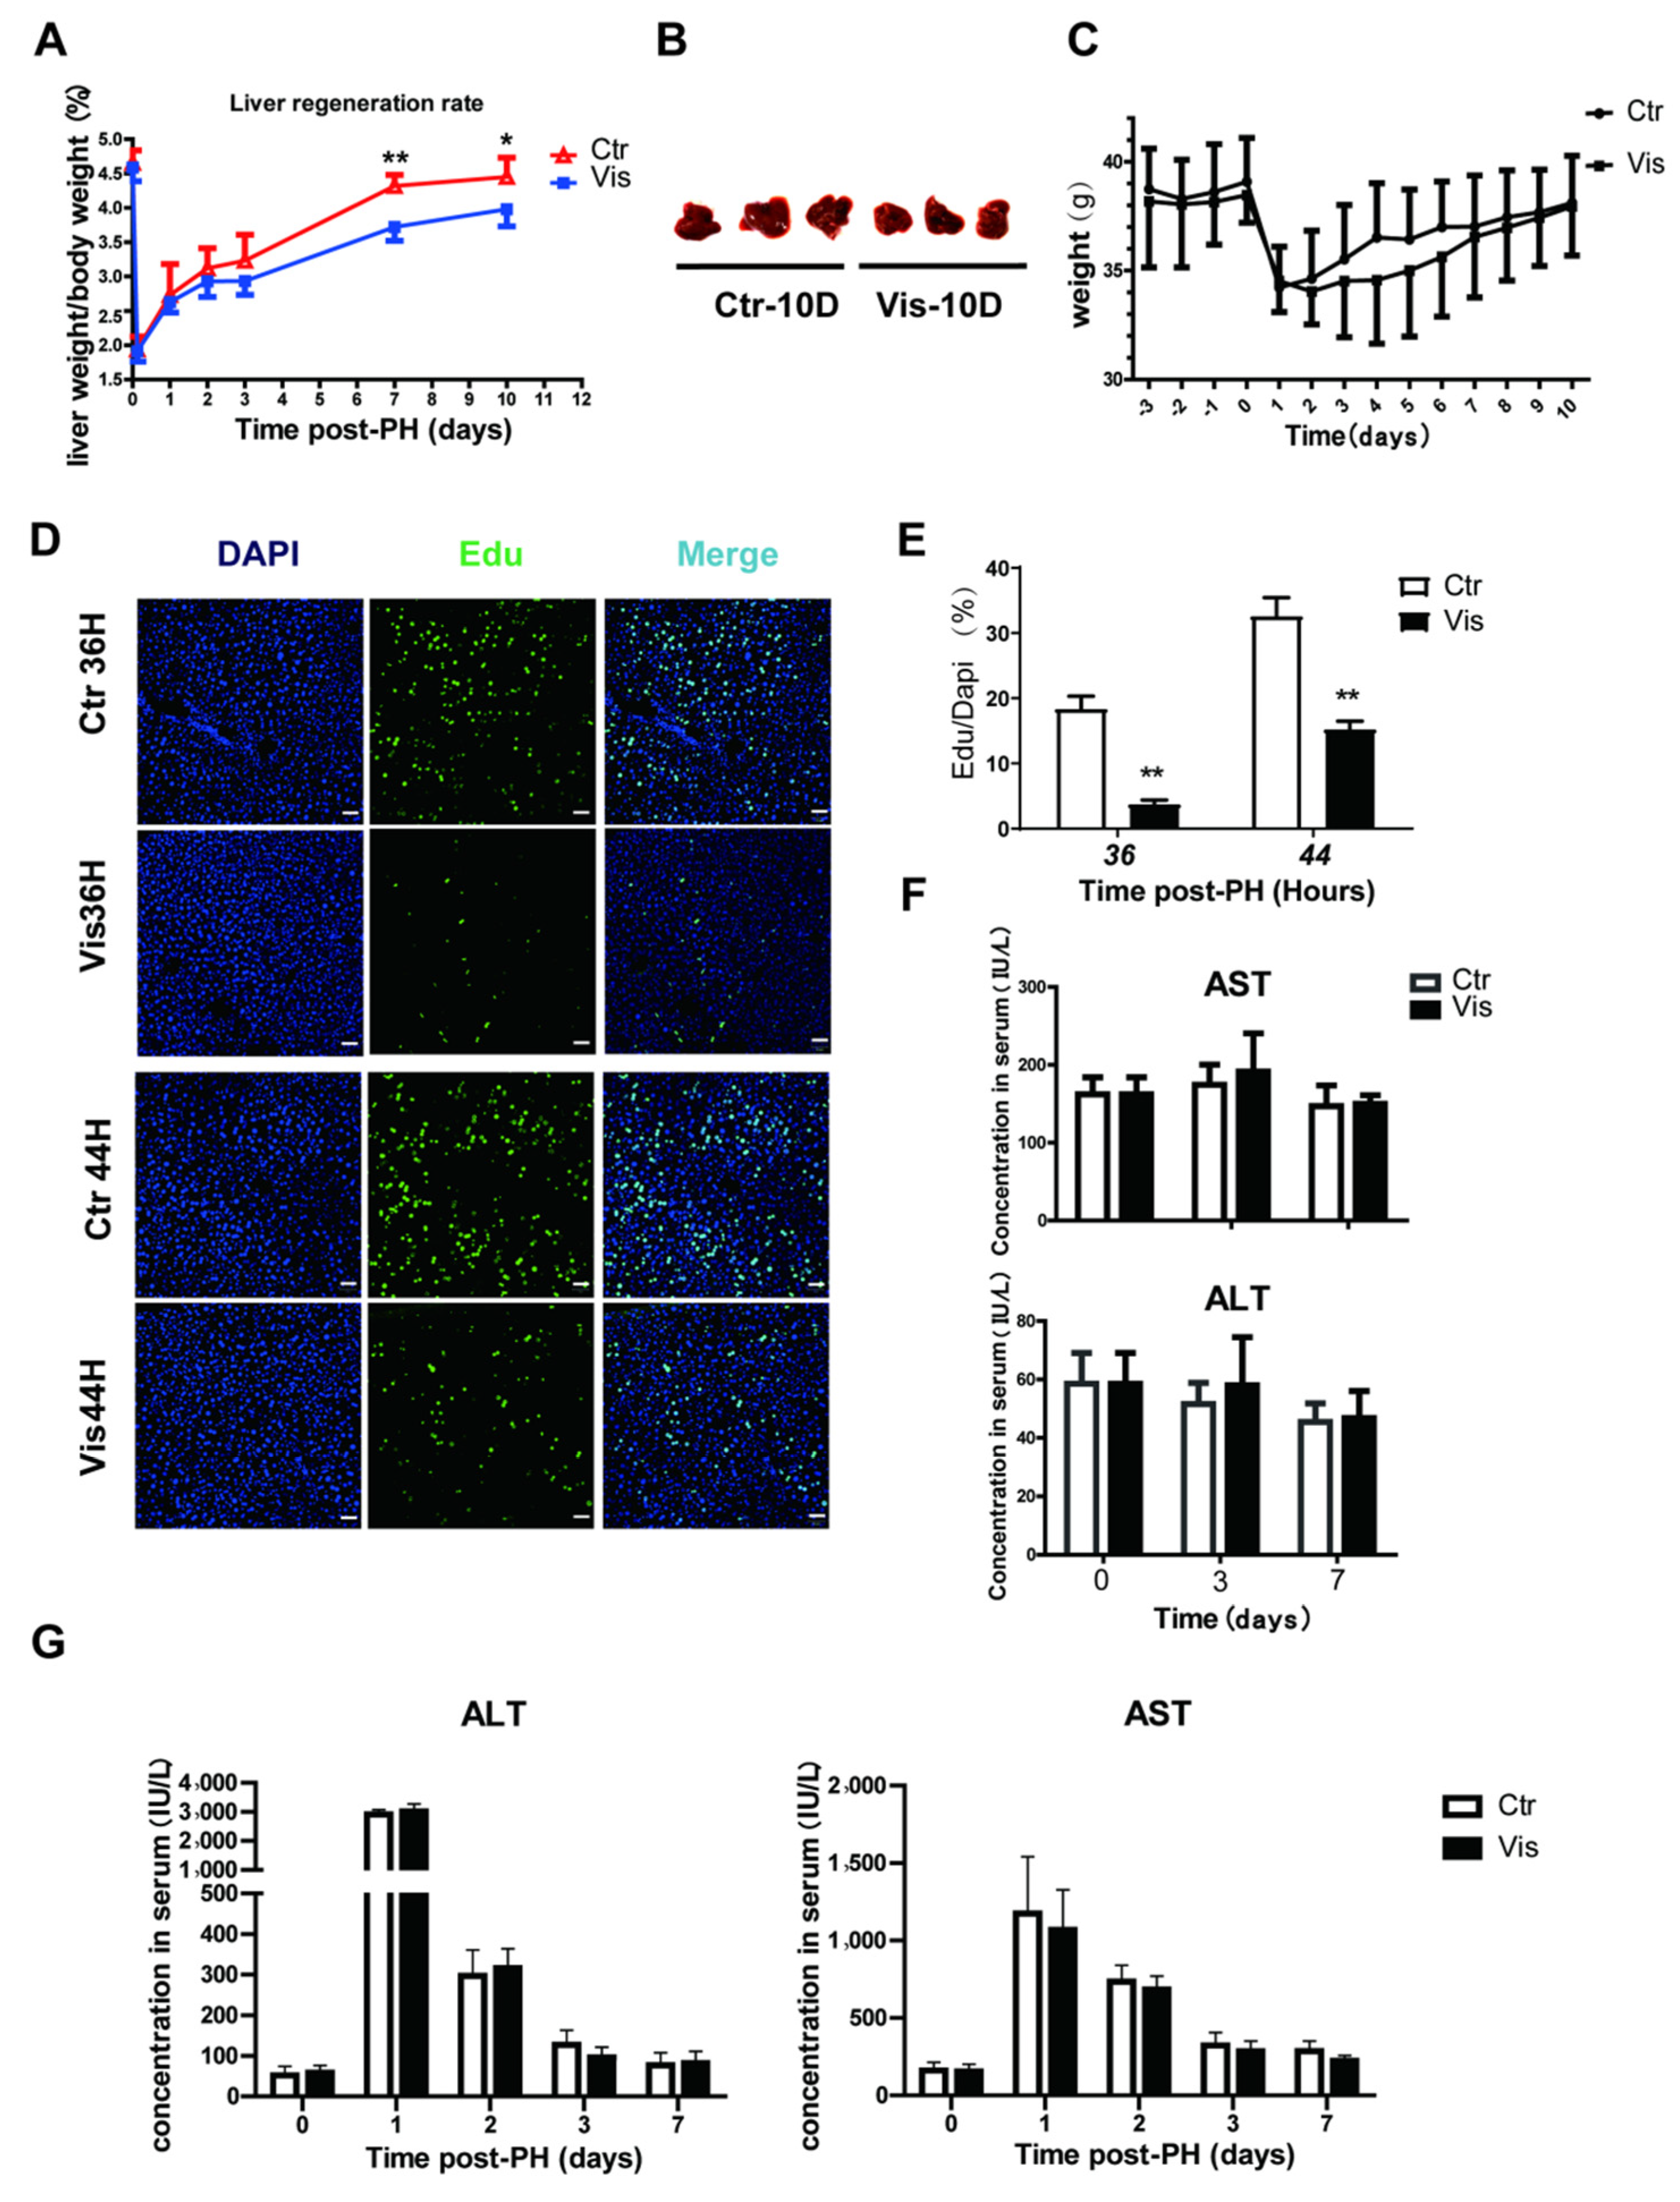
In healthy mice, liver-to-body weight ratios are constant at around 4–5% [1,3]. Studies have demonstrated that in rodents, the liver has the ability to recover to normal mass within 10 days after PH [3,42]. In our study, the liver of control group mice recovered more than 90% of its normal weight at 10 days after PH. However, mice treated with vismodegib showed a lower liver mass, and liver regeneration was inhibited at all the collected time points after PH. Especially by 7 to 10 days after PH, the liver-to-body weight ratio had decreased by approximately 20% of the control group (Figure 2A). The images of mouse livers 10 days post-PH also showed a significantly decreased degree of regeneration in the vismodegib-treated group (Figure 2B), in addition to no significant difference in body weight between the two groups (Figure 2C). We further validated this result by using Edu (5-Ethynyl-2′-deoxyuridine) incorporation data. Edu is a nucleic acid analogue that inserts DNA during DNA replication [43,44]. We could measure the amount of cell proliferation by detecting Edu. DNA synthetic activities of hepatocytes reached a peak between 24 h and 48 h post-PH. We chose 36 h and 44 h as the time points for measuring DNA synthetic activity. The results indicate that incorporation of Edu decreased noticeably in the hepatic cells of vismodegib-treated mice compared with that in the control group. At 36 h post-PH, the Edu-labeled cell nuclei decreased by 80%, and then by almost 60% at 44 h post-PH, in the vismodegib-treated group (Figure 2D,E). Furthermore, the vismodegib-treated mice showed comparable survival rates to their control-treated counterparts, as shown in Figure 2B, and the change trends of weight between the two groups were almost the same. In order to examine whether the administered vismodegib caused hepatotoxicity and affected liver regeneration, the same doses of vismodegib were applied to normal mice in the same manner to the experimental groups, and the levels of ALT (alanine aminotransferase) and AST (aspartate transaminase) were measured on days 3 and 7. There was no significant difference between the control and vismodegib-treated groups (Figure 2F). Furthermore, ALT and AST did not differ significantly between the two groups after PH (Figure 2G). It was proved that 20 mg/kg vismodegib caused no hepatotoxicity effect in the mouse livers. The results show that inhibition of the Hh signal pathway with vismodegib significantly reduced the liver regeneration rate after PH.
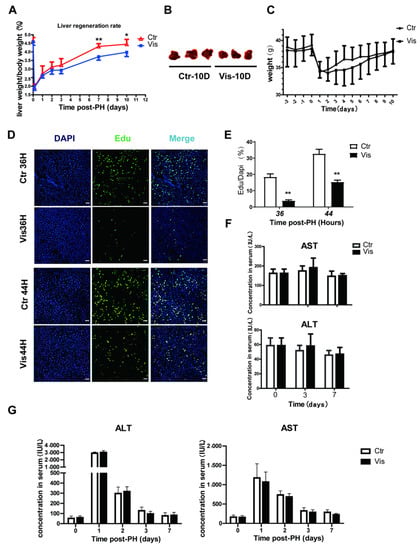
Figure 2.
Vismodegib suppresses the rate of liver regeneration after PH. (A) Liver-to-body weight ratios of control and vismodegib-treated mice at different times after 70% partial hepatectomy (0, 3 h, 1 day, 2 days, 3 days, 7 days and 10 days), n = 5. (B) Images of mouse livers at 10 days post-PH between the two groups, n = 3. (C) The change in the body weight of the control and vismodegib-treated mice between 3 days pre-PH and 10 days post-PH; the trends of the two groups were consistent, n = 5. (D) Edu was used to analyze the difference in proliferative cell amounts between the normal and vismodegib-treated groups after PH. Representative immunofluorescence results 36 h and 44 h after PH. (E) Quantification percentage of Edu positive cells to DAPI positive cells shown in the histogram. (F) Changes in liver function index of normal mice treated with vismodegib (AST: aspartate aminotransferase, ALT: alanine aminotransferase) at different times (0, 3, 7 days). There was almost no difference between the two groups, n = 5. (G) Changes in liver function index (ALT and AST) of mice at different times post-PH in the two groups, n = 5. All data represent means ± SEM. * p < 0.05, ** p < 0.01 vs. control group.
3.3. Vismodegib Inhibits the Activation of Hh Pathway after PH
As the most critical effector molecules of the Hh signal, GLI1 and GLI2 are involved in the transcriptional regulation of various genes. They are also regulated by the Hh signal. To determine changes in the Hh signal after the administration of vismodegib, GLI1 and GLI2 were detected at both the mRNA and protein levels in the mouse liver tissue at different time points after PH. There were no significant changes in GLI1 and GLI2 at the early stage of hepatectomy (about 1 day after PH) between the vismodegib-treated group and the control group. Meanwhile, at the peak of cell proliferation of liver regeneration (2–3 days after PH), GLI1 and GLI2 significantly decreased at both the mRNA and protein levels (Figure 3A–C) in the vismodegib-treated group. Immunohistochemistry analysis revealed that GLI1 and GLI2 expressions in both hepatocytes and non-parenchymal cells were consistent with SMO localization (Figure 3C). This indicated that hepatocytes, as the target cells of the Hh signal, were regulated by the Hh signal in the process of liver regeneration after PH. Taken together, vismodegib inhibited the Hh signaling pathway in hepatocytes, which was observed at the peak stage of cell proliferation, indicating that the Hh signal may be involved in the regulation of cell proliferation.
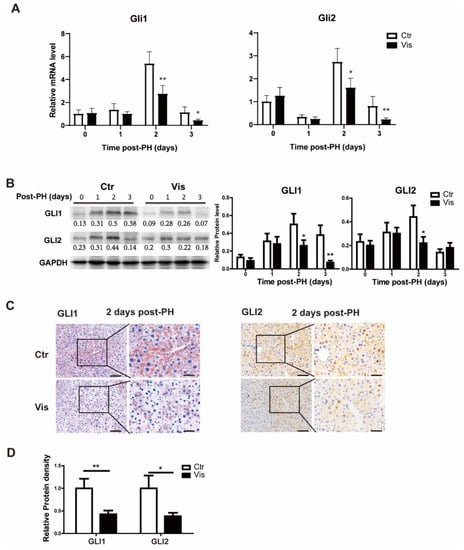
Figure 3.
Vismodegib inhibits the activation of the Hh pathway after PH. (A) QRT-PCR analysis of Hh signaling pathway intracellular signaling molecules GLI1 and GLI2 in liver tissue at different times after PH (0, 1, 2 and 3 days), n = 5. (B) Representative Western blot analysis of GLI1 and GLI2 in the liver tissue between the two groups at different times after PH (0, 1, 2 and 3 days). Western blot quantification analysis compared to GAPDH is shown under the bands. (C) Representative immunohistochemical pictures of GLI1 and GLI2 in the liver slices of mice at two days after PH between the two groups. (D) Results of GLI1 and GLI2 immunohistochemical quantitative analysis of the two groups at 2 days post-PH are shown in the histogram, analyzed with Image J, 5 pictures for each group, n = 3. All data represent means ± SEM. * p < 0.05, ** p < 0.01 vs. control group.
3.4. Inhibition of Hh Signal Suppressed the G1/S Phase of Cell Proliferation
During liver regeneration, the rest of the liver cells need to reenter the cell cycle from the G1 phase and begin cell proliferation to recover to the normal liver weight [1,3]. Cyclin D is an important cyclin protein involved in regulating cell cycle progression, which drives G1/S phase transition. In our study, mice treated with vismodegib had a lower expression of Cyclin D, and there was no significant inhibitory effect observed at the peak level of expression. In addition, the Cyclin D-related cyclin-dependent kinase Cdk2 was also suppressed at 2 days post-PHx (Figure 4A). Western blot analysis also confirmed this result, as shown in Figure 4B. H&E staining of tissue sections of samples obtained from vismodegib-treated mice showed a limited number of dividing cells compared with the control groups, which demonstrated a lower rate of cell proliferation (Figure 4C). Furthermore, we detected PCNA (a marker gene for cell proliferation) in liver slices of the two groups. The results verify that there was less cell proliferation in vismodegib-treated mice compared with the control group (Figure 4D).
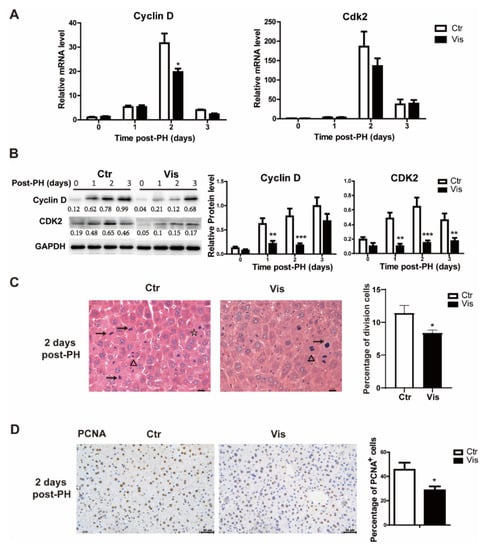
Figure 4.
Vismodegib inhibits cell proliferation in the cell cycle at the G1/S phase. (A) QRT-PCR analysis of Cyclin D and Cdk2 in the liver tissue at different times after PH between the two groups (1, 2 and 3 days), n = 5. (B) Western blot analysis of Cyclin D and Cdk2 in liver tissue at different times after PH. Western blot quantification analysis compared to GAPDH is shown under the bands. (C) Quantification of the percentage of cells in different phases of cell division in H&E-stained slices. Arrow (→) represents cells of pre-division, triangle (Δ) means cells in division and star (☆) means cells of post-division. Division cells include the three mentioned above. Five full pictures of 20× were counted for each group. Percentage analysis compared to the total cells is shown in the histogram. (D) Representative immunohistochemical pictures of PCNA in the liver slices of mice at two days after PH between the two groups. Quantitative analysis is shown in the histogram, n = 3. All data represent means ± SEM. * p < 0.05, ** p < 0.01, *** p < 0.001 vs. control group.
3.5. Inhibition of Hh Signaling Increased Accumulation of Polyploid Cells by Suppressing Degradation of Cyclin B
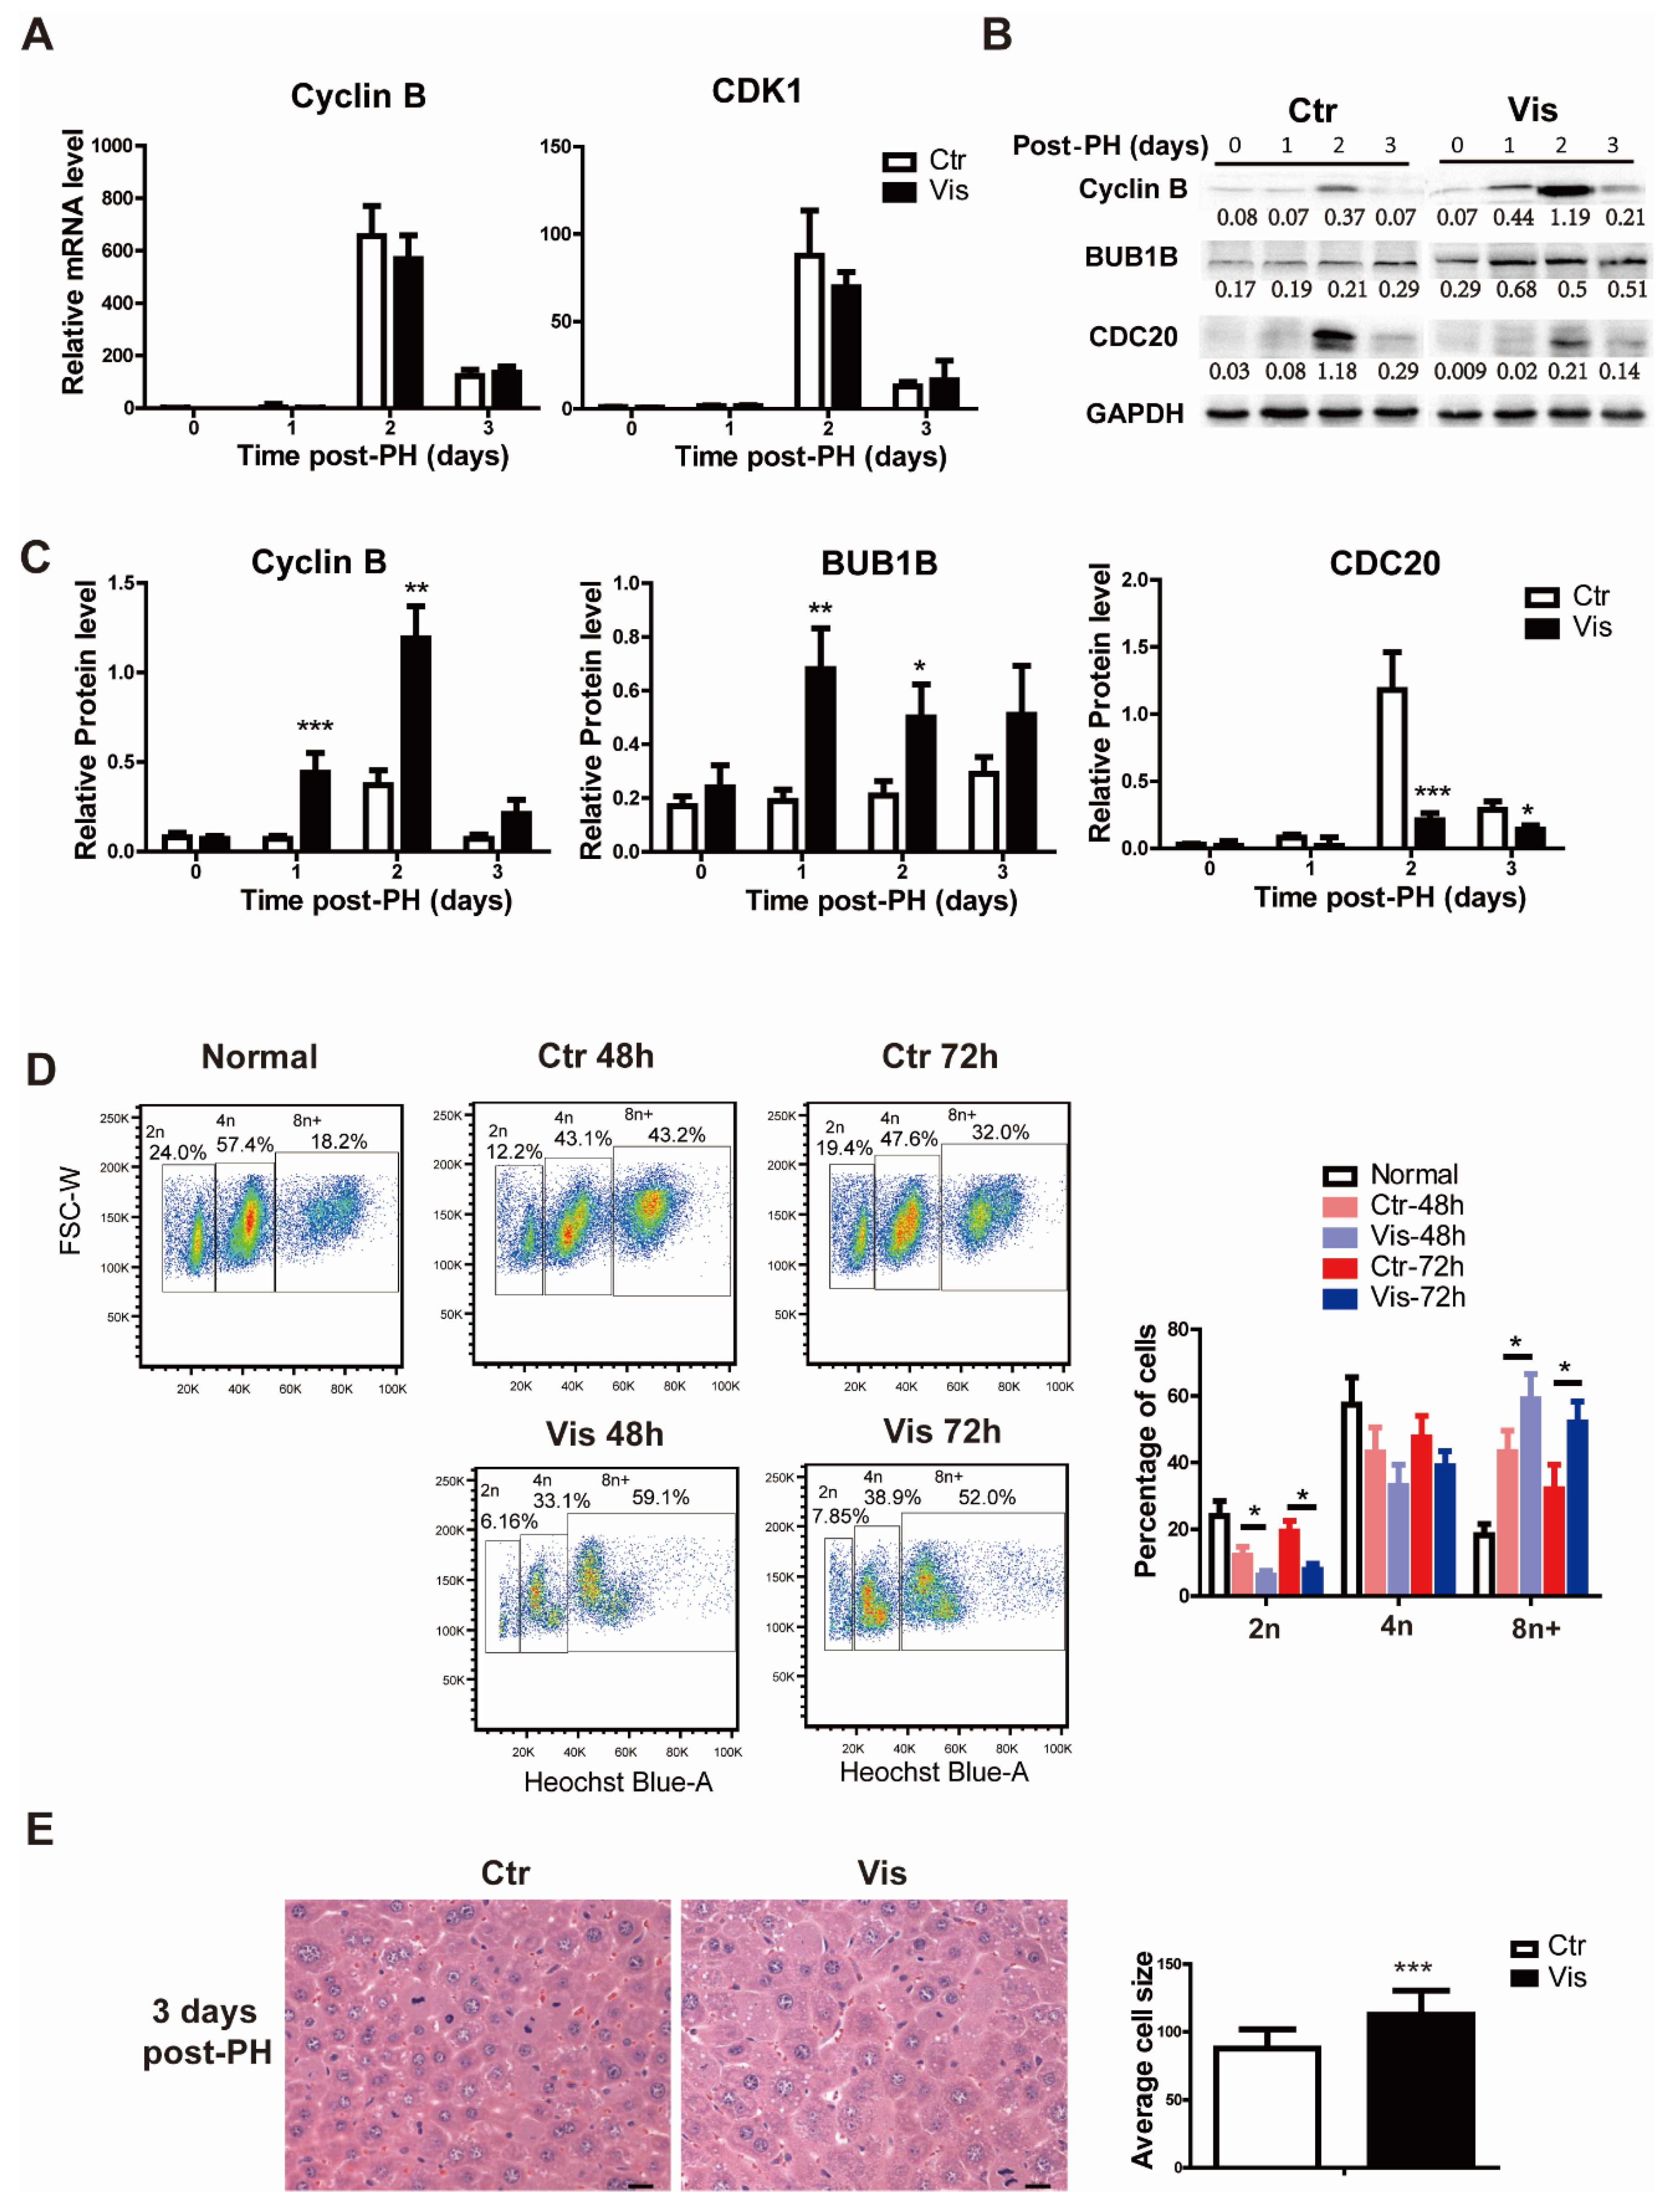
In the process of the cell cycle, different cyclins play different roles at different stages. Cyclin B, as a mitotic cyclin binding to CDK1, forms the Cyclin B–CDK1 complex, which regulates the progression of cells into and out of the M phase. Degradation of Cyclin B is a prerequisite to allowing cell exit out of the mitosis phase. In our study, Cyclin B and Cdk1 caused no significant change in the mRNA level in the vismodegib group (Figure 5A). However, at the protein level, the vismodegib group presented greater accumulation of Cyclin B (Figure 5B,C), which indicates the failure of cells to exit during mitosis. The results of cell sorting verify the hypothesis that inhibiting Hh signaling results in hepatocytes being trapped in the mitosis phase or lacking the ability to process mitosis and cytokinesis. In a healthy liver, normal hepatocytes are diploid, and mature hepatocytes are mostly polyploid. After PH, polyploid hepatocytes in the liver increased significantly to restore the liver to its normal size, as reported previously [45,46]. More surprisingly, the vismodegib group displayed a higher proportion of polyploid hepatocytes (Figure 5D). In addition, hematoxylin-eosin staining of liver sections obtained from the vismodegib-treated group detected significantly bigger cells as compared with the non-treated control groups (Figure 5E). Subsequently, the Western blot results showed that CDC20 participating in the ubiquitination and degradation of Cyclin B decreased in the vismodegib group, while the protein BUB1B inhibiting the degradation of Cyclin B was significantly increased (Figure 5B,C), corresponding to the accumulation of Cyclin B in the vismodegib group. In conclusion, inhibition of the Hh signal disrupted the cell cycle of hepatocytes, resulting in more polyploid cells and thereby inhibiting liver regeneration through inhibiting the degradation of Cyclin B.
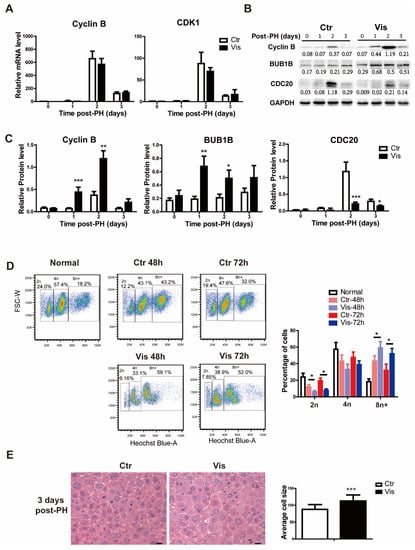
Figure 5.
Vismodegib increases the accumulation of polyploid cells through suppressing the degradation of Cyclin B. (A) QRT-PCR analysis of Cyclin B and Cdk1 in the liver tissue at different times after PH between the two groups (1, 2 and 3 days), n = 5. (B) Western blot analysis of Cyclin B, Cdc20 and Bub1b in liver tissue at different times after PH. Western blot quantification analysis compared to GAPDH is shown under the bands. (C) Quantification analysis of Cyclin B, CDC20 and BUB1B Western blot results is shown in the histogram. (D) Cell flow analysis of the proportion of polyploid primary hepatocytes by Hoechst 33342 in normal liver, and two groups of mice two days and three days after PH. The proportions of different polyploid cells are shown in the histogram. (E) H&E staining of liver slices at 3 days after PH showed different cell sizes between the two groups. A total of 100 cells were analyzed in each group. Cell sizes were analyzed by Image Pro Plus. Data represent means ± SEM. * p < 0.05, ** p < 0.01, *** p < 0.001 vs. control group.
4. Discussion
Liver regeneration following PH is a highly complex process involving harmony between a variety of cells, including hepatic parenchymal cells and non-parenchymal cells, in addition to cytokines promoting cell proliferation [2]. In recent decades, many researchers have demonstrated how these cells are involved in regeneration; however, the signaling pathways have not been fully discovered yet. Hh signaling is one of the pathways that mediate cell regeneration. Studies have demonstrated that Hh signaling is activated immediately after the induction of PH in the mouse liver. This could be manifested in the increasing expression of Hh ligands (IHH, SHH), receptors (SMO, PTC) and intracellular signals (GLI1, GLI2). Furthermore, the SMO inhibitor cyclopamine significantly inhibited mouse liver regeneration, even causing the death of mice after PH [34]. In another liver regeneration model with the novel two-staged hepatectomy (ALPPS), the Hh signaling pathway regulated the early acceleration of liver regeneration [47]. However, the detailed mechanism between Hh signaling and liver regeneration remains unclear. Our present study demonstrates that Hh signaling mediates liver regeneration through regulating DNA replication and cell division. We observed that the group of mice treated with an Hh inhibitor showed slow cell proliferation and arrest of mitosis, which caused the inhibition of liver regeneration. On the other hand, liver regeneration was inhibited in mice treated with the Hh inhibitor vismodegib, which was accompanied by a conspicuously reduced expression of Hh-inducible factors GLI1 and GLI2. Furthermore, we demonstrated that the decline in liver regeneration was due to interference of the cell cycle. In the G1/S phase, inhibition of Cyclin D and CDK2 in the vismodegib-treated group resulted in the suppression of DNA replication, which resulted in a reduction in cell proliferation. Recent studies have demonstrated Cyclin D as the downstream effector of the Hh signaling pathway [26]. In this study, we also identified Cyclin B as an effector molecule of Hh signaling. Our results show that accumulation of Cyclin B was observed in the vismodegib-treated group, which impeded liver cells from exiting mitosis while giving rise to a higher proportion of polyploid hepatocytes.
However, there are still many unresolved issues between Hh signaling and liver regeneration. There is some controversy over Hh pathway activation in the healthy liver of mammals. Most studies have shown that there is almost no detectable Hh signaling pathway in a healthy liver. However, research on conditional knock-out SMO in mice hepatocytes seemed to prove the existence of the Hh signaling pathway in a mature healthy liver [48,49,50]. Furthermore, studies conducted on a nonalcoholic fatty liver mouse model revealed that the Hh signal in hepatocytes could regulate hepatic inflammation [51,52,53]. Moreover, liver regeneration following PH induction was mediated in a different fashion from normal homeostasis taking place in a healthy liver. Our result also confirms the hypothesis that the Hh ligand IHH is detected only in non-parenchymal cells and enhanced after PH. However, the receptor SMO and intracellular signaling molecules GLI1 and GLI2 were detected in hepatocytes 2 days after PH, which is similar to a previous finding on regeneration after the novel two-staged hepatectomy (ALPPS surgery) on mice [47]. These results show the activation of the Hh signaling pathway in hepatocytes in liver regeneration after PH.
In conclusion, we demonstrated the important role of the Hh signal in liver regeneration, and we speculate that non-parenchymal cell-derived Hh signals act on hepatocytes and promote hepatocyte proliferation during liver regeneration after PH. Regulating Hh signaling may contribute to the recovery of liver mass after liver resection in clinical practice.
Supplementary Materials
The following supporting information can be downloaded at: https://www.mdpi.com/article/10.3390/cimb44020032/s1, Table S1: Primer sequence of genes.
Author Contributions
J.T., Y.C. and Y.L. conceived the experiments; J.T., Y.C., Y.Z. and R.W. performed the research; J.T. and Y.L. wrote the article; T.P. provided the idea during the experiment; A.G. polished up the language of the manuscript; F.Y. provided reagents for this study; and all authors read the article, provided suggestions on revision and approved the final version. All authors have read and agreed to the published version of the manuscript.
Funding
This study was supported by the National Key R&D Program of China (2019YFA0111300), the Sino-German rapid response funding call for COVID-19 related research (C-0031), Frontier Research Program of Bioland Laboratory (Guangzhou Regenerative Medicine and Health Guangdong Laboratory) (2018GZR110105011), National Natural Science Foundation of China (31871379).
Institutional Review Board Statement
All animal studies including mouse feeding and operation experiments were performed in accordance with the experimental animal ethics committee of Guangzhou Institutes of Biomedicine and Health (GIBH). The animal experiments were approved by the ethics committee of GIBH, and the animal experiment number is 2012036.
Informed Consent Statement
Not applicable.
Data Availability Statement
Not applicable.
Acknowledgments
The authors thank the Guangzhou Institutes of Biomedicine and Health animal experimental center for providing assistance throughout the animal experiments, and the instrument center for technical assistance.
Conflicts of Interest
The authors declare no conflict of interest.
Abbreviations
| Hh | hedgehog |
| ICR | Institute of Cancer Research |
| PH | partial hepatectomy |
| PFA | paraformaldehyde |
| HGF | hepatocyte growth factor |
| EGF | epidermal growth factor |
| TGFβ | transforming growth factor-β |
| HSC | hepatic stellate cell |
| PTC | patched |
| SMO | smoothened |
| MPF | maturation-promoting factor |
| GLI | glioma-associated oncogene |
| FDA | Food and Drug Administration |
| RIPA | Radio Immunoprecipitation Assay |
| SDS-PEGA | sodium dodecyl sulfate polyacrylamide gel electrophoresis |
| PVDF | polyvinylidene fluoride |
| Edu | 5-Ethynyl-2′-deoxyuridine |
| IHH | Indian hedgehog |
| APC/C | anaphase-promoting complex/cyclosome |
| CMC-NA | sodium carboxymethylcellulose |
References
- Michalopoulos, G.K.; Bhushan, B. Liver regeneration: Biological and pathological mechanisms and implications. Nat. Rev. Gastroenterol. Hepatol. 2021, 18, 40–55. [Google Scholar] [CrossRef]
- Kiseleva, Y.V.; Antonyan, S.Z.; Zharikova, T.S.; Tupikin, K.A.; Kalinin, D.V.; Zharikov, Y.O. Molecular pathways of liver regeneration: A comprehensive review. World J. Hepatol. 2021, 13, 270–290. [Google Scholar] [CrossRef]
- Yagi, S.; Hirata, M.; Miyachi, Y.; Uemoto, S. Liver Regeneration after Hepatectomy and Partial Liver Transplantation. Int. J. Mol. Sci. 2020, 21, 8414. [Google Scholar] [CrossRef]
- Modares, N.F.; Polz, R.; Haghighi, F.; Lamertz, L.; Behnke, K.; Zhuang, Y.; Kordes, C.; Haussinger, D.; Sorg, U.R.; Pfeffer, K.; et al. IL-6 Trans-signaling Controls Liver Regeneration After Partial Hepatectomy. Hepatology 2019, 70, 2075–2091. [Google Scholar] [CrossRef]
- Addante, A.; Roncero, C.; Lazcanoiturburu, N.; Méndez, R.; Almalé, L.; García-Álvaro, M.; Dijke, P.T.; Fabregat, I.; Herrera, B.; Sánchez, A. A Signaling Crosstalk between BMP9 and HGF/c-Met Regulates Mouse Adult Liver Progenitor Cell Survival. Cells 2020, 9, 752. [Google Scholar] [CrossRef] [Green Version]
- Chiang, K.Y.; Li, Y.W.; Li, Y.H.; Huang, S.J.; Wu, C.L.; Gong, H.Y.; Wu, J.L. Progranulin A Promotes Compensatory Hepatocyte Proliferation via HGF/c-Met Signaling after Partial Hepatectomy in Zebrafish. Int. J. Mol. Sci. 2021, 22, 11217. [Google Scholar] [CrossRef]
- Russell, J.O.; Monga, S.P. Wnt/beta-Catenin Signaling in Liver Development, Homeostasis, and Pathobiology. Annu. Rev. Pathol. Mech. 2018, 13, 351–378. [Google Scholar] [CrossRef] [Green Version]
- Inoue, Y.; Fujii, K.; Ishii, M.; Kagota, S.; Tomioka, A.; Hamamoto, H.; Osumi, W.; Tsuchimoto, Y.; Masubuchi, S.; Yamamoto, M.; et al. Volumetric and Functional Regeneration of Remnant Liver after Hepatectomy. J. Gastrointest. Surg. 2019, 23, 914–921. [Google Scholar] [CrossRef]
- Clemens, M.M.; McGill, M.R.; Apte, U. Mechanisms and biomarkers of liver regeneration after drug-induced liver injury. Stud. Surf. Sci. Catal. 2019, 85, 241–262. [Google Scholar] [CrossRef]
- Wang, L.; Duan, W.; Kang, L.; Mao, J.; Yu, X.; Fan, S.; Li, L.; Tao, Y. Smoothened activates breast cancer stem-like cell and promotes tumorigenesis and metastasis of breast cancer. Biomed. Pharmacother. 2014, 68, 1099–1104. [Google Scholar] [CrossRef]
- Philips, G.M.; Chan, I.; Swiderska, M.; Schroder, V.T.; Guy, C.; Karaca, G.F.; Moylan, C.; Venkatraman, T.; Feuerlein, S.; Syn, W.-K.; et al. Hedgehog Signaling Antagonist Promotes Regression of Both Liver Fibrosis and Hepatocellular Carcinoma in a Murine Model of Primary Liver Cancer. PLoS ONE 2011, 6, e23943. [Google Scholar] [CrossRef] [Green Version]
- Shen, X.; Peng, Y.; Li, H. The Injury-Related Activation of Hedgehog Signaling Pathway Modulates the Repair-Associated In-flammation in Liver Fibrosis. Front. Immunol. 2017, 8, 1450. [Google Scholar] [CrossRef] [Green Version]
- Machado, M.V.; Diehl, A.M. Hedgehog signalling in liver pathophysiology. J. Hepatol. 2018, 68, 550–562. [Google Scholar] [CrossRef] [Green Version]
- Skoda, A.M.; Simovic, D.; Karin, V.; Kardum, V.; Vranic, S.; Serman, L. The role of the Hedgehog signaling pathway in cancer: A comprehensive review. Bosn. J. Basic Med. Sci. 2018, 18, 8–20. [Google Scholar] [CrossRef]
- Choi, S.S.; Syn, W.-K.; Karaca, G.F.; Omenetti, A.; Moylan, C.A.; Witek, R.P.; Agboola, K.M.; Jung, Y.; Michelotti, G.; Diehl, A.M. Leptin Promotes the Myofibroblastic Phenotype in Hepatic Stellate Cells by Activating the Hedgehog Pathway. J. Biol. Chem. 2010, 285, 36551–36560. [Google Scholar] [CrossRef] [Green Version]
- Shen, J.; Yan, J.; Wei, X.; Liu, Z.; Ni, J.; Hu, B.; Jin, L. Gant61 ameliorates CCl4-induced liver fibrosis by inhibition of Hedgehog signaling activity. Toxicol. Appl. Pharmacol. 2020, 387, 114853. [Google Scholar] [CrossRef]
- Du, K.; Hyun, J.; Premont, R.T.; Choi, S.S.; Michelotti, G.A.; Swiderska-Syn, M.; Dalton, G.D.; Thelen, E.; Rizi, B.S.; Jung, Y.; et al. Hedgehog-YAP Signaling Pathway Regulates Glutaminolysis to Control Activation of Hepatic Stellate Cells. Gastroenterology 2018, 154, 1465–1479.e13. [Google Scholar] [CrossRef] [Green Version]
- Yang, L.; Jung, Y.; Omenetti, A.; Witek, R.P.; Choi, S.; Vandongen, H.M.; Huang, J.; Alpini, G.D.; Diehl, A.M. Fate-Mapping Evidence That Hepatic Stellate Cells Are Epithelial Progenitors in Adult Mouse Livers. Stem Cells 2008, 26, 2104–2113. [Google Scholar] [CrossRef] [Green Version]
- Ingham, P.W. Hedgehog signalling. Curr. Biol. 2008, 18, R238–R241. [Google Scholar] [CrossRef] [Green Version]
- Kong, J.H.; Siebold, C.; Rohatgi, R. Biochemical mechanisms of vertebrate hedgehog signaling. Development 2019, 146, dev166892. [Google Scholar] [CrossRef] [Green Version]
- Gao, L.; Zhang, Z.; Zhang, P.; Yu, M.; Yang, T. Role of canonical Hedgehog signaling pathway in liver. Int. J. Biol. Sci. 2018, 14, 1636–1644. [Google Scholar] [CrossRef] [PubMed]
- Misawa, R.; Minami, T.; Okamoto, A.; Ikeuchi, Y. A Light-Inducible Hedgehog Signaling Activator Modulates Proliferation and Differentiation of Neural Cells. ACS Chem. Biol. 2020, 15, 1595–1603. [Google Scholar] [CrossRef] [PubMed]
- Deng, Q.; Li, P.; Che, M.; Liu, J.; Biswas, S.; Ma, G.; He, L.; Wei, Z.; Zhang, Z.; Yang, Y.; et al. Activation of hedgehog signaling in mesenchymal stem cells induces cartilage and bone tumor formation via Wnt/beta-Catenin. eLife 2019, 8, e50208. [Google Scholar] [CrossRef]
- Leigh, K.A.; Choksi, P.K.; Krup, A.L.; Mayer, W.; Santos, N.; Reiter, J.F. Hedgehog signaling drives medulloblastoma growth via CDK6. J. Clin. Investig. 2017, 128, 120–124. [Google Scholar] [CrossRef] [Green Version]
- Duman-Scheel, M.; Weng, L.; Xin, S.; Du, W. Hedgehog regulates cell growth and proliferation by inducing Cyclin D and Cyclin E. Nature 2002, 417, 299–304. [Google Scholar] [CrossRef]
- Peng, W.; Wu, J.; Fan, H.; Lu, J.; Feng, J. LncRNA EGOT Promotes Tumorigenesis Via Hedgehog Pathway in Gastric Cancer. Pathol. Oncol. Res. 2017, 25, 883–887. [Google Scholar] [CrossRef]
- Adolphe, C.; Hetherington, R.; Ellis, T.; Wainwright, B.; Thebault, S.; Flourakis, M.; Vanoverberghe, K.; Vandermoere, F.; Roudbaraki, M.; Lehen’Kyi, V.; et al. Patched1 Functions as a Gatekeeper by Promoting Cell Cycle Progression. Cancer Res. 2006, 66, 2081–2088. [Google Scholar] [CrossRef] [Green Version]
- Barnes, E.A.; Kong, M.; Ollendorff, V.; Donoghue, D.J. Patched1 interacts with cyclin B1 to regulate cell cycle progression. EMBO J. 2001, 20, 2214–2223. [Google Scholar] [CrossRef] [Green Version]
- Basu, S.; Roberts, E.L.; Jones, A.W.; Swaffer, M.; Snijders, A.P.; Nurse, P. The Hydrophobic Patch Directs Cyclin B to Centrosomes to Promote Global CDK Phosphorylation at Mitosis. Curr. Biol. 2020, 30, 883–892. [Google Scholar] [CrossRef] [Green Version]
- Lara-Gonzalez, P.; Moyle, M.W.; Budrewicz, J.; Mendoza-Lopez, J.; Oegema, K.; Desai, A. The G2-to-M Transition Is Ensured by a Dual Mechanism that Protects Cyclin B from Degradation by Cdc20-Activated APC/C. Dev. Cell 2019, 51, 313–325. [Google Scholar] [CrossRef]
- Bai, G.Y.; Choe, M.H.; Kim, J.S.; Oh, J.S. Mis12 controls cyclin B1 stabilization via Cdc14B-mediated APC/C(Cdh1) regulation during meiotic G2/M transition in mouse oocytes. Development 2020, 147, dev185322. [Google Scholar] [CrossRef] [PubMed]
- Yamano, H. APC/C: Current understanding and future perspectives. F1000Research 2019, 8, 725. [Google Scholar] [CrossRef] [PubMed]
- Sitry-Shevah, D.; Kaisari, S.; Teichner, A.; Miniowitz-Shemtov, S.; Hershko, A. Role of ubiquitylation of components of mitotic checkpoint complex in their dissociation from anaphase-promoting complex/cyclosome. Proc. Natl. Acad. Sci. USA 2018, 115, 1777–1782. [Google Scholar] [CrossRef] [Green Version]
- Ochoa, B.; Syn, W.-K.; Delgado, I.; Karaca, G.F.; Jung, Y.; Wang, J.; Zubiaga, A.M.; Fresnedo, O.; Omenetti, A.; Zdanowicz, M.; et al. Hedgehog signaling is critical for normal liver regeneration after partial hepatectomy in mice. Hepatology 2010, 51, 1712–1723. [Google Scholar] [CrossRef] [PubMed] [Green Version]
- Meiss, F.; Andrlova, H.; Zeiser, R. Vismodegib. Recent Results Cancer Res. 2018, 211, 125–139. [Google Scholar] [PubMed]
- Frampton, J.E.; Basset-Séguin, N. Vismodegib: A Review in Advanced Basal Cell Carcinoma. Drugs 2018, 78, 1145–1156. [Google Scholar] [CrossRef]
- Hirsova, P.; Ibrahim, S.H.; Bronk, S.F.; Yagita, H.; Gores, G.J. Vismodegib Suppresses TRAIL-mediated Liver Injury in a Mouse Model of Nonalcoholic Steatohepatitis. PLoS ONE 2013, 8, e70599. [Google Scholar] [CrossRef] [Green Version]
- Pratap, A.; Singh, S.; Mundra, V.; Yang, N.; Panakanti, R.; Eason, J.D.; Mahato, R.I. Attenuation of early liver fibrosis by pharmacological inhibition of smoothened receptor signaling. J. Drug Target. 2012, 20, 770–782. [Google Scholar] [CrossRef]
- Scales, S.J.; de Sauvage, F.J. Mechanisms of Hedgehog pathway activation in cancer and implications for therapy. Trends Pharmacol. Sci. 2009, 30, 303–312. [Google Scholar] [CrossRef]
- Higgins, G.M.; Anderson, R.M. Experimental pathology of the liver I Restoration of the liver of the white rat following partial surgical removal. Arch. Pathol. 1931, 12, 186–202. [Google Scholar]
- Stephenson, G.W. Experimental pathology of the liver—Restoration of the liver after partial hepatectomy and partial ligation of the portal vein. Arch. Pathol. 1932, 14, 484–490. [Google Scholar]
- Michalopoulos, G.K. Hepatostat: Liver regeneration and normal liver tissue maintenance. Hepatology 2017, 65, 1384–1392. [Google Scholar] [CrossRef] [PubMed]
- Angelozzi, M.; De Charleroy, C.R.; Lefebvre, V. EdU-Based Assay of Cell Proliferation and Stem Cell Quiescence in Skeletal Tissue Sections. Springer Protoc. Handb. 2021, 2230, 357–365. [Google Scholar] [CrossRef]
- Sun, X.; Zhang, C.; Jin, H.; Sun, G.; Tian, Y.; Shi, W.; Zhang, D. Flow cytometric analysis of T lymphocyte proliferation in vivo by EdU incorporation. Int. Immunopharmacol. 2016, 41, 56–65. [Google Scholar] [CrossRef]
- Miyaoka, Y.; Ebato, K.; Kato, H.; Arakawa, S.; Shimizu, S.; Miyajima, A. Hypertrophy and Unconventional Cell Division of Hepatocytes Underlie Liver Regeneration. Curr. Biol. 2012, 22, 1166–1175. [Google Scholar] [CrossRef] [Green Version]
- Gentric, G.; Celton-Morizur, S.; Desdouets, C. Polyploidy and liver proliferation. Clin. Res. Hepatol. Gastroenterol. 2012, 36, 29–34. [Google Scholar] [CrossRef]
- Langiewicz, M.; Schlegel, A.; Saponara, E.; Linecker, M.; Borger, P.; Graf, R.; Humar, B.; Clavien, P.A. Hedgehog pathway mediates early acceleration of liver regeneration induced by a novel two-staged hepatectomy in mice. J. Hepatol. 2017, 66, 560–570. [Google Scholar] [CrossRef] [Green Version]
- Rennert, C.; Eplinius, F.; Hofmann, U.; Johänning, J.; Rolfs, F.; Schmidt-Heck, W.; Guthke, R.; Gebhardt, R.; Ricken, A.M.; Matz-Soja, M. Conditional loss of hepatocellular Hedgehog signaling in female mice leads to the persistence of hepatic steroidogenesis, androgenization and infertility. Arch. Toxicol. 2017, 91, 3677–3687. [Google Scholar] [CrossRef]
- Matz-Soja, M.; Aleithe, S.; Marbach, E.; Böttger, J.; Arnold, K.; Schmidt-Heck, W.; Kratzsch, J.; Gebhardt, R. Hepatic Hedgehog signaling contributes to the regulation of IGF1 and IGFBP1 serum levels. Cell Commun. Signal. 2014, 12, 11. [Google Scholar] [CrossRef] [Green Version]
- Kim, J.; Hyun, J.; Wang, S.; Lee, C.; Jung, Y. MicroRNA-378 is involved in hedgehog-driven epithelial-to-mesenchymal transition in hepatocytes of regenerating liver. Cell Death Dis. 2018, 9, 721. [Google Scholar] [CrossRef]
- Seki, E. HEDGEHOG Signal in hepatocytes mediates macrophage recruitment: A new mechanism and potential therapeutic target for fatty liver disease. Hepatology 2015, 63, 1071–1073. [Google Scholar] [CrossRef] [PubMed] [Green Version]
- Kwon, H.; Song, K.; Han, C.; Chen, W.; Wang, Y.; Dash, S.; Lim, K.; Wu, T. Inhibition of hedgehog signaling ameliorates hepatic inflammation in mice with nonalcoholic fatty liver disease. Hepatology 2015, 63, 1155–1169. [Google Scholar] [CrossRef] [PubMed] [Green Version]
- Machado, M.V.; Diehl, A.M. The hedgehog pathway in nonalcoholic fatty liver disease. Crit. Rev. Biochem. Mol. Biol. 2018, 53, 264–278. [Google Scholar] [CrossRef] [PubMed]


Publisher’s Note: MDPI stays neutral with regard to jurisdictional claims in published maps and institutional affiliations. |
© 2022 by the authors. Licensee MDPI, Basel, Switzerland. This article is an open access article distributed under the terms and conditions of the Creative Commons Attribution (CC BY) license (https://creativecommons.org/licenses/by/4.0/).