Abstract
School effectiveness is a topic of interest addressed by numerous research projects focused on clarifying which variables contribute to the explanation of educational performance. This research aims to find out to what extent social, cultural, and academic variables at the student and school levels, as perceived by families, influence performance, and to evaluate the relevance of high residual and gross score criteria in the selection of effective or ineffective schools. Census data from diagnostic evaluations of the Mathematical Reasoning and Linguistic Communication of students in a certain Spanish region, over five academic years, have been used. The multilevel hierarchical analyses carried out have enabled the detection of centers of high and low efficiency, as well as the identification of which factors, related to the idiosyncrasy of the students and the educational center they attend, significantly influence the performance of the students. It was concluded that the socioeconomic and cultural level of the families, the family expectations, the commitment to reading and the educational agreement were significant variables in the explanation of the students’ educational performance, and that the residual score of the educational centers was a valid criterion to estimate their level of effectiveness once the socio-cultural factors have been controlled.
1. Introduction
The general purpose of studies on school effectiveness is to contribute to the improvement of school processes in order to optimize educational results and equity. To achieve this purpose, educational evaluation is indispensable [1,2,3,4,5], especially to identify factors that influence educational performance [6,7,8,9].
International assessments of educational performance have allowed us to use the results as reference standards [1] that have led to changes in educational policy [1,3,10,11]. The contextualization of these results, obtained through the data provided by the context questionnaires that accompany the assessment of performance in core skills, has enabled the development of more accurate and reliable statistical analysis techniques, such as hierarchical linear models [12,13,14,15,16,17]. The main contribution of these multilevel designs is that they consider the nested structure of the data inherent to the educational system [6,18] and allow us to find out the factors responsible for performance that are attributed to the personal characteristics of the students (level 1: N1) and those that have an effect from higher levels of clustering, such as classrooms and centers (level 2: N2). Below are some research results grouped according to the level of affiliation of the factors that affect performance. Contextual factors, understood as those sociocultural factors of the individual and their families, and student characteristics, with reference to the student’s attitudes and aptitudes, affect academic results, and unlike school-level factors, they tend to be relatively similar in different countries [19,20,21], with some variations of cultural origin [22,23].
In the present article, a multilevel analysis was employed using the results of second-grade students (7–8 years old) from a Spanish region. This age range is less used in the international literature because it mainly uses data from the PISA (Programme for International Student Assessment) or TIMSS (Trends in International Mathematics and Science Study) assessments, among others [24], which use populations of students aged 15 years or in the fourth or eighth grade of compulsory education, respectively.
1.1. Factors Associated with School Effectiveness N1
This section provides findings from the literature that affect performance distinguished by economic, social, and cultural status (ESCS); immigration and native language; gender; and academic factors specified as prior performance, perceived self-efficacy, preschool attendance, center evaluations, and family support.
1.1.1. Economic, Social, and Cultural Status
ESCS is one of the factors most highlighted for its influence on academic performance in the scientific literature [5,12,14,25,26,27,28,29,30,31,32,33,34,35,36,37,38]. The influence is found in all educational stages: early childhood [5], primary [12,25,27,28,32,34,37] and secondary education [14,25,26,27,29,30,31,33,35,36,38], with the secondary stage being more represented in the literature due to studies originating from the PISA results [14,26,29,30,31,33,35,36,38]. It is calculated from the components associated with the socioeconomic and cultural level of the families, understood as economic resources, and the level of schooling or consumption of cultural goods. Some of the components used for its calculation are as follows: the number of family resources (e.g., owning a computer or study table) [19,34,39], the level of parental education (level of education attained) [40], or the number of books owned by the family [19,41]. These components are usually collected through context questionnaires and synthesized into a numerical index obtained, generally, through factor analysis techniques, such as Principal Component Analysis [42,43]. A negative ESCS would increase the likelihood of dropping out of school [44] and would decrease students’ learning opportunities [45].
1.1.2. Immigration and Native Language
The immigrant status of the students seems to have a negative impact on their school performance [14,25,27,28,31,32,46]. Not having the same native language in which assessments are conducted [12,22,34,36,45,47] and in which the classes are taught could be one of the variables related to this lower performance. However, immigration is a complex phenomenon that would require further review and determination of the influence of other factors, such as family involvement in education or the influence of ESCS.
1.1.3. Gender
A student’s gender is another factor studied in relation to school effectiveness. In the early years of schooling, the influence of gender is the object of controversy. There is research that does not support its influence [28,48] and, on the contrary, there are other studies that claim better performance in general for girls [5]. However, from secondary education, there seems to be a clearer relationship. Girls would show better levels than boys in reading and communication skills, while boys would show better levels than girls in mathematics and science [14,26,30,31,32,36,38,39,45,49,50,51]. This could be due to the stereotypes associated with gender roles, cultural mechanisms and values that could negatively impact girls’ self-confidence in mathematics and could be due to extracurricular factors such as being underrepresented in the media [48]. These cultural mechanisms could lead to biases in the expectations of female students in mathematics, which would give more importance to negative expectations than positive ones [52].
1.1.4. Academic Factors
There are other factors of an academic nature that would influence the results at the student level. Performance in previous courses or tests is positioned as one of the most supported factors for the prediction of subsequent performance [5,25,27,49]. Students’ perceived self-efficacy also could influence outcomes [26,31,53], perhaps as a reciprocal consequence of previous performance. The perception of low self-efficacy and poor prior performance would explain the association between repetition (re-performing the same school grade, a characteristic of the Spanish educational system, among others) and poor performance [12,14]. Preschool attendance may be a factor in improving academic outcomes, especially for families with low ESCS [12,26,34,54]. Apart from the relationships mentioned, it seems that students who receive more evaluations of their learning process, either with tests after each topic or with corrections and reviews of all the activities performed, could have better results [28], perhaps by training metacognition. In contrast, receiving more family support does not seem to correlate significantly with student performance [37].
1.2. Factors Associated with School Effectiveness N2
The influence of the variables associated with the educational center on the academic results achieved by the students is a reality verified in many studies [2,19,20,33,36,38,55,56,57]. This influence seems to increase as the education system progresses [5,58]. The use of the multilevel perspective allows for the aggregation of data from the first level (gender, ESCS, immigrants, etc.) at the school level. This helps to understand how these variables work at other levels of the educational system, providing new insights into them. In addition, it also allows the study of specific N2 variables, such as Subsidized Education (in Spain, “centros concertados” are schools that operate through both public funding and fees paid by parents, and therefore have slightly more freedom in their management than public schools) or educational leadership. For this reason, we provide results from the literature that have used data from the evaluation of schools. We begin with the relationships found between educational performance and the socioeconomic composition of the school and continue with the correlations originating from the different gender configurations of the schools and the size of the class. This section concludes by arguing for the importance of detecting the variables that influence educational performance for the promotion of educational equity, and the concreteness of the approach used and its possibilities, presenting the research objectives.
1.2.1. ESCS, Gender, and Size of Schools
Segregating students according to their socioeconomic characteristics would widen the social and academic gap between students [26,56,57,59]. This is a complex phenomenon, which seems to be determined by contextual characteristics such as location or school choice policies [59]. Segregation would worsen the results of schools where the concentration of students with a lower ESCS is higher [14,20,32,33,36,51,60] and influences the climate and discipline, positively impacting the effectiveness of schools with a higher ESCS [33,53]. The status of schools as Subsidized Education would have no effect when ESCS is controlled [12,27,38].
According to some research [30], schools with more female students would achieve better academic results. In contrast, research such as that of Gamazo et al. [14] would not support this hypothesis. There could also be evidence that centers with a high proportion of immigrants and repeaters have low levels of school effectiveness [14,25,46].
The influence of school size on student educational performance is unclear [49]. Nevertheless, some authors [27] maintain that it would not significantly affect performance. The greatest controversy is found in the size of the class group. Some research indicates that an increase in the ratio would worsen the results [12,61]. Other researchers do not believe that reducing the ratio would contribute to reducing the academic performance gap between students [62].
1.2.2. Evaluation of the Effectiveness of the Centers and Detection of Good Educational Practices
Knowledge of school characteristics that may contribute to improving academic results allows for the optimization of the work of educational centers in terms of quality and equity [44,45,54,63]. The proportion of variance difference between high-efficiency centers could be greater than between low-efficiency centers [53], which would indicate that in the latter, the level of performance tends to be more associated with the characteristics of the students who attend them, while in high-efficiency centers, the variables associated with the school have a greater impact on academic performance.
Therefore, it is especially important to detect and be aware of centers of very high or very low efficiency. Those with high effectiveness are those who achieve a high residual gain; that is, they obtain scores far above what would be expected, taking the levels they present in predictive variables, such as ESCS, as a reference [25,27,47,64,65]. The comparative study of this type of centers with those that present a low residual gain allows us to detect which variables give rise to processes and educational practices with a high level of achievement. This justifies the evaluation of the criteria relevance in the selection of high value-added centers, as well as the selection itself, which enables finding centers that do or do not stand out, in terms of good educational performance, in order to diagnose their potentials and weaknesses. The selection of centers would make it possible to address the educational reality from different approaches or paradigms, whether quantitative, qualitative or critical, in coherence with the demands of the complexity of the educational reality [25,27,47,64,65].
The combination of the detection of value-added centers and their subsequent in-depth study from different paradigms have found variables that could explain this added value:
- -
- Shared leadership, characterized by shared responsibility and goal setting, the encouragement of individual responsibility and participation in decisions, and the establishment of good communication channels among the school’s faculty [66,67,68];
- -
- Continuous training of teachers with experiences such as cascade training [27];
- -
- High levels of emotional involvement with students and their families, which takes the form of encouraging family participation in the daily life of the school, caring for socioemotional development and other aspects of development outside of academics, creating a positive environment, and encouraging family participation in education [64,69];
- -
- Paying special attention to diversity, personalizing curricular adaptations, and optimizing available resources, based on systematized planning [65].
To detect the level of effectiveness of educational centers, value-added measures in context are of great interest, since they allow the effect of external variables, such as the ESCS, to be controlled to find out if the center is operating effectively with the resources it has at its disposal [18,20]. This consideration is made because it is usually assumed that those centers that are located in less favorable areas will have more difficulty achieving optimal academic results [47]. We share the methodological approach of Martínez-Abad et al. [46] and Lizasoain [16] for the detection of high value-added centers, as it implies the characterization of very high-efficiency centers (CAEF) and very low-efficiency centers (CBEF), which we consider indispensable. The detection of schools and their subsequent characterization would serve to find good practices that could be generalized to contribute to the reduction of the inequality gap between students [45,54,70], as not all education systems would be able to guarantee equity in all their centers [19,20,45,54,60].
Therefore, the following research questions were addressed:
- (1)
- To what extent do student and family variables contribute to student achievement in Mathematical Reasoning (MR) and Linguistic Communication (LC)?
- (2)
- Is the use of high residual and gross score criteria relevant in the selection of CAEF and CBEF?
2. Materials and Methods
In this research, a non-experimental or ex-post facto methodology and a correlational design have been used. Specifically, multilevel hierarchical regression models have been used. This study has a double objective:
- (1)
- To find out to what extent social, cultural, and academic variables at the student and school levels, as perceived by families, influence performance of Mathematical Reasoning (MR) and Linguistic Communication (LC) skills, through hierarchical linear models;
- (2)
- To evaluate the relevance of high residual and gross score criteria in the selection of CAEF and CBEF.
2.1. Instruments
Two instruments were used, both designed and administered by Agencia Andaluza de Evaluación Educativa (Andalusian Agency for Educational Evaluation) (AGAEVE):
- ESCALA (EScritura, CAlculo y Lectura en Andalucía (Writing, Calculation, and Reading in Andalusia)) test: this test has been carried out annually and evaluates the academic performance of Andalusian students in the 2nd year of elementary school in MR and LC. For the preparation of the test, after the design process, a pilot study was carried out with 1000 participants to evaluate the relevance of each question and classify them according to the degree of difficulty. Once the questions, which have a practical orientation, have been selected, they are administered to the schools. The tests make it possible to obtain an evaluation of the students’ development of competencies in each skill, as well as overall results by class and center. The results are used for information purposes for the administration, schools, and educational inspection;
- Context questionnaires: this is an instrument administered to families in order to find out the socioeconomic characteristics of the students. This allows us to know the evolution and development of the educational centers and the students who attend them based on their socioeconomic characteristics.
The scores corresponding to the dependent variables were extracted from the ESCALA tests on MR and LC. Data for the following independent variables were obtained from the context questionnaires. The processing of variables was a preliminary step in the realization of multilevel hierarchical models (see Table 1):

Table 1.
Selected independent variables, description, and statistical processing.
The context questionnaires varied according to the years; therefore, Table 2 shows the variables used in each academic year. For the aggregate, that is, the school-level variables, the available N1 variables were used.
Table 2.
Variables, by academic year, collected in the context questionnaire.
2.2. Population
After signing an agreement with the AGAEVE in 2017, the census data obtained for Andalusian students in the 2nd grade of elementary school (7–8-year-old students), were used. The results from the 2010–2011 to 2016–2017 school years—except for the 2015–2016 school year, when there were no context questionnaires—were part of the research. Andalusia is an autonomous community in southern Spain with a population of 8,427,404, the largest in the country [71]. Performance in international tests, such as the Programme for International Student Assessment (PISA), was 30 points below the international average in mathematics [72]. First, cases that did not complete the assessment of either competency were discarded. After this process, the total number of participants in the study was 410,030 students (49% female; 51% male). The participating schools varied by year (see Table 3), with the minimum number of participating schools being 2040 and the maximum 2138. Table 3 shows the data disaggregated by academic year and gender. For the detection of the effectiveness of schools, only the schools that participated in all the evaluations were used, which amounted to 1786.
Table 3.
Total data on participating students by academic year, gender, and educational centers.
2.3. Procedure
First, the variables were adjusted for their use in the models (see Table 1 column 3). The ESCS variable and the rest of the ordinal covariates remained on their original scale. Although there are limitations in this decision, in educational sciences, the use of typed scores is generally accepted because they come from unobservable constructs measured indirectly [73]. Therefore, the values are interpreted, taking the reference population as a reference, as increases in standard deviation units [73]. In the case of nominal variables, dummy variables were created, such as the type of center and gender. Second, subjects belonging to schools with fewer than 11 students were eliminated because such small schools are subject to greater sampling variability [18]. Once the aforementioned cases of each grade were discarded, multilevel regressions were carried out using hierarchical linear models [14,27,47,74]. At first, the null model, that is, the model without any covariates [73], was calculated:
After verifying the existence of significant differences in variance at both levels [73] and that the Intraclass Correlation Coefficient (ICC) was greater than 10% [14,75], predictive covariates were added at both levels. This process was done, at first, by including all the available variables in order to have a preliminary view of the behavior of the model and the significant or insignificant covariates that it returned. Subsequently, variables were included and excluded to adjust the model, ensuring that only variables that were significant at 99% confidence were included. Therefore, the model was considered refined when the covariates included were significant at 99% confidence and the proportion of explained variance was greater than the null model. Additionally, with the criterion of the likelihood ratio [73], significant differences were obtained between the null model and the refined model. Hence, the second is a better model, as it includes more parameters [73]. All the analyses were carried out using Statistical Package for the Social Sciences (SPSS) version 25. Once the model is refined, the residual scores N2 (u0j) are calculated for each of them [74], the residual score being the difference between the expected and achieved scores. This score allows us to find centers with added value, since they are considered to be working effectively due to having an empirical or observed score above their expected score [25,27,47,64,65]. To identify CAEFs and CBEFs, the criteria of Martínez-Abad et al. [46], which are extreme residual scores (centers with the highest positive or negative average residual score over 5 years) and extreme scores (centers with the highest or lowest average score over 5 years), were taken as a reference.
3. Results
First, the descriptive results for the two competencies assessed (see Table 4 and each of the covariates by course (see Table 5) are presented.
Table 4.
Descriptive results of the scores in the different skills by year.
Table 5.
Descriptive results of the scores in the different covariates by year.
As can be seen in Table 4, the means and standard deviations did not undergo significant variations over the years, beyond the changes introduced in the family questionnaire. The standard deviations of N1 were greater than those of N2, indicating that there is greater heterogeneity in scores between families than between centers (see Table 5). The largest standard deviation was found in the size of the center, illustrating the diversity of Andalusian schools under this criterion.
Secondly, the results of the multilevel hierarchical regression are shown for the LC and MR skills. The refined model is presented, consisting of the result of the model with all the significant variables possible. Table 6 shows the percentages of variance reduction ratios and variance explained by year and discipline, differentiating between students and residual scores between schools. The results provided are with the refined model, that is, with the predictors, included. The ICC indicates the effect of the school on explaining the results, being higher in RM for all years. On the other hand, the percentage of variance explained was higher in the case of LC and schools, so the inclusion of predictor variables allows for a more accurate estimation of the contribution of schools to the development of competencies. Therefore, the calculation of their effectiveness will be more accurate when controlling the student characteristics [76].
Table 6.
Proportion of reduction (%) in variance and variance explained by academic year and skill and ICC for refined model.
The covariates were added as a fixed part. The results with the significant covariates (99% confidence) for each year are presented in Appendices: Table A1 (MR) and Table A2 (LC). The results must be interpreted while taking into account that the values of the variables are not directly comparable since they have different measurement scales. In some cases, there are standardized scores (ESCS), ordinal scale scores, and in others, for example, dichotomous scores (gender). To find out the type of variable, we recommend referring to Table 1, where the processing is explained, and 6, where the descriptive analyses are presented. Therefore, taking, as a reference, the results of the MR for the year 2016–2017, the expected average results, according to the intercept with no more covariates, for boys of medium ESCS, would be 290.68 with a standard deviation of SD = 23.13. For the female gender, this would correspond to an increase of 3.03 points in the results for the skill. An increase of one point in the ESCS would lead to an increase of 15.32 points in MR, while an increase of one point in the amount of homework would lead to a decrease of 2.57 points in MR. On the other hand, if the center’s average increases by one point regarding bedtime, it would be accompanied by an increase of 13.09 points in MR, or if the center’s average in commitment to reading increases by one point, it would be accompanied by an increase of 6.02 points in MR.
The highest estimates for N1 were ESCS, gender, and homework time in both skills. In N2, the time spent on homework and the center’s commitment to reading could be highlighted in both skills as the variables with the highest estimates, even though these were only used in the last two years. The average score was lower in the case of LC, being the skill where the least variation was explained by the center according to the ICC. The direction of the variables was constant for all courses, that is, family expectations added while an increase in the perception of the number of families subtracted. However, there were changes in direction between levels. While screen consumption increased the score at the student level, it subtracted it at the center level. The amount of homework subtracted at the student level but added at the center level. These changes deserve more attention as they may be the result of the multicollinearity that we face in research studies. The discussion section expands on the interpretations. The centers’ average ESCS was only significant in the 2016–2017 academic year in LC, increasing the result when it was favorable. Likewise, for this academic year and skill, the results could suggest that centers that only admit female students may obtain worse results. Figure 1 includes a summary of the variables associated with performance by competency.
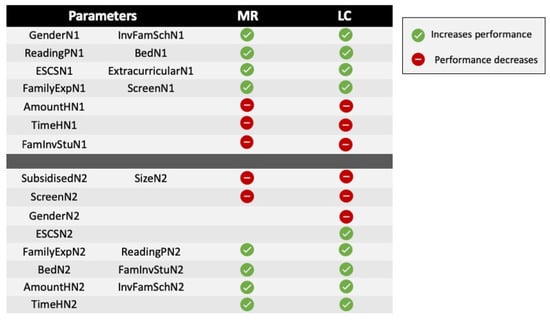
Figure 1.
Summary of significant parameters and their direction distributed by competency.
Thirdly, the centers were selected. The process began by eliminating from the study those centers that had not participated in all evaluations conducted during the academic years under study, so as not to lose the longitudinal character of the study. The final number of participating centers was reduced to 1786. The residual scores were calculated for each year and skill. The average residual score of the center in both skills was calculated prior to this. In addition, the average scores of the residual scores in the five analyzed academic years were calculated. The gross scores were calculated by a process analogous to that for the residual scores. Finally, 50 CAEF centers (25 centers with the best average score and 25 with the best average residual score) and 50 CBEF centers (25 with the worst average score and 25 with the worst average residual score) were selected.
Therefore, the correlation between both criteria and the average ESCS of the center was calculated. Table 7 shows Pearson’s correlation between the average residual score, the average score, and the average ESCS of the center. The mean residual score and the mean score had a high and positive relationship (r = 0.87); however, the mean residual score did not show any relationship with the mean ESCS. In contrast, the mean score did have a positive mean relationship with the mean ESCS (r = 0.44). These results could be interpreted as meaning that the centers with high residual scores would have high mean scores, and vice versa, with the criteria of scores and extreme residual scores being parallel in our case. However, the criterion of an extreme residual score may control the influence of the ESCS, so it was ultimately the criterion used for the selection of the 50 CAEFs and CBEFs, discarding the use of gross scores because they do not control for context effects measured from the ESCN. In this way, we also ensured that there was no overlap in the selection of centers.
Table 7.
Pearson’s correlation between mean residual score, mean score, and ESCS.
Finally, the 50 CAEFs and 50 CBEFs were selected. Of the CAEFs, 37 were public, 2 were private, and 11 were subsidized. Of the CBEFs, 33 were public, 2 were private, and 15 were subsidized. Table 8 presents a brief description of them according to their effectiveness category, distinguishing between the aggregate variables common to the 5 years, the score, and the residual score. In addition, in order to determine possible differences, a t-test was performed. Among the results, it should be noted that, as expected, there were differences in the mean score and mean residual score, with the scores being higher in the CAEFs; in family expectations (dCohen = −0.46), and in families’ encouragement of reading (dCohen = −0.58), which was also higher in the CAEFs with moderate effect size [77]. However, no differences were found in families’ commitment to the center, in size, or in ESCS.
Table 8.
Center descriptions and mean comparison tests between CAEFs and CBEFs.
4. Discussion
The results of the multilevel hierarchical analysis are mostly consistent with previous findings in the scientific literature. The ESCS at the student level is the variable that has the greatest influence on the results for both skills [21,57]. Female students perform better in both tests in the 2nd year of elementary school [5], meaning there is a gap between these findings and those obtained in later educational stages, in which male students perform better in MR [14,25,30,31,32,36,38,39,45,49,50,51]. These results reveal a possible gender gap at these ages which needs to be studied and deepened in order to be solved from the teaching–learning process.
Coinciding with Wei [37], it has been shown that, at early ages, a high level of student support, as well as a high level of time spent on homework, is associated with poor academic results [76]. This could be due to the fact that those students who receive more help or dedicate more time to schoolwork are also those who need more help and time, being a direct consequence of their performance capacity. Attendance at extracurricular activities is positive for performance, so it would be advisable for schools to make the appropriate efforts to encourage it, although it would be interesting to expand on these findings to find out if there are differences between recreational or academic extracurricular activities. However, this may be no more than a spurious correlation mediated by ESCS, since families with a higher economic and cultural level are those that provide greater opportunities [45] and resources [19,34,39,78] for this type of activity.
As for school-level variables, it is noteworthy that the school’s ESCS has not been significant in all academic years, with a greater presence in LC. It is possible that Andalusian schools compensate for the differences between students at this level, which would explain why subsidized schools obtain a lower level of performance. The center’s mean ESCS was only significant in one year, 2016–2017, for the LC competency. Likewise, the results suggested a decrease in LC in the case of centers with only female students, results similar to those of López-González et al. [76], in which they also had a change in gender direction at the center level. Although this could be a model fit, the results may suggest that female students would benefit from a mixed gender composition in the centers. The increase in the size of the center, in some years, is associated with a decrease in MR performance, which contradicts the results obtained in other previous studies [27]. It is remarkable that an increased use of screens in the center correlates negatively with performance, contrary to what was happening at the level of the student body. Higher screen consumption would be associated with worse development [79,80,81], especially when the use is for entertainment [82], so this result deserves further investigation. At first, it could be inferred that it would be evidence of a greater possession of resources, however, students from more disadvantaged families seem to use devices more, perhaps because their families have fewer resources and skills to educate or entertain their students, so they would impose fewer limitations [78,82].
Family expectations have been significant at both levels. The results of the OECD [53] are confirmed, showing better expectations from families with a higher ESCS. Family involvement in the school has also been significant at the school level, confirming that greater family commitment to the school improves educational performance by fostering a sense of belonging [54]. However, it was only significant in one year, and the direction was different from the level of the student body, so we believe that future studies should focus on this issue. Finally, it is striking that the variables referring to the amount of homework and time spent on it, at the school level, present a significant and positive association with performance, contrary to what happened at the student level. Schools that demand less homework seem to be more effective, perhaps because of a better organization of time both inside and outside the classroom [83]. However, a more in-depth review of this variable would be necessary to allow for a more realistic interpretation.
With regard to the selection of CAEFs and CBEFs, given the high correlation between the criteria of scores and residual scores, in both disciplines, it is estimated that it is preferable to use the residual criterion, as this also allows us to control contextual variables [18,20]. The development of these criteria using census data ensures robustness and reliability in the detection of CAEFs and CBEFs, taking into account both excellence, as centers of proven effectiveness, and equity, when considering their own context [16]. The procedural model followed for the selection of centers could facilitate the development of specific interventions aimed at improving the effectiveness of schools [60] and expanding knowledge of the variables that help explain educational performance [9,25,27,47,64,65]. However, given the complexity of the educational system and the study of social sciences, it is assumed that the results are partial when taking the performance in certain competencies as a reference, with the educational reality being more complex and beyond the results of diagnostic evaluations [6,76]. Therefore, we believe it is important for educational evaluation and improvement to create dialogue between paradigms, riding between the macro and micro scales, as well as the international and the local [73].
4.1. Limitations
Regarding the limitations of the study, we consider that the context questionnaires that accompany the ESCALA tests do not collect all the contextual variables that may be affecting the educational performance of students. The variables at the school level, for the most part, are only the result of the aggregation of variables at the student level. The anonymous processing of the results did not allow for decisions such as reducing the sample and expanding the variables associated with the schools by means of questionnaires or other tools. In addition, the data analyses used do not allow the establishment of causal relationships, the search for which we consider interesting as future research. Finally, the strong collinearity of the constructs with which we work in educational sciences, coming from indirect measures of measurement and the processes used, are limits that we must assume and consider for future studies.
4.2. Prospective
In the future, it may be useful to extend the use of the selection of centers with a qualitative study to find cultural variables that improve the work of the centers. On the other hand, it may be appropriate for future editions of the instrument to incorporate questions about child education attendance and immigrant status, in addition to reflecting on the reformulation of the question regarding the use of screens. Furthermore, the number of questions about the centers should be increased in order to improve the statistical model and the knowledge of the variables that could explain school effectiveness. Finally, as mentioned above, the complexity of the educational system requires a study from different paradigms that allow for an enrichment of the body of knowledge from different criteria and points of view.
5. Conclusions
The study of factors associated with school performance and effectiveness allows for the diagnosis of educational systems to assist in decision making at the macro and micro levels. In the present research, some factors were found that could be related to educational performance. Among them, the influence of the ESCS stands out, since it shows that there is a gap in the equity of the educational system as well as the lower performance of male students, which could mean a gender gap to be more deeply investigated.
On the other hand, criteria for the selection of high- and low-efficiency centers were evaluated. The use of residual scores is considered to be an acceptable criterion for the evaluation of the effectiveness of centers. This score allows the influence of contextual factors to be controlled. Finally, it should be mentioned that there seems to be a greater influence of the center on the RM results than on those of LC, which could be a limitation for the promotion of equity in the centers, since this competency is instrumental in the development of the other competencies.
Author Contributions
Conceptualization, J.G.-J., J.-J.T.-G. and J.R.-S.; methodology, J.G.-J., J.-J.T.-G. and J.R.-S.; software, J.G.-J., J.-J.T.-G. and J.R.-S.; validation, J.-J.T.-G. and J.R.-S.; formal analysis, J.G.-J., J.-J.T.-G. and J.R.-S.; investigation, J.G.-J., J.-J.T.-G. and J.R.-S.; resources, J.G.-J., J.-J.T.-G. and J.R.-S.; data curation, J.-J.T.-G. and J.R.-S.; writing—original draft preparation, J.G.-J., J.-J.T.-G. and J.R.-S.; writing—review and editing, J.G.-J., J.-J.T.-G. and J.R.-S.; project administration, J.-J.T.-G. and J.R.-S.; funding acquisition, J.-J.T.-G. and J.R.-S. All authors have read and agreed to the published version of the manuscript.
Funding
This work was co-funded by the Ministry of Economy and Knowledge of the Regional Government of Andalusia and the European Regional Development Fund (FEDER) under Grant number US-1263333, entitled “Diagnóstico del rendimiento educativo en educación primaria: un primer paso hacia la eficacia escolar” [Diagnosing educational performance in elementary education: a first step towards school effectiveness]. This grant was obtained in a competitive call of grants for R+D+I projects, corresponding to General Secretariat for Universities, Research and Technology, of the Andalusia FEDER Operational Programme 2014-2020. Call 2018. It has also been funded by the University of Seville’s 6th Research Plan (Spain).
Institutional Review Board Statement
Not applicable.
Informed Consent Statement
Not applicable.
Data Availability Statement
Not applicable.
Acknowledgments
FEDER/Ministry of Economy and Knowledge of the Regional Government of Andalusia and University of Seville.
Conflicts of Interest
The authors declare no conflict of interest.
Appendix A
Table A1.
Results of the multilevel model with significant variables (p < 0.00) of MR per course.
Table A1.
Results of the multilevel model with significant variables (p < 0.00) of MR per course.
| Parameters | 2011–2012 | 2012–2013 | 2013–2014 | 2014–2015 | 2016–2017 | |||||
|---|---|---|---|---|---|---|---|---|---|---|
| Estimation | SD | Estimation | SD | Estimation | SD | Estimation | SD | Estimation | SD | |
| Intercept | 424.84 | 9.77 | 418.71 | 9.21 | 294.89 | 31.75 | 402.54 | 20.8 | 290.68 | 23.13 |
| GenderN1 | 1.97 | 0.59 | 2.32 | 0.58 | 1.69 | 0.6 | 3.55 | 0.59 | 3.03 | 0.6 |
| ReadingPN1 | 0.86 | 0.06 | 0.46 | 0.07 | 0.48 | 0.11 | 0.73 | 0.11 | 0.51 | 0.12 |
| ESCSN1 | 20.2 | 0.38 | 21.28 | 0.37 | 18.55 | 0.38 | 15.94 | 0.38 | 15.32 | 0.39 |
| FamilyExpN1 | 4.89 | 0.12 | 4.91 | 0.12 | 5.17 | 0.12 | 5.07 | 0.12 | 4.71 | 0.12 |
| InvFamSchN1 | 0.86 | 0.09 | 1.1 | 0.09 | 0.48 | 0.1 | 0.34 | 0.09 | 0.81 | 0.1 |
| BedN1 | 2.49 | 0.43 | 2.52 | 0.41 | 2.89 | 0.42 | ||||
| ExtracurricularN1 | 4.89 | 0.37 | 5.34 | 0.35 | 5.35 | 0.37 | ||||
| ScreenN1 | 3.95 | 0.3 | 2.48 | 0.29 | 1.62 | 0.25 | ||||
| AmountHN1 | −3.18 | 0.54 | −2.57 | 0.49 | ||||||
| TimeHN1 | −14.1 | 0.37 | −16.5 | 0.37 | ||||||
| FamInvStuN1 | −0.92 | 0.17 | −0.98 | 0.16 | ||||||
| SubsidisedN2 | −7.33 | 2.65 | −11.32 | 2.61 | −10.04 | 2.51 | ||||
| BedN2 | 13.09 | 4.61 | ||||||||
| AmountHN2 | 27.39 | 6.27 | 26.97 | 5.82 | ||||||
| TimeHN2 | 23.1 | 3.27 | 17.03 | 3.22 | ||||||
| ReadingPN2 | 6.02 | 1.42 | ||||||||
| FamInvStuN2 | 6.2 | 1.82 | ||||||||
| FamilyExpN2 | 3.91 | 1.28 | 3.9 | 1.18 | 5.05 | 1.32 | ||||
| ScreenN2 | −15.09 | 3.58 | ||||||||
| SizeN2 | −0.25 | 0.06 | −0.19 | 0.05 | ||||||
Appendix B
Table A2.
Multilevel model results refined with significant variables (p < 0.00) of LC per course.
Table A2.
Multilevel model results refined with significant variables (p < 0.00) of LC per course.
| Parameters | 2011–2012 | 2012–2013 | 2013–2014 | 2014–2015 | 2016–2017 | |||||
|---|---|---|---|---|---|---|---|---|---|---|
| Estimation | SD | Estimation | SD | Estimation | SD | Estimation | SD | Estimation | SD | |
| Intercept | 333.89 | 12.08 | 372.51 | 8.07 | 367.64 | 25.34 | 364.96 | 21.41 | 256.86 | 23.7 |
| GenderN1 | 26.46 | 0.59 | 24.33 | 0.58 | 19.85 | 0.6 | 27.34 | 0.59 | 28.28 | 0.59 |
| ReadingPN1 | 0.84 | 0.06 | 0.58 | 0.11 | 0.86 | 0.11 | 0.7 | 0.12 | ||
| ESCSN1 | 20.61 | 0.38 | 23.19 | 0.36 | 1932 | 0.38 | 18.3 | 0.38 | 14.79 | 0.38 |
| FamilyExpN1 | 4.99 | 0.12 | 5.52 | 0.12 | 5.32 | 0.12 | 5.37 | 0.12 | 4.74 | 0.12 |
| InvFamSchN1 | 0.83 | 0.09 | 1.09 | 0.09 | 0.38 | 0.1 | 0.35 | 0.09 | 0.61 | 0.1 |
| BedN1 | 2.38 | 0.43 | 3.14 | 0.41 | 2.23 | 0.42 | ||||
| ExtracurricularN1 | 4.63 | 0.37 | 4.65 | 0.35 | 5.09 | 0.36 | ||||
| ScreenN1 | 3 | 0.3 | 2.15 | 0.29 | 0.94 | 0.25 | ||||
| AmountHN1 | −3.04 | 0.54 | −2.55 | 0.48 | ||||||
| TimeHN1 | −16.84 | 0.37 | −17.44 | 0.36 | ||||||
| FamInvStuN1 | −0.91 | 0.17 | −0.44 | 0.16 | ||||||
| SubsidisedN2 | −8.88 | 2.6 | −7.38 | 2.31 | −7.9 | 2.5 | −12.28 | 2.28 | −7.39 | 2.45 |
| ESCSN2 | 13.46 | 2.62 | ||||||||
| GenderN2 | −23.87 | 8.84 | ||||||||
| BedN2 | 14.61 | 4.75 | ||||||||
| AmountHN2 | 24.11 | 5.74 | 23.78 | 5.91 | ||||||
| TimeHN2 | 21.24 | 2.95 | 22.03 | 3.33 | ||||||
| ReadingPN2 | 5.89 | 1.7 | 4.49 | 1.64 | ||||||
| InvFamSchN2 | 2.94 | 0.98 | 2.78 | 0.77 | ||||||
| FamilyExpN2 | 8.81 | 1.22 | 8.31 | 1.03 | 5.23 | 1.32 | 5.99 | 1.12 | ||
| ScreenN2 | −9.78 | 3.66 | −14.06 | 3.34 | ||||||
| SizeN2 | −0.12 | 0.05 | ||||||||
References
- OECD. Synergies for Better Learning; OECD Reviews of Evaluation and Assessment in Education; OECD: Paris, France, 2013; ISBN 9789264190641. [Google Scholar]
- Ferrão, M.E. School Effectiveness Research Findings in the Portuguese Speaking Countries: Brazil and Portugal. Educ. Res. Policy Pract. 2014, 13, 3–24. [Google Scholar] [CrossRef]
- Kauko, J.; Centeno, V.G.; Candido, H.; Shiroma, E.; Klutas, A. The Emergence of Quality Assessment in Brazilian Basic Education. Eur. Educ. Res. J. 2016, 15, 558–579. [Google Scholar] [CrossRef]
- Kuhl, P.K.; Lim, S.-S.; Guerriero, S.; van Damme, D. How the Science of Learning Is Changing Science Assessment. In Developing Minds in the Digital Age: Towards a Science of Learning for 21st Century Education; Educational Research and Innovation; OECD: Paris, France, 2019; pp. 197–210. [Google Scholar]
- Kyriakides, L.; Creemers, B.P.M.; Charalambous, E. Searching for Differential Teacher and School Effectiveness in Terms of Student Socioeconomic Status and Gender: Implications for Promoting Equity. Sch. Eff. Sch. Improv. 2019, 30, 286–308. [Google Scholar] [CrossRef]
- Scheerens, J. Educational Effectiveness and Ineffectiveness: A Critical Review of the Knowledge Base; Springer Publishing: New York, NY, USA, 2015. [Google Scholar]
- Scheerens, J. Theories on Educational Effectiveness and Ineffectiveness. Sch. Eff. Sch. Improv. 2015, 26, 259–289. [Google Scholar] [CrossRef]
- García-Jiménez, J.; Rodríguez-Santero, J.; Torres-Gordillo, J.J. Influence of Contextual Variables on Educational Performance: A Study Using Hierarchical Segmentation Trees. Sustainability 2020, 12, 9933. [Google Scholar] [CrossRef]
- García-Jiménez, J.; Torres-Gordillo, J.J.; Rodríguez-Santero, J. What Is Published in Impact Journals on School Effectiveness? A Systematic Review of Research Results and Methods. Pedagogika 2020, 138, 5–24. [Google Scholar] [CrossRef]
- Childs, J.; Russell, J.L. Improving Low-Achieving Schools: Building State Capacity to Support School Improvement Through Race to the Top. Urban Educ. 2017, 52, 236–266. [Google Scholar] [CrossRef]
- Martínez-Rizo, F.; Silva-Guerrero, J.E. Impact of Large-Scale Assessment on Mexico’s Education Policies. Res. Pap. Educ. 2016, 31, 556–566. [Google Scholar] [CrossRef]
- Cordero, J.M.; Manchón, C. Explanatory Factors for Achievement in Primary Education: An Analysis Using TIMSS 2011. Estud. sobre Educ. 2014, 27, 9–35. [Google Scholar] [CrossRef]
- Feldhoff, T.; Radisch, F.; Bischof, L.M. Designs and Methods in School Improvement Research: A Systematic Review. J. Educ. Adm. 2016, 54, 209–240. [Google Scholar] [CrossRef]
- Gamazo, A.; Martínez-Abad, F.; Olmos-Migueláñez, S.; Rodríguez-Conde, M.J. Assessment of factors related to school effectiveness in PISA 2015. A multilevel analysis. Rev. Educ. 2017, 2017, 56–84. [Google Scholar] [CrossRef]
- Jennings, J.L.; Deming, D.; Jencks, C.; Lopuch, M.; Schueler, B.E. Do Differences in School Quality Matter More than We Thought? New Evidence on Educational Opportunity in the Twenty-First Century. Sociol. Educ. 2015, 88, 56–82. [Google Scholar] [CrossRef]
- Lizasoain, L. Criteria and statistical models of school effectiveness. Rev. Investig. Educ. 2020, 38, 311–327. [Google Scholar] [CrossRef]
- Reynolds, D.; Sammons, P.; Fraine, B.; van Damme, J.; Townsend, T.; Teddlie, C.; Stringfield, S. Educational Effectiveness Research (EER): A State-of-the-Art Review. Sch. Eff. Sch. Improv. 2014, 5, 197–230. [Google Scholar] [CrossRef]
- OCDE. La Medición Del Aprendizaje de Los Alumnos [Measuring Improvements in Learning Outcomes]; OECD: Paris, France, 2011; ISBN 9789264090163. [Google Scholar]
- Costa, P.; Araújo, L. Skilled Students and Effective Schools: Reading Achievement in Denmark, Sweden, and France. Scand. J. Educ. Res. 2018, 62, 850–864. [Google Scholar] [CrossRef]
- OECD. Equity in Education; PISA; OECD: Paris, France, 2018; ISBN 9789264056732. [Google Scholar]
- OECD. PISA 2015 Results; PISA; OECD: Paris, France, 2016; Volume I, ISBN 9789264267329. [Google Scholar]
- Arya, D.J.; McClung, N.A.; Katznelson, N.; Scott, L. Language Ideologies and Literacy Achievement: Six Multilingual Countries and Two International Assessments. Int. J. Multiling. 2016, 13, 40–60. [Google Scholar] [CrossRef]
- Tsai, S.L.; Smith, M.L.; Hauser, R.M. Families, Schools, and Student Achievement Inequality: A Multilevel MIMIC Model Approach. Sociol. Educ. 2017, 90, 64–88. [Google Scholar] [CrossRef]
- Gil-Flores, J.; Torres-Gordillo, J.J.; Perera-Rodríguez, V.H. The Role of Online Reader Experience in Explaining Students’ Performance in Digital Reading. Comput. Educ. 2012, 59, 653–660. [Google Scholar] [CrossRef]
- Joaristi, L.; Lizasoain, L.; Azpillaga, V. Detection and Characterization of Highly Effective Schools in the Autonomous Community of the Basque Country Using Contextualized Cross-Sectional Attainment Models and Hierarchical Linear Models. Estud. Sobre Educ. 2014, 27, 37–61. [Google Scholar] [CrossRef][Green Version]
- Karakolidis, A.; Pitsia, V.; Emvalotis, A. Examining Students’ Achievement in Mathematics: A Multilevel Analysis of the Programme for International Student Assessment (PISA) 2012 Data for Greece. Int. J. Educ. Res. 2016, 79, 106–115. [Google Scholar] [CrossRef]
- Lizasoain, L.; Bereziartua, J.; Bartau, I. Inservice teacher education in highly effective schools. Bordon 2016, 68, 199–218. [Google Scholar] [CrossRef]
- Murillo, F.J.; Martínez-Garrido, C.; Hidalgo-Farran, N. The Impact of the Evaluation Methodology of the Primary Education Teachers on the Performance of the Student in Spain. Estud. Sobre Educ. 2014, 27, 91–113. [Google Scholar] [CrossRef][Green Version]
- Nagy, G.; Nagengast, B.; Frey, A.; Becker, M.; Rose, N. A Multilevel Study of Position Effects in PISA Achievement Tests: Student- and School-Level Predictors in the German Tracked School System. Assess. Educ. 2019, 26, 422–443. [Google Scholar] [CrossRef]
- Ning, B.; van Damme, J.; van den Noortgate, W.; Yang, X.; Gielen, S. The Influence of Classroom Disciplinary Climate of Schools on Reading Achievement: A Cross-Country Comparative Study. Sch. Eff. Sch. Improv. 2015, 26, 586–611. [Google Scholar] [CrossRef]
- Perera, L.D.H. Parents’ Attitudes Towards Science and Their Children’s Science Achievement. Int. J. Sci. Educ. 2014, 36, 3021–3041. [Google Scholar] [CrossRef]
- Scharenberg, K.; Rollett, W.; Bos, W. Do Differences in Classroom Composition Provide Unequal Opportunities for Academic Learning and Social Participation of SEN Students in Inclusive Classes in Primary School? Sch. Eff. Sch. Improv. 2019, 30, 309–327. [Google Scholar] [CrossRef]
- Sortkær, B.; Reimer, D. Classroom Disciplinary Climate of Schools and Gender–Evidence from the Nordic Countries. Sch. Eff. Sch. Improv. 2018, 29, 511–528. [Google Scholar] [CrossRef]
- Sulis, I.; Porcu, M. Assessing Divergences in Mathematics and Reading Achievement in Italian Primary Schools: A Proposal of Adjusted Indicators of School Effectiveness. Soc. Indic. Res. 2015, 122, 607–634. [Google Scholar] [CrossRef]
- Tourón, J.; Navarro-Asencio, E.; Lizasoain, L.; López-González, E.; García-San Pedro, M.J. How Teachers’ Practices and Students’ Attitudes towards Technology Affect Mathematics Achievement: Results and Insights from PISA 2012. Res. Pap. Educ. 2019, 34, 263–275. [Google Scholar] [CrossRef]
- van Hek, M.; Kraaykamp, G.; Pelzer, B. Do Schools Affect Girls’ and Boys’ Reading Performance Differently? A Multilevel Study on the Gendered Effects of School Resources and School Practices. Sch. Eff. Sch. Improv. 2018, 29, 1–21. [Google Scholar] [CrossRef]
- Wei, D. Parental Influence on Chinese Students’ Achievement: A Social Capital Perspective. Asia Pac. J. Educ. 2012, 32, 153–166. [Google Scholar] [CrossRef]
- Wu, H.; Gao, X.; Shen, J. Principal Leadership Effects on Student Achievement: A Multilevel Analysis Using Programme for International Student Assessment 2015 Data. Educ. Stud. 2020, 46, 316–336. [Google Scholar] [CrossRef]
- Troncoso, P.; Pampaka, M.; Olsen, W. Beyond Traditional School Value-Added Models: A Multilevel Analysis of Complex School Effects in Chile. Sch. Eff. Sch. Improv. 2016, 27, 293–314. [Google Scholar] [CrossRef]
- Yang, G.; Badri, M.; al Rashedi, A.; Almazroui, K.; Qalyoubi, R.; Nai, P. The Effects of Classroom and School Environments on Student Engagement: The Case of High School Students in Abu Dhabi Public Schools. Compare 2017, 47, 223–239. [Google Scholar] [CrossRef]
- Evans, M.D.R.; Kelley, J.; Sikora, J. Scholarly Culture and Academic Performance in 42 Nations. Soc. Forces 2014, 92, 1573–1605. [Google Scholar] [CrossRef]
- Gil Flores, J. Measuring primary school students’ family socioeconomic status. Rev. Educ. 2013, 362, 298–322. [Google Scholar] [CrossRef]
- Willms, J.D.; Tramonte, L. The Measurement and Use of Socioeconomic Status in Educational Research. In The SAGE Handbook of Comparative Studies in Education; SAGE Publications: London, UK, 2019. [Google Scholar]
- Mahuteau, S.; Mavromaras, K. An Analysis of the Impact of Socio-Economic Disadvantage and School Quality on the Probability of School Dropout. Educ. Econ. 2014, 22, 389–411. [Google Scholar] [CrossRef]
- Schmidt, W.H.; Burroughs, N.A.; Zoido, P.; Houang, R.T. The Role of Schooling in Perpetuating Educational Inequality: An International Perspective. Educ. Res. 2015, 44, 371–386. [Google Scholar] [CrossRef]
- Heck, R.H.; Reid, T. Using Multilevel Regression to Examine Hierarchical Data: Investigating Differences in Reading Performance between Immigrant and Native-Born Children. Cult. Educ. 2017, 29, 619–665. [Google Scholar] [CrossRef]
- Martínez-Abad, F.; Lizasoain, L.; Castro-Morera, M.; Joaristi, L.M. Selection of High and Low-Effectiveness Schools in Baja California (Mexico). Rev. Electron. Investig. Educ. 2017, 19, 38–53. [Google Scholar] [CrossRef][Green Version]
- Muñoz-Chereau, B. Exploring Gender Gap and School Differential Effects in Mathematics in Chilean Primary Schools. Sch. Eff. Sch. Improv. 2019, 30, 83–103. [Google Scholar] [CrossRef]
- Giambona, F.; Porcu, M. School Size and Students’ Achievement. Empirical Evidences from PISA Survey Data. Socio-Econ. Plan. Sci. 2018, 64, 66–77. [Google Scholar] [CrossRef]
- Muñoz-Chereau, B.; Thomas, S.M. Educational Effectiveness in Chilean Secondary Education: Comparing Different ‘Value Added’ Approaches to Evaluate Schools. Assess. Educ. 2016, 23, 26–52. [Google Scholar] [CrossRef]
- Özdemir, C. Equity in the Turkish Education System: A Multilevel Analysis of Social Background Influences on the Mathematics Performance of 15-Year-Old Students. Eur. Educ. Res. J. 2016, 15, 193–217. [Google Scholar] [CrossRef]
- Gentrup, S.; Rjosk, C. Pygmalion and the Gender Gap: Do Teacher Expectations Contribute to Differences in Achievement between Boys and Girls at the Beginning of Schooling? Educ. Res. Eval. 2018, 24, 295–323. [Google Scholar] [CrossRef]
- Mohammadpour, E.; Shekarchizadeh, A. Mathematics Achievement in High- and Low-Achieving Secondary Schools. Educ. Psychol. 2015, 35, 689–713. [Google Scholar] [CrossRef]
- OECD. Educational Opportunity for All: Overcoming Inequality throughout the Life Course; Educational Research and Innovation; OECD: Paris, France, 2017; ISBN 9789264287440. [Google Scholar]
- Hofman, R.H.; Hofman, W.A.; Gray, J.M. Three Conjectures about School Effectiveness: An Exploratory Study. Cogent Educ. 2015, 2, 1006977. [Google Scholar] [CrossRef]
- OECD. PISA 2015 Results; PISA; OECD: Paris, France, 2016; Volume II, ISBN 9789264267497. [Google Scholar]
- OECD. Low-Performing Students; PISA; OECD: Paris, France, 2016; ISBN 9789264250239. [Google Scholar]
- Spybrook, J.; Westine, C.D.; Taylor, J.A. Design Parameters for Impact Research in Science Education. AERA Open 2016, 2, 1–15. [Google Scholar] [CrossRef]
- Murillo, F.J.; Martínez-Garrido, C. Profiles of school segregation by socioeconomic status in Spain and its Autonomous Communities. RELIEVE Rev. Electron. Investig. Eval. Educ. 2019, 25, 1–20. [Google Scholar] [CrossRef]
- OECD. Balancing School Choice and Equity; PISA; OECD: Paris, France, 2019; Volume I, ISBN 9789264695719. [Google Scholar]
- Egalite, A.J.; Kisida, B. School Size and Student Achievement: A Longitudinal Analysis. Sch. Eff. Sch. Improv. 2016, 27, 406–417. [Google Scholar] [CrossRef]
- Li, W.; Konstantopoulos, S. Does Class-Size Reduction Close the Achievement Gap? Evidence from TIMSS 2011. Sch. Eff. Sch. Improv. 2017, 28, 292–313. [Google Scholar] [CrossRef]
- Kyriakides, L.; Georgiou, M.P.; Creemers, B.P.M.; Panayiotou, A.; Reynolds, D. The Impact of National Educational Policies on Student Achievement: A European Study. Sch. Eff. Sch. Improv. 2018, 29, 171–203. [Google Scholar] [CrossRef]
- Azpillaga, V.; Intxausti, N.; Joaristi, L. Family involvement in highly efficient schools in the Basque Country. Bordon 2014, 66, 27–38. [Google Scholar] [CrossRef]
- Intxausti, N.; Etxeberria, F.; Bartau, I. Effective and Inclusive Schools? Attention to Diversity in Highly Effective Schools in the Autonomous Region of the Basque Country. Int. J. Incl. Educ. 2017, 21, 14–30. [Google Scholar] [CrossRef]
- Day, C.; Gu, Q.; Sammons, P. The Impact of Leadership on Student Outcomes: How Successful School Leaders Use Transformational and Instructional Strategies to Make a Difference. Educ. Adm. Q. 2016, 52, 221–258. [Google Scholar] [CrossRef]
- Prasertcharoensuk, T.; Tang, K.N. The Effect of Strategic Leadership Factors of Administrators on School Effectiveness under the Office of Maha Sarakham Primary Educational Service Area 3. Kasetsart J. Soc. Sci. 2017, 38, 316–323. [Google Scholar] [CrossRef]
- Tichnor-Wagner, A.; Harrison, C.; Cohen-Vogel, L. Cultures of Learning in Effective High Schools. Educ. Adm. Q. 2016, 52, 602–642. [Google Scholar] [CrossRef]
- Rutledge, S.A.; Cohen-Vogel, L.; Osborne-Lampkin, L.; Roberts, R.L. Understanding Effective High Schools: Evidence for Personalization for Academic and Social Emotional Learning. Am. Educ. Res. J. 2015, 52, 1060–1092. [Google Scholar] [CrossRef]
- Valenzuela, J.P.; Bellei, C.; Allende, C. Measuring Systematic Long-Term Trajectories of School Effectiveness Improvement. Sch. Eff. Sch. Improv. 2016, 27, 473–491. [Google Scholar] [CrossRef]
- INE. Cifras de Población (CP) A 1 de Enero de 2020; INE: Madrid, Spain, 2020; Volume 981, Available online: https://www.ine.es/prensa/cp_e2020_p.pdf (accessed on 4 January 2022).
- OECD. PISA 2018 Results (Volume I): What Students Know and Can Do; PISA; OECD: Paris, France, 2019; Volume I, ISBN 9789264460386. [Google Scholar] [CrossRef]
- Gaviria Soto, J.L.; Morera, M.C. Modelos Jerárquicos Lineales [Linear Hierarchical Models]; La Muralla: Madrid, Spain, 2005; Volume 29. [Google Scholar]
- Raudenbush, S.W.; Bryk, A.S. Hierarchical Linear Models: Applications and Data Analysis Methods; SAGE Publications: Thousand Oaks, CA, USA, 2002. [Google Scholar]
- Lee, V.E. Using Hierarchical Linear Modeling to Study Social Contexts: The Case of School Effects. Educ. Psychol. 2000, 35, 125–141. [Google Scholar] [CrossRef]
- López-González, E.; Navarro-Asencio, E.; García-San Pedro, M.J.; Lizasoain, L.; Tourón, J. A Study of school effectiveness in Primary Schools using Hierarchical Linear Models. Bordón 2021, 73, 59–80. [Google Scholar] [CrossRef]
- Lenhard, W.; Lenhard, A. Computation on Effect Sizes. Psychometrica 2016. [Google Scholar] [CrossRef]
- Bonal, X.; González, S. The Impact of Lockdown on the Learning Gap: Family and School Divisions in Times of Crisis. Int. Rev. Educ. 2020, 66, 635–655. [Google Scholar] [CrossRef]
- Dempsey, S.; Lyons, S.; McCoy, S. Later Is Better: Mobile Phone Ownership and Child Academic Development, Evidence from a Longitudinal Study. Econ. Innov. New Technol. 2019, 28, 798–815. [Google Scholar] [CrossRef]
- Gómez-Gonzalvo, F.; Devís-Devís, J.; Molina-Alventosa, P. Video game usage time in adolescents’ academic performance. Comunicar 2020, 28, 89–99. [Google Scholar] [CrossRef]
- Madigan, S.; Browne, D.; Racine, N.; Mori, C.; Tough, S. Association between Screen Time and Children’s Performance on a Developmental Screening Test. JAMA Pediatr. 2019, 173, 244–250. [Google Scholar] [CrossRef]
- Camerini, A.L.; Schulz, P.J.; Jeannet, A.M. The Social Inequalities of Internet Access, Its Use, and the Impact on Children’s Academic Performance: Evidence from a Longitudinal Study in Switzerland. New Media Soc. 2017, 20, 2489–2508. [Google Scholar] [CrossRef]
- Gutiérrez-Ruiz, G.; Chaparro-Caso, A.; Azpillaga, B. School organization as a variable associated with educational achievement. Innov. Educ. 2017, 17, 41–59. [Google Scholar]
Publisher’s Note: MDPI stays neutral with regard to jurisdictional claims in published maps and institutional affiliations. |
© 2022 by the authors. Licensee MDPI, Basel, Switzerland. This article is an open access article distributed under the terms and conditions of the Creative Commons Attribution (CC BY) license (https://creativecommons.org/licenses/by/4.0/).