Abstract
Solid circulation rate (Gs) represents the mass flux of circulating particles in circulating fluidized bed (CFB) systems and is a significant parameter for the design and operation of CFB reactors. Many measuring technologies for Gs have been proposed, though few of them can be applied in industrial units. This paper presents a comprehensive study on measuring technologies, and the results indicate that though the accumulation method is most widely applied, it is constrained by the disturbance of normal particle circulation. Some publications have proposed mathematic models based on pressure drop or other parameters to establish Gs measurement models; these necessitate the accurate modeling of complicated gas-solid flows in industrial devices. Methods based on certain measurement devices to specify parameters like velocity require device endurance in the industrial operation environment and stable local gas-solid flow. The Gs measuring technologies are strongly influenced by local gas-solid flow states, and the packed bed flow in standpipes make the bottom of standpipes an ideal place to realize Gs measurement.
1. Introduction
Circulating fluidized bed (CFB) systems have been widely applied in the fields of energy, chemical engineering, metallurgy, etc. As a type of complex industrial equipment, many parameters will influence the design and operation of CFBs, including the solid circulation rate (Gs). The solid circulation rate for CFB represents the mass flux of circulating bed materials (kg/(m2∙s)) and has a different meaning for various CFB equipment.
For a CFB boiler, the solid circulation rate is the ash circulation rate, which is an important design parameter, and along with gas velocity determines the fluidization state in the CFB boiler [1]. The gas-solid flow in furnaces of CFB boilers can reach a fast fluidization state only if the circulation rate exceeds the saturated carrying capacity, and different values of solid circulation rate represent different flow states of fast beds [2]. Meanwhile, the ash circulation rate determines the heat transfer capacity of external heat exchangers [3]. During the development process of CFB boilers, higher parameters and higher capacity are used. Thus, CFB boilers with multi-cyclone design are more common, and the deviation of solid flux among different cyclone loops will threaten the safe operation of the boiler [4]. The ash circulation rate in different cyclone loops can quantitatively characterize flow deviation to provide a criterion for design improvement.
For chemical looping combustion (CLC) systems, the solid circulation rate determines the transportation of metal oxide particles, energy transfer between two reactors and the solid inventory of CLC systems [5]. The accurate measurement of the solid circulation rate has become a key problem during the development of CLC systems [6]. For a dual fluidized bed (DFB) system, which is widely applied in the gasification field, the solid circulation rate will strongly influence the mass and energy balances of both the individual fluidized bed reactor and the whole system [7].
As mentioned above, the solid circulation rate is a key parameter for all kinds of CFB equipment and will strongly influence the design and operation. Therefore, scholars have developed various measuring technologies for the solid circulation rate in CFBs; however, few of them can be applied in industrial equipment [8,9].
In this paper, the measuring technologies for CFB solid circulation rate, focusing on the measuring principle and the limitations of its application in industrial equipment, are reviewed. An understanding of future perspectives of measuring technology and some areas of future research are also presented.
2. The Most Widely Applied Way—The Accumulation Method
The method of accumulation is to suddenly stop particles flowing through some part of CFBs and measure the following accumulation velocity of bed material to calculate the solid circulation rate. This method is the most basic and easiest way to measure the solid circulation rate because it can directly measure the solid mass flux and is easy to operate; thus, it has been widely applied in cold flow model experiments. Usually, certain new proposed measuring technology or a method needing parameter fitting is calibrated by this method [10,11].
There are many ways to shut off particle circulation, and a common one is to arrange a porous valve or butterfly valve in a standpipe and close it suddenly [12]. With the valve closed, the circulating bed material will accumulate above it, and the solid circulation rate can be calculated using the solid accumulating height and time needed (as shown in Figure 1).
where is the bulk density of the bed material (kg/m3), is the reference accumulating height (m) and is the time for the bed material to reach (s). In addition to methods for mechanical valves, cutting off the fluidizing air in the loop seal abruptly can also achieve particle accumulation [13].
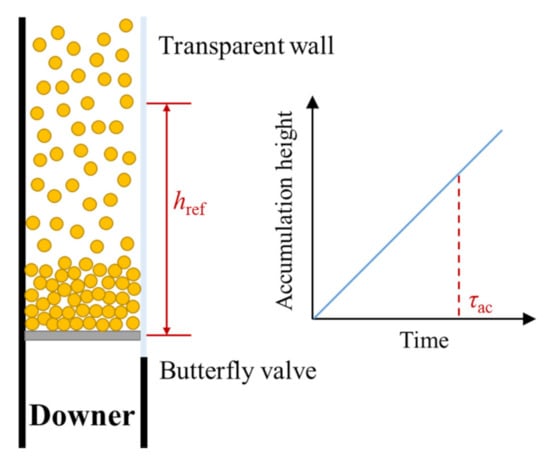
Figure 1.
Schematic diagram of accumulation method.
However, this method will disturb normal solid circulation in CFB loops and needs direct observation of the accumulation height, which is only possible with a transparent wall. The former shortcoming is inherent, but the latter one can be addressed.
Karlsson et al. [14] applied a pneumatically controlled butterfly valve to fluidize the solids column formed on the valve when the valve is closed. Through a pressure transducer to monitor the increase of pressure drop after the valve is closed, Equation (1) can be rewritten as
where psp is the pressure of the standpipe (Pa), and is pressure change rate (Pa/s). This method changes information of accumulation height to information of pressure drop through fluidization and avoids direct observation of the accumulation height. Similarly, Göransson et al. [15] used pressure measurement to avoid direct observation. In their experiment, two pressure transducers connected to purge gas nozzles were set on top of the recycle valve. When fluidization air from the recycle valve is turned off and bed materials accumulate in the standpipe, the pressure transducers can capture the dynamic pressure when the solids reach them, and the time delay of pressure changes between the two transducers represents accumulation time . The distance between the two transducers is href, and the solid circulation rate can be calculated by Equation (1). Rahman et al. [8] applied a similar method, but pressure transducers were substituted by capacitance sensors, which can measure local solids concentration. In Fuchs’s [16] experiment with a metallic test plant, the fluidization of the loop seal was turned off abruptly, and the air of the riser was also turned off 30 s later. A vacuum cleaner was placed in the standpipe to collect the bed material stacking in the standpipe. The collected mass divided by 30 s is viewed as the circulation rate. This method is based on the assumption that the filling height of the bed material in the standpipe is stable, and measuring position is set at this height; the change in filling height of the standpipe during operation will strongly affect the measuring accuracy.
Another way to stop particle flow is to lead it into the bypass channel. This is done by placing a switch valve at the standpipe top and switching the particle flow to a bypass collecting chamber suddenly [17]. The accumulation rate in the bypass chamber can represent Gs. It has also been shown practical to install two windows with a hole in the riser to transfer particles from the riser to nearby columns [18]. In these two methods, the particle accumulation rate in the bypass chamber is captured simply through the visualization method.
As mentioned above, this accumulation method can predict the solid circulation rate in all kinds of environments, whereas the problem of this method strongly affecting the steady operation of systems make it limited in cold flow experiments. Therefore, scholars have sought an alternative method that is applicable in industrial equipment.
3. Mathematical Modelling Methods
Except for the accumulation method, the measuring method for the solid circulation rate can be divided in two main types: methods establishing a mathematical calculation model of Gs and methods applying specific instruments for measurement. For the method of mathematical modelling, scholars prefer to use operating parameters like pressure drop to establish mathematical correlation because they are easy to obtain. For most of these methods, pressure drop is considered the main parameter; the methods differ only in the part selected for the pressure drop measurement. In addition, few mathematical models have been proposed.
3.1. Correlations Based on Pressure Drop of Riser
The correlation formula based on the pressure drop of the top zone of a riser is widely applied in CFB boilers and CLC systems. In this method, circulation rate Gs can be represented by Equation (3):
where ρm is the density of the gas-solid mixture (kg/m3) and vp is the average velocity of the solid particle (m/s). Through Equation (3), measurement of the solid circulation rate is split into calculation of density and velocity. The principle of applying pressure drop on the top zone of the riser to estimate ρm is to ignore other pressure drops and only consider gravity pressure drop. Thus, ρm can be calculated by Equation (4):
where Δpr is the pressure drop of the top zone of the riser (Pa) and Δhr is the vertical distance of two pressure transducers (m).
The estimation of solid velocity in the riser (vpr) is usually based on gas velocity and particle properties. The simplest way is to assume that the flow state in the top zone of the riser is pneumatic conveying, and thus velocity can be obtained by
where vgr is the superficial gas velocity of the riser (m/s), which is calculated by measuring the mass of the gas rate into the riser, and vt is the terminal velocity of solid particles (m/s), which can be predicted by Equation (6) [19]:
where ρp, dp are the density and average diameter of solid particles (kg/m3, m), ρf, μ are the density and viscosity of the fluid (kg/m3, Pa∙s) and Ret is the Reynolds number of the particle in terminal velocity. Combined with Equations (3)–(5), the solid circulation rate can be represented Equation (7):
This method is usually applied in the estimation of the ash circulation rate for CFB boilers because of its simplicity. Sun et al. [20] applied this method to estimate the ash circulation rate of Baima’s 600 MW supercritical CFB boiler under 60% load, with a simpler assumption that particle velocity vpr is directly equal to gas velocity vgr.
However, this assumption limits the accuracy of this method. The main reason causing the deviation is that the flow state of the top gas-solid flow in the riser is complicated, and for CFB boilers, it is a fast bed flow state [21]. Therefore, for the fast bed flow state, solid velocity cannot be calculated by Equation (5). The core-annulus flow structure in the CFB boiler riser (as shown in Figure 2) will also cause the deviation from Equation (5). Concerning these deviations, some published works have proposed revised correlations.
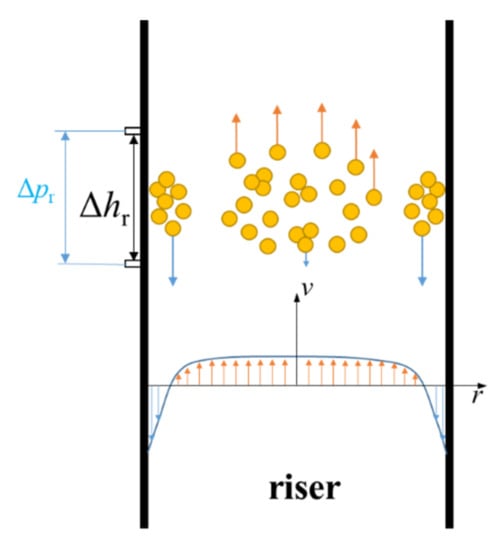
Figure 2.
Schematic diagram of core-annulus flow in riser.
Some scholars have proposed a theoretical revision based on a more detailed consideration of the gas-solid flow. Medrano et al. [18] added frictional pressure drop in the momentum equation (Equation (4)) and also revised Equation (5) by substituting vt with vt(1 − φpr)n−1, where φpr is the particle volume fraction in the riser and n is an empirical factor. The influence of non-spherical particles was also considered in the calculation of dp and vt. In the interconnected fluidized bed, the flow state in the riser is pneumatic conveying, so no revision of the flow state of fast bed will lead to deviation. Alghamdi et al. [22] revised the influence of the core-annulus flow by considering that there is solid flux distribution in cross-section, and only some of the particles flow upward. A semi-empirical model developed by Rhodes et al. [23] was applied to evaluate solid flux distribution.
where r is the radial distance from the riser axis (m), R is the riser radius (m) and a1, b1, c1 are coefficients proposed by Rhodes [23]. Through the integral of Equation (8), the revision coefficient can be obtained to revise Gs as calculated by Equation (7).
Stollhof et al. [24] researched Gs in four different fluidized bed systems, including two cold flow models and two pilot plants, and they found the exit configuration of the riser will influence the accuracy of this formula, because the rebounded particles from the exit will affect the pressure drop of the top of the riser. For risers with abrupt exit configurations (like L-shape exits), they applied an exit Froude number FrR [25] to revise the particle velocity vp.
In addition to theoretical revisions, some scholars have chosen to revise the above relation by experimental fitting. Markström and Lyngfelt [11] applied an empirical coefficient k to consider deviations. They established a lab-scale cold test rig, scaled down from a 100 kW chemical-looping combustor, and proposed an empirical formula that simply multiplies Equation (7) by factor k:
However, this empirical coefficient is limited to experimental conditions of the test rig. In their follow-up research on 100 kW chemical-looping combustors [26], a different correlation formula was obtained through the same experiment fitting process.
where Gs,cal is the solid circulation rate calculated by Equation (7) (kg/(m2∙s)) and k1 and k2 are the new empirical coefficients for the 100 kW combustor. Other researchers have shown that factor k is different in single particle systems and binary mixture systems [27], which also indicates its limitation.
3.2. Correlations Based on Pressure Drop of Other Places
Patience et al. [28] first proposed an empirical formula to predict Gs based on the pressure drop in horizontal sections between risers and cyclones. The principle of this method is to assume that the gas-solid flow in this horizontal section is fully a suspension flow, so the pressure drop, Δph, can be depicted by the momentum balance equation:
The first term on the right side is a simplified expression of frictional pressure drop, where fg, fp are the friction factors of the gas and particle phase, ΔLh is the horizontal distance of the two pressure transducers (m), Dh is the diameter of the horizontal section (m) and vgh is the superficial gas velocity in the horizontal section (m/s). The other two terms on the right side are the acceleration pressure drops of the gas and particle phase, where vgh1, vgh2, vph2, vph2 are the superficial velocity of the gas and particle at the position of the two pressure transducers (m/s). With the assumption that the superficial velocity of the gas and particle phase is equal, Equation (11) can be simplified as
where a2, b2 and c2 are parameters derived from Equation (11). With this physical basis, experiment data were applied to fit the coefficient from Equation (12), and a different correlation was obtained with different materials of the horizontal section. This method still faces the problem of promotion. In Yang’s experiment [29], the pressure drop between the riser exit and the inlet of the cyclone was fitted to the solid circulation rate, and a different formula from Patience was obtained.
Monazam et al. [30] tried to use a dimensionless quantity for revising the formula. The authors showed a more detailed consideration of parameters in same momentum balance equation and proposed a formula associating dimensionless solid flux with the Euler number Eu:
where a3 and b3 are their fitting coefficients, based on experiment data.
This method is simple and can lead to online prediction of the circulation rate, but the gas-solid flow in the horizontal section is not a fully developed flow, which may cause deviation. In addition, this method needs pre-calibration, which is difficult for industrial equipment, and the fitting coefficient for the different test rig also limits promotion.
Pressure drop in the standpipe is also applied in the Gs prediction model. Huang et al. [31] predicted the solid circulation rate using the pressure drop in the bottom of the standpipe, based on the Ergun equation [32]:
where ΔLsp is the distance between the two pressure transducers in the standpipe (m), d is the particle diameter (m), ε is the voidage and vgsp and vpsp are the superficial velocities of the gas and particle phase in the standpipe (m/s). In Equation (15), the pressure drop is linked with voidage ε and gas-solid slide velocity vs (m/s). With the assumption that voidage can be expressed as a linear function of vs, and there is also a linear relation between the gas and particle velocity, the pressure drop is exclusively determined by particle velocity vpsp. Therefore, vpsp can be obtained from Equation (15). With density determined by voidage (Equation (17)), the solid circulation rate can be calculated by Equation (3).
In this method, the relation between voidage and vpsp and the relation between vgsp and vpsp are assumed to be linear, through analysis of the experimental data; however, this lacks a physical basis.
There have also been attempts to apply the standard deviation of pressure fluctuations in an inclined standpipe [33] and the pressure drop between the riser inlet and top of the surrounding annular feeding mechanism [34] to predict the solid circulation rate. The differences between experimental models and common CFB systems make this less suitable.
3.3. Other Mathematical Correlations
Rahman et al. [35] proposed a Gs calculation method based on system mass and energy balance. They established mass and heat balance equations for a DFB system and estimated heat loss by two methods, including calculation based on a heat transfer model and direct measurement of the surface temperature. With the heat loss estimation and a detailed measurement of pressure, temperature, composition and flow rate of all input and output streams, the solid circulation rate can be calculated by the mass and energy balance of DFB systems and individual reactors. The accuracy of this method depends on the accuracy of the balance equations and parameter measurements. For their pilot experimental system, the chemical reactions occurring in reactor are very clear, and many measurement points are set to guarantee data accuracy. For large-scale industrial equipment, more complicated reactions, more uneven flow structures and fewer measurement points limit the accuracy of this method.
Some fitting methods have been proposed. Through analysis of the influence factors for solid circulation rate, Lim et al. [36] provided a dimensionless correlation, associating dimensionless solid circulation rate with Froude number, particle Reynolds number, the ratio of superficial gas velocity to particle terminal velocity and the ratio of particle density to gas density . The state space model has also been applied to predict Gs, and Park et al. [37] applied the Kalman filter algorithm to estimate the state of the standpipe, including solid circulation rate, with the input of air flow, riser aeration flow and riser total pressure drop. These two methods are strongly influenced by their training data and thus have limitations.
4. Methods Based on Device Measurement
In addition to establishing mathematical calculation models for solid circulation rate, there are methods that apply specific devices for direct measurement. Considering Gs is determined by the density and velocity of gas-solid flow (shown in Equation (3)), density is comparatively easy to estimate, especially for dense flow, while velocity is difficult to measure. Therefore, most of methods in this section involve direct measurement of gas-solid velocity and apply other ways to estimate density.
4.1. Tracer Methods
Tracer methods apply specific tracers into the gas-solid flow, assuming they have the same velocity as the bulk velocity.
Among the different kinds of tracers, the fluorescent tracer particle is commonly used. Kuramoto et al. [38] introduced micro-spherical particles covered with fluorescent dyes as tracers into the bed material of an inner circulating fluidized bed and applied two optical fiber probes to capture signals from the tracer. The gas-solid velocity can be assumed to be equal to the tracer velocity calculated by
where Δhtr is the distance between two transducers (m) and is the time-lag of the signals detected by the two fibers (s). The density is estimated from the bed density at minimum fluidization state, and thus the solid circulation rate can be calculated through Equation (3). In addition to fibers, a camera can also be used to measure velocity through detection of the trajectories of the fluorescent tracers [39]. However, the photographing method may face the problem that tracers are hidden by other bed material because of the 3D flow channel. To solve this problem, Mitrofanov et al. [40] applied a quasi-2D flow section to photograph the gas-solid flow to prevent the tracer from being hidden; however, this introduces a new problem of disturbance of the gas-solid flow of the whole system. The measurement section of these methods are in the dense phase of the bottom of the standpipe, and thus density is assumed to be that in the packed bed.
In addition to fluorescent tracer particles, there also are some examples of magnetic, radioactive or cold particles. For a magnetic tracer, a coil surrounding the tube is applied to detect the tracer [41]. For a cold tracer, thermocouples can detect temperature signals [9]. In this research, density is calculated through pressure drop gradient (Equation (4)) or assumed to be bulk density. For the radioactive tracer in Al-Dahhan’s research [42,43], detectors were arranged to detect the gamma rays emitted by tracers. The density measurement was based on measuring the light intensity attenuation of a beam of radiant light after passing through the dense phase area of the standpipe.
The tracer methods specified above are strongly influenced by the gas-solid flow state, and they can accurately predict particle velocity only in a stable and unidirectional flow. The back-mixing and lateral move of particles and tracers as created by different velocities due to velocity unevenness will affect the measuring accuracy. Meanwhile, many tracer detecting devices cannot endure high-temperature environments, which limits their application in industrial environments.
4.2. Optical Method
In addition to methods directly observing a tracer’s motion, there are some optical methods used to measure particle velocity. Matsuda [44] developed an optical mouse sensor to monitor local particle velocity, with the density assumed to be bulk density. This method can give a convincing result of local particle velocity but not average velocity, which depends on velocity distribution. In the method established by Yang et al. [45], the local density is measured along with velocity in an optical fiber probe, which makes it applicable in dilute phase areas. For industrial equipment, the velocity distribution becomes more uneven because of larger size, which leads to larger error. To overcome this problem, Sun et al. [20] arranged 3 × 5 measuring points in cross-section for fiber-optic probes to measure local velocity and particle concentration. Based on the mathematical form of the velocity and concentration field [46], the experimental data in cross-section can be applied to fit the relative equation, and the total circulation rate is particle density multiplied by the integral of the product of concentration times the velocity in cross-section.
Particle image velocimetry (PIV) is another kind of optical method. Medrano et al. [18] directly photographed particle motion without any tracer in a pseudo-2D internally circulating fluidized bed and applied cross-correlation methods to analyze the particle velocity field. As an improvement, Atxutegi et al. [47] applied a borescope in a spouted fluidized bed to directly measure particle velocity and did not need a 2D flow channel. Further, Xie et al. [48] applied it in CFB boiler, using optical imaging equipment in horizontal sections between the furnace and cyclone. In their research, flight trajectory could be captured by camera, and particle velocity could be calculated by image processing. The density depends on ash concentration, which is estimated using the mass balance in the boiler. Although this method did not apply a tracer, it could capture obvious photos of particle trajectory through in industrial tests. However, this method takes photos in a 3D channel, and it can only capture particles flowing in focal plane. The gas-solid flow in horizontal sections is not a plug flow, so the obtained velocity does not represent the average velocity in the flow channel.
The main factor constraining the optical method’s application in heated industrial equipment is that it can only capture flow in a plane, and thus it requires a 2D flow; the complicated gas-solid flow in large scale equipment cannot fulfill this requirement.
4.3. Impact Method
Any subject in a gas-solid flow channel will be impacted by particles. The impact force can be linked with particle impact velocity, which is the principle of the impact method. Ludlow et al. [49] developed a probe consisting of a pair of piezoelectric pressure transducers that produce a voltage spike when impacted by particles. This probe can measure local mass flux, with the assumption that the standard deviation of voltage outputs is proportional to the local solid flux. Twelve radial positions are set for different heights of risers to obtain the average solid circulation rate. Such probes can predict local solid flux, but it is difficult to measure velocity at so many different positions in industrial equipment. With few measuring points, the complicated core-annulus flow in risers will cause large deviations. Therefore, more scholars choose to arrange impact devices in the standpipe.
Heertjes et al. [50] proposed a particle velocity meter consisting of a needle arranged in the standpipe and the connected piezo-electric crystal to output a pulse signal for each collision between the needle and particle. The Gs calculation model assumes that the amplitude of the pulse is proportional to particle momentum and is applied to calculate vp, and a porosity meter is used to obtain local voidage to calculate density through Equation (17). This method correlates impact signal with particle momentum, but some methods directly correlate it with the solid circulation rate. Burkell et al. [12] arranged an inverted-V-shaped pan below the cyclone and proposed positive correlation between impact force and solid circulation rate. Through Kim’s research [51], impact pressure and Gs are quadratic, based on the momentum balance on the impact probe.
where F is the impact force on the target (N), At is the area of the target (m2) and ξ is the momentum transfer coefficient determined through experiment.
These impact methods can only capture certain point information, which may lead to deviation, and thus some scholars have changed part of the standpipe structure to make all the particles impact on a forced target to directly measure total mass flux (as shown in Figure 3). Different from Equation (19), there is a linear relation between impact force and solid circulation rate through conservation of the momentum of the forced plate [52]. This model is calibrated through feeding of a silo, but this result is further proven in CFB systems [53]. This impact method can capture impact information on all particles and thus can give a more convincing result, while the large change in the CFB structure makes it difficult to apply to industrial equipment.
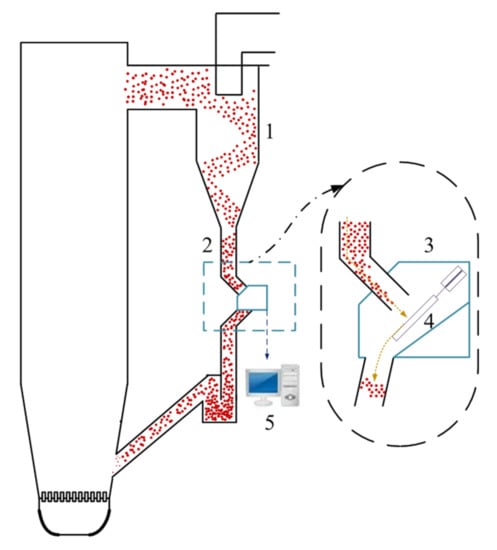
Figure 3.
The change in standpipe to make all particles impact the force target (1. Cyclone; 2. Standpipe; 3. Measurement box; 4. Force target; 5. Signal capture and treatment system).
There is another kind of impact element with rotation. Liu et al. [54] proposed a turbine with several blades and set it in the bottom of the standpipe. According to the force balance of turbine blades, the rotation rate is linked with solid velocity rather than solid circulation rate. The assumption that the gas-solid flow in the measurement position is dense plug flow is added to obtain density as bulk density. In contrast, Ludlow et al. [10] installed a vertically placed rotating spiral vane in the standpipe, and its rotation rate was similarly correlated with particle velocity. The density was estimated by Equation (17), where the voidage was between the value for a packed bed and a fluidized bed and was chosen as 0.47. The common shortcoming of these two methods is that the equipment needs to occupy a large part of the cross-section in order to measure the average velocity, thus affecting normal operation of the industrial equipment. If these instruments are scaled up for real industrial devices, it is unknown whether such large mechanical devices can endure the long-term erosion of high temperature particles as well as the jamming of rotation parts.
4.4. Other Measurment Equipment
In addition to the measurement equipment mentioned above, some publications have specified other technologies. Lu et al. [55] proposed a heat transfer method that fixed a set of water-cooling tubes in the standpipe of a CFB boiler and calculated ash mass flux by heat balance:
where cw and cash are the specific heat capacities of cooling water and circulating ash (J/kg∙K), Qw is mass flow rate of cooling water (kg/s), t1 and t2 are the inlet and outlet temperature of the water-cooling tube (s) and T1 and T2 are the ash temperatures above and below the tube (K). This method involves a set of tubes inside the standpipe, which affects normal ash circulation. Comparatively, Zhang et al.’s method [56] applying a cooling jacket outside the standpipe rather than cooling tubes inside the boiler can avoid disturbance of the solid flow. However, the core problem of this cooling method is heat loss. The flow rate of the cooling medium Qw has to be adequate to make the temperature difference of ash T1 − T2 large enough to measure, whereas the equipment has to be large enough to provide the cooling medium; the corresponding heat loss in CFB under this Qw is unsustainable.
Harris et al. [57] proposed a slot flow meter consisting of a hopper and some vertical slots on the side. This device was installed in the standpipe, and the hopper was fed with bed material continuously. Particles flowed out of hopper through the side slots, with the flow rate depending on the depth of the upstream particles. The hopper was mounted on a load cell to measure inventory. The inventory was measured, and outflow rate depended on inventory; therefore, the bed material inventory was uniquely determined by the upstream feed rate, i.e., solid circulation rate. However, this method is based on the correlation between outflow rate and particle packing height, which changes under different temperature conditions and particle properties. In addition, applying a load cell to measure the weight of the hopper in a heated industrial device is difficult.
5. Future Perspectives
Through the review of Gs measurement methods, the gas-solid flow state of the target measuring section is a key factor influencing measurement accuracy. For mathematic modeling methods, the establishment of the model relies on accurately describing the physical process in the target section. The complicated gas-solid flow structure will make establishment of equations difficult, and more empirical coefficients may also be added, which may limit their use. For the method of device measurement, most measuring devices measure local velocity and require a unidirectional, even and non-lateral velocity distribution to reduce measurement error. All the requirements above are strongly influenced by the gas-solid flow state.
Considering the importance of the local gas-solid flow state, a review of the flow state in CFBs was conducted to find the best place as a potential measuring section. The gas-solid flow state in the bottom of the riser is a bubbling fluidization state [58]. The formation and breakage of bubbles will cause the disorderly movement of particles, which makes it difficult for equation establishment and device measurement. The top of the riser, with a core-annulus flow structure, has characteristics of downward flow near the wall and particle back-mixing [2]. Many published works have proposed Gs measurement methods at the top of the riser, but these encounter obstacles when considering the influence of complicated gas-solid flow. The cyclone has a strong swirl flow and is thus difficult to use to establish a mathematic model; any insert equipment will strongly influence its flow field and separation efficiency, which makes it a poor choice for the measurement of solid circulation rate.
To understand the flow state in the standpipe, many scholars have proposed various methods. Jones and Leung [59] divided the gas-solid flow state in the standpipe into four types, characterized by gas-solid slide velocity and the ratio of minimum fluidization velocity to minimum fluidization voidage . The detailed characterization is listed in Table 1. In their research, the flow state in the standpipe is also strongly influenced by the geometric structure of the inlet and outlet parts.

Table 1.
Characterization of gas-solid flow state in standpipe.
For a full-loop CFB system, the gas-solid flow in the bottom of the standpipe is usually viewed as a packed bed flow or minimum fluidization state, which depends on the geometric structure and operation parameters. Scholars have defined the flow state of the standpipe as different states in their models or experiments (as listed in Table 2).
Table 2.
Flow state of standpipe defined in literatures’ model.
To clarify the flow state, Yao [65] conducted comprehensive work on the gas-solid flow in standpipes. Based on CO2 tracers and optical fibers, the gas flow direction was determined. The gas velocity was obtained through gas flux measurement, and particle velocity was obtained through the accumulation method. Thus, the gas-solid slide velocity could be quantitatively determined. Combined with measurement of the pressure gradient, the gas-solid flow state could be considered. It was found that the moving packed bed flow theory could well predict the experimental data, which also clarified the gas-solid flow state.
In such a packed bed flow in the standpipe, the gas-solid flow is unidirectional, and the particle volume fraction is nearly uniform [66], which avoids deviation from uneven particle distribution. The particle flow is unidirectional, and the velocity distribution is comparatively flat [67]. These flow structures [68,69] make it suitable not only for mathematical modeling but also for using local measured velocity as average velocity.
As seen in the literature review above, the packed bed flow in the bottom of the standpipe is a comparatively better measurement section. In this view, we have attempted to apply the impact method to achieve Gs measurement in the standpipe (shown in Figure 4). Through mechanical structure design, the fragile sensor can be arranged far from the industrial high temperature environment but can still detect the inner impact force through mechanical transmission. This structural design of measurement devices protects sensors to ensure long-term operation and flow state in the standpipe, ensuring measurement accuracy [69].
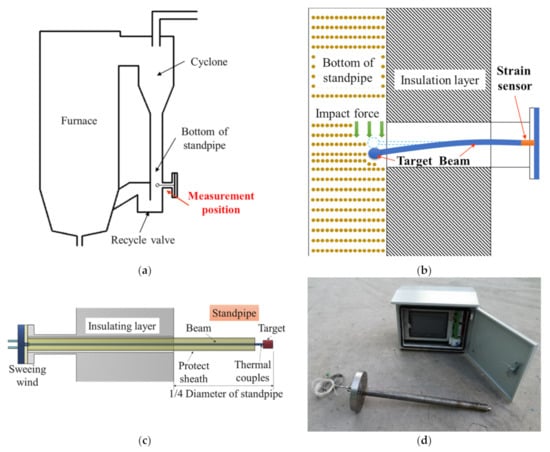
Figure 4.
Gs measurement system in an industrial CFB boiler; (a) Measurement position; (b) Measuring principle; (c) Diagram of measurement device; (d) Picture of read device.
6. Conclusions
For a CFB system, solid circulation rate Gs is a key parameter for the design and operation of CFB boilers, chemical looping combustors, dual fluidized bed systems, etc. However, there are few ways to measure Gs in industrial equipment among all existing measuring technologies.
The accumulation method cuts off particle circulation suddenly and measures the particle accumulation rate, which can be obtained by visualization or transducers detecting particle position. This method can directly measure the solid circulation rate, but the disturbance of normal circulation in the CFB systems limits its application in industrial equipment.
Mathematical models usually divide Gs calculation into separate calculations of gas-solid density and velocity. The models can be roughly divided into three categories. The first includes those based on the pressure drop in the top of the riser, where density is calculated using pressure drop, based on the assumption that the pressure drop is provided only by gravity pressure drop, and velocity is calculated using gas velocity and predicted gas-solid slide velocity. The deviation of the flow state from pneumatic conveying may lead to inaccuracy of the velocity calculation; this is the main direction area of revision for this method. The second group of models is based on pressure drop in other parts, including that in the horizontal section between riser and cyclone, and applies the momentum equation in the horizontal section to correlate pressure drop with Gs. The gas-solid flow in this section is not fully developed, which leads to deviation. In addition to methods based on pressure drop, there are some other mathematical models that include energy balance, limited by the difficulty in modeling on industrial equipment, and empirical dimensionless equations, limited by dependence on training data.
Methods using measurement devices usually arrange measuring subjects in positions with dense phase flow; these have the advantage of an easy estimation of density. Through a specific device, the local or average velocity can be obtained. The tracer method arranges fluorescent/magnetic/radioactive/cold tracers in the bed material and detects the tracer velocity to represent the bulk velocity; this is limited by the endurance of equipment at high temperatures. Optical methods usually apply optical fibers or PIV to obtain local velocity and are mainly constrained by high temperature and the requirement of a 2D flow. The impact method arranges a force target in the standpipe and transfers the force signal to the local mass flux; however, this may affect the gas-solid flow in the standpipe. Other measuring methods include the heat transfer method; however, the heat loss as a result of this method is quite large.
Accurate measurement of the solid circulation rate is strongly influenced by the local gas-solid flow state. As a general view on the gas-solid flow in CFB systems, the packed bed flow in the bottom of the standpipe is unidirectional and evenly distributed, which makes it an ideal measurement position.
Author Contributions
Conceptualization, G.Y.; Funding acquisition, Y.D.; Investigation, X.L.; Resources, S.Z.; Supervision, G.Y.; Writing—original draft, X.L.; Writing—review & editing, M.Z., Z.H., T.Z. and H.Y. All authors have read and agreed to the published version of the manuscript.
Funding
This research was funded by National Key Research Plan (2019YFE0102100); the Huaneng Group Science and Technology Research Project (HNKJ20-H50); and the Heilongjiang Key Transformation Project of Science and Technology Achievements (CG18A002).
Conflicts of Interest
The authors declare no conflict of interest.
References
- Yue, G.; Cai, R.; Lyu, J.; Zhang, H. From a CFB reactor to a CFB boiler—The review of R&D progress of CFB coal combustion technology in China. Powder Technol. 2017, 316, 18–28. [Google Scholar]
- Cai, R.; Zhang, H.; Zhang, M.; Yang, H.; Lyu, J.; Yue, G. Development and application of the design principle of fluidization state specification in CFB coal combustion. Fuel Process. Technol. 2018, 174, 41–52. [Google Scholar] [CrossRef]
- Li, D.; Cai, R.; Zhang, M.; Yang, H.; Choi, K.; Ahn, S.; Jeon, C. Operation characteristics of a bubbling fluidized bed heat exchanger with internal solid circulation for a 550-MWe ultra-supercritical CFB boiler. Energy 2020, 192, 116503. [Google Scholar] [CrossRef]
- Song, G.; Yang, Z.; Zhou, T.; Lyu, Q. Operating technical characteristics on asymmetrical arrangement of six cyclones in a 600 MW supercritical CFB boiler. Appl. Therm. Eng. 2018, 143, 236–247. [Google Scholar] [CrossRef]
- Song, H.; Shah, K.; Doroodchi, E.; Wall, T.; Moghtaderi, B. Reactivity of Al2O3- or SiO2-Supported Cu-Mn-, and Co-based oxygen carriers for chemical looping air separation. Energy Fuels 2014, 28, 1284–1294. [Google Scholar] [CrossRef]
- Peng, Z.; Doroodchi, E.; Alghamdi, Y.A.; Shah, K.; Luo, C.; Moghtaderi, B. CFD–DEM simulation of solid circulation rate in the cold flow model of chemical looping systems. Chem. Eng. Res. Des. 2015, 95, 262–280. [Google Scholar] [CrossRef]
- Bi, X.T.; Liu, X. High density and high solids flux CFB risers for steam gasification of solids fuels. Fuel Process. Technol. 2010, 91, 915–920. [Google Scholar] [CrossRef]
- Rahman, M.H.; Bi, X.T.; Grace, J.R.; Lim, C.J. Comparison of techniques for measuring CFB solids circulation rates at low and high temperatures. Powder Technol. 2020, 360, 43–54. [Google Scholar] [CrossRef]
- Rahman, M.H.; Bi, X.T.; Grace, J.R.; Lim, C.J. Measurement of solids circulation rate in a high-temperature dual fluidized bed pilot plant. Powder Technol. 2017, 316, 658–669. [Google Scholar] [CrossRef]
- Ludlow, J.C.; Monazam, E.R.; Shadle, L.J. Improvement of continuous solid circulation rate measurement in a cold flow circulating fluidized bed. Powder Technol. 2008, 182, 379–387. [Google Scholar] [CrossRef]
- Markström, P.; Lyngfelt, A. Designing and operating a cold-flow model of a 100 kW chemical-looping combustor. Powder Technol. 2012, 222, 182–192. [Google Scholar] [CrossRef]
- Burkell, J.J.; Grace, J.R.; Zhao, J.; Lim, C.J. Measurement of Solids Circulation Rates in Circulating Fluidized Beds. Circulating Fluidized Bed Technology II; Pergamon: Oxford, UK, 1988. [Google Scholar]
- Kreuzeder, A.; Pfeifer, C.; Hofbauer, H. Fluid-Dynamic Investigations in a Scaled Cold Model for a Dual Fluidized Bed Biomass Steam Gasification Process: Solid Flux Measurements and Optimization of the Cyclone. Int. J. Chem. React. Eng. 2007, 5, A31. [Google Scholar] [CrossRef]
- Karlsson, T.; Liu, X.; Pallarès, D.; Johnsson, F. Solids circulation in circulating fluidized beds with low riser aspect ratio and varying total solids inventory. Powder Technol. 2017, 316, 670–676. [Google Scholar] [CrossRef]
- Göransson, K.; Söderlind, U.; Zhang, W. Experimental test on a novel dual fluidised bed biomass gasifier for synthetic fuel production. Fuel 2011, 90, 1340–1349. [Google Scholar] [CrossRef]
- Fuchs, J.; Schmid, J.C.; Benedikt, F.; Mauerhofer, A.M.; Müller, S.; Hofbauer, H. A general method for the determination of the entrainment in fluidized beds. Int. J. Multiphys. 2018, 12, 4. [Google Scholar]
- Xu, G.; Murakami, T.; Suda, T.; Matsuzawa, Y.; Tani, H. Particle circulation rate in high-temperature CFB: Measurement and temperature influence. AIChE J. 2006, 52, 3626–3630. [Google Scholar] [CrossRef]
- Medrano, J.A.; Nordio, M.; Manzolini, G.; Annaland, M.S.; Gallucci, F. On the measurement of solids circulation rates in interconnected fluidized beds: Comparison of different experimental techniques. Powder Technol. 2016, 302, 81–89. [Google Scholar] [CrossRef]
- Kunii, D.; Levenspiel, O. Fluidization Engineering; John Wiley & Sons: New York, NY, USA, 1969; Volume 64–73, pp. 76–79. [Google Scholar]
- Sun, S.; Lu, X.; Zhou, S.; Wang, Q.; Chen, J.; Li, J.; Xie, X.; Liu, C. Investigation on heat exchange feasibility of internal solids circulation for an ultra-supercritical CFB boiler. Powder Technol. 2018, 339, 223–231. [Google Scholar] [CrossRef]
- Deng, B.; Zhang, M.; Shan, L.; Wei, G.; Lyu, J.; Yang, H.; Gao, M. Modeling study on the dynamic characteristics in the full-loop of a 350 MW supercritical CFB boiler under load regulation. J. Energy Inst. 2021, 97, 117–130. [Google Scholar] [CrossRef]
- Alghamdi, Y.; Peng, Z.; Shah, K.; Moghtaderi, B.; Doroodchi, E. Predicting the solid circulation rate in chemical looping combustion systems using pressure drop measurements. Powder Technol. 2015, 286, 572–581. [Google Scholar] [CrossRef]
- Rhodes, M.J.; Wang, X.S.; Cheng, H.; Gibbs, B.M. Similar profiles of solid flux in circulating fluidized-bed risers. Chem. Eng. Sci. 1992, 47, 1635–1643. [Google Scholar] [CrossRef]
- Stollhof, M.; Penthor, S.; Mayer, K.; Hofbauer, H. Estimation of the solid circulation rate in circulating fluidized bed systems. Powder Technol. 2018, 336, 1–11. [Google Scholar] [CrossRef]
- van der Meer, E.H. Riser Exits and Scaling of Circulating Fluidized Beds. Ph.D. Thesis, University of Cambridge, Cambridge, UK, 1997. [Google Scholar]
- Linderholm, C.; Schmitz, M.; Lyngfelt, A. Estimating the solids circulation rate in a 100-kW chemical looping combustor. Chem. Eng. Sci. 2017, 171, 351–359. [Google Scholar] [CrossRef]
- Alghamdi, Y.A.; Doroodchi, E.; Moghtaderi, B. Mixing and segregation of binary oxygen carrier mixtures in a cold flow model of a chemical looping combustor. Chem. Eng. J. 2013, 223, 772–784. [Google Scholar] [CrossRef]
- Patience, G.S.; Chaouki, J.; Grandjean, B.P.A. Solids flow metering from pressure drop measurement in circulating fluidized beds. Powder Technol. 1990, 61, 95–99. [Google Scholar] [CrossRef]
- Yang, S.; Yang, H.; Zhang, H.; Li, S.; Yue, G. A transient method to study the pressure drop characteristics of the cyclone in a CFB system. Powder Technol. 2009, 192, 105–109. [Google Scholar] [CrossRef]
- Monazam, E.R.; Panday, R.; Shadle, L.J. Estimate of solid flow rate from pressure measurement in circulating fluidized bed. Powder Technol. 2010, 203, 91–97. [Google Scholar] [CrossRef]
- Huang, Y.; Parviz Famouri, R.T.; Boyle, E.J. Prediction of Solids Circulation Rate of Cork Particles in an Ambient-Pressure Pilot-Scale Circulating Fluidized Bed. Ind. Eng. Chem. Res. 2009, 48, 134–141. [Google Scholar] [CrossRef]
- Ergun, S. Fluid flow through packed columns. Chem. Eng. Prog. 1952, 48, 89–94. [Google Scholar]
- de Martín, L.; van Ommen, J.R. Estimation of the overall mass flux in inclined standpipes by means of pressure fluctuation measurements. Chem. Eng. J. 2012, 204–206, 125–130. [Google Scholar] [CrossRef]
- Zhang, G.; Chen, Z.; Bao, J.; Wei, W.; Bi, X. Solids circulation behaviour in a circulating fluidized bed with a concentric annular feeding mechanism. Can. J. Chem. Eng. 2021, 99, 2294–2302. [Google Scholar] [CrossRef]
- Rahman, M.H.; Daniel, L.; Shah, U.; Bi, X.; Grace, J.R.; Lim, C.J. Estimation of solids circulation rate and char transfer rate from gasifier to combustor in a dual fluidized-bed pilot plant for biomass steam gasification. Particuology 2019, 46, 22–29. [Google Scholar] [CrossRef]
- Lim, M.T.; Saw, W.L.; Peng, S. Estimation of Solids Circulation Rate from Risers at High Solids-to-Gas Density Ratios. Chem. Eng. Commun. 2015, 202, 356–360. [Google Scholar] [CrossRef]
- Park, J.; Huang, Y.; Turton, R.; Famouri, P.; Boyle, E.J. The control of bed height and solids circulation rate in the standpipe of a cold flow circulating fluidized bed. Powder Technol. 2005, 150, 176–184. [Google Scholar] [CrossRef]
- Kuramoto, M.; Kunii, D.; Furusawa, T. Flow of Dense Fluidized Particles through an Opening in a Circulation System. Powder Technol. 1986, 47, 141–149. [Google Scholar] [CrossRef]
- Hu, J.; Liu, D.; Liang, C.; Ma, J.; Chen, X.; Zhang, T. Solids flow characteristics and circulation rate in an internally circulating fluidized bed. Particuology 2021, 54, 69–77. [Google Scholar] [CrossRef]
- Mitrofanov, A.V.; Shuina, E.A.; Tikhomirova, I.A.; Tannous, K. Computational and experiment study of drying of disperse materials in a circulating fluidized bed. Fibre Chem. 2019, 51, 293–296. [Google Scholar] [CrossRef]
- Guío-Pérez, D.C.; Dietrich, F.; Cala, J.N.F.; Pröll, T.; Hofbauer, H. Estimation of solids circulation rate through magnetic tracer tests. Powder Technol. 2017, 316, 650–657. [Google Scholar] [CrossRef]
- Roy, S.; Kemoun, A.; Al-Dahhan, M.H.; Dudukovic, M.P. A method for estimating the solids circulation rate in a closed-loop circulating fluidized bed. Powder Technol. 2001, 121, 213–222. [Google Scholar] [CrossRef]
- Bhusarapu, S.; Fongarland, P.; Al-Dahhan, M.H.; Dudukovic, M.P. Measurement of overall solids mass flux in a gas–solid Circulating Fluidized Bed. Powder Technol. 2004, 148, 158–171. [Google Scholar] [CrossRef]
- Matsuda, S. Measurement of solid circulation rate in a circulating fluidized bed. Powder Technol. 2008, 187, 200–204. [Google Scholar] [CrossRef]
- Yang, X.; Wang, C.; Lan, X.; Gao, J. Study on the Flow Characteristics of Desulfurization Ash Fine Particles in a Circulating Fluidized Bed. Processes 2021, 9, 1343. [Google Scholar] [CrossRef]
- Wang, C.; Zhu, J.; Barghi, S.; Li, C. Axial and radial development of solids holdup in a high flux/density gas–solids circulating fluidized bed. Chem. Eng. Sci. 2014, 108, 233–243. [Google Scholar] [CrossRef]
- Aitor, A.; Mikel, T.; Gartzen, L.; Roberto, A.; Javier, B.; Martin, O. Implementation of a borescopic technique in a conical spouted bed for tracking spherical and irregular particles. Chem. Eng. J. 2019, 374, 39–48. [Google Scholar]
- Xie, H.; Lin, X.; Wang, S.; Li, L.; Feng, H.; Zhang, P.; Huang, Q. Real-time diagnosis of circulation stability for CFB combustion optimization using a novel image trajectory method. Fuel 2021, 305, 121554. [Google Scholar] [CrossRef]
- Spenika, J.L.; Ludlow, J.C. Use of piezoelectric pressure transducers to determine local solids mass flux in the riser of a cold flow circulating fluidized bed. Powder Technol. 2010, 203, 86–90. [Google Scholar] [CrossRef]
- Heertjes, P.M.R.; Willems, J.V. The measurement of local mass flow rates and particle velocities in fluid—Solids flow. Powder Technol. 1970, 4, 38–40. [Google Scholar] [CrossRef]
- Kim, S.W.; Ahn, J.Y.; Lee, D.H.; Kim, S.D. Continuous measurement of solids flow in a circulating fluidized bed. Korean J. Chem. Eng. 2001, 18, 555–560. [Google Scholar] [CrossRef]
- Wu, W.; Gerhart, A.L.; Chen, Z.; Dellenback, P.A.; Agarwal, P.K. A device for measuring solids flowrate in a circulating fluidized bed. Powder Technol. 2001, 120, 151–158. [Google Scholar] [CrossRef]
- Hu, N.; Yao, X.; Chao, J.; Yang, H.; Lyu, J. Impacting method for on-line measurement of solid circulating rate in CFB. J. Chin. Soc. Power Eng. 2011, 31, 485–490. (In Chinese) [Google Scholar]
- Liu, J.; Huan, B. Turbine meter for the measurement of bulk solids flow rate. Powder Technol. 1995, 82, 145–151. [Google Scholar] [CrossRef]
- Lu, X.; Li, Y. Experimental Study on an On-Line Measurement of High Temperature Circulating Ash Flux in a Circulating Fluidized Bed Boiler. J. Therm. Sci. 2001, 10, 188–192. [Google Scholar] [CrossRef]
- Zhang, C.; Xu, Q.; Bourane, A.; Ghrami, M.; Abba, I.; Wei, F. Stability Analysis of Gas–Solid Distribution through Nonidentical Parallel Paths. Ind. Eng. Chem. Res. 2020, 59, 6707–6715. [Google Scholar] [CrossRef]
- Harris, B.J.; Davies, C.E.; Davidson, J.F. The slot flow meter: A new device for continuous solids flow measurement. Chem. Eng. Sci. 1997, 52, 4637–4648. [Google Scholar] [CrossRef]
- Leckner, B. Regimes of large-scale fluidized beds for solid fuel conversion. Powder Technol. 2017, 308, 362–367. [Google Scholar] [CrossRef]
- Jones, P.J.; Leung, L.S. Down Flow of Solids through Pipes and Valves; Academic Press: London, UK, 1985; pp. 293–329. [Google Scholar]
- Basu, P.; Cheng, L. An Analysis of Loop Seal Operations in a Circulating Fluidized Bed. Chem. Eng. Res. Des. 2000, 78, 991–998. [Google Scholar] [CrossRef]
- Rhodes, M.J.; Geldart, D. A model for the circulating fluidized bed. Powder Technol. 1987, 42, 155–162. [Google Scholar] [CrossRef]
- Ludlow, J.C.; Panday, R.; Shadle, L.J. Standpipe models for diagnostics and control of a circulating fluidized bed. Powder Technol. 2013, 242, 51–64. [Google Scholar] [CrossRef]
- Dong, L.; Jia, W.; Zhao, Z.; Xu, G. Elimination of stagnant particles from a N-valve with side aeration in circulating fluidized bed. Adv. Powder Technol. 2014, 25, 1155–1161. [Google Scholar] [CrossRef]
- Kim, S.W.; Kim, S.D.; Lee, D.H. Pressure Balance Model for Circulating Fluidized Beds with a Loop-seal. Ind. Eng. Chem. Res. 2002, 41, 4949–4956. [Google Scholar] [CrossRef]
- Yao, X. Study on Hydrodynamic and Particles Segregation in the Loop of Circulating Fluidized Bed; Tsinghua University: Beijing, China, 2011; pp. 36–42. [Google Scholar]
- Chan, W.C.; Seville, J.; Fan, X.; Baeyens, J. Solid particle motion in a standpipe as observed by Positron Emission Particle Tracking. Powder Technol. 2009, 194, 58–66. [Google Scholar] [CrossRef]
- Ma, Q.; Lei, F.; Xu, X.; Xiao, Y. Three-dimensional full-loop simulation of a high-density CFB with standpipe aeration experiments. Powder Technol. 2017, 320, 574–585. [Google Scholar] [CrossRef]
- Wang, Q.; Yang, H.; Wang, P.; Lu, J.; Liu, Q.; Zhang, H.; Wei, L.; Zhang, M. Application of CPFD method in the simulation of a circulating fluidized bed with a loop seal Part II—Investigation of solids circulation. Powder Technol. 2014, 253, 822–828. [Google Scholar] [CrossRef]
- Liu, X.; Wu, Y.; Zhang, Y.; Zhou, S.; Yang, H.; Zhang, H.; Lyu, J.; Zhang, K. Research on in-situ measurement method for ash circulating rate of circulating fluidized bed. Clean Coal Technol. 2020, 26, 9–15. (In Chinese) [Google Scholar]
Publisher’s Note: MDPI stays neutral with regard to jurisdictional claims in published maps and institutional affiliations. |
© 2022 by the authors. Licensee MDPI, Basel, Switzerland. This article is an open access article distributed under the terms and conditions of the Creative Commons Attribution (CC BY) license (https://creativecommons.org/licenses/by/4.0/).