2.1. Low-Energy Conformers of Vandetanib in Solvent
All geometries of VTB using cluster sampling [
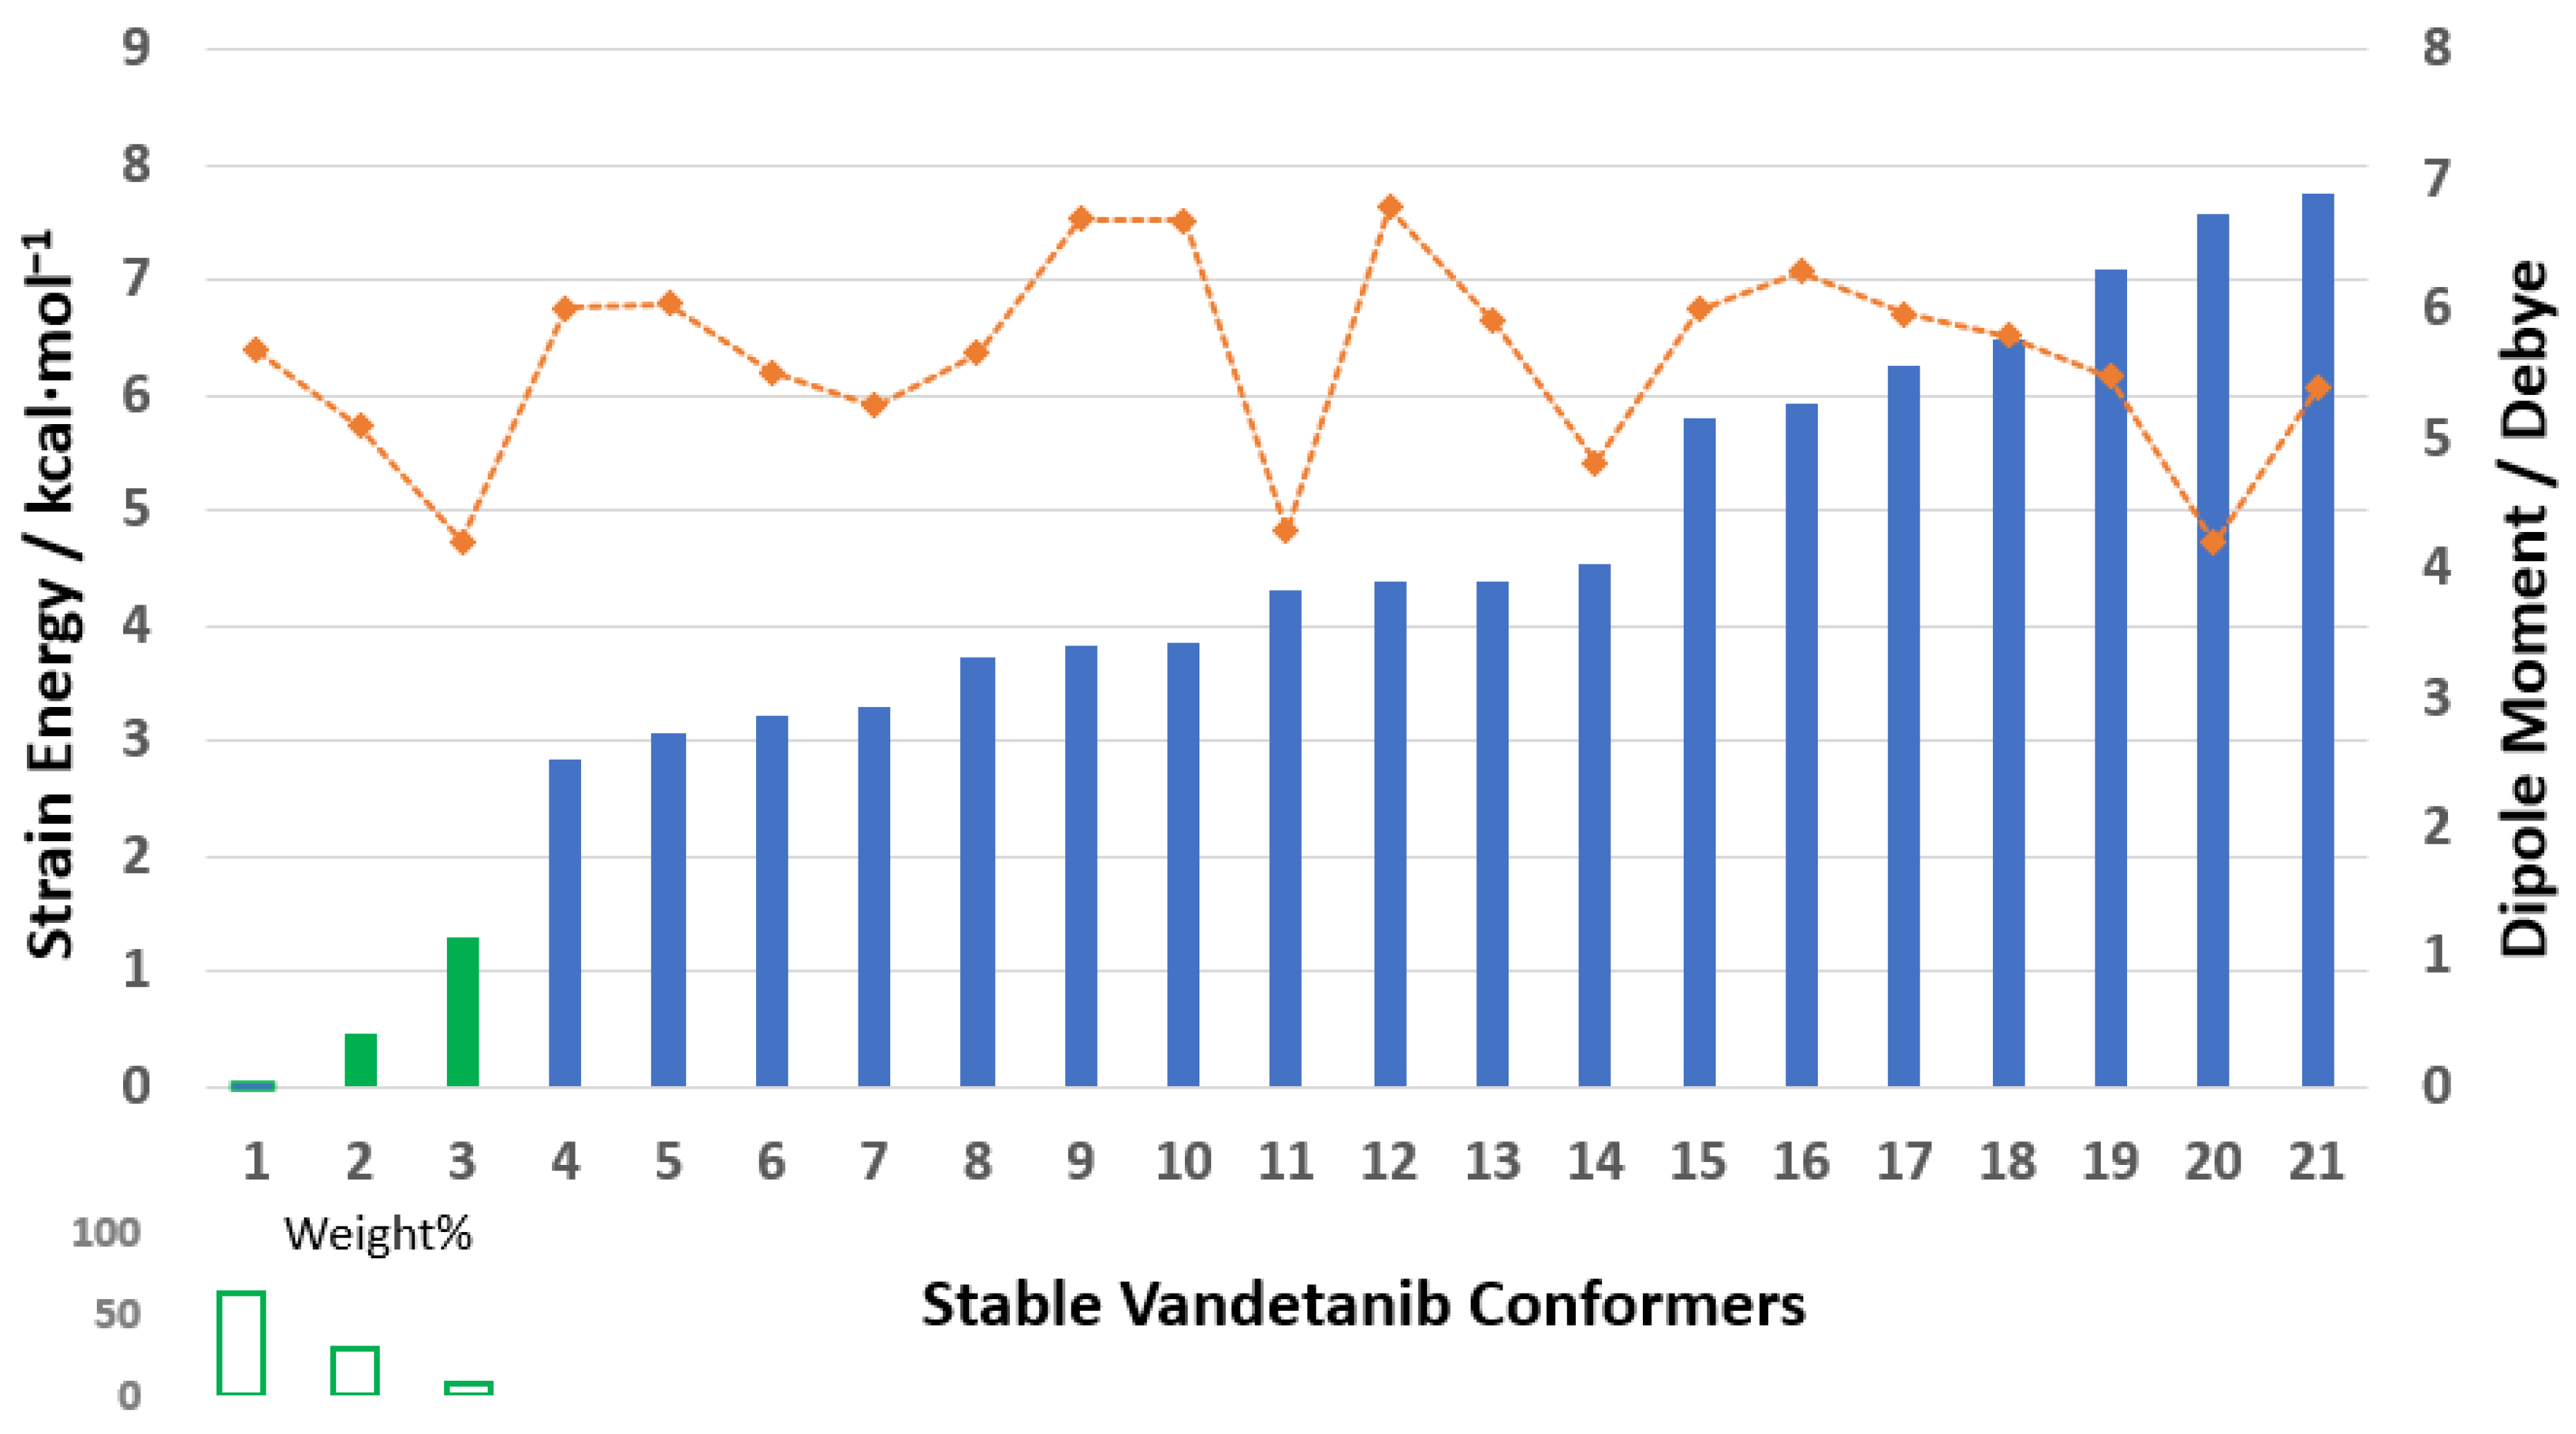
32] were optimized using the DFT- based B3LYP/6-311++G(d,p) level of theory in DMSO solvent. The PrefQMCon program clustered the generated stable structures into 21 conformer groups, of which only the first eight VTB clusters exhibit populations exceeding 0.1% at room temperature (293.0 K) in DMSO. The energy differences between the global minimum structure and the energies of stable conformers of local minimum structures are due to conformational strain energy [
32]. The strain energy of VTB conformers with a cut off at 7.758 kcal∙mol
−1 is given in
Figure 3. (The details are given in
Table S1 in the SM). Notably, when the strain energy exceeds 7 eV, very few conformers are populated at 293.0 K according to the canonical partition function.
The three lowest-energy conformers of VTB, shown in green in
Figure 3, account for approximately 98.21% of the conformational population at room temperature (293.0 K). The remainder of this study focuses on these dominant conformers, particularly the global minimum (Van1), which alone contributes nearly 63% to the overall Boltzmann distribution. Dipole moments vary significantly among the conformers, ranging from 4.0 to 8.0 Debye, which highlights the sensitivity of this anisotropic property to molecular conformation. Notably, among the dominant conformers, dipole moments tend to decrease as the conformational strain energy increases, reflecting the relationship between structural compactness and electronic distribution.
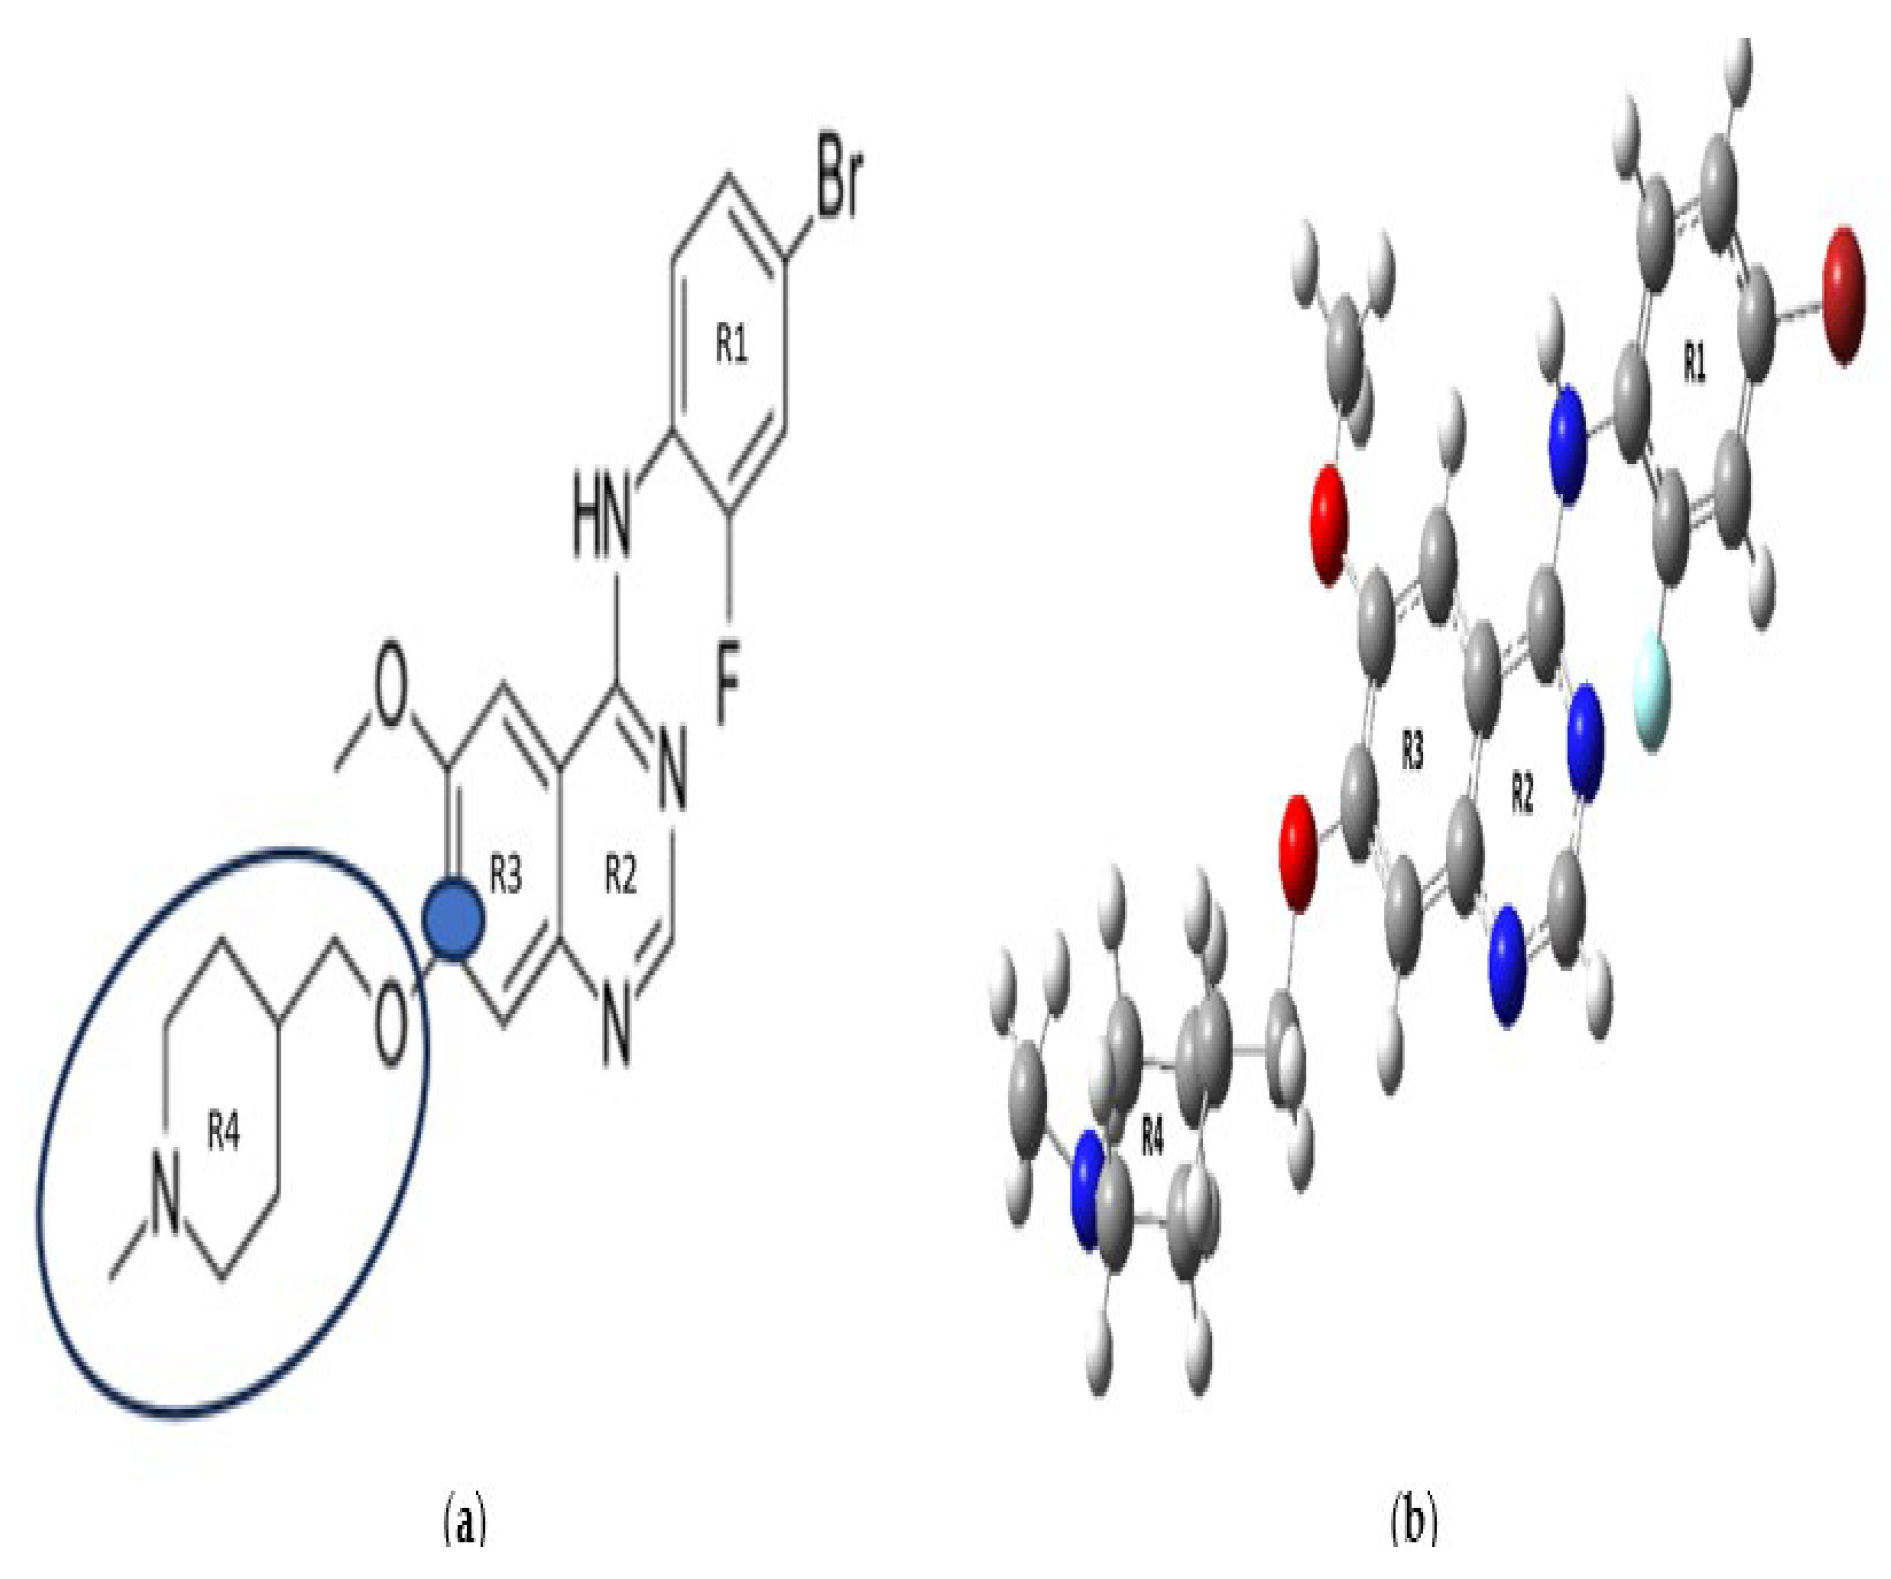
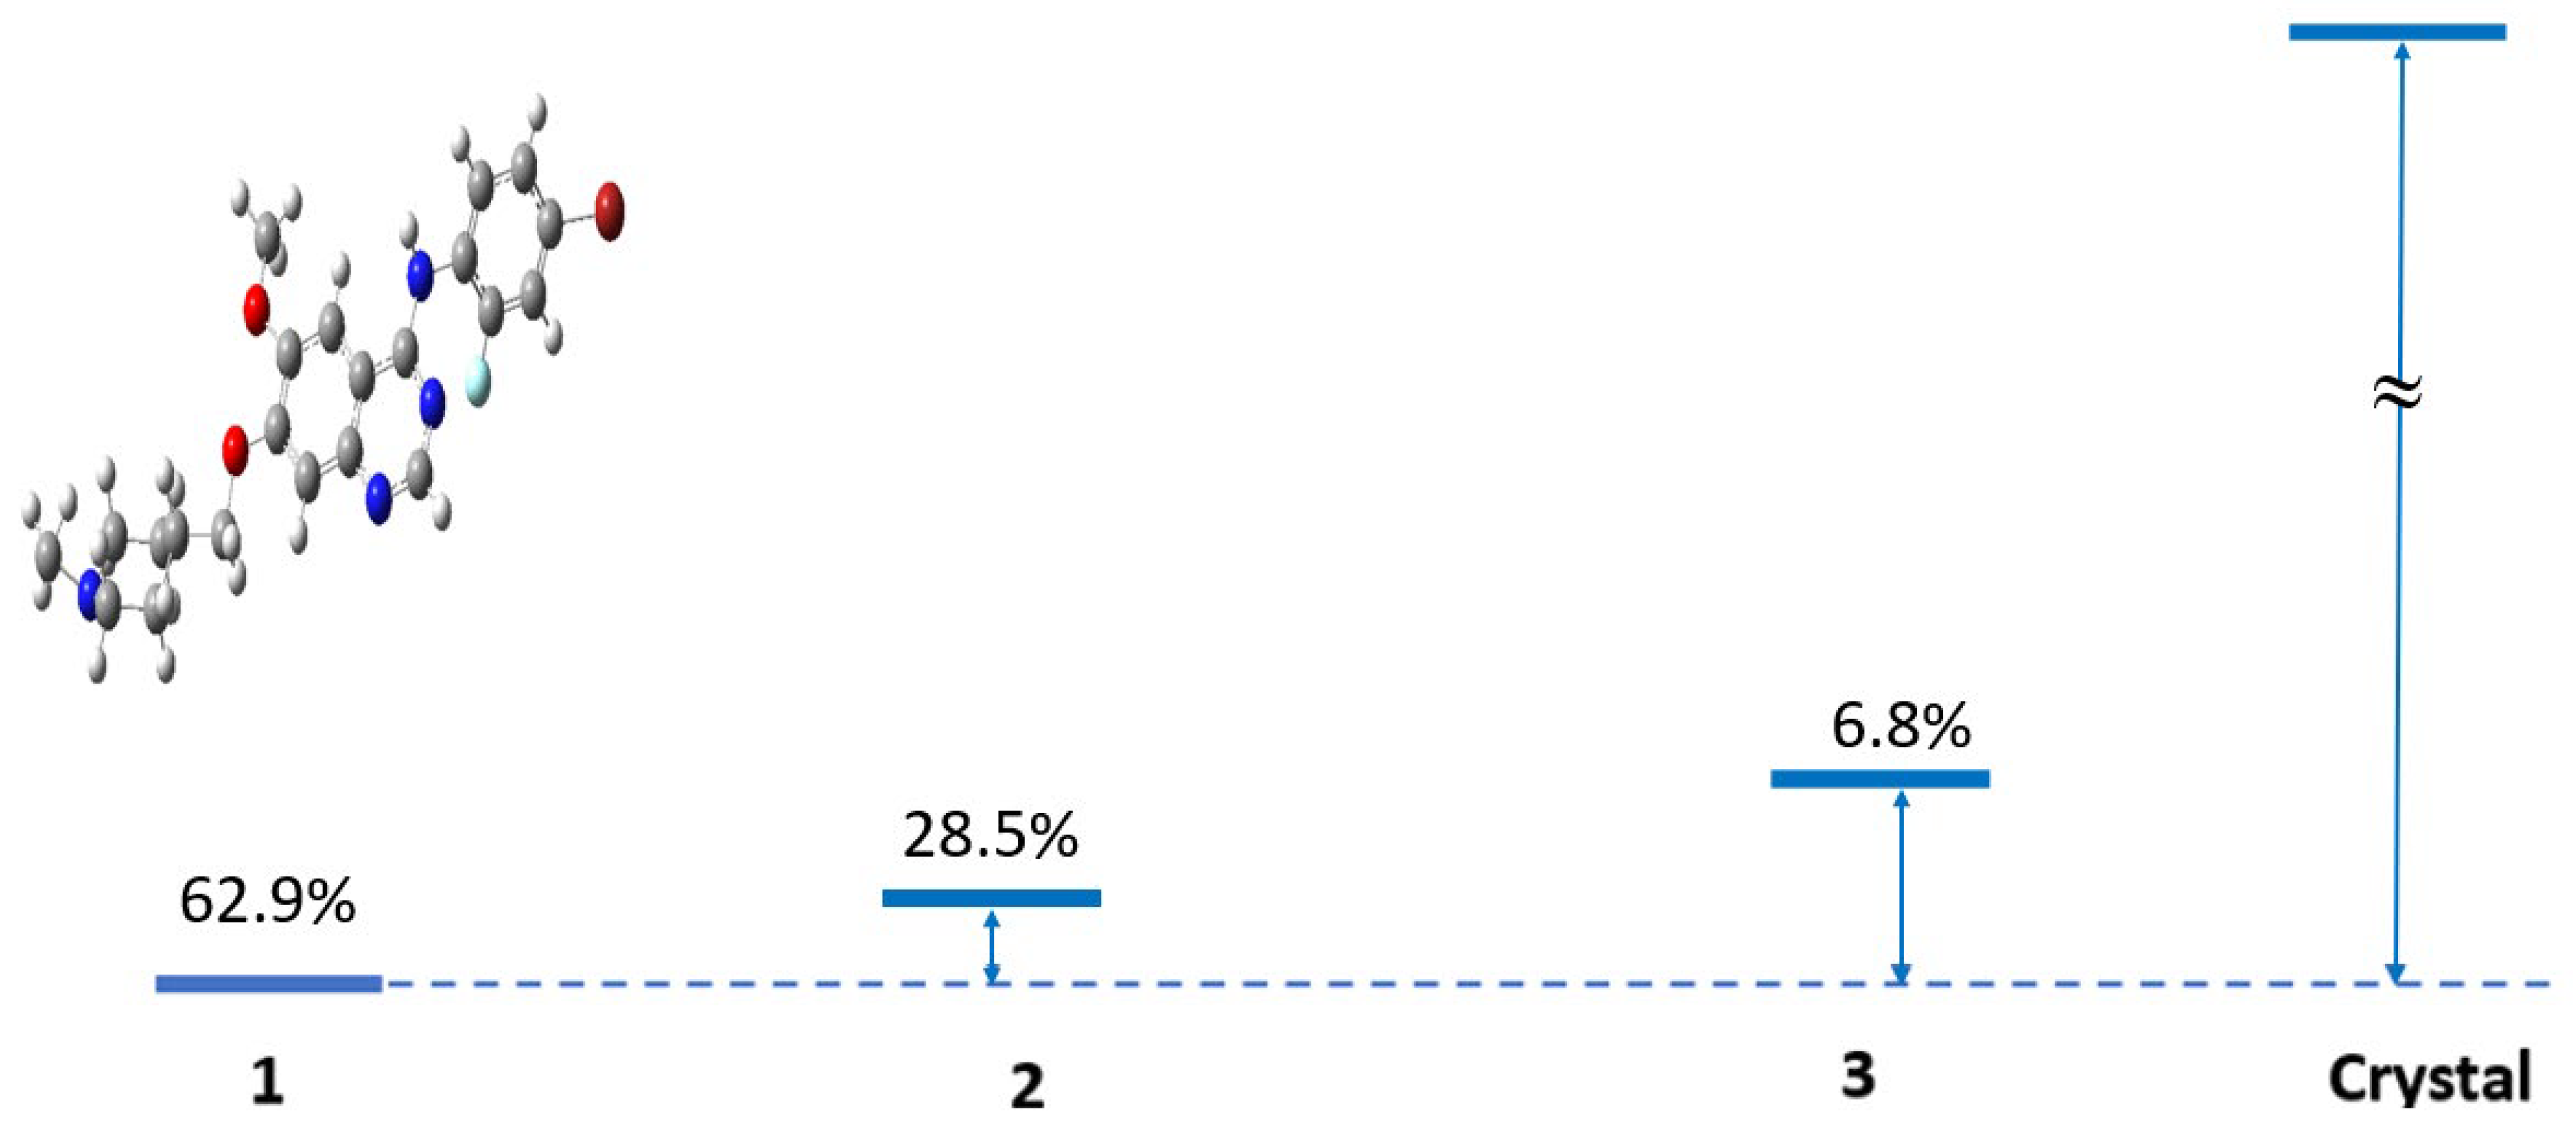
Figure 4 provides a structural comparison between the three lowest-energy conformers and the experimental crystal structure of VTB [
11,
14,
33]. The quinazoline core of VTB is highlighted in orange color in the figure. A critical interaction site, carbon C7 on the 4-anilinoquinazoline fragment, is marked in blue in the inset, which was identified by Hennequin et al. [
31] as a key position for EGFR inhibitor potency. In the most populated conformers (Van1, Van 2, and Van3), the fluorine atom is oriented on the opposite side of the C7 site connecting the N-methyl piperidine ring [
31]. Although the bromo-fluorophenyl ring (R
1) is not coplanar with the quinazoline core (R2 and R3), the fluorine atom consistently aligns with the dihedral angle between the bromo-fluorophenyl ring, and the quinazoline core is small (1.12°) in these dominant VTB conformers. In the crystal structure, this dihedral angle is 25.7°, suggesting a conformational rearrangement upon crystallization or binding.
Figure 4.
The three lowest-lying conformers of VTB, Van1 (the structure in the figure), Van2 (0.461 kcal∙mol
−1 above Van1), Van 3 (1.293 kcal∙mol
−1 above Van1), and the crystal structure [
11] (370.23 kcal∙mol
−1 above Van1). The strain energy and the weight (%) based on the canonical partition function at 293.0 K are also given at the B3LYP/6-311++G(d,p) level of theory. For more details, see
Table S1 in the SM.
These low-energy conformers of VTB presented in
Figure 4 were reoptimized using the mPW1PW91/6-311++G(d,p) level of theory in DMSO to ensure accurate NMR predictions [
34]. Key structural parameters of these conformers are summarized in
Table 1. Compared to the crystal structure [
11,
14,
33], all fully optimized geometries exhibit slightly shorter bond lengths and ring perimeters. This observation may stem from the absence of crystal packing effects in solvated DFT optimizations. A consistent trend is noted among the low-energy conformers of VTB regarding ring perimeter sizes: R
2 (quinazoline moiety) < R
1 (bromofluorophenyl) < R
3 (quinazoline moiety) < R
4 (methylpiperidinyl). This trend is chemically reasonable: R
2 is a pyrimidine-type aromatic ring with multiple C–N bonds, contributing to a more compact geometry. In contrast, R
4, which is a saturated piperidine ring with all single bonds, results in a more flexible and extended conformation.
The perimeters of R
1 to R
3 of VTB are in excellent agreement with those of structurally related EGFR TKIs, such as AG-1478 (8.37 Å, 8.21 Å, and 8.44 Å) [
35] and Dacomitinib (8.30 Å, 8.16 Å, and 8.38 Å) [
36]. Interestingly, the presence of dihalogen substitutions on the phenyl ring appears to induce a slight contraction of ring perimeters, with VTB (8.34 Å) and Dacomitinib (8.30 Å) both showing slightly shorter values than AG-1478 (8.37 Å) [
35].
While isotropic geometric properties, such as ring perimeters, are nearly identical across the three low-energy conformers, the anisotropic properties like dipole moments and electronic spatial extension (shape) differ more significantly. The calculated dipole moments for Van1, Van2, and Van3 are 5.58, 4.99, and 5.97 Debye, respectively, corresponding to their electric spatial extents ⟨R2⟩ of 108,955.71, 99,622.38, and 49,763.67 atomic units. These variations reflect differences in molecular polarity, charge distribution, and shape, which could influence solvent interactions and NMR chemical shift predictions.
2.2. NMR Chemical Shifts of Low-Lying Conformers of Vandetanib
Beyond its routine analytical applications, NMR spectroscopy provides atom-specific information about molecular environments in solution. When combined with computational NMR simulations, it offers valuable insights into the preferred conformations and geometries of molecules under experimental conditions [
26,
37]. To validate the accuracy of quantum chemical methods for predicting NMR observables, we re-optimized the structure of VTB in DMSO. Based on these solvent-specific geometries,
1H-,
13C-, and
15N-NMR chemical shifts were calculated for the global minimum structure (Van1).
Among various NMR observables,
1H-NMR chemical shifts are particularly valuable for validating computational methods such as DFT, owing to their high experimental precision, reproducibility, and sensitivity to local electronic environments. Protons yield sharp, well-resolved signals, and the standardized
1H-NMR scale allows for direct comparison with theoretical predictions. The relatively narrow chemical shift range (0–12 ppm) enhances the detection of discrepancies between calculated and experimental values. In addition,
1H-NMR shifts are highly responsive to subtle electronic effects, including hydrogen bonding, where downfield shifts (higher ppm values) typically indicate deshielding of protons involved in intra- or intermolecular interactions [
26,
38].
For complex organic molecules such as VTB (C
22H
24BrFN
4O
2),
1H-NMR is generally measured with higher precision and reliability than
13C-NMR due to the higher sensitivity and natural abundance of
1H nuclei as well as more robust calibration protocols [
17,
39,
40,
41]. Moreover, DFT calculations capture local electronic effects on proton shifts more accurately than for carbon atoms, whose chemical shifts are often influenced by broader electronic delocalization and conformational dynamics, increasing both experimental uncertainty and computational complexity. In this study, experimental
1H-NMR data were first used to validate the computed chemical shifts and DFT functional. This validated functional was then applied to
13C-NMR shift calculations, allowing comparison with experimental data and providing insights into the inherent limitations and potential discrepancies of
13C-NMR measurements in thiscompound.
Experimentally determined NMR parameters are valuable for elucidating both the two-dimensional (2D) connectivity and three-dimensional (3D) structures of molecules [
34].
Table S3 in SM presents the DFT-calculated
1H-NMR chemical shifts for three low-energy conformers of VTB (Van1, Van2, and Van3), alongside several experimental datasets reported by Al-Ghusn et al. [
17], Smith et al. [
37], Fei [
40], and Brocklesby et al. [
41] in methanol solvent. Although Fei’s study [
40], conducted in 2016, is less recent than other measurements listed in
Table S3, it employed a more advanced spectrometer. Specifically, Fei used a Bruker ARX-500 operating at 500.30 MHz, along with heteronuclear single quantum coherence (HSQC),
1H-
1H correlation spectroscopy (COSY), and other 2D NMR experiments [
40]. These 2D NMR spectra enabled Fei [
40] to achieve confident and reliable assignments of the
1H-NMR chemical shifts. Therefore, Fei’s results [
40] are used as a key reference for comparison in this study.
The calculated root mean square deviation (RMSD) between the theoretical and experimental
1H chemical shifts suggests that either the global minimum conformer Van1 or the Boltzmann-averaged low-energy conformers, denoted Van
w, most likely represent the structure observed in Fei’s measurements [
40], as they show the smallest RMSD of 0.29 ppm. Notably, the relative energies of Van1, Van2, and Van3 correspond well with the likelihood of their experimental detection. For comparison, the RMSDs between the calculated shifts and other available measurements are 0.21 ppm for Al-Ghusn et al. [
17], 0.71 ppm for Smith et al. [
37], and 0.32 ppm for Brocklesby et al. [
41]. It is noted that although the proton NMR chemical shifts of measurements of Fei [
40] are more accurate, it might have missed one aromatic proton NMR chemical shift signal between 7.1778 and 7.4643 ppm. Additionally, the second-to-last signal at 7.7893 ppm [
40] is relatively lower than those reported by Smith et al. [
37] and Brocklesby et al. [
41] as well as the patent measurements of Tung [
19].
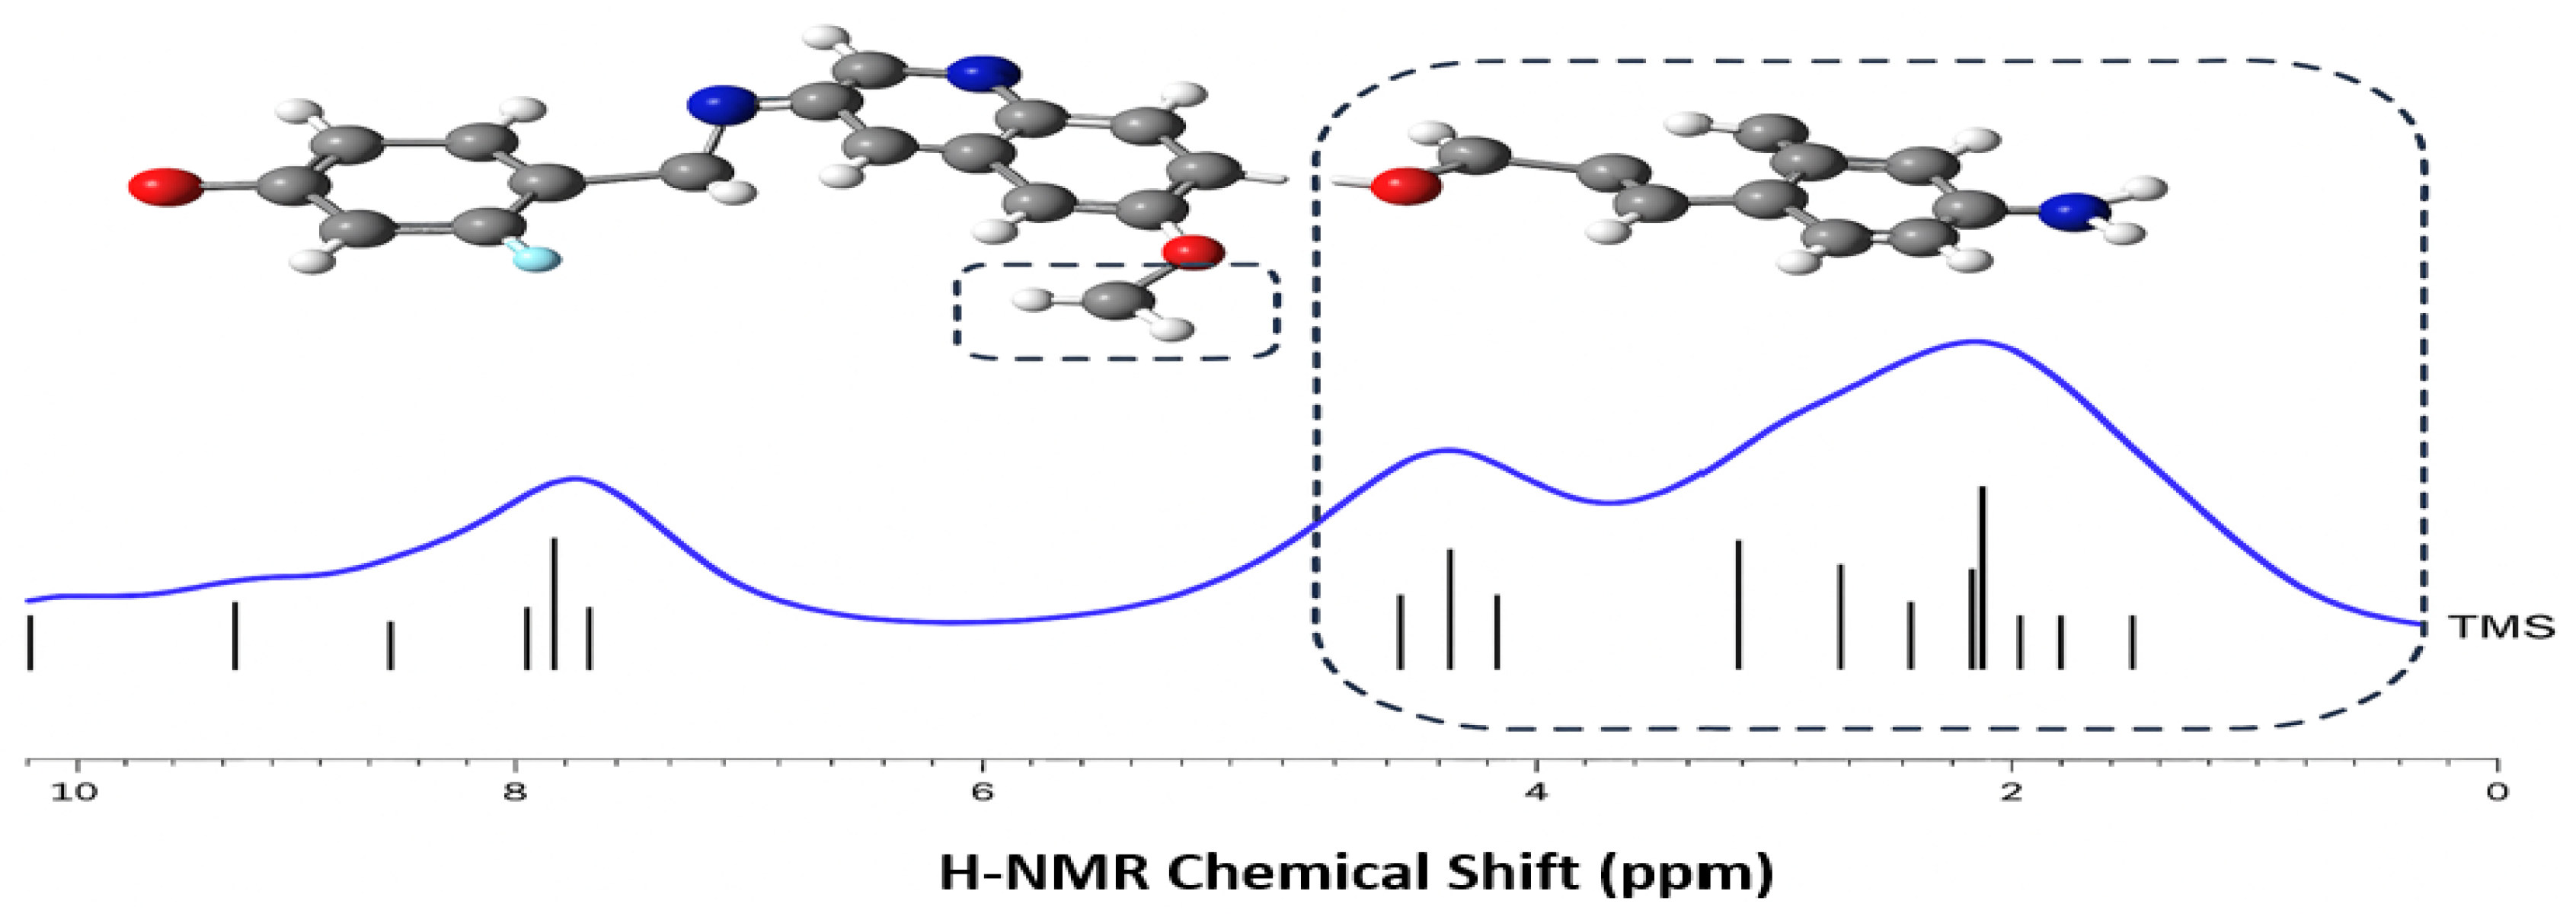
Figure 5 presents the
1H-NMR chemical shifts of the 24 protons in VTB. The spectrum is divided into two distinct regions: the aromatic protons (7 in total) appear downfield at δ
H > 7 ppm, while the remaining 17 aliphatic protons appear upfield at δ
H < 5 ppm. This clear separation arises from the distinct chemical environments of the protons and is consistent with the experimental spectrum reported by Fei [
40]. Structurally, VTB can be divided into two main fragments: a relatively rigid aromatic region (the 4-anilinoquinazoline fragment, R1, R2 and R3) and a more flexible aliphatic region (the piperidine ring, R4), as illustrated in
Figure 5. The aromatic protons are deshielded due to the electron-withdrawing nature of the conjugated aromatic system, resulting in downfield shifts. In contrast, the aliphatic protons are shielded by their saturated environments, leading to upfield shifts [
19]. This clear distinction between the aromatic and aliphatic regions is well reflected in the NMR spectrum shown in
Figure 5.
The consistently low RMSD values between the calculated and experimental
1H NMR chemical shifts confirm that the DFT approach employed in this study is sufficiently accurate for modeling the local electronic environments in VTB. Building on this, the same computational framework was extended to calculate the
13C NMR chemical shifts, where the choice of exchange functional was systematically evaluated.
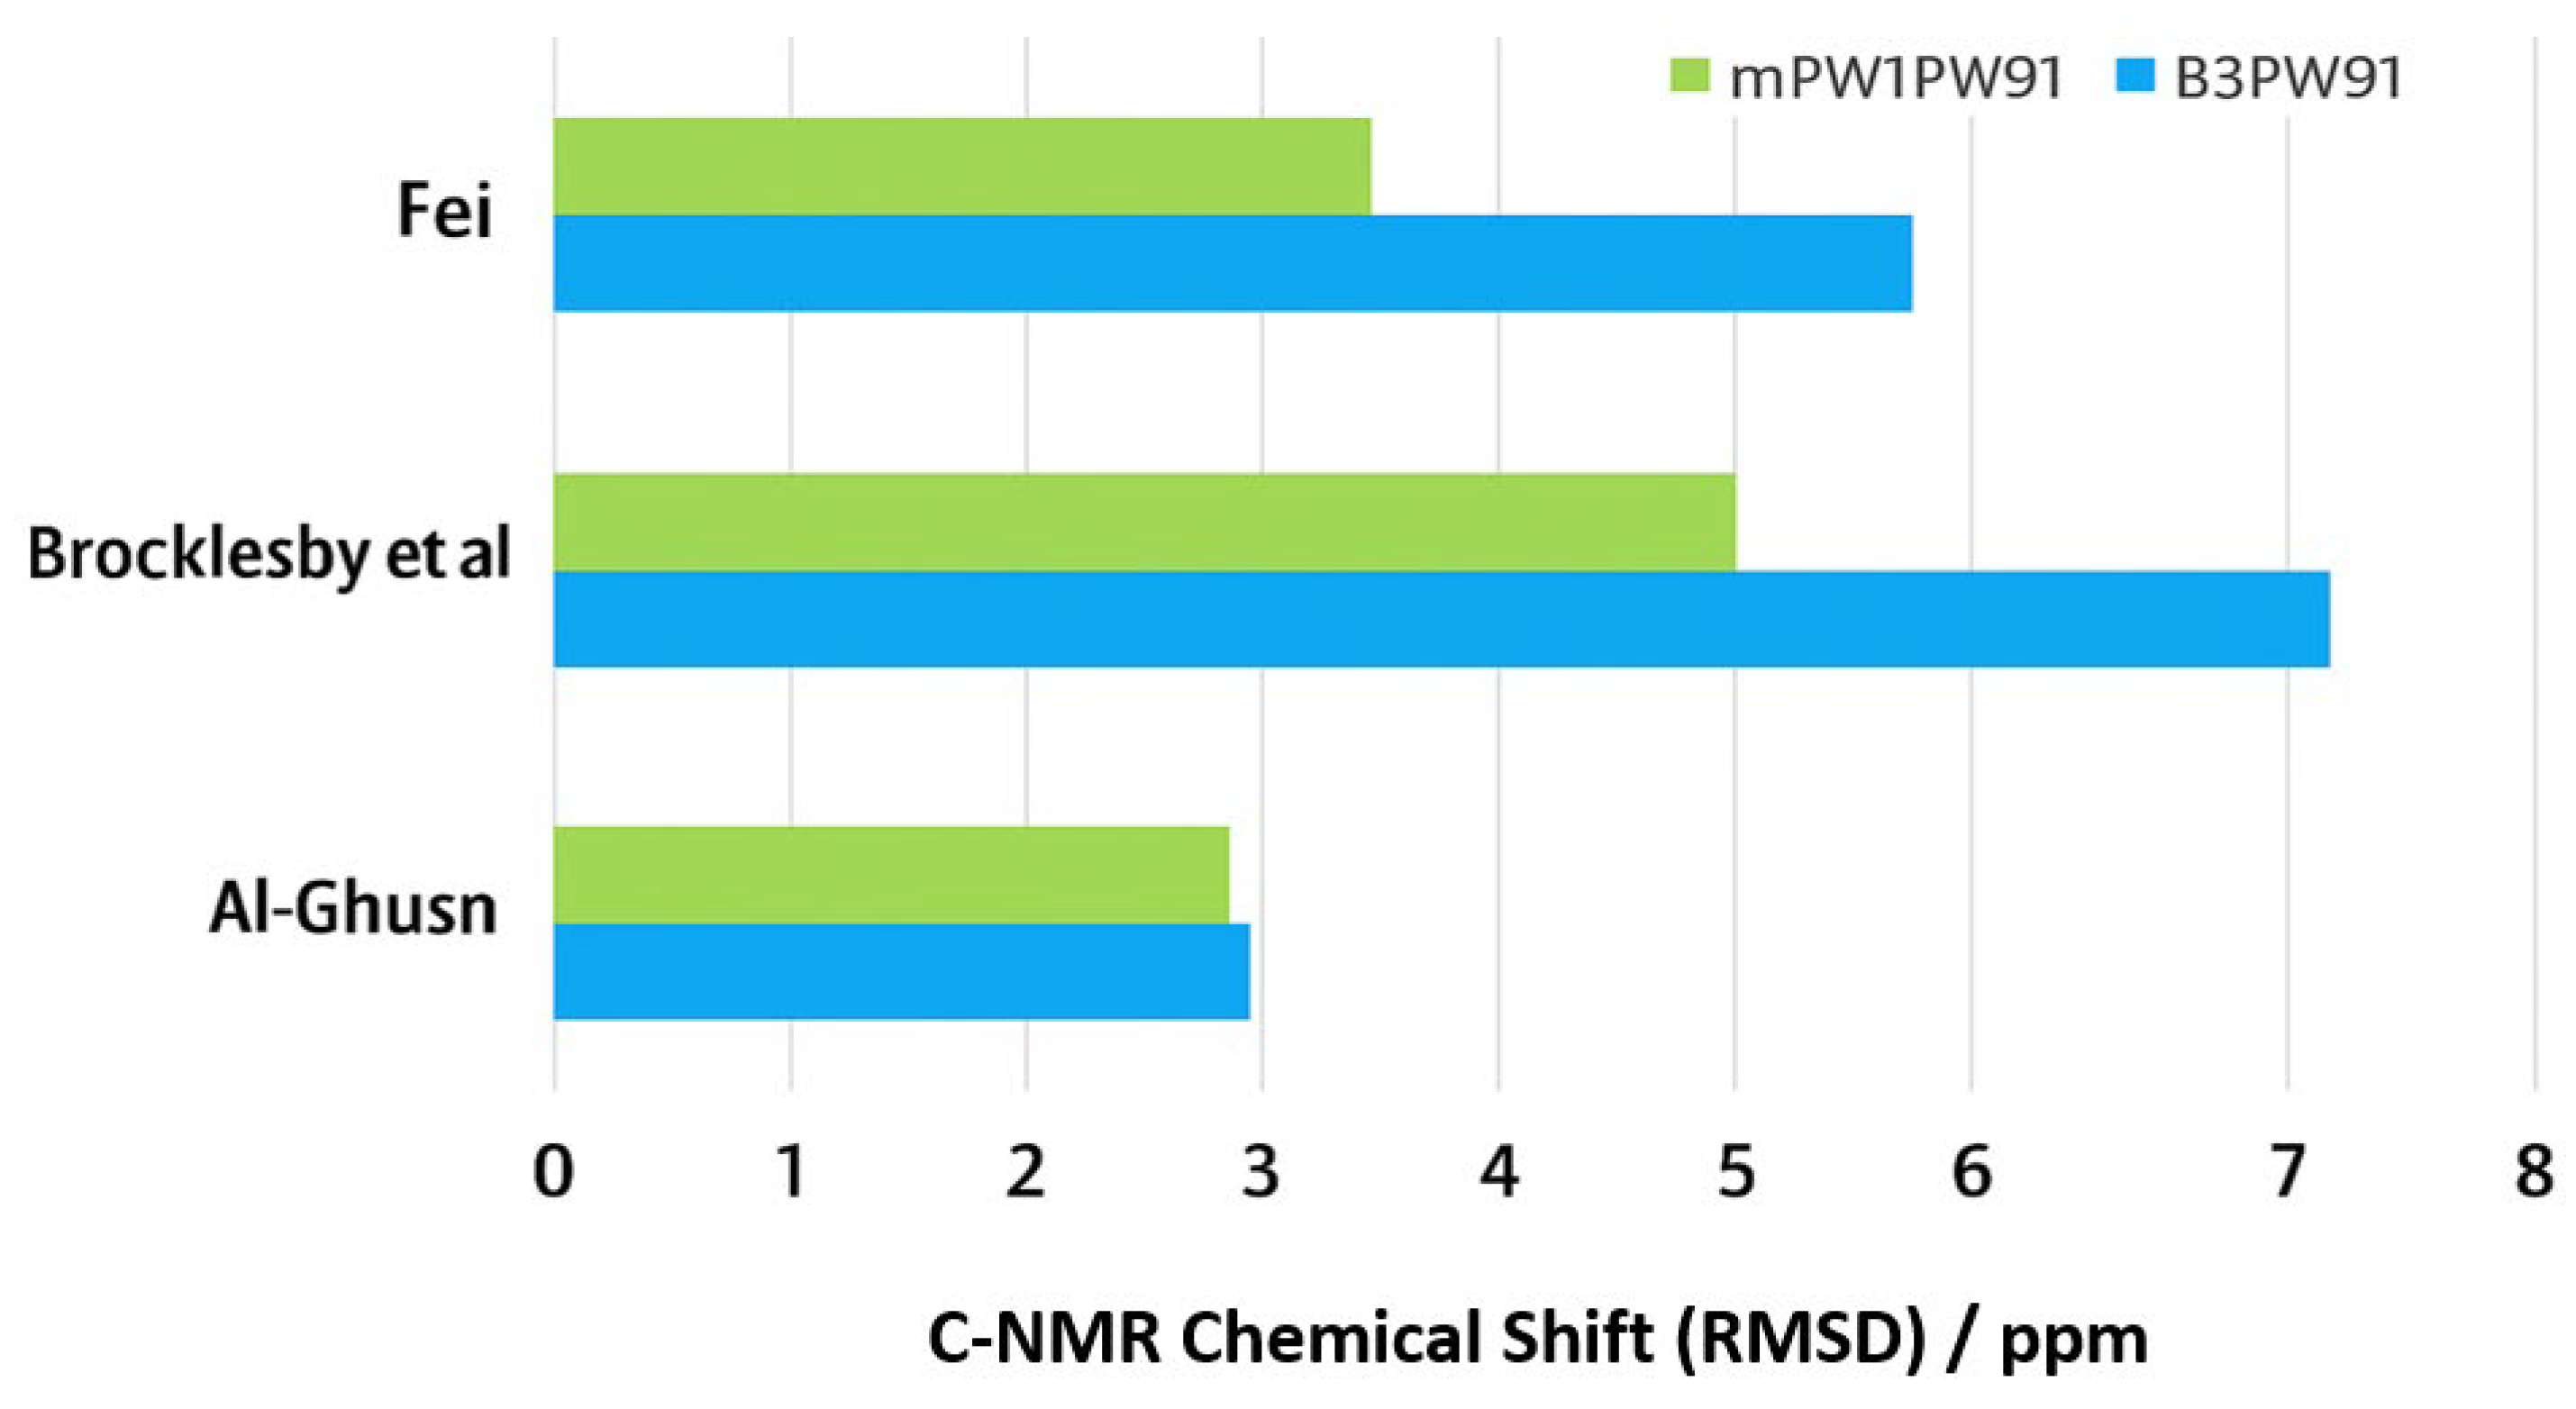
Table 2 summarizes the comparison of calculated carbon chemical shifts for the global minimum structure of VTB, using two exchange functionals, namely B3 and mPW91, combined with the same correlation functional, PW91, against three sets of experimental data. The RMSD values consistently indicate that the mPW91 exchange functional provides better agreement with experiment across all datasets. Specifically, for the experimental data of Al-Ghusn et al. [
17], both functionals show comparable accuracy, with RMSD values of 3.20 ppm (B3PW91) and 3.15 ppm (mPW91/PW91). However, larger differences are observed with the datasets of Brocklesby et al. [
41] and Fei [
40]: B3PW91 gives RMSDs of 7.78 ppm and 5.70 ppm, respectively, whereas mPW91/PW91 achieves significantly lower values of 5.01 ppm and 3.57 ppm.
These results suggest that mPW91PW91 captures the electronic structure of VTB more accurately, particularly for the complex carbon environments found in the heterocyclic and aliphatic regions of the molecule. The improved performance of mPW91 may reflect its modified exchange treatment, which enhances the description of electron delocalization and polarization effects present in VTB. Use of mPW91PW91 may be a more reliable functional combination for predicting 13C chemical shifts for VTB, providing a better basis for QSPR studies and structural characterization of related tyrosine kinase inhibitors.
The
13C-NMR chemical shifts of VTB also reveal two distinct regions that reflect its structural features: aromatic carbons appear at δ
C > 120 ppm, while aliphatic carbons appear at δ
C < 100 ppm. The aliphatic region includes the –OCH
3, –OCH
2–, and –NCH
3 groups and the piperidine ring (R
4). This distribution of carbon chemical shifts in VTB is consistently observed across experimental studies.
Table 2 compares the DFT-calculated δ
C values with experimental datasets from Al-Ghusn et al. [
17], Fei [
40], and Brocklesby et al. [
41]. The calculations use two DFT exchange functionals (V
x), B3 and mPW91, respectively, in combination with the correlation functional of PW91. Notably, Fei et al. employed the advanced DEPTQ (distortionless enhancement by polarization transfer with quadrature) technique, which provides enhanced spectral resolution and allows differentiation of CH, CH
2, CH
3, and quaternary carbons.
In DMSO, the combined DEPTQ and DEPT135 spectra of Fei [
40] demonstrate improved sensitivity and resolution with more accuracy (small RMSD of 3.57 ppm). In contrast, Brocklesby’s measurements [
41] appear to have been conducted under less controlled conditions, without reporting experimental details regarding dynamic averaging or rotameric effects from flexible bonds. This may have led to broader or less distinct peaks, reducing measurement accuracy. Quantitatively, this discrepancy is reflected in RMSD values between experimental and DFT-predicted
13C chemical shifts: 10.79 ppm (B3PW91) and 11.99 ppm (mPW1PW91) for Brocklesby [
41] and 7.78 ppm (B3PW91) and 5.01 ppm (mPW1PW91) after thermal correction versus a significantly lower 5.70 ppm and 3.57 ppm for Fei [
40], underscoring the latter’s superior agreement with theoretical data.
Table 2 organizes the C-NMR chemical shifts as ordered from small to large values, as no assignment in the experiments is available except for a couple of distinct chemical shifts.
Figure S4 in SM visualizes such differences based on each carbon site of VTB.
A closer examination of the calculated δ
C for individual carbon atoms highlights distinct performance patterns between the two exchange-correlation functional combinations across different experimental datasets, as shown in
Figure S4 in the SM. For the Al-Ghusn et al. [
17] dataset (blue), the B3PW91 functional shows larger deviations in the low δ
C region (saturated carbons below 100 ppm), whereas its predictions for carbons with δ
C > 100 ppm are generally more accurate, except for C21, C22, and C23, where significant discrepancies persist. In contrast, the mPW1PW91 functional provides improved accuracy across most carbons in this dataset, though notable deviations (greater than 5 ppm) remain for C13, C16, and C18.
For the Brocklesby et al. [
41] data (green), B3PW91 achieves reasonable agreement for most carbons, with deviations generally within ±5 ppm. However, approximately one-third of the carbons show larger discrepancies, particularly C4, C8, C9, C12, C13, C14, C16, and C23. The mPW1PW91 functional performs better overall in this case, though significant deviations remain for C4, C8, C9, C14, C17, C18, C21, C22, and C23, indicating persistent challenges in accurately predicting shifts for certain carbon environments. In the Fei [
40] dataset (orange), both functionals exhibit a similar overall level of deviation but with a notable observation: the sign of the deviation for many carbons is opposite between the two functionals, suggesting that the exchange functional influences the direction of the chemical shift error rather than its magnitude alone. This reflects subtle differences in how each functional treats electronic shielding and deshielding effects. The comparisons indicate that mPW1PW91 consistently provides better agreement across most carbon atoms. However, both functionals face challenges in accurately modeling shifts for certain carbons, particularly those in flexible aliphatic regions or at sites influenced by long-range electronic effects.
Due to the room-temperature conditions under which the measurements were taken, the rotational flexibility of single bonds likely led to thermally averaged
13C-NMR chemical shifts [
42]. Specifically, in the piperidine ring, dynamic averaging appears to result in three observed carbon signals instead of five distinct chemical shifts in the experimental spectra, as shown in
Table 2. These thermally averaged carbon pairs are indicated by blue and green dashed circles on the molecular structure in
Figure S4 in the SM. When accounting for these averaged pairs, the corrected carbon chemical shifts for VTB—presented in
Table 2—show a notable improvement in agreement with calculated values. However, the accuracy still falls short compared to the more advanced DEPT135 and DEPTQ techniques used by Fei [
40], which provide superior spectral resolution and carbon type discrimination. Both DFT functionals, B3PW91 and mPW1PW91, show consistent accuracy compared with the three available experimental measurements. However, mPW1PW91 yields slightly more accurate results overall, as illustrated in
Figure 6.
The discrepancies between calculated and experimental
13C- and
1H-NMR chemical shifts for VTB and related drug analogues can be attributed to several factors, including experimental temperature, sample purity, and the possible presence of multiple conformers under measurement conditions. In particular, room-temperature measurements allow for free rotation of flexible groups—such as terminal methyl (-CH
3) groups—which leads to three-fold signal degeneracy due to rapid conformational averaging [
42]. These dynamic effects can obscure or merge chemical shifts in the spectrum, complicating signal assignment [
42]. Robust quantum mechanical calculations allow for the identification and energy ranking of multiple low-energy conformers, providing a more comprehensive and accurate foundation for interpreting thermally averaged NMR experimental data. This ensures the critical importance of integrating experimental and computational approaches in NMR studies. While experimental measurements alone may result in misassignments due to unresolved averaging effects, DFT-based calculations offer a rigorous framework for deconvoluting overlapping signals, validating spectral assignments, and ensuring structural accuracy.
The
13C-NMR (TMS),
14N-NMR (NH
3), and
17O-NMR (H
2O) chemical shifts δ
C of VTB (global minimum structure) based on DFT mPW1W91/6-311++G(d,p) calculations in DMSO solvent are given on the structure of VTB in
Figure S6. The Mulliken charges of the non-hydrogen atoms, which are calculated using the same level of theory, are displayed by color in this figure.
As shown in the results in
Table 2 and the assignments in
Figure S6, the aromatic
13C NMR chemical shifts of VTB are well separated from the aliphatic ones, with aromatic carbons appearing at δ
C > 90 ppm and aliphatic carbons at δC < 70 ppm. The most deshielded carbons (δ
C > 140 ppm) are located in the aromatic ring and are directly bonded to electronegative atoms such as nitrogen (N), oxygen (O), and fluorine (F). Additionally, the carbon atoms in VTB exhibit either positive (green) or negative (red) Mulliken charges, depending on their bonding environments. Generally, the more negative the Mulliken charge on a carbon atom, the more shielded it is; conversely, the more positive the charge, the more deshielded its chemical shift. For example, the most deshielded carbon atom (δC = 153.92 ppm) is the carbon in the quinazoline ring that is bonded to the –O–CH
2– bridge.
The
14N NMR chemical shifts (δ
N) provide valuable insights into the chemical environment and electronic structure of nitrogen atoms in pharmaceutical inhibitors. In VTB, the four nitrogen atoms occupy distinct chemical environments, leading to well-differentiated δ
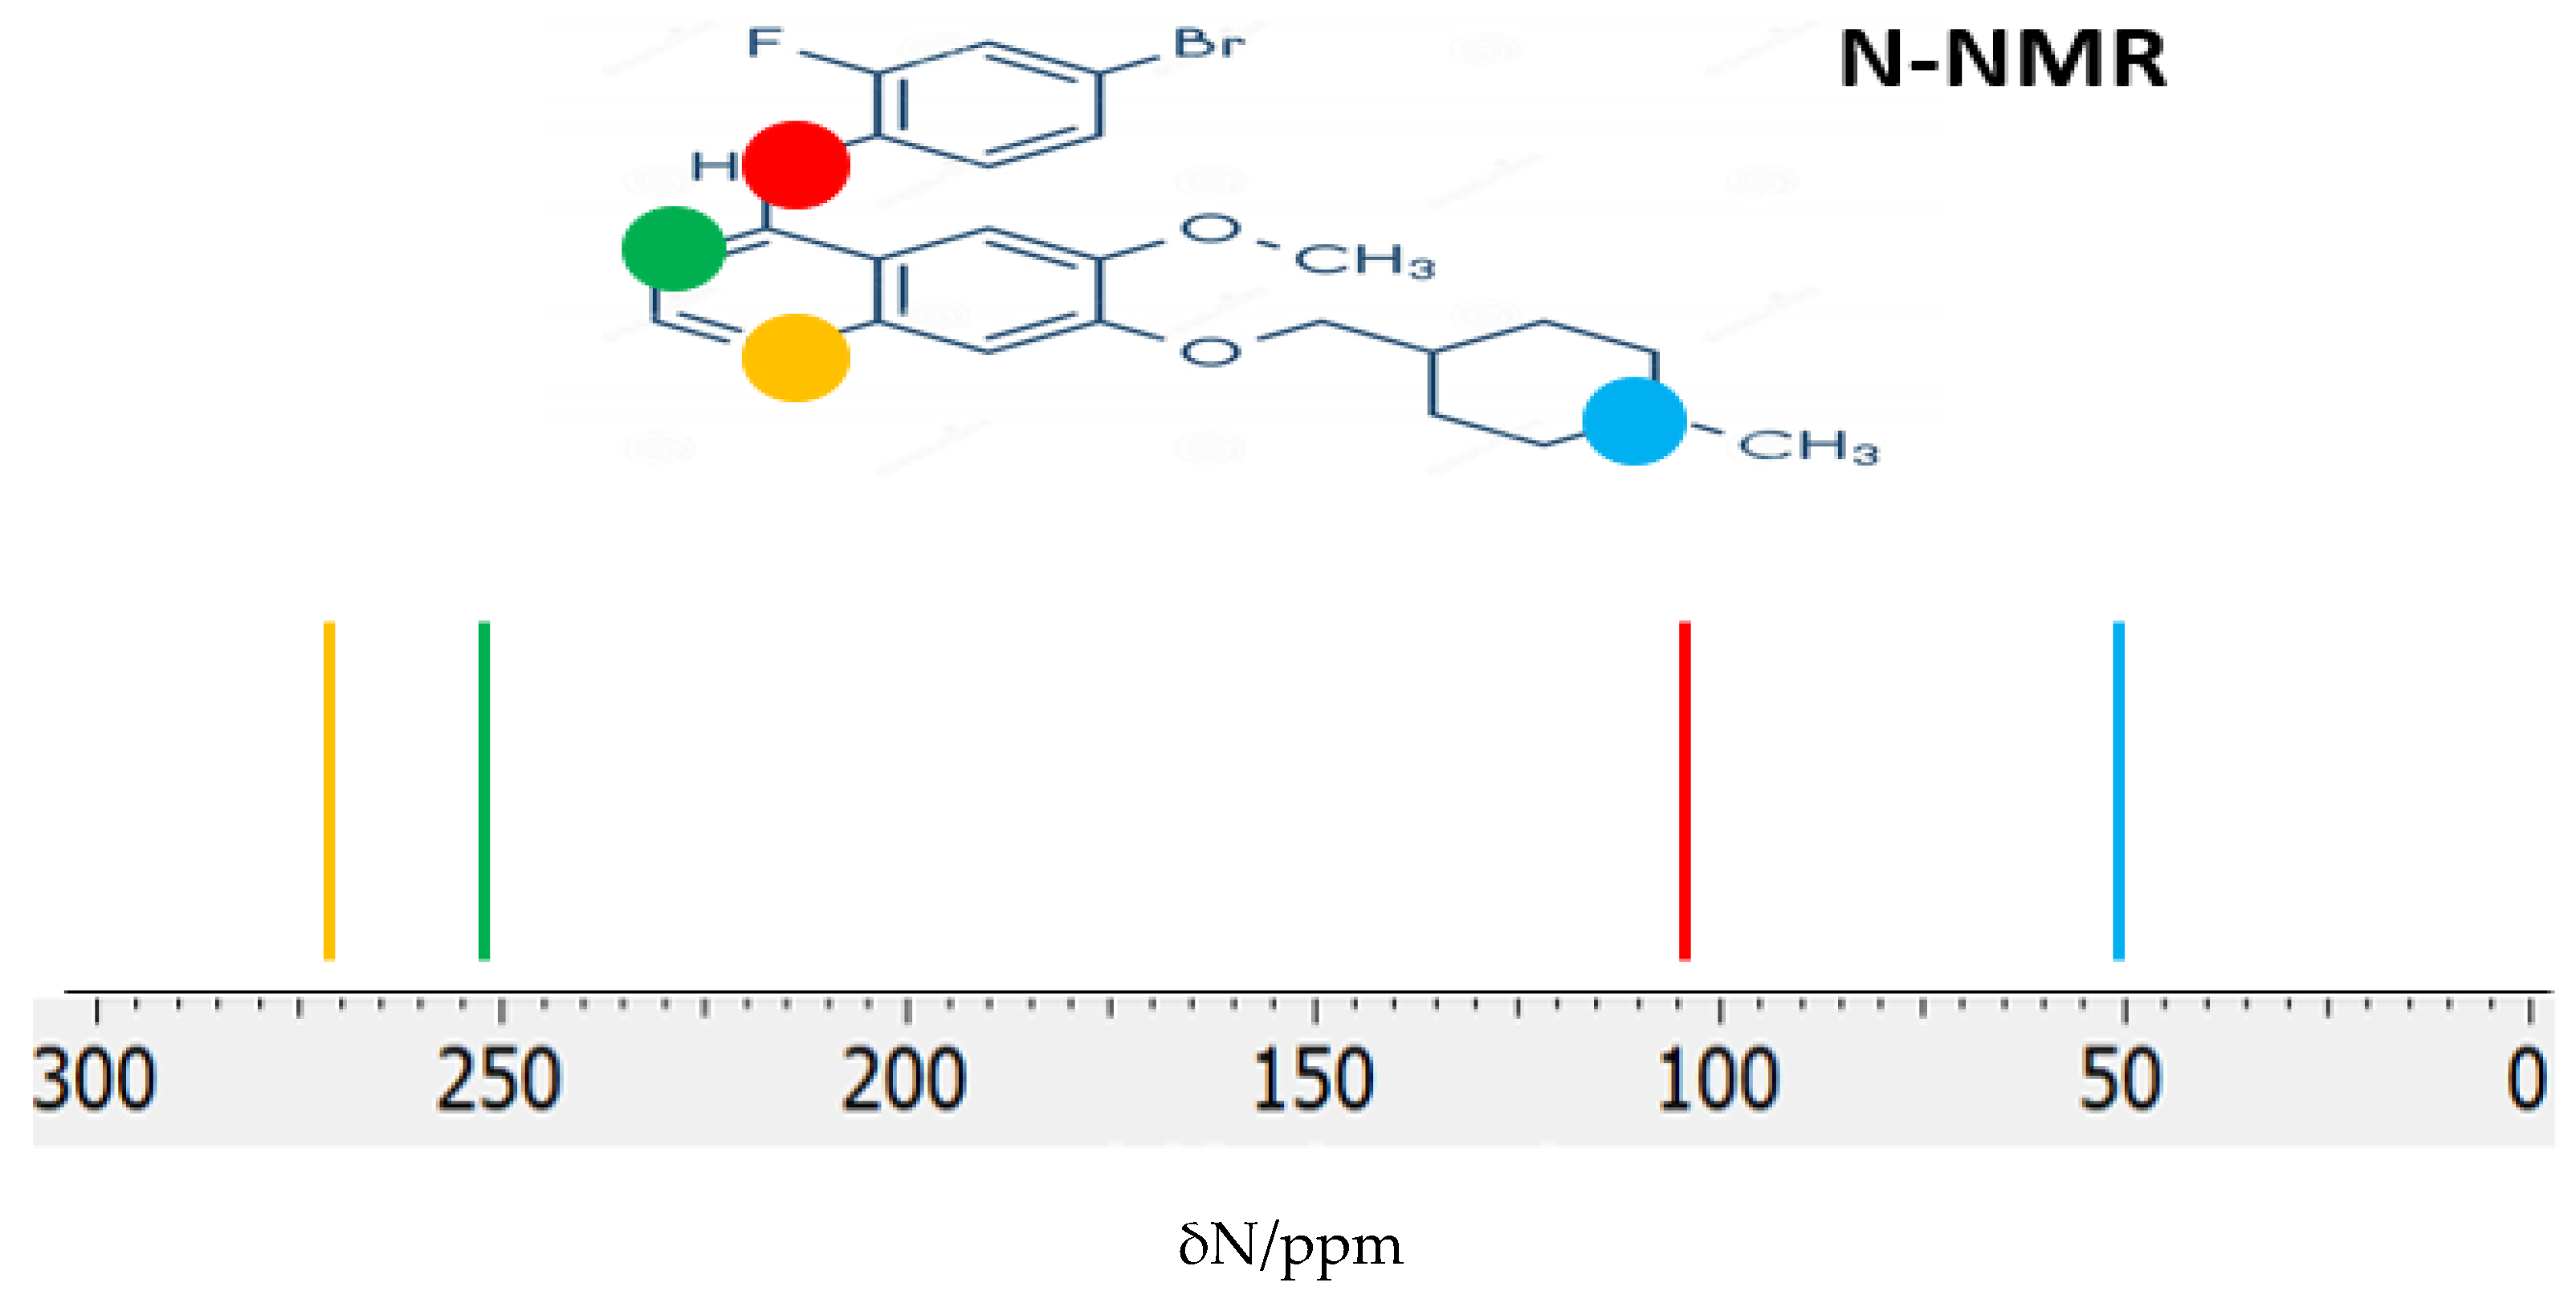
N values in the calculated
14N NMR spectrum (
Figure 7). For the global minimum structure, the predicted δN values are 274.15 ppm, 250.89 ppm, 110.27 ppm, and 53.04 ppm, corresponding to the nitrogen atoms in the quinazoline ring, the bridging secondary amine (-NH-), and the piperidine nitrogen, respectively. In these calculations, ammonia (NH
3), with a shielding constant σ
N = 258.4 ppm, was used as the reference compound for determining the chemical shifts. These distinct δ
N values reflect the varying degrees of electron density and local chemical environments surrounding each nitrogen atom, consistent with their roles in the molecule’s aromatic and aliphatic regions.
2.3. UV–Vis Spectra of Low-Lying Vandetanib
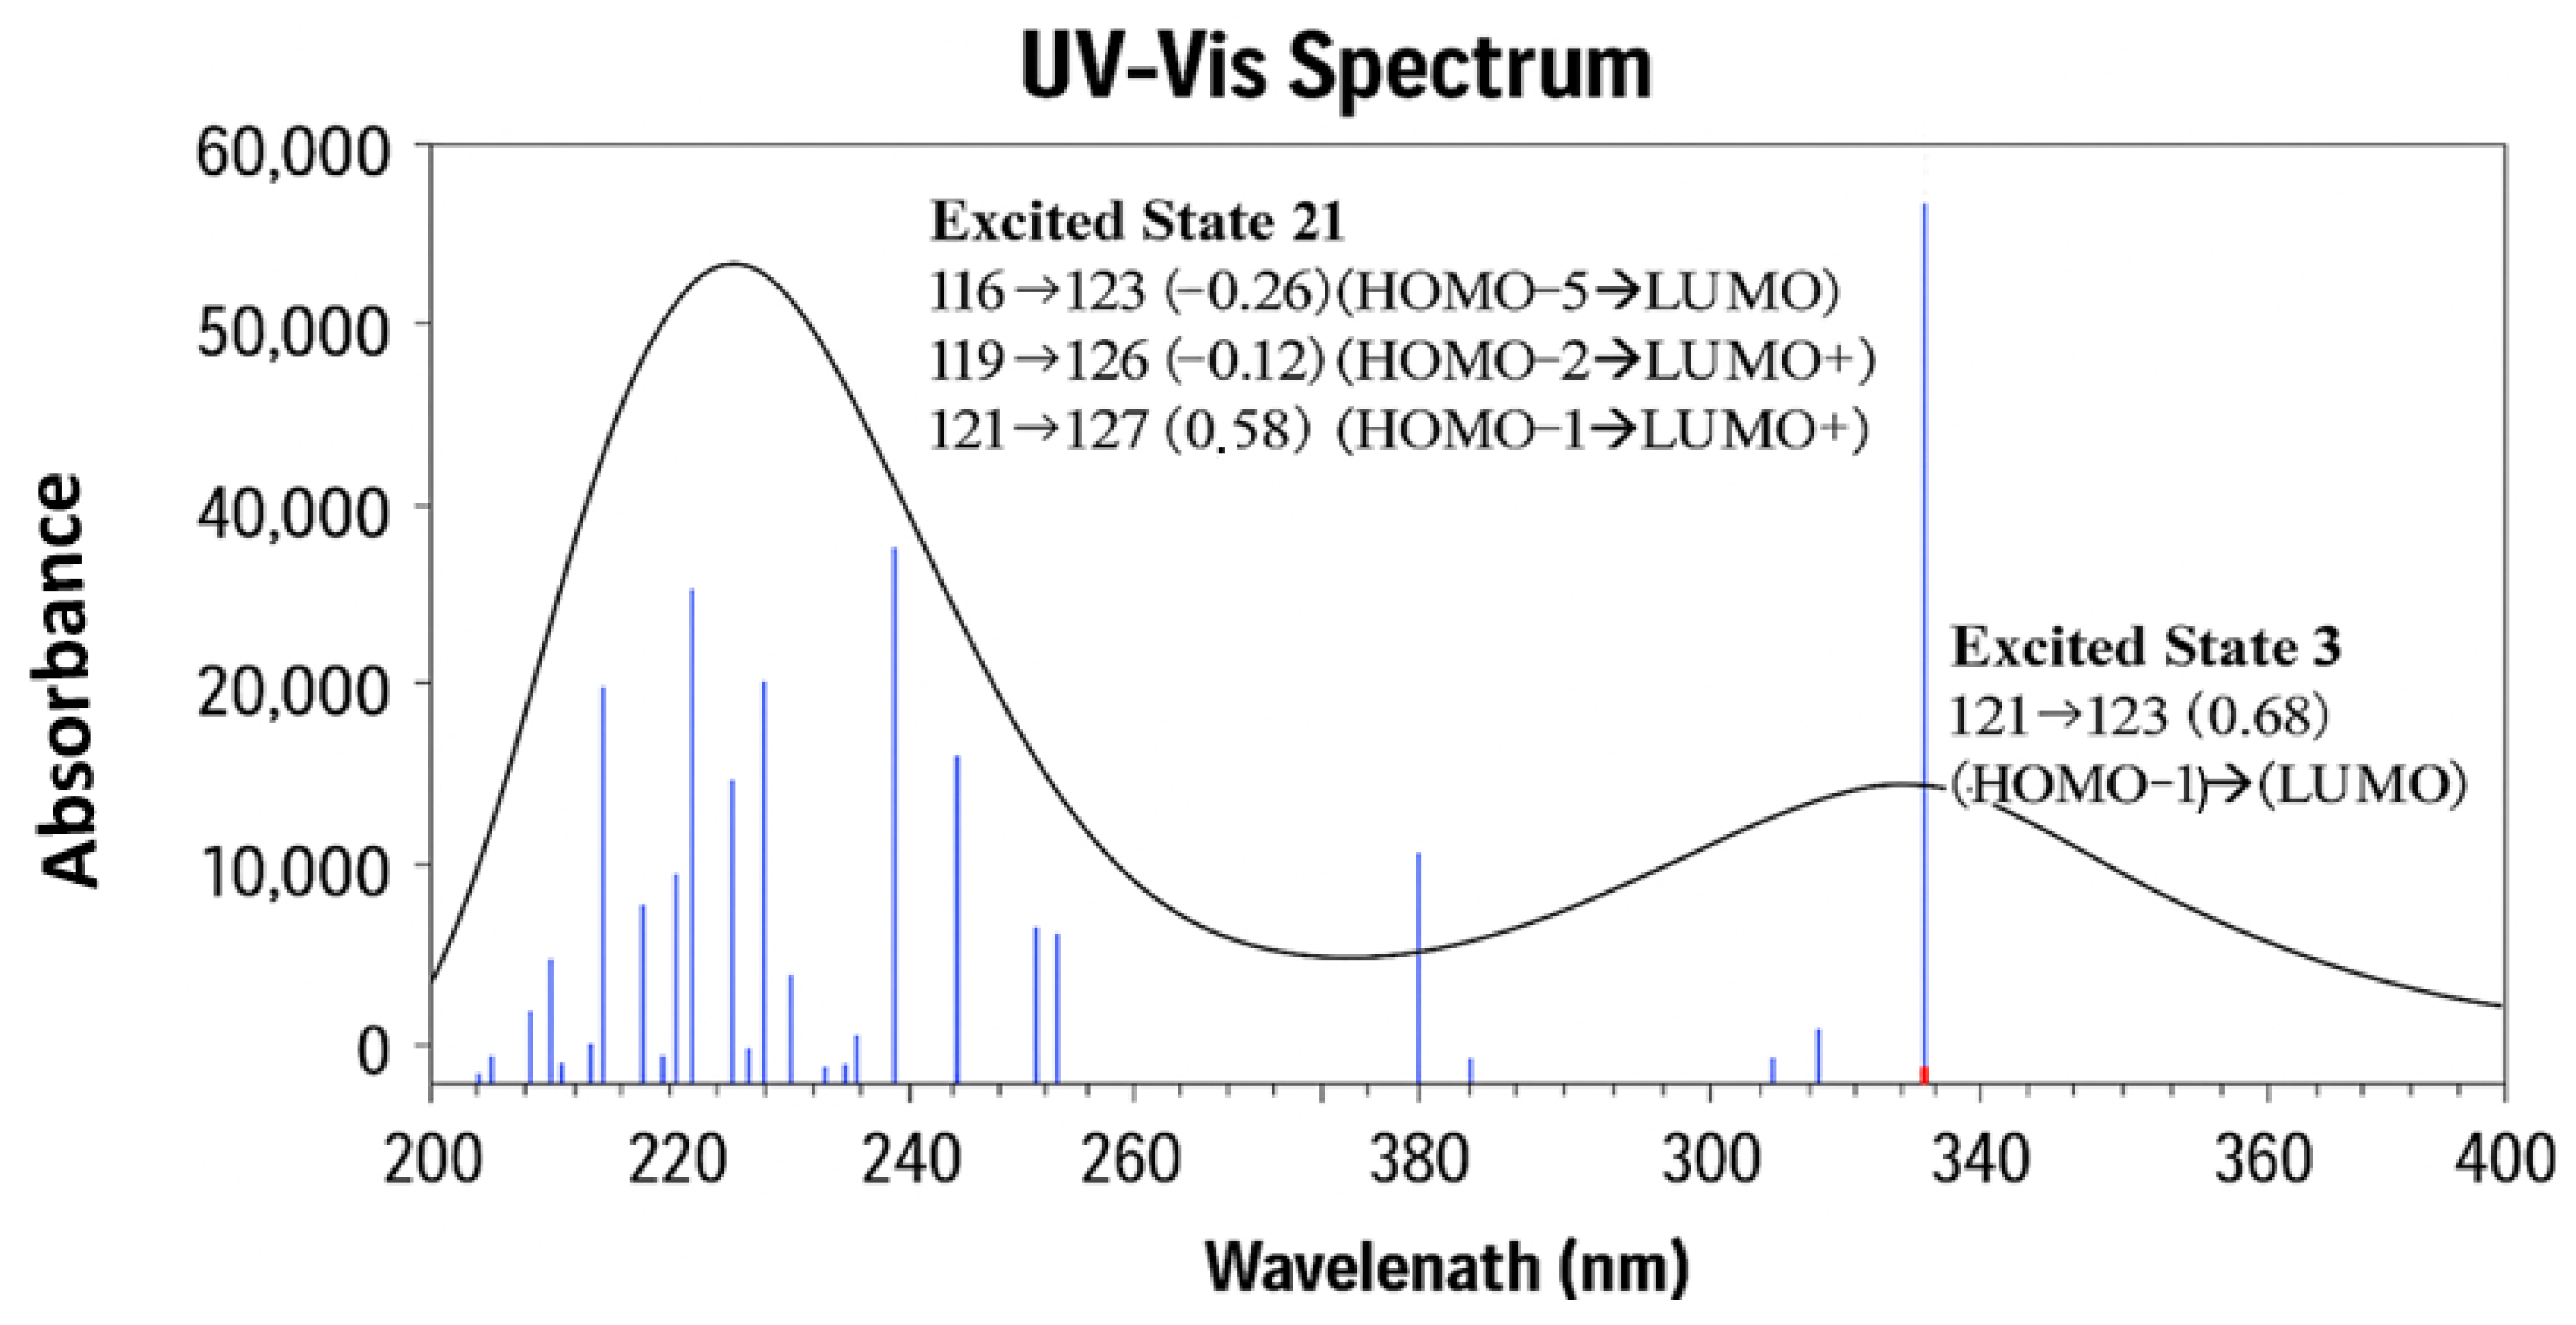
The UV–visible absorption spectrum of the global minimum conformer of VTB was calculated using the DFT B3PW91/6-311++G(d,p) method, incorporating methanol. As shown in
Figure 8, the calculated UV–vis spectrum in the 200–400 nm range reveals two characteristic absorption bands that correspond to the key electronic transitions of the molecule’s aromatic (R1, R2, and R3) and heterocyclic (N-methyl piperidine (R4)) systems. The primary absorption band (λ
max) is predicted at 339.65 nm, corresponding to an
n → π* charge transfer (CT), predominantly localized on the N-methyl piperidine ring (R4) to the quinazoline and substituted aniline fragments (R1-R3). This primary band is attributed to a single dominant electronic excitation, as illustrated by the excitation contributions in
Figure 9. Importantly, this calculated absorption is in excellent agreement with available experimental data, which report similar λ
max values of 339 nm [
40], 328.44 nm in methanol [
16,
38], and 330.31 nm [
17] in methanol mixtures. The absence of significant absorbance beyond 350 nm confirms that VTB lacks extended chromophores absorbing in the visible region, a finding consistent with its molecular structure, which contains a moderately conjugated aromatic system without extended delocalization sufficient to shift absorptions into the visible range.
The secondary absorption band (λ′
max) is calculated at 243.48 nm, located in the deep UV region. Unlike the primary transition, which is dominated by a single strong transition, this band arises from a collection of several closely spaced electronic excitations, likely involving both π → π* and potential
n → π* CT transitions associated with different regions of the molecule, including non-bonding electrons on heteroatoms. The composite nature of this band is clearly shown in the spectrum, where multiple transitions contribute to its intensity. This region also aligns well with experimental observations, where the corresponding absorptions were reported at 255 nm by Fei [
40] and 249 nm by Al-Ghusn et al. [
17].
It is noted that the transitions associated with these two bands do not contain HOMO (MO122)-LUMO (MO123) transitions; rather, they involve other orbitals. Although the calculated low-lying excited states, such as excited states 1 and 2, are dominated by transitions of HOMO (MO122) to LUMO+1 (MO124) at 487.71 nm and of HOMO (MO 122) to LUMO (MO 123) at 420.46 nm, the oscillator strength of the transitions are very small at f = 0.0017 and f = 0.0001, respectively.
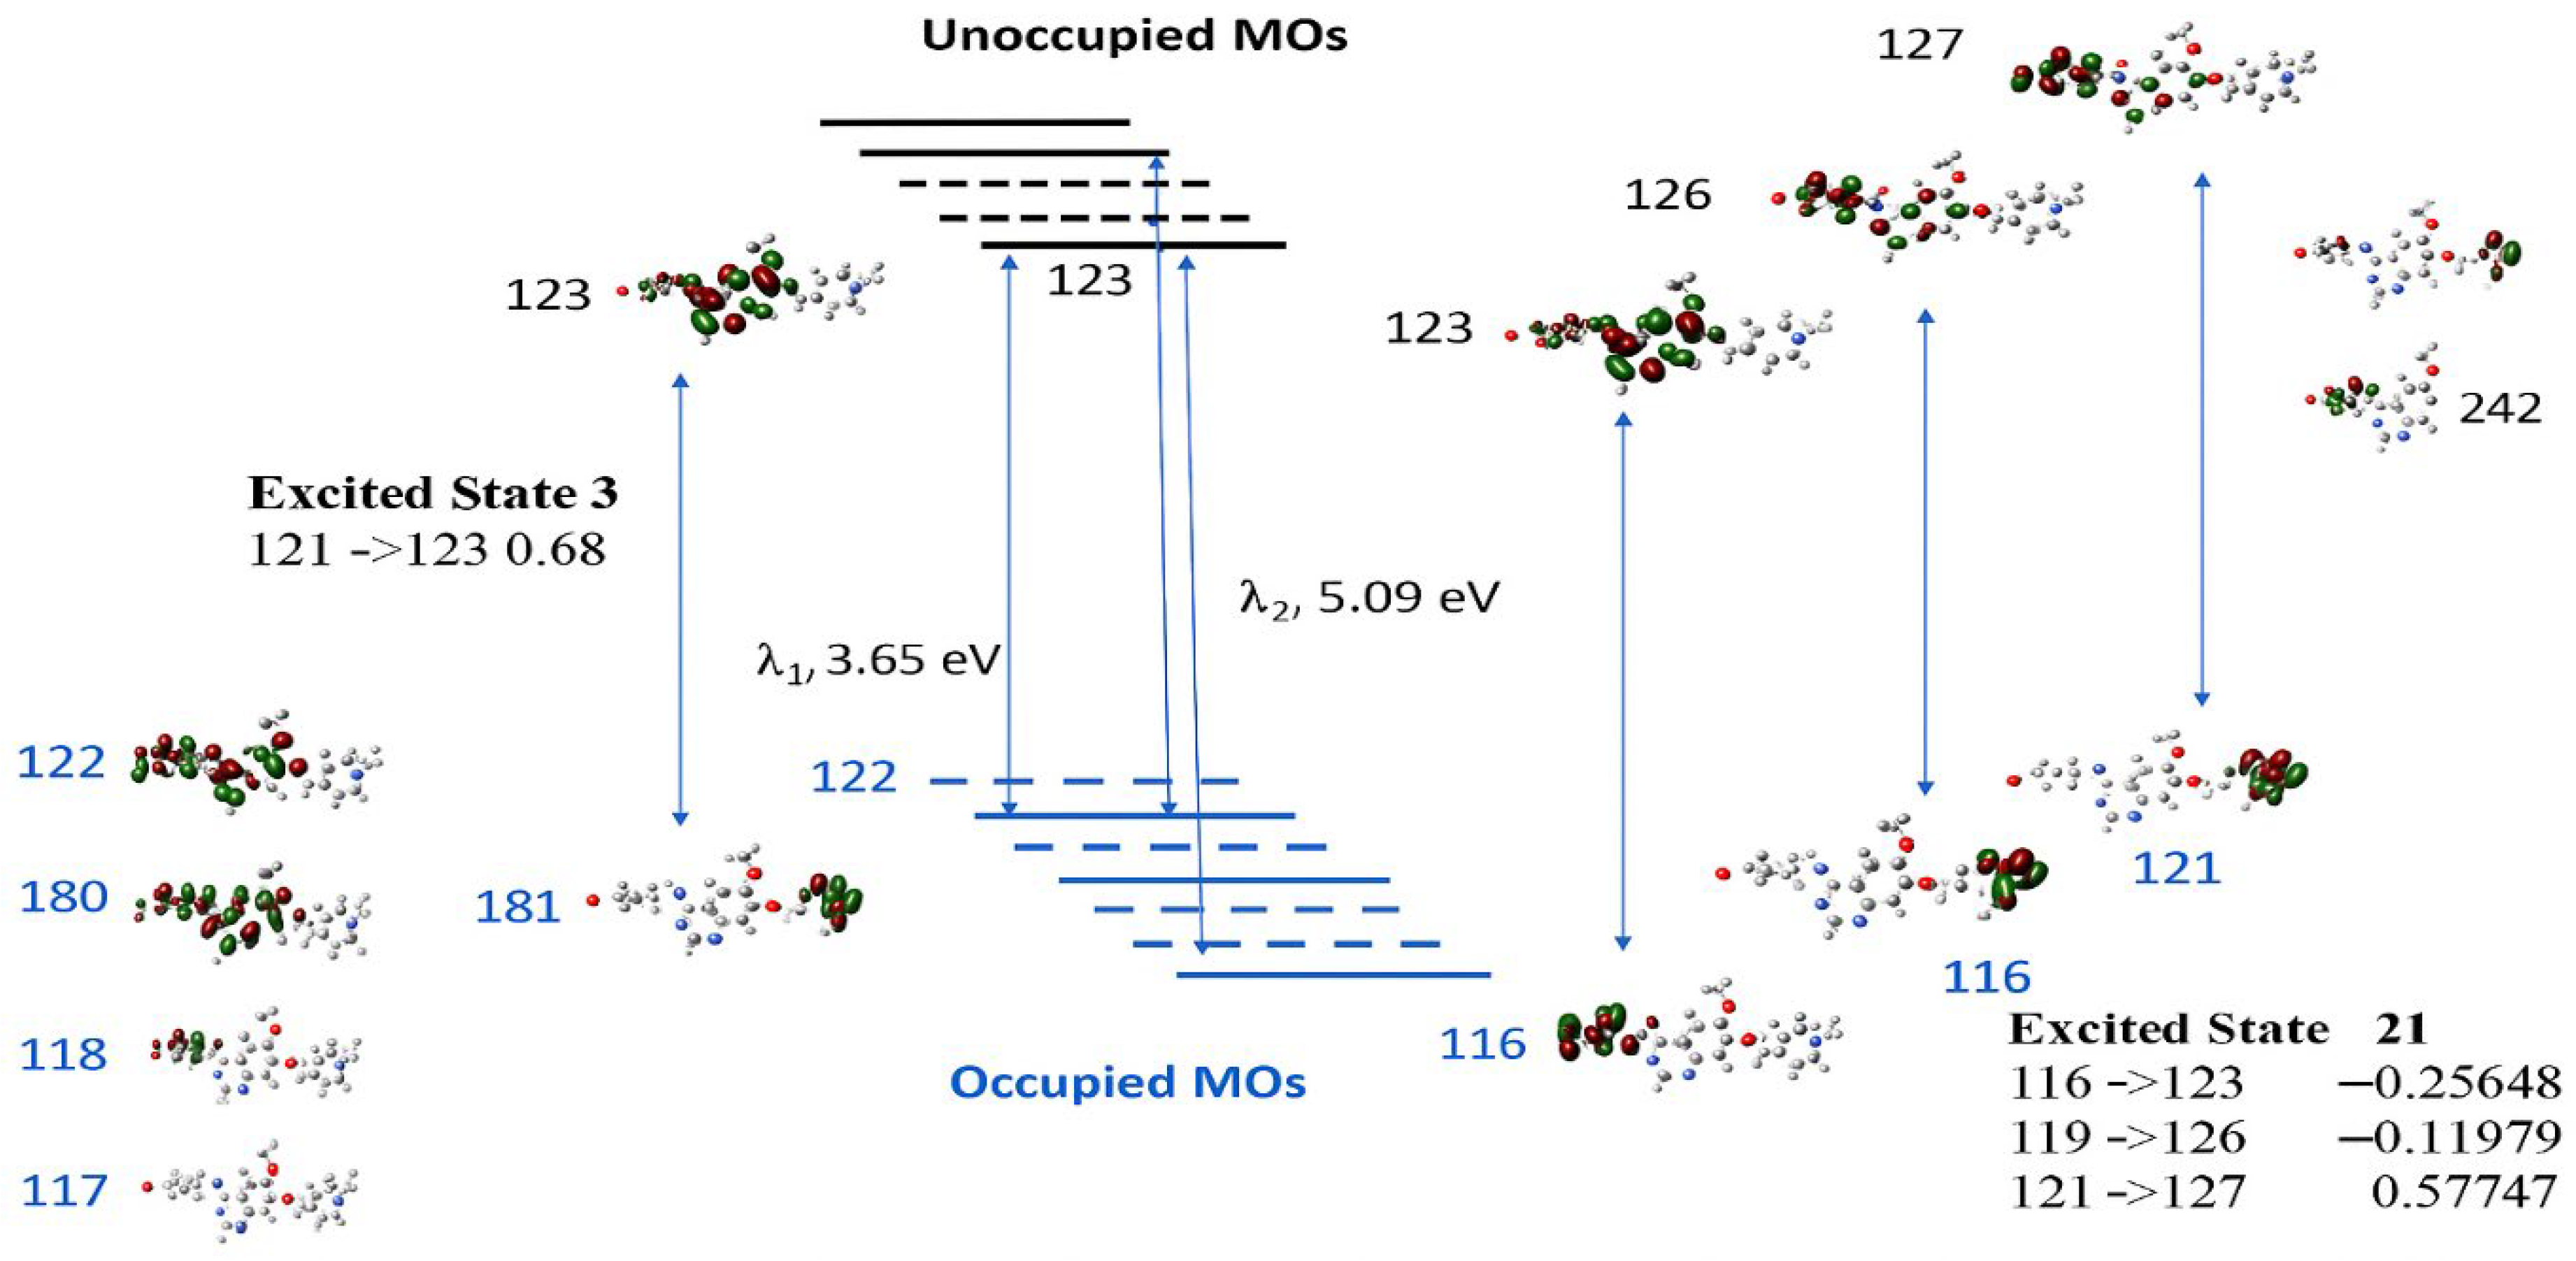
Figure 9 presents the collected information on the two major UV–vis transitions of VTB, calculated at the same DFT level of theory. A detailed analysis of these electronic transitions reveals the underlying orbital contributions that define the photophysical behavior of VTB. The primary absorption band, calculated at 339.65 nm (excited state 3, 3.65 eV, corresponding to a maximum oscillator strength f = 0.3878), indicates an intense, allowed transition. This excitation is primarily composed of transitions from HOMO–1 (MO 121) to LUMO (MO 123), with a major contribution (coefficient = 0.68), and a smaller contribution from HOMO-5 (MO 117) to LUMO 123 (0.10).
Although MO 122 is identified as the HOMO, the primary absorption arises predominantly from the HOMO–1 (MO 121) → LUMO (MO 123) transition rather than a direct HOMO → LUMO excitation. Both the HOMO and LUMO are primarily localized on the anilino-quinazoline rings (R1–R3), so a direct HOMO → LUMO transition would involve minimal spatial separation and therefore limited charge transfer (CT). In contrast, HOMO–1 (MO 121) is mainly localized on the N-methyl piperidine ring (R4), while the LUMO (MO 123) is centered on the quinazoline moiety (R2–R3). This spatial separation between the donor and acceptor orbitals facilitates a strong CT transition. Specifically, the HOMO–1 → LUMO excitation represents a redistribution of electron density from the aliphatic piperidine fragment to the aromatic quinazoline system, which enhances the CT character and contributes significantly to the intensity of the primary absorption band (see
Figure 9).
The secondary absorption band, calculated at 243.48 nm (excited state 21, 5.09 eV,
f = 0.2516), is more complex and arises from multiple orbital contributions. The dominant excitation is from HOMO–1 (MO 121) → LUMO+4 (MO 127), with a significant coefficient of 0.58, accompanied by smaller contributions from HOMO–6 (MO 116) → LUMO (MO 123) (−0.26), HOMO–3 (MO 119) → LUMO+3 (MO 126) (−0.12), and HOMO–1 (MO 121) → LUMO+5 (MO 128) (−0.10). As illustrated in
Figure 9, these excitations involve transitions from orbitals significantly deeper than HOMO–1 (e.g., HOMO–6 and HOMO–3) to higher-energy unoccupied orbitals (LUMO+3 to LUMO+5). A common feature among these transitions is the spatial separation of the electron densities between the involved molecular orbital pairs, which facilitates effective charge transfer (CT). Similar to the primary absorption transition, the MOs involved in this band are localized in distinct molecular regions: the occupied orbitals are predominantly situated on the piperidine ring (R4) or the halogen-substituted phenyl ring (R1), while the unoccupied orbitals are localized on the quinazoline moiety (R2–R3). This clear donor–acceptor separation enables substantial intramolecular charge transfer upon excitation, contributing to the overall intensity and character of the secondary UV absorption band.
A comparative analysis of the UV–vis absorption spectra of several clinically relevant EGFR tyrosine kinase inhibitors (TKIs)—vandetanib, gefitinib, dacomitinib, and afatinib—reveals consistent spectral features that reflect their shared halogenated anilino-quinazoline core structure. As shown in
Table 3, all compounds exhibit two characteristic absorption bands: a primary absorption band (λ
max) in the UVA region (~330–343 nm) and a secondary band in the UVB region (~244–261 nm). Specifically, the obtained primary absorptions are centered around 339 nm for VTB, 332 nm for gefitinib [
43], 343 nm for dacomitinib [
44], and 340 nm for afatinib [
45,
46]. These transitions are typically dominated by π(
n) → π* excitations involving the conjugated quinazoline and aniline π-systems, which are structurally conserved across the series. The similarity in these λ
max values suggests that the electronic transitions are governed largely by the extended π-conjugation and electron-withdrawing effects of the halogen substituents, which modulate the frontier molecular orbitals in a consistent manner.
The secondary UVB absorption bands, observed between 244 and 261 nm, are more variable in energy and likely arise from higher-energy π → π* or n → π* transitions involving non-bonding electrons on heteroatoms (e.g., nitrogen and oxygen) in different peripheral groups or side chains. The slight differences in λ′ₘₐₓ among the TKIs may reflect variations in the substituent electronics or conformational flexibility beyond the conserved core. This pattern of UV–vis absorption confirms that the halogenated anilino-quinazoline scaffold acts as a chromophoric unit responsible for consistent UVA absorption across EGFR-TKIs. This also explains the common occurrence of photosensitivity side effects in this drug class, as their strong UVA absorption allows them to be photoactivated under ambient light conditions, potentially generating reactive intermediates. The UVA absorption of VTB is driven by CT, while the UVB band arises from a combination of deeper electronic excitations within the molecular framework. These insights provide a mechanistic explanation for VTB’s photochemical reactivity under UVA light, contributing to its photosensitivity side effects. Understanding these photophysical similarities may guide the design of next-generation TKIs with reduced phototoxic risk while retaining EGFR-targeting efficacy.
The similarity in the absorption features across multiple conformers (
Figure S5 in SM) indicates that VTB retains its electronic characteristics regardless of conformational differences, suggesting that its UV absorption is dominated by the aromatic and heterocyclic chromophores common to all conformers. The calculated λ
max and λ′
max values support the photochemical stability of VTB in the UVB and UVA regions, although the presence of absorption in the UVA range also correlates with its reported photosensitivity side effects, likely due to photoexcitation-induced reactive species generation.
From a pharmacological perspective, VTB’s conformational flexibility and photophysical properties may also relate to its dual-target inhibitory activity. The dominant low-energy conformers (Conformers 01 and 02, together accounting for over 90% of the conformational population) exhibit UV absorption features closely matching the experimental values. These conformers present the molecular geometry necessary for binding the ATP-binding site of EGFR, a well-established mechanism of action. Additionally, computational studies have suggested that VTB could interact with viral proteins, such as the SARS-CoV-2 main protease (Mpro) or spike protein, through flexible side chains adapting to distinct binding pockets. The presence of multiple low-lying conformers provides a structural basis for such adaptability, enabling VTB to act as a dual inhibitor of both human tyrosine kinases and viral enzymes.
Vandetanib is known to cause photosensitivity reactions in some patients [
47], and its UV–vis absorption spectrum provides a molecular basis for this side effect. The spectrum of VTB shows two prominent absorption bands: one in the UVB region (~250 nm) and another in the UVA region (~340 nm) [
48]. The 250 nm band corresponds to high-energy π(
n) → π* transitions within the aromatic and heterocyclic systems of the quinazoline and aniline moieties. More importantly, the absorption at 340 nm falls within the UVA region (320–400 nm), which overlaps with the wavelengths present in sunlight that penetrate the Earth’s atmosphere and human skin [
47].
This suggests that upon UVA exposure, VTB can absorb solar radiation and enter excited electronic states, potentially leading to the generation of reactive oxygen species (ROS) or photoinduced chemical reactions in the skin [
47]. These photochemical processes can damage cellular components and trigger inflammatory responses, resulting in the photosensitivity symptoms reported in clinical use. Therefore, the UV–vis absorption profile of VTB provides a mechanistic explanation for its photosensitivity side effect, underscoring the importance of photoprotection measures, such as avoiding sun exposure or using broad-spectrum sunscreens, during treatment.
