2.2. Cellular Internalization of siRNA Formulations
We quantified cell uptake by flow cytometry using two different indicators, each of which would provide important information: average mean fluorescence in the cell population, and percentage of the cells that were deemed to be fluorescent (siRNA) “positive”, considering the defined gates. While the percentage of cells positive for a fluorescent signal reveals how widely the delivery system has accessed the cells in the population, the mean fluorescence provides a measure of the total amount of siRNA delivered to the population. The mean fluorescence is especially helpful for the runs that are more efficient and would not be differentiated once the percentage of siRNA-positive cells reaches saturation (i.e., 100%). We decided to use both sets of data as CQAs for better conclusions, as they were also significantly correlated (correlation factor (R) = 0.65;
p value = 0.001;
Figure 1C).
Figure 1 summarizes the results of the cellular internalization experiments for the 29 runs in breast cancer cells. While some runs did not create a significant mean fluorescent signal (no/little internalization), others showed significant internalization efficiency. Cells exposed to run 22 showed the highest mean fluorescence (~2630 A.U.), while runs 28 and 29 showed the second and third highest mean fluorescence in MDA-MB-231 cells (1767 and 1560 A.U., respectively;
Figure 1A). On the other hand, most of the runs showed a significant percentage of cells positive for the siRNA fluorescence signal (>90%), except for a few runs with a low percentage of fluorescence-positive cells (<20%;
Figure 1B). The 3D response surface plots represent the trend in changes in the two evaluated sets of data (
Figure 1D,E) based on three variables: mole fraction of phospholipid I (DOPE or DSPCE), phosphatidylcholine, and cholesterol (A, B, and C). The mole fraction of ionizable lipid (Dlin-MC3-DMA or ALC-0315) was kept constant at 0.15 for the sake of comparisons. The 3D plots clearly indicate a more significant impact of the phospholipid I mole fraction on the cellular internalization, since an increase in mole fraction of DOPE or DSPC from ~0.35 to > 0.5 increased both mean fluorescent and percentage of fluorescent-positive cells in all possible combinations, while the mole fraction of cholesterol and phosphatidylcholine did not vary significantly among the runs with the highest and lowest internalization. A lower mole fraction for phosphatidylcholine indicated a better internalization in all four combinations; however, a consistent trend was not observed for the cholesterol.
We performed an analysis to investigate any potential correlations between the mole fraction of the LNP components and the two indicators of the cellular internalization, which are summarized in
Supplementary Figure S1. There was no significant correlation between the mole fraction of any of the four LNP components and mean fluorescence or percentage of the siRNA-positive cells. This was expected, because the variation among the runs is not limited to one factor, and therefore, a simple correlation study might not reveal the effect of the mole fraction of each component. A comparison between the cellular internalization and the runs incorporating DOPE vs. the runs with DSPC did not reveal a statistical difference either, which is perhaps due to the large variability in the data sets (
Supplementary Figure S1I,J). Interestingly, exposing the MDA-MB-231 cells to Dlin-MC3-DMA containing runs showed a significantly higher percentage of siRNA-positive cells compared to ALC-0315 containing runs (82% vs. 47.6% average, respectively;
p-value < 0.005). A similar trend was also observed in the mean fluorescence of the two data sets (739 vs. 284 A.U.); however, the difference barely missed the significance threshold (
p value = 0.053).
These findings were particularly interesting since they go against the observations in two recent reports. An in vitro study on delivering self-amplifying RNA (saRNA) and mRNA showed a better performance of ALC-0315 over the Dlin-MC3-DMA in terms of maximizing protein expression [
25]. Also, an in vivo study with C57BL/6J mice aiming to compare siRNA delivery by LNPs containing the two ionizable lipids reported that LNPs incorporating ALC-0315 silenced coagulation factor II and ADAMTS13 2- and 10-fold more than the LNPs with Dlin-MC3-DMA [
26]. However, this study also reported a higher hepatotoxicity (observed as an increase in ALT) for the LNPs that contained ALC-0315, possibly indicating higher uptake.
The statistical analysis performed by Design Expert highlighted that the model effectively captured significant interactions influencing the percentage of the siRNA-positive cells, with good explanatory power as indicated by the adjusted and predicted R
2 values. However, in analyzing the mean fluorescence data, the software reported a negative value for coefficient for DE (ionizable lipid and the choice of the phospholipid I). Despite this limitation to the explanatory power of the model, it still captured significant relationships and was a statistically significant model (
p = 0.0017;
Supplementary Table S2 for a summary of analysis).
2.3. Cytotoxicity Assessment of siRNA Formulations
Toxicity is one of the limiting factors for nucleic acid delivery systems. For example, high-molecular-weight (i.e., 20,000 Daltons) PEI was once considered gold standard in this regard; however, toxicity of these polymers has marred their considerable efficacy [
27]. In fact, a reverse relationship between the efficacy and toxicity among the PEIs with varying molecular weights is known. To include the toxicity into the CPPs, and considering the multicomponent nature of the nanoparticles, we decided to plot the cell viability of different study groups against the final amount of siRNA exposed to MDA-MB-231 cells (in nanomoles), which was calculated based on the volume of LNP dispersion added to the wells and the concentration of siRNA in LNP dispersion. With this approach, the concentration of all the components forming the LNPs were varied among the study groups with the same proportion.
Figure 2 summarizes the LC50 of the 29 runs in the MDA-MB-231 cells and the 3D response surface plots. LC50 calculated for none of the runs was less than 100 nM siRNA delivered, which was the concentration delivered for silencing efficiency experiments. Run 10 showed the most toxicity (LC50 ≈ 133 nM siRNA delivered) and Runs 15 and 22 were the least toxic runs in MDA-MB-231 cells (with LC50s of 407 and 405 nM siRNA delivered, respectively). The LC50 for most of the runs was in the 150–400 nM siRNA range. The 3D response surface plots represent the trend in changes in the LC50 based on the same three variables: mole fraction of phospholipid I (DOPE or DSPCE), phosphatidylcholine, and cholesterol (A, B, and C). The mole fraction of ionizable lipid (Dlin-MC3-DMA or ALC-0315) was again kept constant at 0.15 for consistency. However, the 3D response surface plots for LC50 results were identical for all possible combinations of the selected phospholipid I and ionizable lipids. All the plots showed a higher LC50 (lowest toxicity) in the middle of the bell-shaped 3D plot, indicating that the toxicity would increase when either of the variables (phospholipid I and ionizable lipid fraction) was used in the higher end of the mole fraction range.
We investigated any potential correlation between the individual CPPs and toxicity observed in the MDA-MB-231 cells, and a direct comparison between the LC50s calculated for LNPs containing DOPE vs. DSPC and ALC-0315 vs. Dlin-MC3-DMA, and the results are summarized in
Supplementary Figure S2. No significant correlation was found between any of the four mole fractions and the calculated LC50s. We also carried out direct comparisons between the runs containing DOPE vs. DSPC as the phospholipid I and the runs containing ALC-0315 vs. Dlin-MC3-DMA, and the difference in the average of the LC50s was not statistically significant (
Supplementary Figure S2E,F). Hence, the nature of the lipid did not seem to significantly affect the cytotoxicity observed with the lipid formulations, given the experimental limitations of the investigated system.
The statistical analysis performed by Design Expert showed that the selected factors significantly influenced cytotoxicity. However, the linear mixture terms did not contribute significantly (
p = 0.6151), suggesting that individual mixture components alone may not sufficiently explain the variation in LC50. The interaction effects also indicated a potential combined effect of the LNP components on the cytotoxicity. The lack of a fit test was not significant, suggesting that the model adequately captured the data variability without significant deviation. The adjusted and predicted R
2 values were lower than the outcome for the cellular internalization. The elevated variance inflation factors (VIFs) might be an indication for multicollinearity issues due to high correlation between independent variables, which makes it difficult for the model to distinguish the unique contributions of the variables, leading to unstable coefficient estimates. However, the residuals vs. predicted plot showed acceptable random dispersion of residuals, supporting the adequacy of the model fit. Overall, the study findings highlighted that although the model effectively captured certain significant interactions influencing LNP cytotoxicity, the limited explanatory power, as indicated by the predicted R
2 value, pointed to areas needing further refinement. Please see the summary of statistical analysis in
Supplementary Table S2.
2.4. Silencing Efficiency of LNP Formulations
The final selected CQA was the silencing efficiency that was evaluated in MDA-MB-231 cells permanently expressing GFP (MDA-231-GFP). Cells were exposed to scrambled siRNA and GFP-targeting siRNA for a side-by-side comparison using flow cytometry and to calculate the silencing efficiency. Again, we used both mean GFP fluorescence and percentage of GFP-positive cells as indicators of the GFP expression levels to calculate the silencing efficiency. There was a significant correlation between the silencing efficiencies calculated based on mean GFP fluorescence and percentage of GFP-positive cells (correlation factor (R) = 0.7341,
p value < 0.0001;
Figure 3C) and both sets of data were included as CQAs. The silencing efficiency data are summarized in
Figure 3. The mean GFP fluorescence and percentage of GFP-positive cells for the two groups (cells exposed to scrambled siRNA or GFP-targeting siRNA) are provided in
Supplementary Figure S3.
Figure 3A summarizes the silencing efficiency of the 29 runs calculated based on the average of GFP fluorescence of the cell populations. The mean fluorescence of untreated cells and the percentage of GFP-positive cells were 14,034 AU and 85.2% on average, respectively. Some formulations showed no silencing efficiency (runs 1 and 13 when silencing efficiency was calculated based on mean GFP fluorescence; or runs 10, 21, and 29 when it was calculated based on the percentage of GFP-positive cells), with others demonstrating a slight efficiency. Run 16 showed the highest efficiency in the GFP remaining expression (26%) based on mean GFP fluorescence, followed by runs 26 and 2 (28% and 33%, respectively). Based on the percentage of GFP-positive cells (
Figure 3B), run 16 was again the most efficient run (~30.7%). However, in both sets of data, there were some runs that showed a decrease in GFP fluorescence by delivering scrambled siRNA (both in terms of average GFP signal and the percentage of GFP-positive cells;
Supplementary Figure S3); this could be due to non-specific effects because of a high concentration of delivered siRNA copies, or toxicity that might affect the overall fluorescence signal. Among those runs that showed a decrease in fluorescence by delivering scrambled siRNA, run 2 and run 8 were noticeable, since they also showed significant silencing efficiency.
Interestingly, there was no significant correlation between the cellular internalization results and the silencing efficiency (
Supplementary Figure S4). Although reports of such correlation between internalization and silencing can be found in the literature [
28], and internalization into the cytoplasm is a requirement for the siRNA to be effective, cellular internalization does not necessarily guarantee an effective silencing. For example, it is well known that siRNA nanoparticles internalized efficiently via endocytosis pathways could be trapped in the endosome and never release the siRNA in cytoplasm intact [
29]. Another important step for the efficiency of internalized siRNA copies is the timely release from the nanoparticles, which needs to create a consistent number of siRNA copies in cytoplasm that could effectively silence the targeted protein [
30]. On the other hand, achieving effective silencing is also possible with fewer copies of siRNA that were delivered intact and in a timely manner to the site of action. We have previously reported a correlation between siRNA internalization and silencing efficiency against Janus Kinase 2 (JAK2) in MDA-MB-231 cells and Signal Transducer and Activator of Transcription 3 (STAT3) proteins in MDA-MB-468 cells (another triple negative breast cancer cell line) in vitro with hydrophobically modified low-molecular-weight PEIs that showed minimal cellular internalization [
31]. In this study, runs 16 and 26, which showed effective silencing without a significant reduction in GFP levels by delivering scrambled siRNA, showed moderate mean fluorescence in the internalization data set (682 and 596 AU in mean fluorescence, and 73% and 97% in siRNA-positive cells, respectively).
We performed a correlation analysis to investigate any potential correlations between the mole fraction of the LNP components and two indicators of the silencing efficiency (
Supplementary Figure S5). As in cellular internalization and toxicity, a simple one-to-one correlation between this CQA and the LNP components did not reveal any significant correlation. A direct comparison between the runs containing DOPE vs. ones with DSPC did not show a significant difference either, despite a slightly higher silencing efficiency among the LNPs incorporating DOPE as phospholipid I (76.2% vs. 66.2% calculated based on percentage of GFP-positive cells, and 66.8% vs. 62.4% calculated based on mean GFP-fluorescence). Despite an advantage for LNPs incorporating Dlin-MC3-DMA over the runs with ALC-0315 for the GFP remaining expression (78.8% vs. 63.8% based on percentage of GFP-positive cells and 68.0% vs. 59.3% based on mean GFP-fluorescence), this difference did not also reach significance (
p value = 0.169 and 0.347, respectively).
The ANOVA test showed that the selected model for silencing efficiency calculated based on percentage of GFP-positive cells was significant and the lack of fit test was not significant (indicating that the model was fit for the analysis); however, the linear mixture component did not have a significant contribution, which indicates that individual components alone were not sufficient to explain the variability in silencing efficiency. Overall, the statistical analysis of this data set indicated that although the model effectively captured certain significant interactions influencing GFP silencing efficiency, the limited explanatory power, as indicated by the negative predicted R
2 value, pointed to areas needing further refinement. On the other hand, the ANOVA test for silencing efficiency calculated based on mean GFP-fluorescence missed the significance mark by a narrow margin (
p = 0.0696), while the lack of fit was not significant, which indicates that the model adequately captured the data variability without significant deviation. The analysis of coefficient estimates showed that individual components such as phospholipid I, phosphatidylcholine, and ionizable lipid had significant positive impacts on silencing efficiency calculated based on mean fluorescence. Overall, the study of the silencing efficiency calculated based on mean fluorescence showed similar deficiencies to the model as was observed for the calculation of silencing efficiency based on percentage of the GFP-positive cells (including the negative predicted R
2 value). Please see the summary of statistical analysis in
Supplementary Table S2.
For the optimum formulation, based on the presented data, Design Expert concluded that the best performing formulation was DOPE as phospholipid I, Dlin-MC3-DMA as ionizable lipid, and DOPE (0.4)/Dlin-MC3-DMA (0.4)/phosphatidylcholine (0.1)/cholesterol (0.1) as the composition. This proposed formulation was a surprising duo to preference for DOPE over DSPC. As mentioned before, DSPC has been a consistent component of FDA-approved LNPs, including both COVID-19 vaccines [
32]. Also, run 16 and run 26, which showed the most significant silencing efficiency among the proposed runs, evaluated both incorporated DSPCs as phospholipid I (
Supplementary Table S1). Therefore, we decided to perform a side-by-side comparison between the proposed “optimum formulation” (OF) and runs 16 and 26 (as the second-best performing formulation in silencing efficiency studies). To further compare DOPE and DSPC and also ALC-0315 and Dlin-MC3-DMA, we also included those variations in this study. This design allowed us to compare each formulation with the exact duplicate but the alternative lipid (e.g., the optimum formulation or OF is compared with OF/DSPC, which is the same composition where DOPE replaces DSPC).
Table 1 summarizes the compositions of the LNPs included in this study.
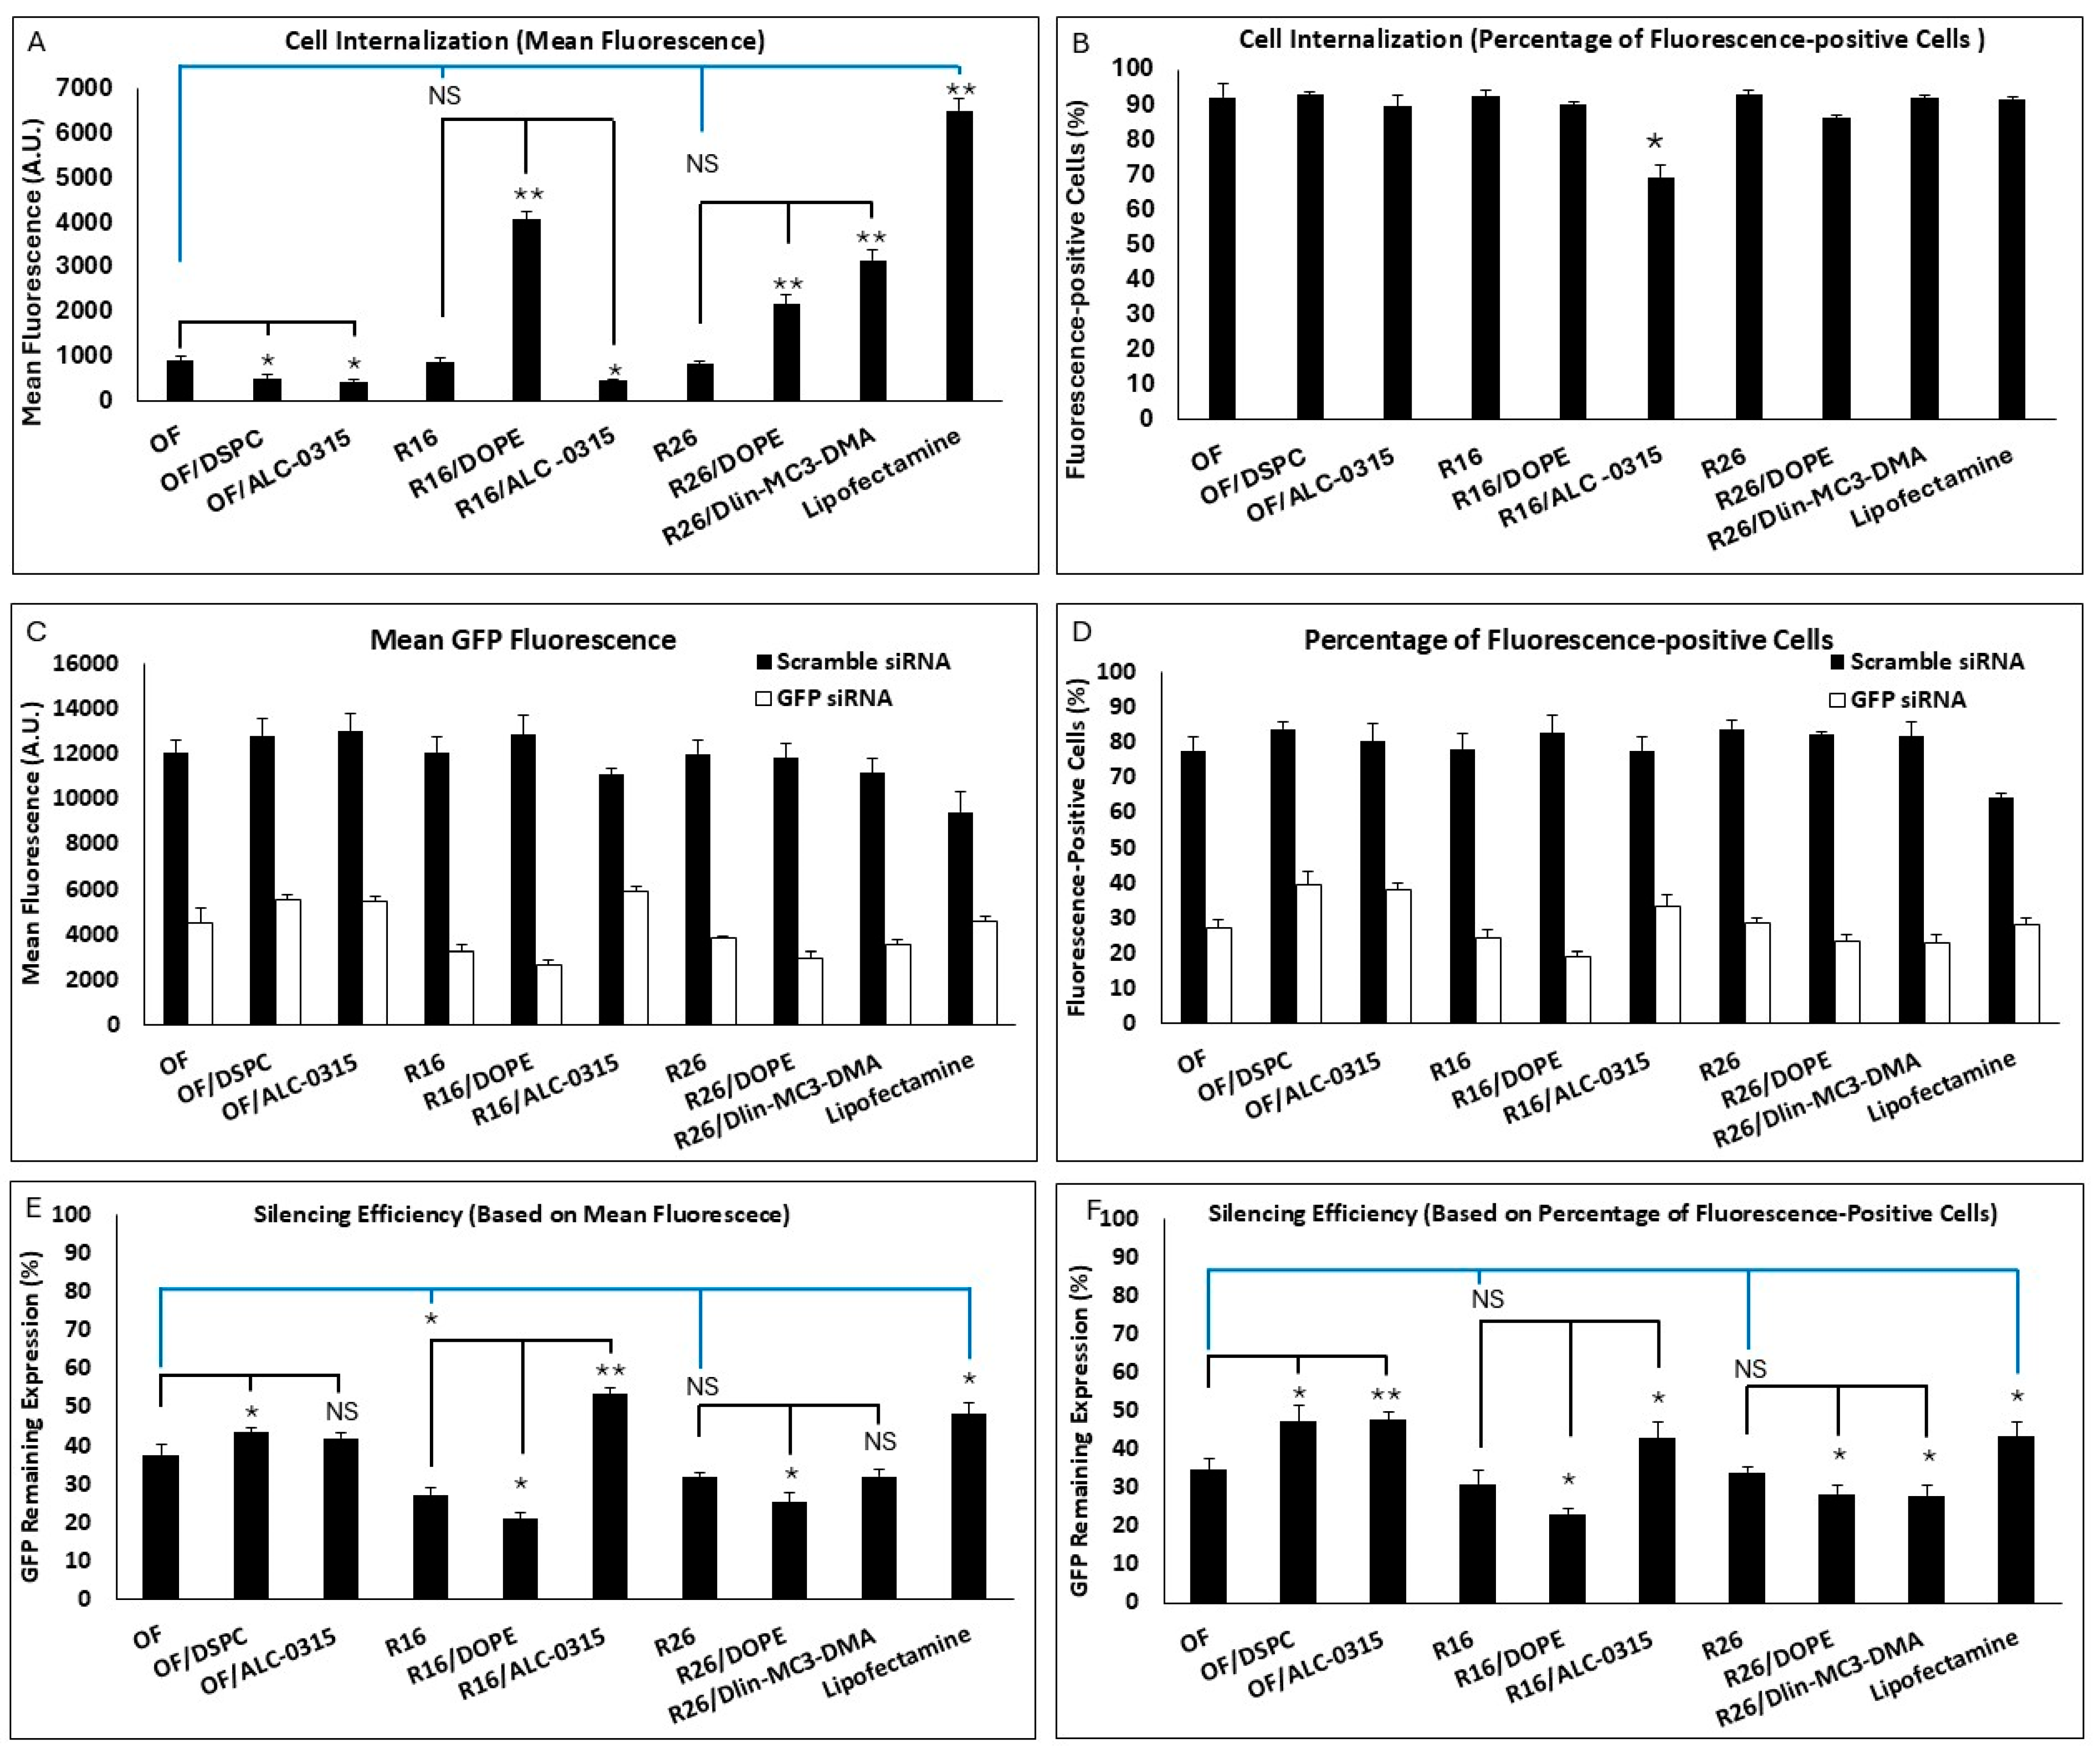
All nine formulations included in the study were investigated for cell internalization and silencing efficiency as before, and the results are summarized in
Figure 4. There was no significant difference between the OF, R16, and R26 in cell internalization (based on both mean fluorescence or percentage of siRNA-positive cells). Based on mean fluorescence (
Figure 4A), replacing DOPE with DSPC or replacing Dlin-MC3-DMA with ALC-0315 in the OF composition both reduced the internalization significantly. Interestingly, replacing DSPC with DOPE in R16 and R26 also increased the cellular internalization significantly. Replacing Dlin-MC3-DMA with ALC-0315 in R16 reduced the mean uptake, and replacing ALC-0315 with Dlin-MC3-DMA in R26 enhanced the mean uptake in MDA-MB-231 cells. The commercial Lipofectamine created the highest mean fluorescence among the study groups. Based on siRNA-positive cell data, all included LNPs created comparable results (~85–90%), except the lower uptake in R16 “alternative”, where Dlin-MC3-DMA was replaced with ALC-0315 (
Figure 4B). All these data confirm the superiority of DOPE over DSPC and Dlin-MC3-DMA over ALC-0315 in internalizing siRNA in the selected triple-negative breast cancer cell line.
The silencing efficiency for these LNPs is summarized in
Figure 4C,D for cells exposed to scrambled or GFP-targeting siRNA. The effect of scrambled siRNA on GFP-fluorescence was not significant in these study groups, which makes the results more reliable. Silencing efficiencies calculated based on mean GFP-fluorescence are presented in
Figure 4E. R16 showed the highest efficiency in silencing GFP in MDA-MB-231-GFP cells compared to the OF composition; however, while R26 was also more efficient than OF in this regard (32% vs. 37.5% remaining expression), the difference was not statistically significant. Lipofectamine was less effective in silencing GFP based on the mean fluorescence results. Replacing DOPE with DSPC in OF composition reduced the silencing efficiency significantly; however, while replacing Dlin-MC3-DMA with ALC-0315 in OF did reduce the silencing efficiency (42% remaining GFP expression for ALC-0315 compared to 37.5% for OF), the difference was not statistically significant. In R16 and R26 formulations, replacing DSPC with DOPE increased the silencing efficiency significantly. Replacing Dlin-MC3-DMA with ALC-0315 in R16 reduced the silencing efficiency; however, replacing ALC-0315 with Dlin-MC3-DMA in R26 composition did not affect the silencing efficiency significantly. A similar silencing pattern was also observed based on the percentage of GFP-positive cells’ data (
Figure 4F). In this data set, however, the superiority of R16 and R26 over OF in silencing efficiency was not statistically significant. The internalization and silencing efficiency of Lipofectamine, optimum formulation, and R16/DOPE were also visualized by confocal microscopy and the images are summarized in
Figure 5 and
Figure 6, respectively.
Based on the presented data, we can conclude that the Design Expert analysis correctly selected DOPE over DSPC and Dlin-MC3-DMA over ALC-0315 in internalizing siRNA in the selected triple negative breast cancer cell line. All the variations in the original compositions also confirmed a higher silencing efficiency for DOPE over DSPS and Dlin-MC3-DMA over ALC-0315. Both findings may seem surprising at first glance: reports generally show a higher efficiency for ALC-0315 compared to Dlin-MC3-DMA in siRNA delivery, and DSPC is a far more popular choice of neutral lipid in commercialized LNPs. However, in both data sets, R26 composition, with DOPE replacing the DSPC (R16/DOPE), showed more efficacious than the recommended composition by the software with the best silencing efficiency (20.9% and 23.1% remaining expression for data calculated based on mean fluorescence and percentage of GFP-positive cells, respectively). This might be an indication that the selected composition using this type of algorithm might not be the best possible option. It is noteworthy that lipid selection could be significantly affected by cell type, as the internalization of any nanoparticle could vary depending on the cell characteristics. Therefore, we selected the R16/DOPE formulation for the design of the LPNP compositions.
2.5. Evaluating the LNP Compositions in Prostate Cancer Cells
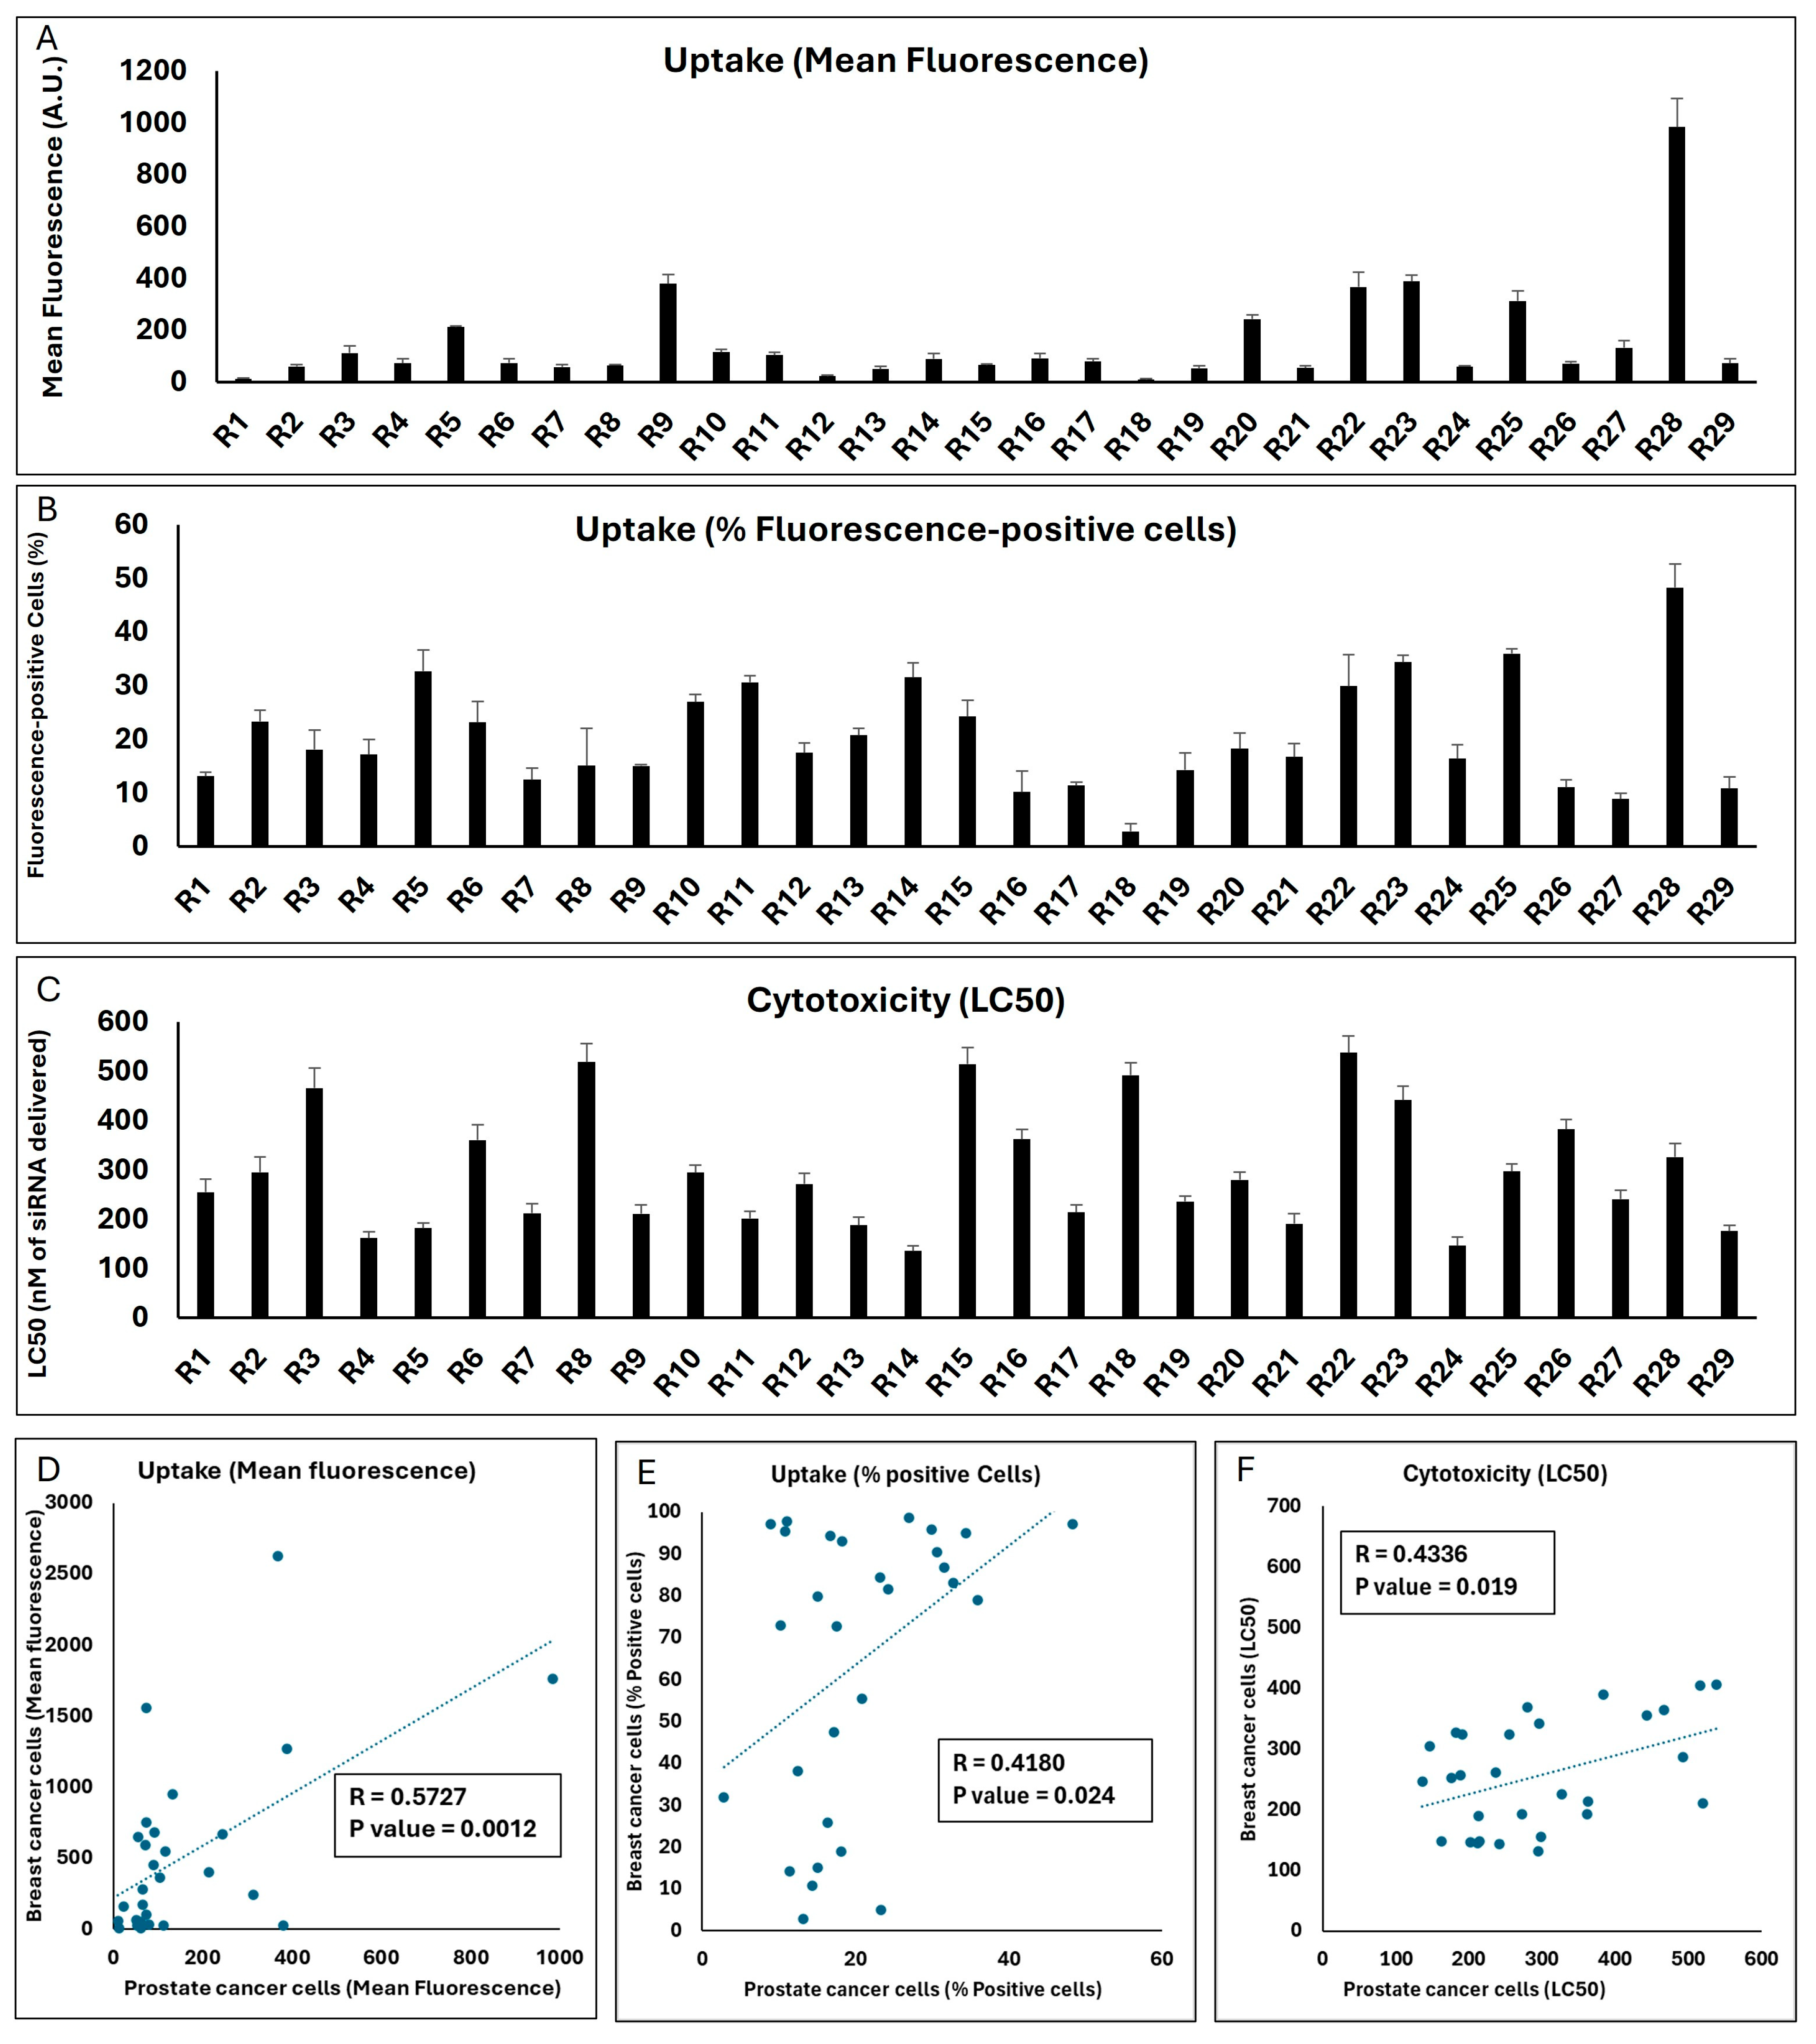
The reproducibility of the performance of a carrier in different cell types is an important consideration. While the idea of a carrier that is equally safe and effective in delivering the cargo to different cancer types is certainly attractive, it stands to reason that the formulation would need adjustments depending on the cell type with different membrane compositions, receptor expression, and intracellular processes. To test the performance of the LNPs in a different cell type, we studied the same 29 runs selected by Design Expert in the Androgen-sensitive human prostate cancer cell line LNCaP for cellular internalization and toxicity, and the results are summarized in
Figure 7.
The mean fluorescence of the LNCaP cell populations exposed to the same 29 runs was significantly lower than what was observed in the MDA-MB-231 cells (the highest mean fluorescence was 984 A.U. for Run 28;
Figure 7A). However, there was a strong significant correlation between the mean fluorescence created by the runs in the two cell lines (
p value = 0.0012;
Figure 7D). In line with reduced uptake, the highest percentage of siRNA-positive cells did not exceed 50% for any of the runs in LNCaP cells (
Figure 7B), while a significant correlation did exist for this outcome between the two cell lines (
p value = 0.024;
Figure 7E). A variety of LC50s was calculated for the 29 runs in the LNCaP cell line, and it was noteworthy that the LC50 for three runs exceeded 500 nM of siRNA delivered. Run 14 showed the highest toxicity among the runs (LC50 = 136 nM of siRNA delivered;
Figure 7C). A significant correlation was also observed between the toxicity of the runs in the two selected cell lines (
p value = 0.019;
Figure 7F).
This set of experiments indicates that, in general, the performance of the LNP formulations included in the Design Expert software (Version 13) runs in terms of cellular internalization and toxicity correlated between the two selected cell models, which might be due to similar factors affecting the uptake and toxicity in these models in vitro. However, this does not necessarily mean that the best performing choice in one cell line would be the best option in the other; for example, the R28 formulation that was the most efficient formulation in internalizing siRNA in the prostate cancer LNCaP cells did not exhibit the highest internalization in the breast cancer MDA-MB-231 cells.
2.7. Cellular Internalization of LPNPs in MDA-MB-231 Cells
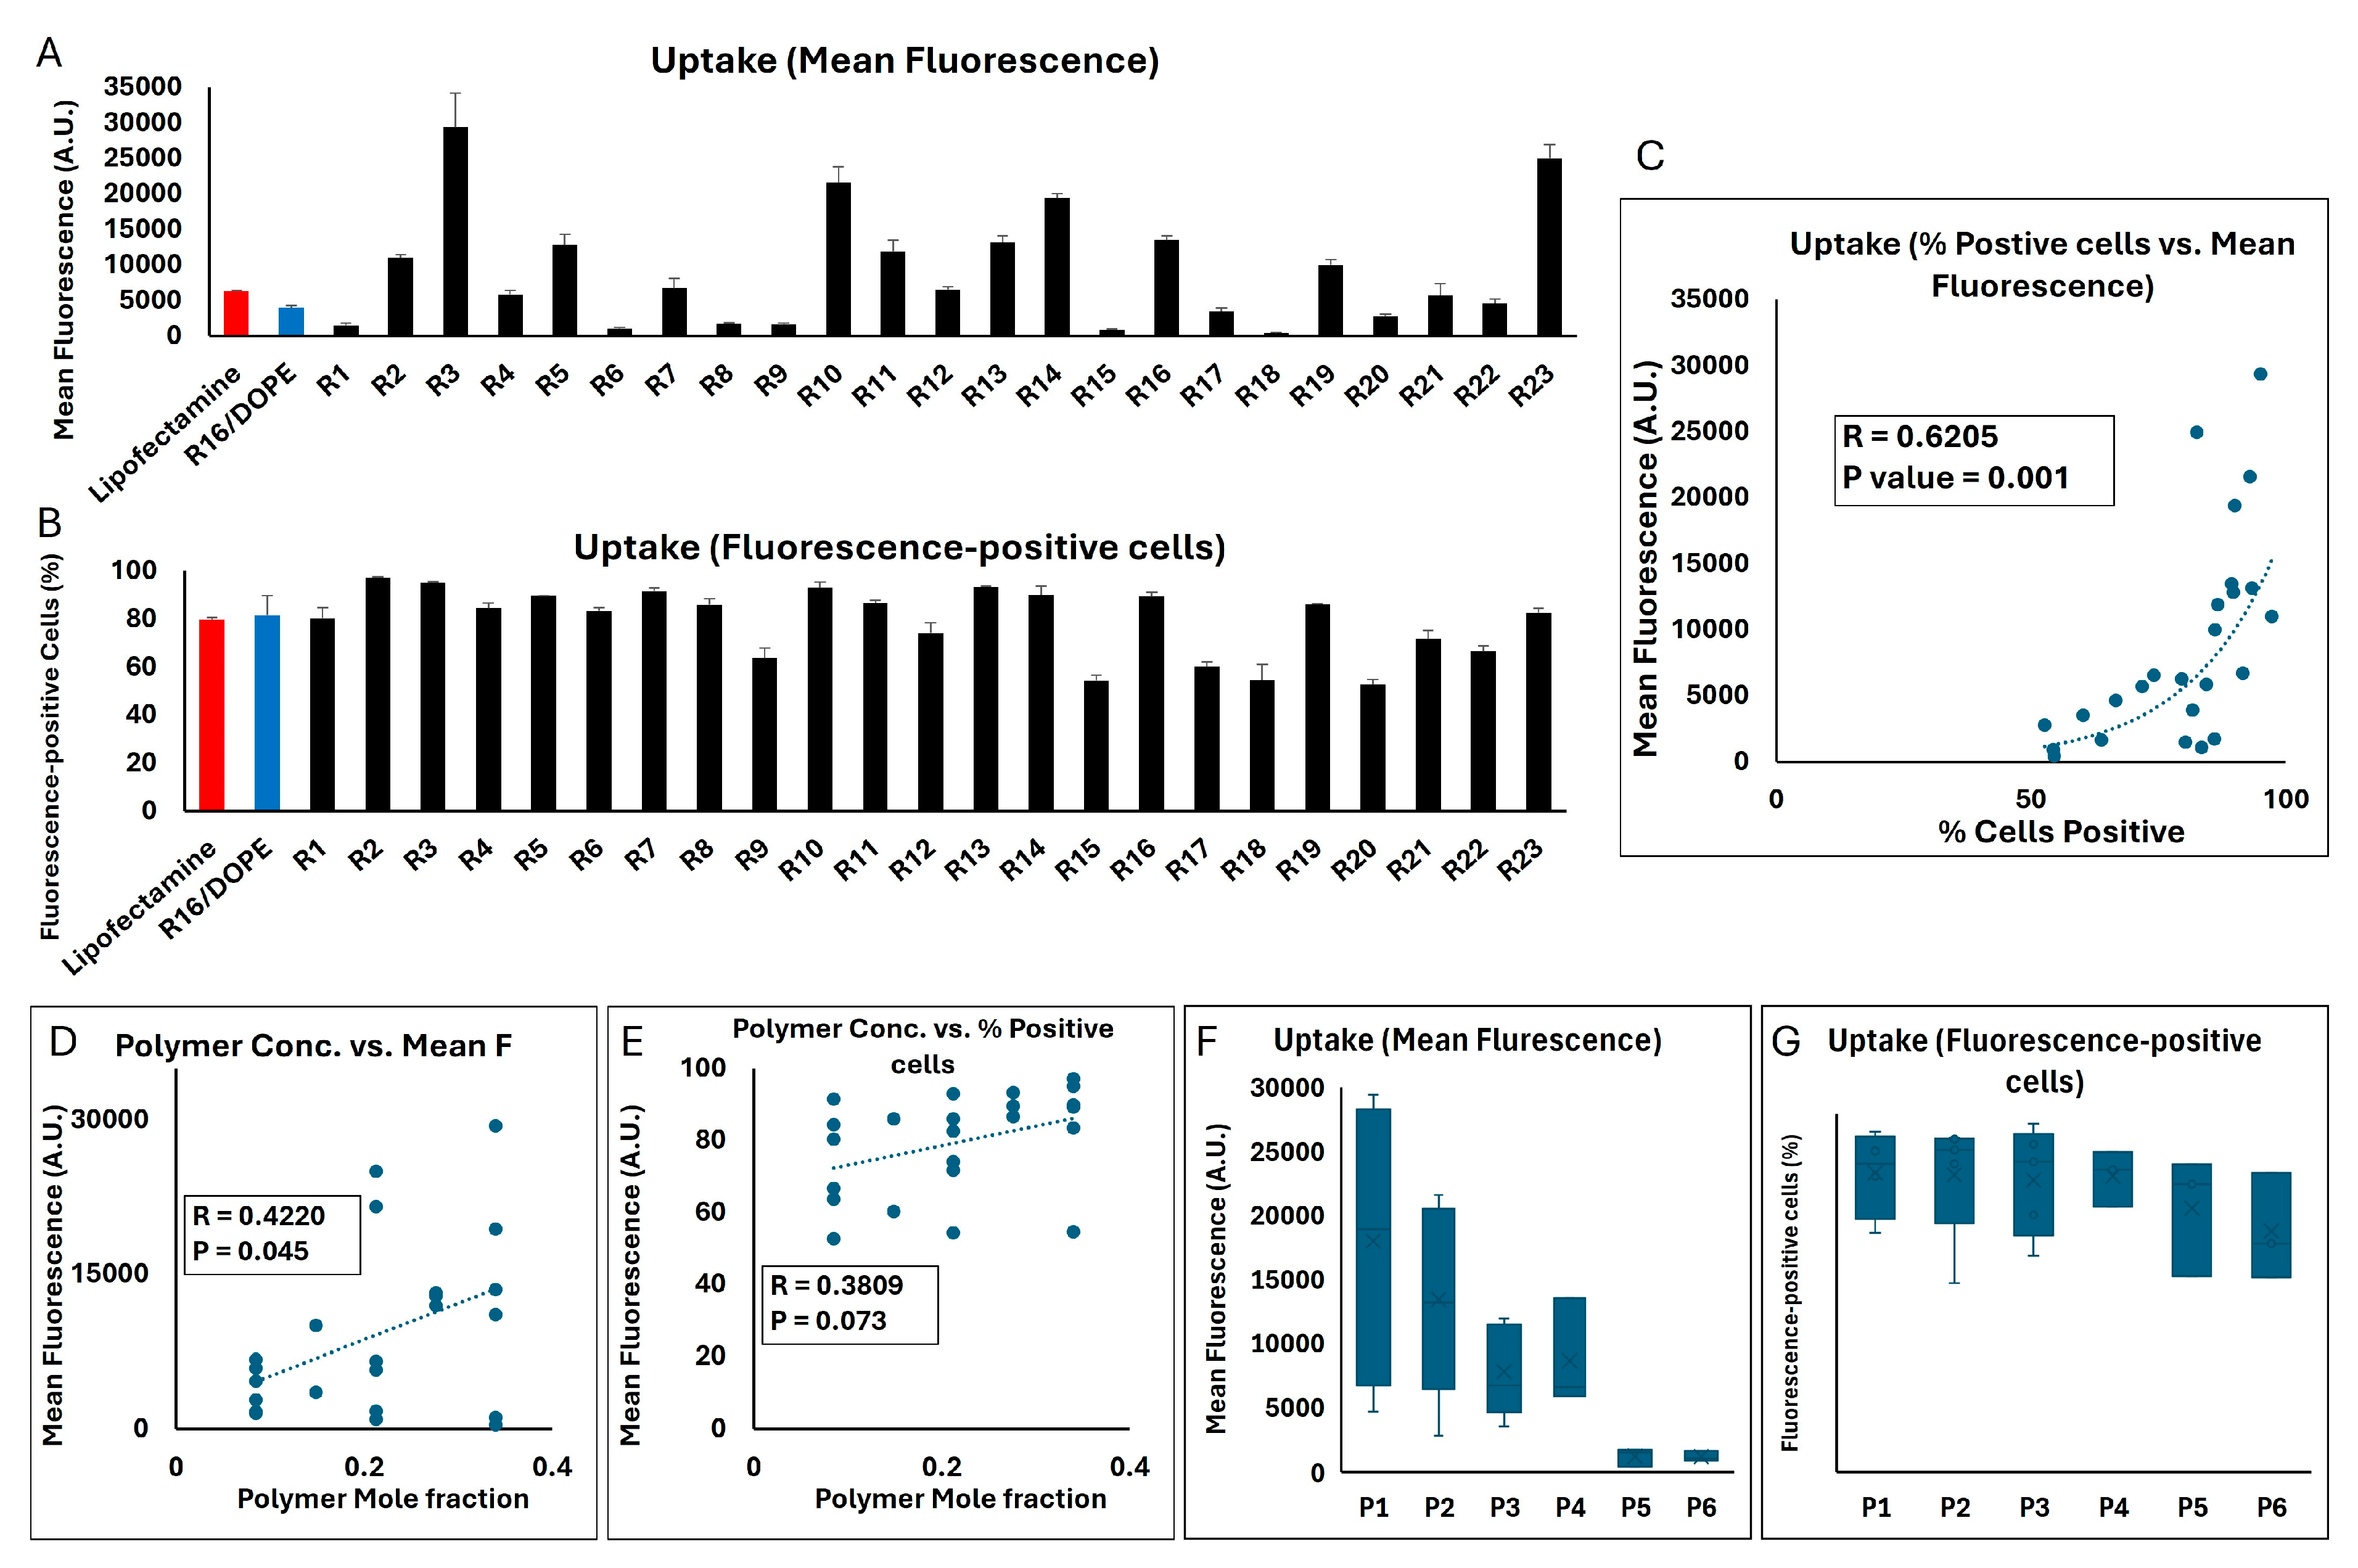
The two methods of quantification of the siRNA internalized in MDA-MB-231 cells showed a similarly significant correlation in this set of studies (correlation factor = 0.6205;
p value = 0.001;
Figure 9C). With the mean fluorescence of cell population exposed to AF647-labeled siRNA delivered by Lipofectamine
TM and R16/DOPE (as a commercially available reagent and the most effective LNP formulation in our studies) being 6291 and 3937 A.U., respectively, many of the LPNP runs created a significantly higher internalization in the MDA-MB-231 cells (29,400, 24,971, 21,582, and 19,391 A.U. for R3, R23, R10, and R14, respectively, were the four highest results;
Figure 9A). A similar significant difference was not, however, observed in the percentage of cells positive for the fluorescence signal, mostly because close to maximum internalization in Lipofectamine
TM and R16/DOPE study groups (~ 80 and 82%, respectively). Runs 2,3, 5, 7, 10, 13, 14, and 16 showed ≥ 90% fluorescence-positive cells. There were also runs that did not show a similar internalization efficiency and runs 15 and 20 created the lowest % fluorescence-positive cells (54 and 52.6%, respectively;
Figure 9B). A significant positive correlation was observed between the mole fraction of the polymer in the formulation and the mean fluorescence (R = 0.422;
p value = 0.045;
Figure 9D). A similar trend was seen in terms of % fluorescence-positive cells (R = 0.3809); however, the correlation was not statistically significant (
p value = 0.073;
Figure 9E). A direct comparison between the six polymers included in the study showed that the average of mean fluorescence in the MDA-MB-231 cell population exposed to the runs incorporating polymer 1 was the highest among the different polymers (17,964 A.U.;
Figure 9F). A one-way ANOVA test showed a significant difference among the six polymers included (
p value = 0.0165), and a Tukey post hoc test revealed a significant difference only between polymer 1 vs. polymers 5 and polymer 1 vs. polymer 6 (
p values of 0.324 and 0.323, respectively). A similar comparison between the average of percentage of fluorescence-positive cells among the runs incorporating each of the six polymers showed less variability among the runs, where the average percentage was around 82% for runs incorporating polymers 1–4, and 73.6% and 67% for runs including polymers 5 or 6, respectively (
Figure 9G).
Since this set of experiments only included two CPPs (mole fraction and the structure of the selected polymer), the response surface plots were either based on one factor (the selected polymer) for a pre-determined polymer mole fraction (0.085, 0.2125, or 0.34) or a two-component mix (six separate plots for different polymers based on the mole fractions), and the one factor respond surface plots for cellular internalization are summarized in
Supplementary Figure S6. It is noteworthy that except for polymer 5, the highest mean fluorescent was achieved when the polymer completely replaced Dlin-MC3-DMA (mole fraction of 0.34 for polymers 1–4 and 6).
For internalization calculated based on mean fluorescence, the statistical analysis using a reduced quadratic main effects model revealed that the selected combination of formulation factors significantly affected the uptake (ANOVA F-value = 37.02,
p < 0.0001). Polymer concentration showed particularly strong effects (coefficient = 0.0185, 95% CI: 0.0166 to 0.0204,
p < 0.05). These findings indicate that increasing the concentrations of polymer can significantly improve nanoparticle performance. The enhancement in uptake may be attributed to facilitating endosomal escape and stabilizing particle structures during internalization. This theory requires experimental confirmation in future studies. The interaction between Dlin and polymer concentration (DE) revealed a significant negative effect (coefficient = −0.0084, 95% CI: −0.0162 to -0.0005,
p < 0.05). This suggests that while both factors independently enhance uptake, their combined effect may reduce overall efficiency. One potential explanation for this reduction could be the formation of overly stable particles at high concentrations of Dlin and polymer, impeding their disassembly within the cell and subsequent payload release. Analysis of polymer types revealed significant variability in their contributions to uptake. DF [
5] exhibited a strong positive effect (coefficient = 0.0076, 95% CI: 0.0032 to 0.0119,
p < 0.05), suggesting that certain polymers strongly enhance uptake efficiency. Conversely, DF [
4] showed a significant negative coefficient (−0.0052, 95% CI: −0.0095 to −0.0008,
p < 0.05), indicating that some polymer types can inhibit uptake under specific conditions.
In analysis of the cellular internalization calculated based on percentage of fluorescence-positive cells, the ANOVA results showed statistical significance for the overall model (F-value = 7.18,
p = 0.0016), indicating that the combined effects of the formulation factors significantly explained the observed variability in uptake. Polymer concentration had a strong positive influence on cellular uptake with a coefficient estimate of 85.27. This highlights that increasing the concentration of polymer enhances nanoparticle uptake. The lack of fit test remained not statistically significant (F-value = 3.98,
p = 0.0779), indicating that the model adequately fits the data and does not leave systematic variability unexplained. The R
2 value of 0.9243 indicates that 92.4% of the variability in LPNP uptake was explained by the model, highlighting its strong explanatory power. However, the adjusted R
2 of 0.7956 reflects moderate generalizability, suggesting room for improvement in capturing additional variability. The adequate precision value of 9.67 confirms a strong signal-to-noise ratio, providing confidence in navigating the design space and ensuring reliable predictions. Please see the summary of statistical analysis in
Supplementary Table S4.
2.8. Cytotoxicity of LPNPs in MDA-MB-231 Cells
We estimated the LC50 of the 23 runs in MDA-MB-231 cells using a similar approach and the results are summarized in
Figure 10. LipofectamineTM 2000 showed the most toxicity (LC50 = 110.2 nM of siRNA delivered), and the LC50 of R16/DOPE was 186 nM of delivered siRNA, which was slightly lower than the LC50 observed for R16 in the LNP runs (LC50 = 214 nM of siRNA delivered). LipofectamineTM is known to be moderately toxic in many cell lines [
34,
35]. We have previously reported a higher toxicity (LC50 = 57 nM of siRNA delivered) in MDA-MB-231 cells [
36]. Only a few LPNP formulations had a lower LC50 (higher toxicity) than the R16/DOPE LNP, which included runs 9 and 22 (LC50 of 162 and 168 nM of delivered siRNA, respectively). The lowest toxicity was observed for runs 8 and 14 (LC50 of 356 and 328 nM of siRNA delivered). A positive correlation was observed between the polymer mole fraction and LC50 (R = 0.62;
p value = 0.002), which indicates the relative safety of the selected polymers in the MDA-MB-231 cells (
Figure 10B). While P3 and P5 had the lowest and highest LC50 among the LPNPs incorporating different polymers, respectively (221 and 290 nM of siRNA delivered), no significant difference was observed among the six different polymers selected (
Figure 10C).
The respond surface plots for the toxicity of the 23 runs are presented in
Supplementary Figure S7. The model used for analyzing LC50 data was a quadratic main effects model, which yielded an overall model F-value of 5.97, indicating significance (
p-value = 0.0034). This result suggests that the selected factors can explain some of the variability in cytotoxicity and that the model successfully captured relevant trends in the response. The ANOVA analysis reveals that the linear mixture effect (F-value = 13.47,
p = 0.0012) was statistically significant, which means that the interactions between mixture components influenced the cytotoxic response. However, the DE interaction term (F-value = 0.0003,
p = 0.9856) was not significant, suggesting that additional refinement of the model or inclusion of other factors might improve the ability to capture the complexity of cytotoxicity. This aligns with observations in nanoparticle-based drug delivery studies, where synergistic or antagonistic effects between formulation components often depend on subtle variations in their ratios and structural properties. The model’s fit statistics showed a predicted R
2 of 0.2383 and an adjusted R
2 of 0.3557. While the difference between these values is relatively small (less than 0.2), the low predicted R
2 indicates limited predictive power, implying that the model may not fully generalize to independent data points. Adequate precision was measured at 6.32, above the threshold of 4, which suggests that the model has an adequate signal-to-noise ratio for navigating the design space. A lack of fit test (F-value = 32.37,
p = 0.0006) was found to be significant, indicating that the model does not fully represent the observed data. This suggests that additional terms or a more complex model may be required to better capture the systematic variability in cytotoxicity. The significant lack of fit may also reflect unaccounted biological factors, such as cellular heterogeneity or differential sensitivity to nanoparticle formulations, which are common challenges in cytotoxicity assays. Please see the summary of statistical analysis in
Supplementary Table S4.
2.9. Silencing Efficiency of LPNPs in MDA-MB-231 Cells
Targeting GFP in MDA-231-GFP cells (in comparison to scrambled siRNA) was again used as our approach to investigate the silencing efficiency of LPNPs by quantifying both mean fluorescence and percentage of GFP-positive cells. A significant positive correlation was again observed between the silencing efficiency calculated based on mean fluorescence vs. percentage of GFP-positive cells (R = 0.8822;
p = 0.0001;
Figure 11C). The GFP remaining expression (%) was calculated based on both mean fluorescence and percentage of GFP-positive cells (
Figure 11A and
Figure 11B, respectively). The individual readings for cells exposed to scrambled or GFP-targeting siRNA are presented in
Supplementary Figure S8. Lipofectamine downregulated the GFP signal to ~44% and ~40% based on mean fluorescence and percentage of GFP-positive cells, respectively. R16/DOPE showed a significantly higher efficiency on both accounts (~21 and 23% remaining expression, respectively). All 23 runs showed some level of silencing, with run 20 showing the least efficiency (82 and 84% GFP remaining based on mean fluorescence and % GFP-positive cells, respectively). Runs 1, 9, and 15, 17, and 21 also showed limited efficiency. On the other hand, runs 4, 5, 14, and 23 showed significant silencing efficiency. In fact, run 4 showed a significantly higher silencing efficiency than R16/DOPE in terms of mean fluorescence (
p value = 0.039), but the difference was not significant when the silencing efficiency was calculated based on % of GFP-positive cells (
p value = 0.067). Runs 14 and run 23 showed higher efficiency than R16/DOPE on both methods of calculation. Run 14 showed the most downregulation among all the runs (16.3 and 18% based on mean fluorescence and % of GFP-positive cells, respectively), which was statistically significant compared to R16/DOPE (
p values of 0.015 and 0.022, respectively), but not with run 4 or run 23 (
Figure 11A,B). The polymer concentration alone did not correlate significantly with the silencing efficiency calculated based on mean fluorescence (
Figure 11D) or based on percentage of GFP-positive cells (
Figure 11E). Similarly, one-way ANOVA test did not show a significant difference among the six polymers included in the study in terms of silencing efficiency based on mean fluorescence or % GFP-positive cells (
Figure 11F,G, respectively).
Again, the correlation between the cellular internalization and silencing efficiency achieved by LPNPs was not statistically significant (similar to what we observed for LNPs;
Supplementary Figure S9); however, a trend was obvious, and the correlation factors were higher than what was observed for LNPs (R = 0.3697 and 0.3323 for uptake and silencing efficiency based on mean fluorescence and percentage of fluorescent-positive cells, respectively), and the
p value just missed the significance threshold for the data based on mean fluorescence (
p value = 0.083). Again, the response surface plots were either based on one factor (the selected polymer) for a pre-determined polymer mole fraction (0.085, 0.2125, or 0.34) or a two-component mix, and the one-factor respond surface plots for silencing efficiency are summarized in the
Supplementary Figure S10. The analysis of silencing efficiency based on mean fluorescence for LPNPs revealed strong statistical significance in the quadratic main effects model, with an overall model F-value = 74.78 and
p-value = < 0.0001, suggesting that the model was able to explain a substantial portion of the variability in silencing efficiency. The model’s adjusted R
2 value of 0.9820 indicated that about 98.2% of the variability could be explained, reflecting excellent explanatory power. The lack of fit test (F-value = 1.00,
p = 0.4307) was found to be non-significant, indicating that the model adequately captured the data without evidence of significant lack of fit. Residual analysis further supported the adequacy of the model.
The coefficients analysis revealed that polymer concentration had significant positive effect on silencing efficiency with the coefficient of 49.85 (95% CI: 47.31 to 52.40) for polymer concentration. This value suggests that increasing the concentrations of polymer significantly enhances silencing efficiency. The interaction between Dlin and polymer concentration (DE) exhibited a slight negative effect (coefficient = −7.02, 95% CI: −17.33 to 3.29), indicating a potential reduction in efficiency when these factors are combined, though the confidence interval suggests uncertainty in this effect. This interaction may reflect competing mechanisms, such as reduced nanoparticle stability or suboptimal endosomal escape efficiency when both components are present in high concentrations. Conversely, specific polymer types demonstrated both positive and negative effects: DF [
2] had a strong positive effect (coefficient = 20.37, 95% CI: 14.70 to 26.04), enhancing silencing efficiency, and DF [
4] exhibited a strong negative effect (coefficient = −42.17, 95% CI: −47.87 to −36.46), suggesting inhibitory properties in certain formulations.
The analysis of silencing efficiency based on % GFP-positive cells for LPNPs revealed mixed results in terms of model fit and the significance of individual factors. The ANOVA results demonstrated that the quadratic main effects model was statistically significant (F-value = 3.41,
p = 0.0266), suggesting that the model was able to explain some variability in silencing efficiency. However, the model’s adjusted R
2 value of 0.6027 indicated that only about 60% of the variability could be explained, reflecting moderate explanatory power. The significant lack of fit (F-value = 45.63,
p = 0.0004) indicated that the model did not adequately capture the data, highlighting the need for additional or alternative variables to improve accuracy. The
p-values for individual terms underscored the importance of certain factors, such as the interaction between Dlin and polymer concentration (DF) (
p = 0.0134), which appeared to have a notable influence on silencing efficiency. However, interaction terms, such as DF [
4] (coefficient = −42.09, 95% CI: −69.23 to −14.95), revealed that specific polymer interactions with Dlin could reduce silencing efficiency. Please see the summary of statistical analysis in
Supplementary Table S4.
2.10. Optimum LPNP Formulation
Design expert analyzed the data presented above and concluded that the best performing formulation was DOPE (0.46)/phosphatidylcholine (0.1)/cholesterol (0.1)/polymer 2 (0.34), which is the exact composition as R14. It is noticeable that the best composition completely replaced Dlin-MC3-DMA with one of the polymers included in the study. We repeated the cell internalization and silencing efficiency experiments in MDA-MB-231 and MDA-231-GFP cells, respectively, to validate the suggested formulation, by including the following study groups: Lipofectamine and R16/DOPE (as controls), polymers 1–6 (to compare the performance of free polymers to LPNPs), R4, R4/P1, and R4/P2 (R4 duplicates with polymers 1 and 2 replacing polymer 4), R14, R14/P1, and R14/P4 (R14 duplicates with polymers 1 and 4 replacing polymer 2), and R23, R23/P2, and R23/P4 (R23 duplicates with polymers 2 and 4 replacing polymer 1). The cellular internalization results are summarized in
Figure 12A,B for mean fluorescence and percentage of fluorescence-positive cells, respectively. Among free polymers, polymer 1 created the highest mean fluorescence, which is similar to our observations in LPNP cellular uptake (
Figure 9F). Polymers 1–4 created significantly higher mean fluorescence signals compared to Lipofectamine and R16/DOPE. Switching to polymers 1 or 2 in R4 (which originally contained polymer 4) significantly increased the mean fluorescence, which again confirms the higher efficiency of polymers 1 and 2 in cellular internalization compared to polymer 4. This was also obvious in comparing R14 (originally containing polymer 2) to the alternatives containing polymers 1 and 4. Cells exposed to R23 (originally containing polymer 1) showed a higher mean fluorescence than alternatives containing polymers 2 or 4 (
Figure 12A). As expected, most of the study groups showed a near maximum percentage of fluorescence-positive cells, except for R14 and R23 alternatives containing polymer 4 (
Figure 12B).
In terms of silencing efficiency calculated based on mean fluorescence, all six free polymers performed similarly to Lipofectamine
TM, but less efficient than R16/DOPE. When calculated based on percentage of GFP-positive cells, however, polymers 2 and 3 were less efficient than Lipofectamine
TM as well, when used free. Interestingly, all three selected original compositions (R4, R14, and R23) showed higher efficiency compared to the alternative created by switching the polymers. All three selected LPNP formulations showed a higher efficiency than R16/DOPE (selected LNP formulation); however, no significant difference was observed among the three LPNP formulations (
Figure 12C,D). The mean GFP fluorescence and percentage of GFP-positive cells for the two groups (cells exposed to scrambled siRNA or GFP-targeting siRNA) are provided in
Supplementary Figure S11.
While these side-by-side comparisons did confirm the choices made by algorithm for the selected optimum formulation, this was not the case for the LNP experiments. Finding a more efficient choice than the recommended formulation by algorithm could be at least partially due to the selected CQAs. We decided to analyze the biological outcomes for the designed runs (uptake, silencing efficiency, and toxicity) instead of physiochemical characteristics of the nanoparticles. Based on previous experience, we did not anticipate a significant variation in hydrodynamic diameter (due to the use of mini extruder which by default creates particles with the approximate size of the membrane pores), ζ-potential (except an anticipated increase towards positive values for LPNPs compared to LNPs), or encapsulation efficiency (based on previous experience with a different LNP [
14]). We performed a small study to verify this assumption on two LNP formulations (optimal LNP formulation recommended by Design Expert or OF and R16/DOPE) and three LPNP formulations (R4, R14, and R23) which incorporated three different polymers (with different mole fractions) in the nanoparticle composition (
Supplementary Table S5). While size and polydispersity were expectedly consistent among all nanoparticles, the ζ-potential of LNPs was negative, and for LPNPs, it was positive. The values of the ζ-potential of the LPNPs perfectly correlated with the mole fraction of the polymer (correlation factor = 0.94), regardless of the chemical structure of the polymers. This data indicate relative consistency in size and encapsulating efficiency of nanoparticles in general, and mole fraction of the polymer as the only factor affecting ζ-potential.
While the selected LPNP runs (R4, R14, and R23) performed better than R16/DOPE (selected formulation for LNPs), the difference in silencing efficiency was not overwhelming (unlike internalization efficiency which was clearly higher for the selected LPNP formulations). Therefore, we decided to explore the “dose–response” curve for these formulations to study the silencing efficiency in smaller siRNA concentrations delivered to breast cancer cells. We repeated GFP silencing with a wide array of delivered siRNA concentrations (10, 20, 40, 60, 80, 100, and 150 nM) in addition to the original 100 nM concentration used in our screening studies for selected LNP and LPNP formulations (
Figure 13). Among three selected LPNP formulations, R14 showed a similar trend in efficiency to the LNP formulation (R16/DOPE); however, both R4 and R14 showed significantly higher efficiency in lower concentrations (20, 40, 60, and 80 nM) both when calculated based on mean fluorescence (
Figure 13A) or percentage of GFP-positive cells (
Figure 13B). This is particularly interesting since R14 showed the lowest mean fluorescence in cellular internalization experiments among these three selected formulations (although still significantly higher than R16/DOPE).


