Article

Development of a Medication-Related Osteonecrosis of the Jaw Prediction Model Using the FDA Adverse Event Reporting System Database and Machine Learning

1
Department of Medical Molecular Informatics, Meiji Pharmaceutical University, Kiyose 204-8588, Japan
2
Department of Pharmacy, National Hospital Organization Kanagawa Hospital, Hadano 257-8585, Japan
3
Department of Orthopedic Surgery, National Hospital Organization Kanagawa Hospital, Hadano 257-8585, Japan
*
Authors to whom correspondence should be addressed.
Pharmaceuticals 2025, 18(3), 423; https://doi.org/10.3390/ph18030423
Submission received: 3 February 2025 / Revised: 9 March 2025 / Accepted: 12 March 2025 / Published: 17 March 2025

Abstract

:
Background: Medication-related osteonecrosis of the jaw (MRONJ) is a rare but serious adverse event. Herein, we conducted a quantitative structure–activity relationship analysis using the U.S. Food and Drug Administration Adverse Drug Reaction Database System (FAERS) and machine learning to construct a drug prediction model for MRONJ induction based solely on chemical structure information. Methods: A total of 4815 drugs from FAERS were evaluated, including 70 and 139 MRONJ-positive and MRONJ-negative drugs, respectively, identified based on reporting odds ratios, Fisher’s exact tests, and ≥100 total adverse event reports. Then, we calculated 326 chemical structure descriptors for each drug and compared three supervised learning algorithms (random forest, gradient boosting, and artificial neural networks). We also compared the number of chemical structure descriptors (5, 6, 7, 8, 9, 10, 20, and 30 descriptors). Results: We indicated that the MRONJ prediction model using an artificial neural network algorithm and eight descriptors achieved the highest validation receiver operating characteristic curve value of 0.778. Notably, the total polar surface area (ASA_P) was among the top-ranking descriptors, and MRONJ-positive drugs such as bisphosphonates and anticancer drugs showed high values. Our final model demonstrated a balanced accuracy of 0.693 and a specificity of 0.852. Conclusions: In this study, our MRONJ-inducing drug prediction model identified drugs with polar surface area properties as potential causes of MRONJ. This study demonstrates a promising approach for predicting MRONJ risk, which could enhance drug safety assessment and streamline drug screening in clinical and preclinical settings.

1. Introduction

Medication-related osteonecrosis of the jaw (MRONJ) is a rare adverse event associated with long-term administration of bisphosphonates (BPs) and denosumab [1,2]. However, MRONJ has also been linked to drugs with mechanisms of action distinct from those of bone resorption inhibitors, such as the angiogenesis inhibitors bevacizumab and sunitinib, as well as the immunosuppressants methotrexate and everolimus [1,2,3,4]. This suggests that various drugs may contribute to the development of MRONJ through different pathways. Although MRONJ significantly reduces quality of life, it is recommended to continue treatment with MRONJ-related drugs while implementing strategies to minimize its risk, as the therapeutic benefits of these drugs often outweigh the risks [5,6,7,8]. Therefore, the ability to predict and evaluate the risk of MRONJ in advance would be valuable for managing such adverse events.
Spontaneous reporting systems, which collect data on adverse events in clinical settings over an extended period, play an important role in epidemiological studies, particularly in drug safety evaluations [9,10,11,12,13,14]. A spontaneous reporting system is a drug adverse event database that gathers spontaneous reports from patients, medical professionals, pharmaceutical companies, and other sources. These databases accumulate a huge amount of adverse event reports that are often challenging to obtain at a single institution. In addition, they include data on patients with diverse backgrounds, such as those with renal or hepatic disorders, making a spontaneous reporting system an excellent tool for inductively understanding drug-related adverse events. This reflects not only unique pharmacological and pharmacokinetic characteristics but also prescription and usage conditions [15,16]. In spontaneous reporting system databases, a signal detection approach can be used to identify potential causal relationships between adverse events and drugs, even when such relationships were previously unknown [17,18,19]. Many studies have utilized these databases to explore the association between drugs and adverse events [12,20]. The U.S. Food and Drug Administration (FDA) Adverse Event Reporting System (FAERS) is one of the largest spontaneous reporting databases globally [21].
In recent years, there has been a growing interest in using in silico analysis to evaluate drug toxicity (adverse event evaluation) [22,23]. The physiological activity and physical properties of a drug are typically determined by its chemical structure, which can be analyzed through structural similarity. Quantitative structure–activity relationship (QSAR) analysis is a method that models the relationship between chemical structure and drug efficacy based on this principle [24,25,26,27,28]. This method involves converting the chemical structure of a compound into computationally analyzable features and constructing mathematical models to relate structure to activity. Additionally, machine learning algorithms have been shown to have better performance than traditional logistic regression in predicting binary outcomes [29,30,31]. Because logistic regression analysis is based on the linear relationship between dependent and independent variables, the effectiveness of the model may be reduced significantly for large datasets or variables [32]. However, given that machine learning algorithms are based on nonlinear relationships, they are able to properly recognize and analyze multidimensional and complex features [33]. As a consequence, machine learning models are more effective than logistic regression analysis in large-scale and complex big data analysis [34]. Therefore, by leveraging machine learning to develop an MRONJ-inducing drug prediction model, it becomes possible to assess the risk of MRONJ for various drugs based solely on their chemical structure information. This approach is highly beneficial for screening new compounds and drugs prior to clinical use.
In this study, we integrated data from a drug adverse event database with machine learning techniques to construct an MRONJ-inducing drug prediction model. Initially, drugs associated with MRONJ were extracted from the FAERS drug adverse event database. Subsequently, molecular descriptors representing the structural information of the extracted drugs were calculated, and a classification model for MRONJ-inducing drugs was developed using machine learning. For the MRONJ-induced drug prediction models, we considered three supervised machine learning methods (random forest, gradient boosting, and artificial neural network) and numbers of chemical structure descriptors (5, 6, 7, 8, 9, 10, 20, and 30 descriptors).

2. Results

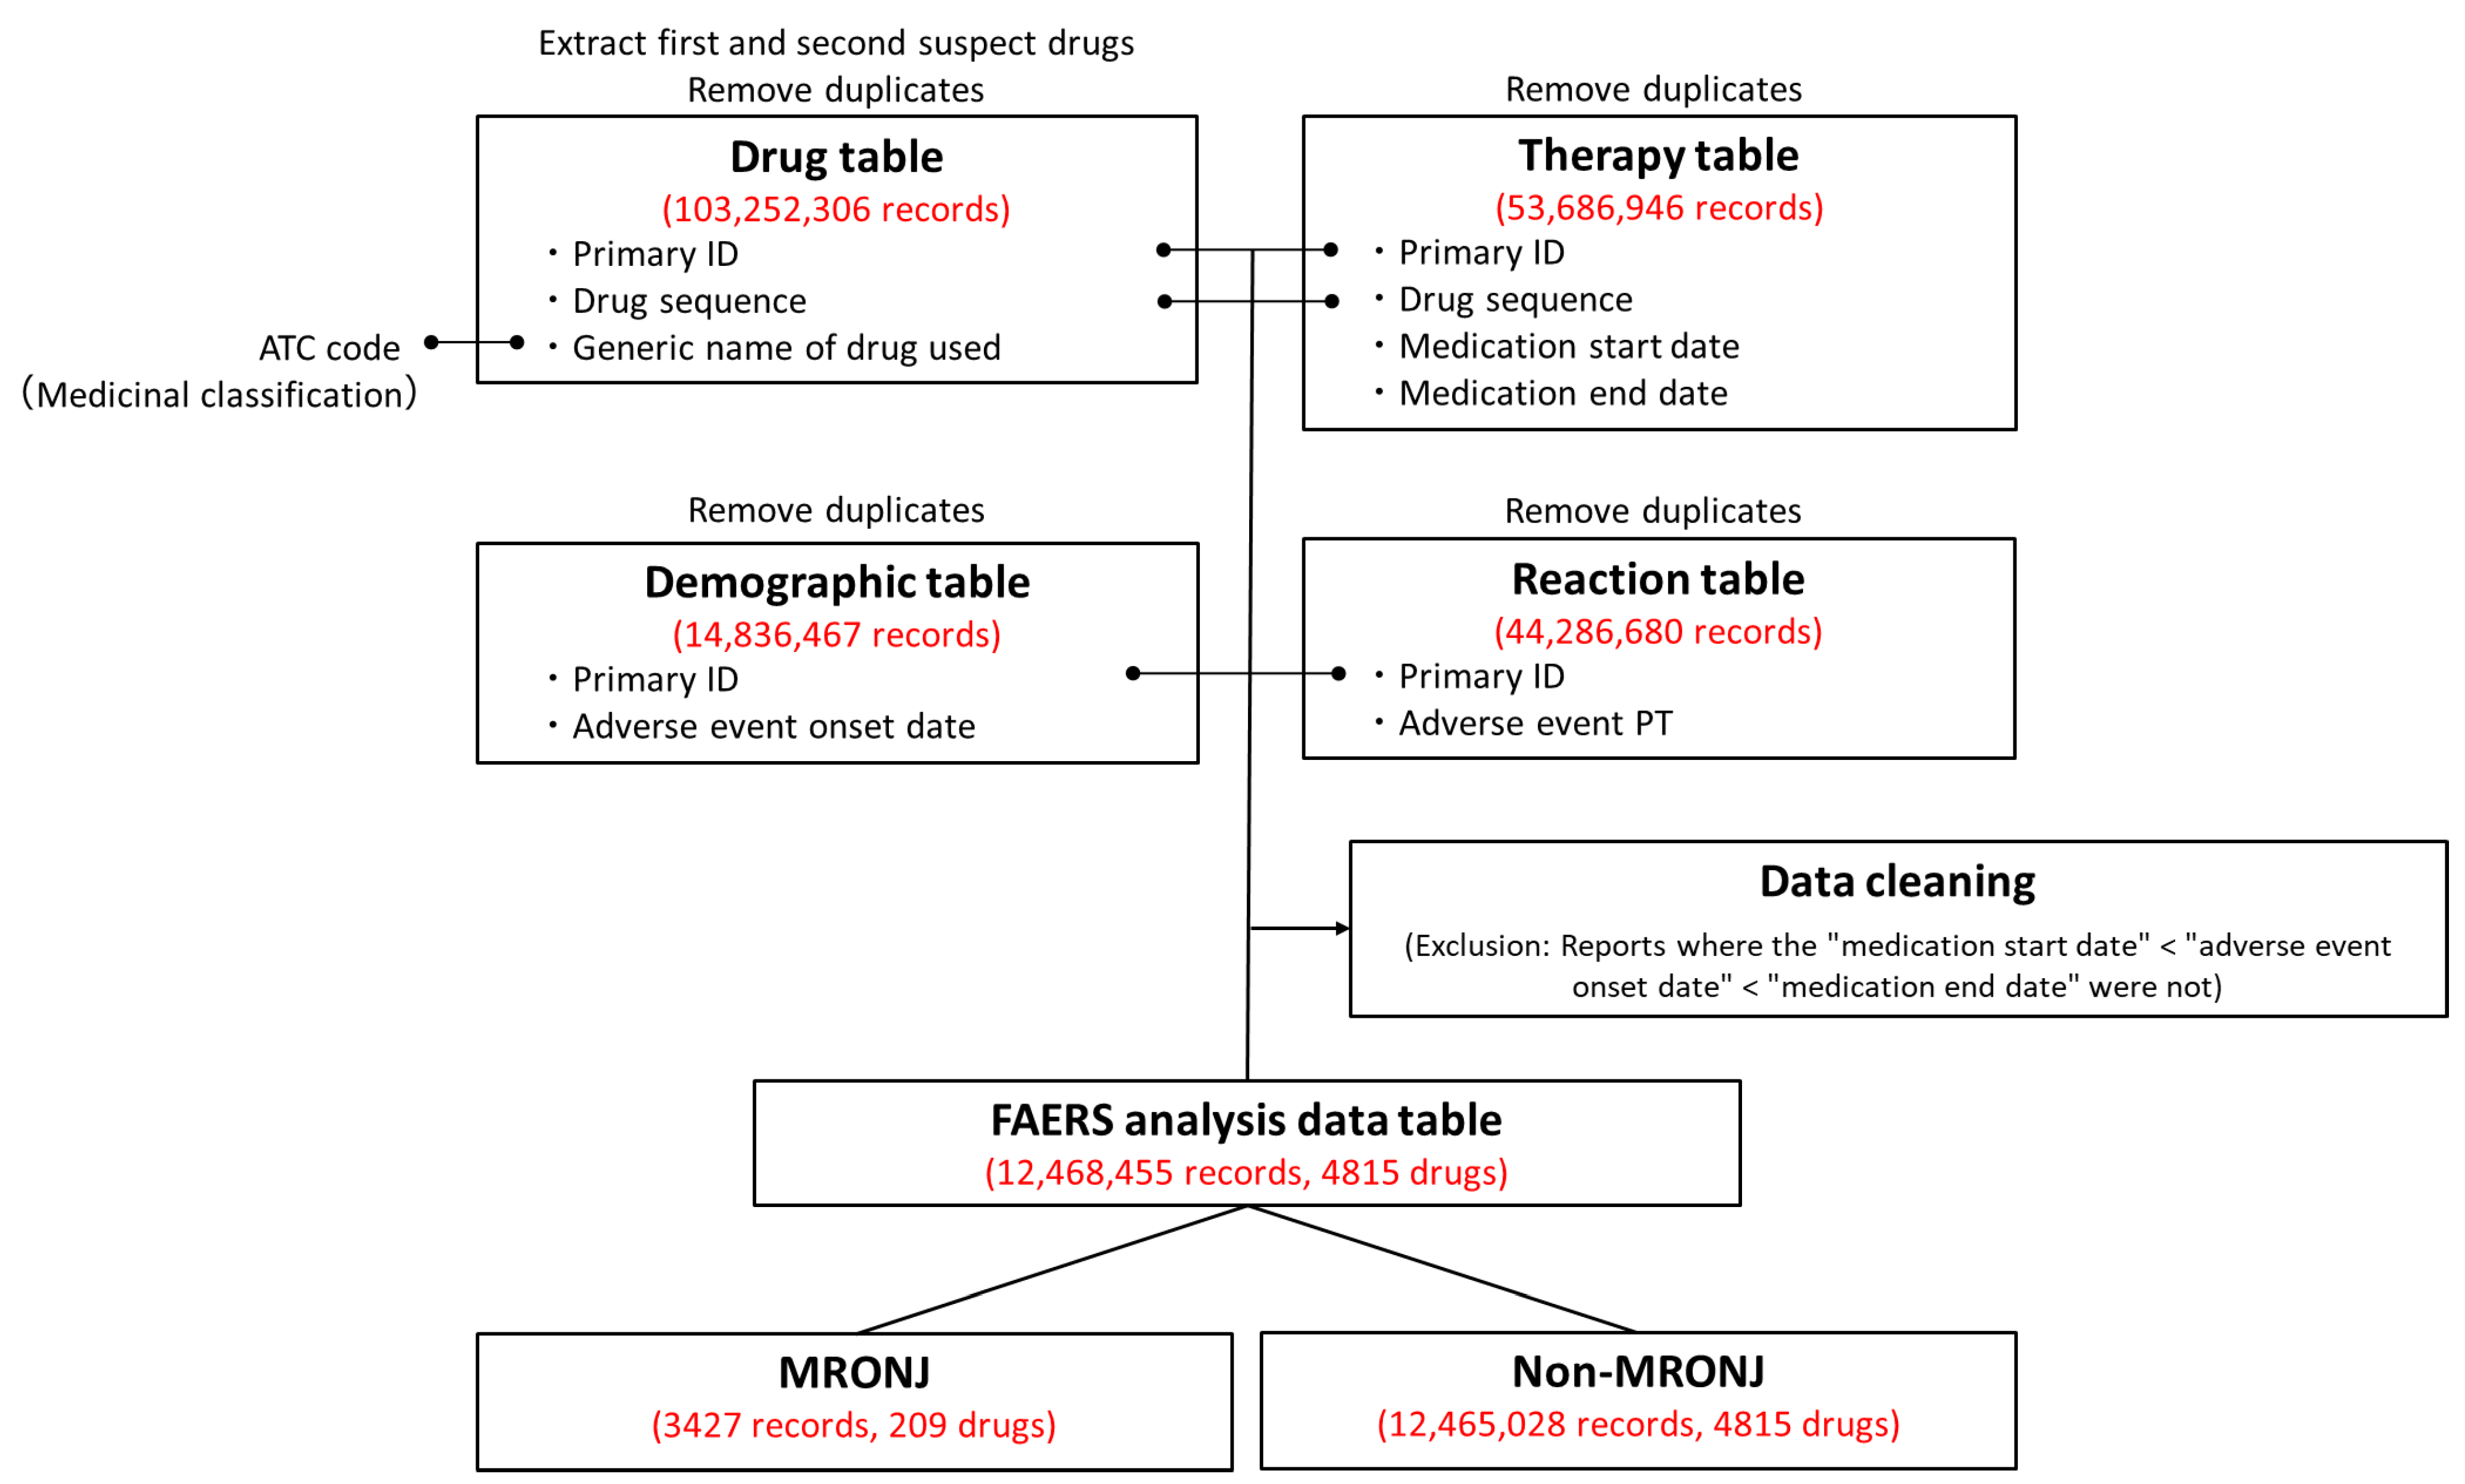
2.1. The FAERS Analysis Data Table

The FAERS analysis data table was created by combining information from the FAERS drug table (drug information), Reaction table (adverse event information), Demographic table (basic case information), and Therapy table (treatment period information). Duplicate records were eliminated from the four tables. Following deduplication, the Drug, Reaction, Demographic, and Therapy tables contained 103,252,306, 44,286,680, 14,836,487, and 53,686,946 records, respectively. These tables were merged, and data cleaning procedures were applied to create the FAERS analysis data table. The table contained adverse event data from 12,468,455 records involving 4815 drugs. Among these, 3427 cases (0.027%) were related to MRONJ.

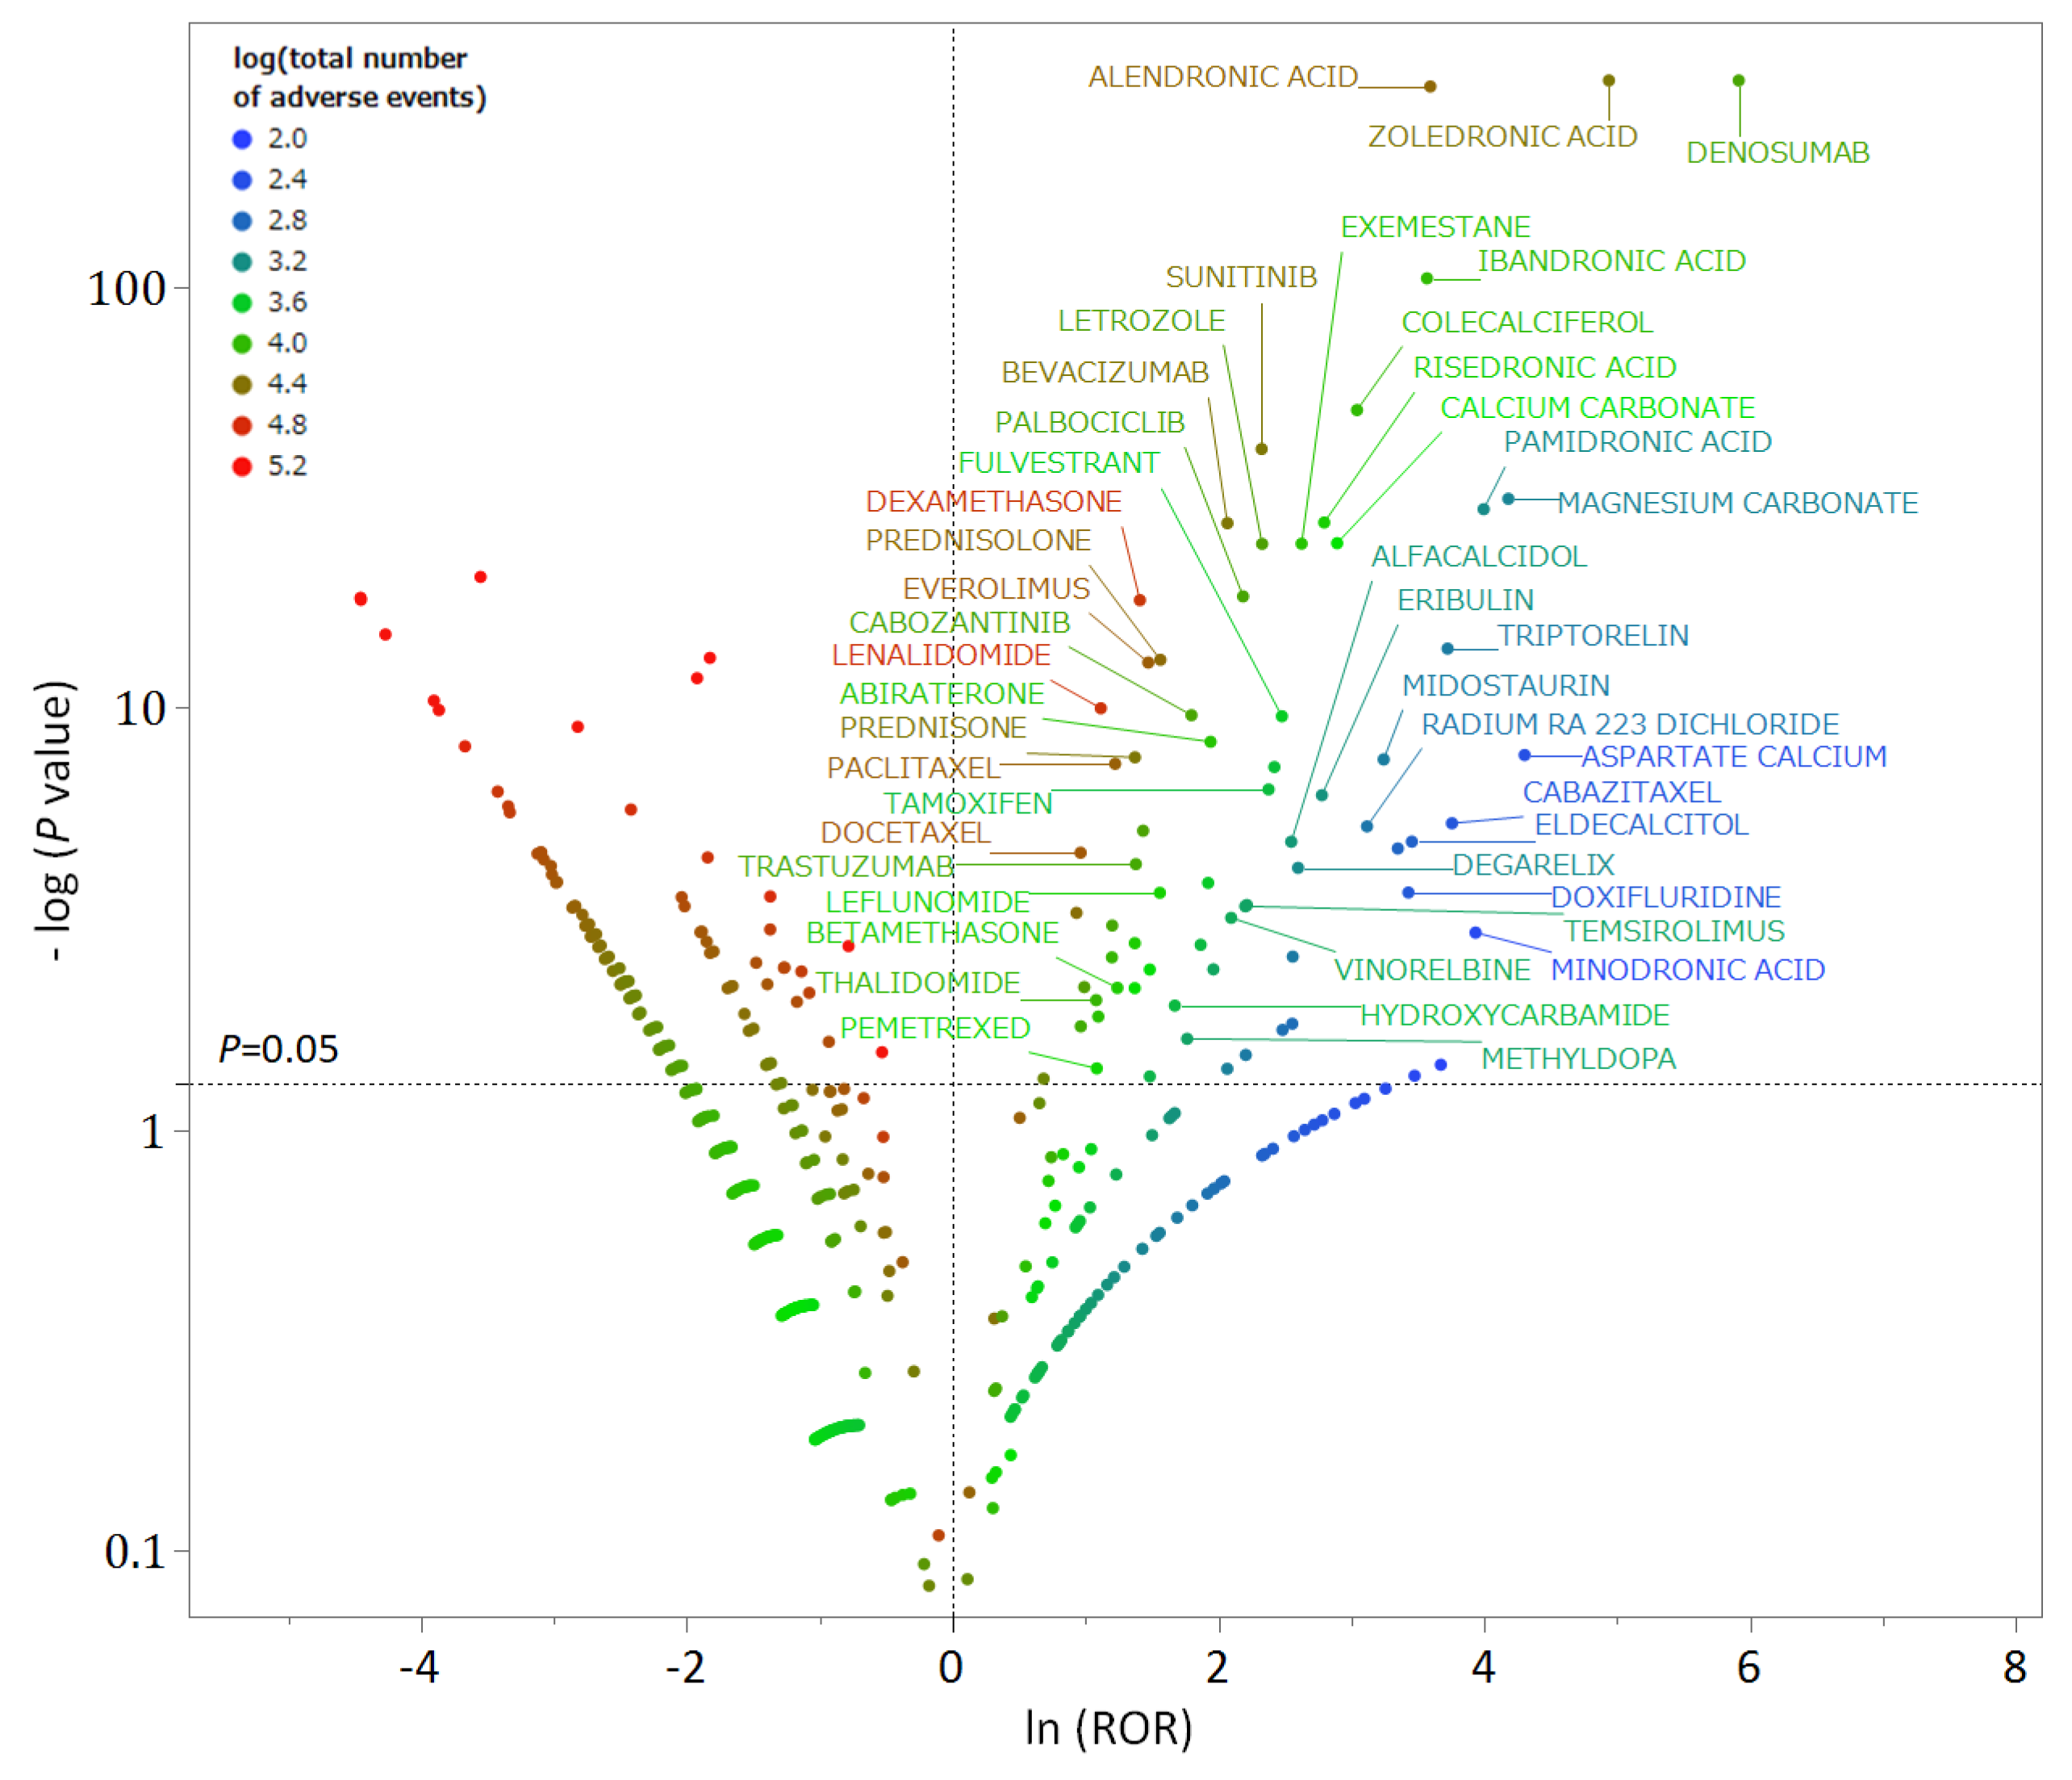
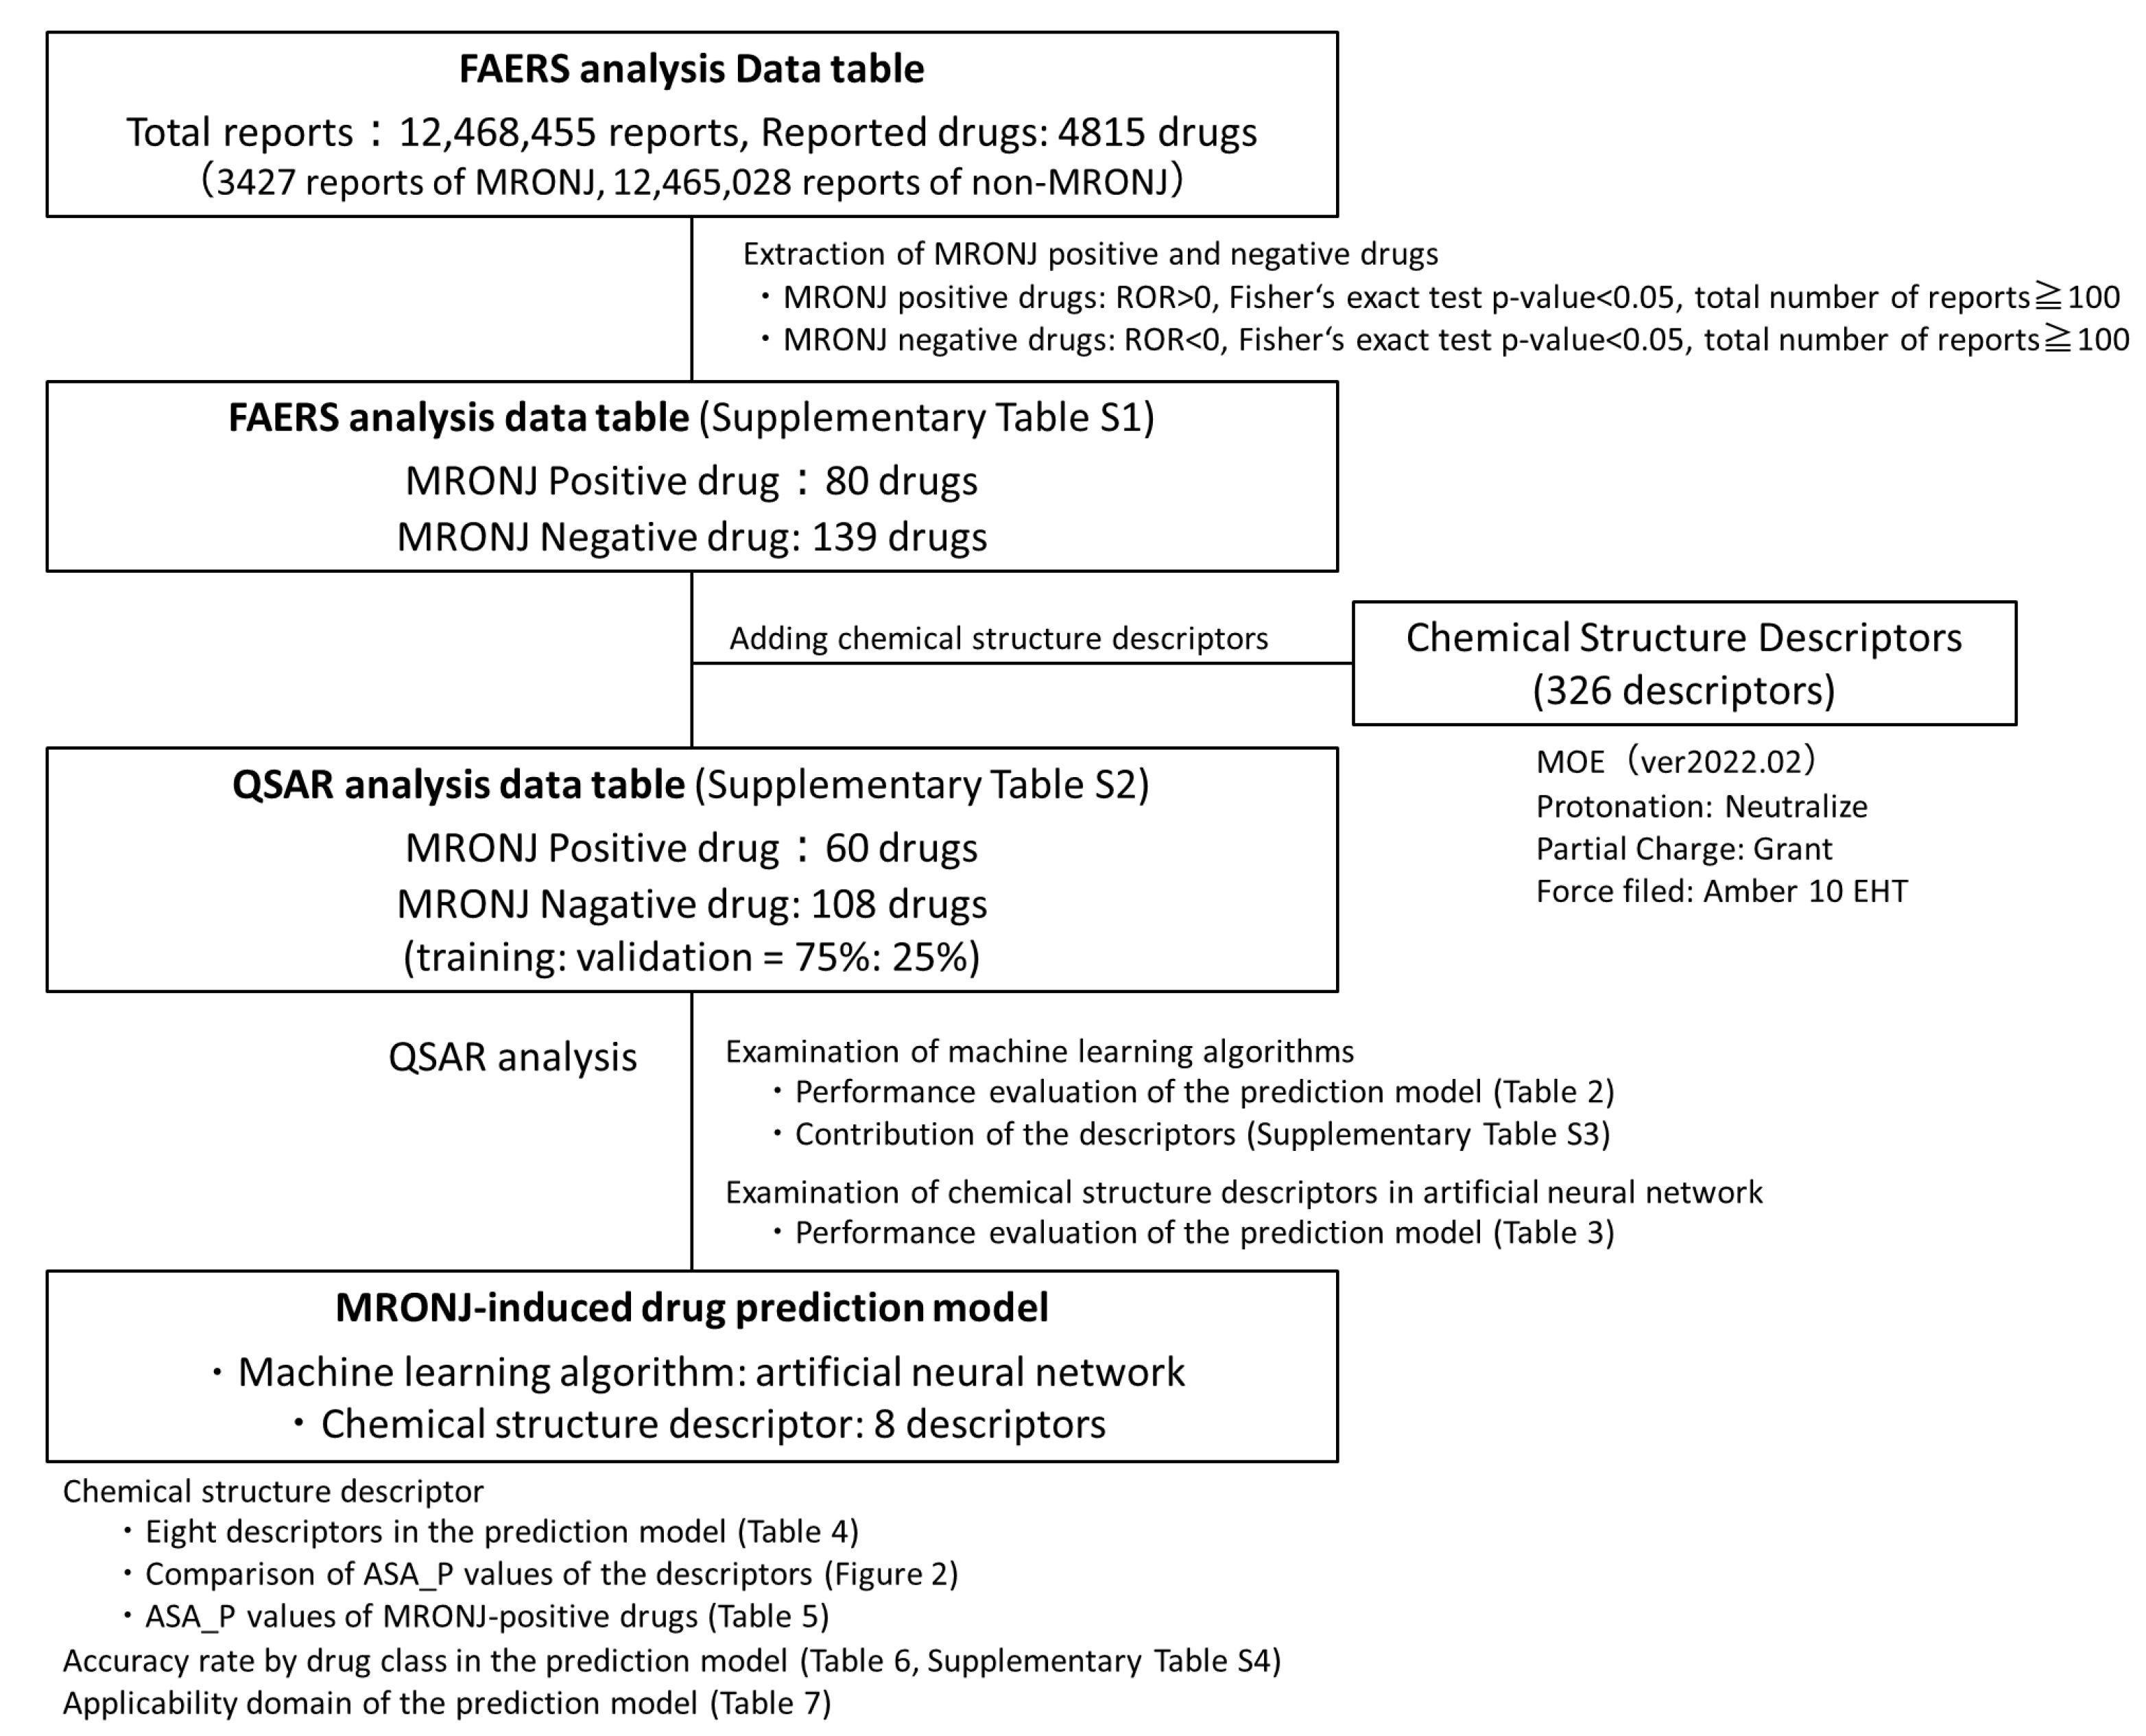
2.2. Positive and Negative Drugs for MRONJ

In the FAERS analysis data table, out of 4815 drugs, 70 were identified as MRONJ-positive and 139 as MRONJ-negative (Supplementary Table S1). A volcano plot was generated to visually represent the relationship between the drugs reported in FAERS and MRONJ (Figure 1). Each point on the scatter plot represents a drug, with MRONJ-positive drugs located in the upper right quadrant and MRONJ-negative drugs in the upper left quadrant. The color of each point represents the total number of reported adverse events for each drug, with more red points and fewer blue points indicating higher numbers of adverse events. Among the 70 MRONJ-positive drugs, 11 were classified as malignant tumor drug protein kinase inhibitors (ATC code: L01E), and 8 were drugs affecting bone structure and mineralization (ATC code: M05B), such as BPs (Supplementary Table S1). The number of reported cases of MRONJ was 907 for denosumab, 702 for zoledronic acid, 264 for alendronate, 92 for ibandronate, 65 for sunitinib, and 60 for dexamethasone (Table 1).

2.3. QSAR Analysis Data Table

A QSAR Analysis Data Table was created by incorporating 326 chemical structure descriptors for MRONJ-positive and -negative candidate drugs identified from the FAERS analysis data table (Supplementary Table S2). The Simplified Molecular Input Line-Entry System (SMILES) of 70 MRONJ-positive drugs and 139 MRONJ-negative drugs in FAERS was verified, and 326 types of chemical structure descriptors calculated using the Molecular Operating Environment (MOE), a chemical calculation environment, were included. The QSAR Analysis Data Table comprised 60 MRONJ-positive drugs and 108 MRONJ-negative drugs for which descriptors were available. Among the drugs affecting bone structure and mineralization (ATC code: M05B), all six drugs, including BPs, were classified as MRONJ-positive drugs (zoledronic acid, alendronic acid, ibandronic acid, risedronic acid, pamidronic acid, and minodronic acid).

2.4. QSAR Analysis Using Machine Learning (Construction of MRONJ-Induced Drug Prediction Model)

In this study, QSAR analysis was conducted to evaluate the machine learning algorithm and the number of chemical structure descriptors to be incorporated into the prediction model. The analysis utilized all chemical structure descriptors for the machine learning algorithms random forest, gradient boosting, and artificial neural network to construct MRONJ-induced drug prediction models (Table 2). Default hyperparameter values of JMP Pro 16.2.0 analysis software were used for the three machine learning algorithms. For random forest, the hyperparameter conditions included 100 trees, 81 terms per branch, and a minimum branch size of 5. Gradient boosting utilized two branches per tree, 48 layers, and a learning rate of 0.02. The artificial neural network employed the Tan H activation function, three layers, and a learning rate of 0.1. Consequently, the area under the receiver operating characteristic curve (AUROC) values in the model validation for random forest, gradient boosting, and artificial neural network using 326 descriptors were 0.726, 0.714, and 0.741, respectively (Table 2). Thus, among the three algorithms, artificial neural network showed the highest prediction accuracy (validation AUROC = 0.741, Table 2).
Furthermore, to enhance computational efficiency and prediction accuracy, we investigated the optimal number of chemical structure descriptors to be incorporated into the artificial neural network prediction model with the highest AUROC (Table 3). Due to the challenge of assessing the importance of each chemical structure descriptor in the artificial neural network prediction model, descriptors with the highest contribution rates from the random forest model were selected (Supplementary Table S3). Using the top 5, 6, 7, 8, 9, 10, 20, and 30 chemical structure descriptors with the highest contribution rates, the validation AUROCs were 0.699, 0.724, 0.719, 0.778, 0.761, 0.748, 0.724, and 0.716, respectively (Table 3). Thus, in this study, the model incorporating the artificial neural network algorithm and the top eight chemical structure descriptors showed the highest predictive accuracy (validation AUROC = 0.778). The validation AUROC value of 0.778 indicates the success of our prediction model in identifying MRONJ-inducing drugs [35].
The eight key descriptors of the top-performing artificial neural network algorithm included ASA_P (total polar surface area), PEOE_VSA_FHYD (fractional hydrophobic dw surface area), PEOE_VSA-5 (total negative 5 dw surface area), h_pavgQ (average total charge), lip_acc (Lipinski Acceptor Count), vsa_acc (VDW acceptor surface area [A**2]), vsa_pol (VDW polar surface area [A**2]), and CASA- (charge-weighted negative surface area) (Table 4). Among these eight descriptors, ASA_P contributed the most. The mean ± standard deviation of ASA_P in the MRONJ-positive and MRONJ-negative drug groups was 220.72 ± 84.95 and 176.09 ± 193.00, respectively, with significant differences (p < 0.0001) (Figure 2). Specifically, BPs and anticancer drugs exhibited higher values for ASA_P in the MRONJ-positive drug group (Table 5).
The accuracy rates of the 168 drugs incorporated into the MRONJ prediction model constructed in this study, categorized by drug efficacy group, are presented in Table 6 (top 13 drug classes) and Supplementary Table S4 (all drug classes). Notably, M05B drugs affecting bone structure and mineralization and L04A immunosuppressants achieved accuracy rates exceeding 80%. Conversely, J05A direct acting antivirals and N06A antidepressants had accuracy rates below 0.5.
The predictive model’s performance was assessed by excluding drugs near the cutoff value in the ROC curve to define the applicability domain (Table 7). By setting the applicability domain, the model’s reliability within a specific data range can be determined. Excluding drugs within ±0%, ±10%, and ±20% of the cutoff value resulted in 42, 32, and 17 drugs falling within the applicability domain, respectively, with balanced accuracies of 0.693, 0.750, and 0.800; F values of 0.593, 0.645, and 0.778; and Matthews correlation coefficients of 0.409, 0.488, and 0.618, respectively. Therefore, the performance of the MRONJ predictive model was improved by narrowing the applicability domain.

3. Discussion

3.1. Analysis of the Adverse Drug Reaction Database FAERS

In this study, we developed a prediction model to classify MRONJ-inducing drugs based solely on their structural information using the FAERS adverse drug reaction database and a machine learning algorithm. To the best of our knowledge, this is the first study to build an MRONJ-inducing drug prediction model utilizing an adverse drug reaction database. Due to the challenge of accurately determining MRONJ risk from the FAERS database, we assessed it using three indicators: reporting odds ratio (ROR), Fisher’s exact test, and the total number of reports for each drug. ROR is widely used for signal detection of adverse events in adverse drug event databases. However, ROR is susceptible to inflation and false signal detection when the number of reports is limited. Therefore, in this study, in addition to ROR, we comprehensively evaluated MRONJ risk by incorporating Fisher’s exact test and the total number of reports.
From the FAERS analysis data table, 80 drugs were identified as MRONJ-positive and 139 as MRONJ-negative. Among the MRONJ-positive drugs, frequently reported drugs included BPs, such as zoledronic acid, alendronic acid, and ibandronic acid; the anti-receptor activator of nuclear factor kappa B ligand (RANKL) antibody denosumab; anticancer drugs like sunitinib, bevacizumab, everolimus, and letrozole; as well as corticosteroids, such as dexamethasone and prednisolone (Table 1). BPs (ATC code: M05B) have a strong affinity for bone hydroxyapatite, inhibit osteoclast activity, reduce bone resorption, and are used to treat osteoporosis and malignant tumors [36]. BPs are closely associated with MRONJ [2]. Monitoring the use of BPs for both malignant tumors and osteoporosis is crucial. Denosumab, an anti-RANKL antibody, has also been linked to MRONJ [37,38]. However, denosumab was not included in the QSAR analysis due to its nature as an antibody preparation. Several protein kinase inhibitors (ATC code: L01E) used in anticancer therapy were also found to be associated with MRONJ, with sunitinib exacerbating MRONJ in renal cell carcinoma [39]. Antiangiogenic drugs also contribute to MRONJ development [40], with varying effects depending on the drug’s mechanism of action [41]. Corticosteroids such as dexamethasone and prednisolone (ATC code: D07A) have been shown to increase the risk of developing MRONJ [42] by delaying wound healing through immunosuppression and altering the oral microbiota, increasing the risk of oral infections and MRONJ [37,43]. Selective estrogen receptor modulators, oral contraceptives, and sex hormone preparations may also influence MRONJ development. Estrogen, a sex hormone, has been shown to impact bone remodeling, potentially affecting jaw bone remodeling [44].
This study highlights the potential association between various drugs and MRONJ. While MRONJ is commonly linked to bone resorption inhibitors and antiangiogenic drugs, other medications have also been reported to induce this condition [14,45]. In this study, all drugs registered in the adverse event database were comprehensively examined under the same analysis conditions. The fact that some bone resorption inhibitors and antiangiogenic drugs were detected as MRONJ-positive drugs using this analysis method ensures the reliability of the other detected drugs.

3.2. Construction of the MRONJ-Induced Drug Prediction Model

Our goal was to improve the prediction model’s accuracy by comparing three different machine learning algorithms and determining the optimal number of chemical structure descriptors. In the study of three machine learning algorithms, the AUCROCs of random forest, gradient boosting, and artificial neural network were 0.726, 0.714, and 0.741 respectively, with the artificial neural network building the best prediction model (Table 2). While examining the number of chemical structure descriptors, the AUCROCs for each of the prediction models with 5, 6, 7, 8, 9, 10, 20, and 30 descriptors were 0.699, 0.724, 0.719, 0.778, 0.761, 0.748, 0.724 and 0.716, with the prediction models incorporating eight descriptors being the best constructed prediction model (Table 3). Therefore, in this study, an artificial neural network machine learning algorithm and eight chemical structure descriptors were used to build a MRONJ-induced drug prediction model, achieving a validation AUROC of 0.778 (Table 3). To address the challenge of assessing the individual contribution of each descriptor in the artificial neural network, a prediction model was constructed using chemical structure descriptors with a large contribution rate in a random forest. The best MRONJ prediction model consisting of eight descriptors demonstrated a negative predictive value of 0.767, specificity of 0.852, and minimal false negatives (Table 3). Notably, the prediction model exhibited high accuracy rates for drug categories affecting bone structure and mineralization (ATC code: M05B) and immunosuppressants (ATC code: L04A) known to be associated with MRONJ development (Table 6). Our findings suggest that the developed MRONJ-inducing drug prediction model can effectively identify important MRONJ-positive drugs while excluding MRONJ-negative drugs, thereby reducing the risk of overlooking critical medications.
The MRONJ-inducing drug prediction model selected eight molecular descriptors. Many of the descriptors were related to polar surface area, such as ASA_P, PEOE_VSA_FHYD, PEOE_VSA-5, and CASA-; and to van der Waals forces, such as vsa_acc and vsa_pol (Table 4). ASA_P was the most contributing descriptor in this study, and was higher in value in the MRONJ-positive drug group than in the MRONJ-negative drug group (Figure 2). Specifically, BPs and anticancer drugs showed high ASA_P values in the MRONJ-positive drug group (Table 5). BPs are drugs with a high polar surface area that have multiple phosphate and hydroxyl groups, and in this study, the descriptor ASA_P showed a high value. The hydroxyl groups of BPs have a high affinity for bone hydroxyapatite and specifically adsorb to bone cells [46,47]. BPs bound to bone tissue are taken up by osteoclasts, inhibiting their function and reducing bone resorption [48,49]. Additionally, BPs adsorbed to bone cells have been reported to inhibit osteoclast-mediated angiogenesis [50] and affect immune regulation [51]; these mechanisms may influence MRONJ [52]. Similarly, many anticancer drugs designed to target specific molecules have large polar surface areas [53]. Of the 14 anticancer drugs analyzed, 11 protein kinase inhibitors (ATC code: L01E) were confirmed to be MRONJ-positive drugs (Supplementary Table S1). While anticancer drugs have been reported to directly affect osteoclasts and osteoblasts, the underlying mechanism remains to be elucidated [54,55]. Furthermore, the MRONJ prediction model in this study incorporated descriptors related to van der Waals forces, vsa_acc, and vsa_pol. Van der Waals forces play a pivotal role in the binding properties and biological effects of BPs [56]. Particularly, they are thought to facilitate the binding of BPs to the bone and contribute to its stability [57].
The applicability domain of the MRONJ-induced drug prediction model was confirmed to exclude probabilities close to the cutoff value of the ROC curve. By setting the applicability domain within a chemical space, drugs falling within this region can yield reliable prediction outcomes. Consequently, narrowing the application region enhanced the model’s performance.

3.3. Limitations

Drug adverse reaction databases such as FAERS have biases and limitations in information collection. FAERS relies on self-reported adverse drug reaction information, which introduces human biases such as reporting bias [58], making it challenging to accurately assess drug risks. Moreover, the detection of false signals of adverse drug reactions may occur when multiple drugs are used [59]. Therefore, in this study, we carefully identified MRONJ-inducing drugs by employing time-series data cleaning methods that consider the characteristics of FAERS and three evaluation indicators (ROR, Fisher’s exact test, and total number of reports) for signal detection.
The quality of a machine learning-based prediction model depends on the quality of the input data [60]. Ideally, reliable data encompassing both positive and negative MRONJ drugs should be included in the learning dataset for QSAR analysis. However, the FAERS data utilized in this study may contain inappropriate reports, leading to limitations in the prediction model’s accuracy. Additionally, due to the rarity of MRONJ, the number of reports in FAERS was limited, resulting in a constrained number of MRONJ-positive drugs in the QSAR analysis dataset. Consequently, the prediction model’s applicability domain in this study may be limited [61,62]. Furthermore, the lack of patient information, such as the genetic background of patients, poses a challenge in explaining individual differences in the onset of adverse events. In future research, Bayesian signal detection methods and cross-validation; standardized scaling methods; and interpretability tools, such as SHAP, can be tested to further optimize our model. Moreover, we plan to validate our model using independent databases (e.g., SIDER and LAREB) or future real-world data to increase its generalizability and clinical utility. Consequently, our findings could be applied to practical strategies for preventing MRONJ in at-risk populations. Moreover, it is essential to determine whether drugs found to be relevant in MRONJ affect the biological pathways involved in osteoclast activity, angiogenesis, and immune regulation to establish a mechanistic association between ASA_P and the MRONJ pathophysiology.

4. Materials and Methods

4.1. Creation of the FAERS Analysis Data Table

For the analysis in this study, data reported to FAERS from January 2004 to March 2022 were utilized to create data tables for FAERS analysis (Figure 3). The adverse event data reported to FAERS are stored in seven data tables. In this study, four data tables were utilized: the Drug table (containing drug information), the Reaction table (providing adverse event information), the Demographic table (offering basic case information), and the Therapy table (presenting treatment duration information), with duplicate reports removed [26,27]. The drugs in the Drug table were categorized into first and second suspected drugs and concomitant drugs and interactions, with only the first and second suspected drugs being considered in this study. World Health Organization drug classification ATC codes were assigned to each drug to facilitate drug effect tabulation [63,64]. The Reaction table documented adverse events according to the ICH International Glossary of Pharmaceutical Terms (Medical Dictionary for Regulatory Activities version 25.0; MedDRA ver. 25.0) based on the preferred term [65,66]. In this study, the adverse event “osteonecrosis of the jaw“ in the Reaction table was defined as “medication-related osteonecrosis of the jaw,” with a column added to indicate whether it was MRONJ or not. The Drug and Therapy tables were initially joined using “Primary ID“ and “Drug sequence,” followed by the joining of the Reaction and Demographic tables using “Primary ID.” Additionally, for data cleaning purposes, only data from the Demographic table with adverse event onset dates falling within the Therapy table treatment start and end dates were extracted to create a consistent time-series data table for FAERS analysis.

4.2. Examination of the FAERS Analysis Data Tables (Extraction of Positive and Negative MRONJ Drugs)

The drugs in the FAERS Analysis Data Tables were assessed using three indices: the ROR and Fisher’s exact test, along with the total number of reports for each drug. Initially, a 2 × 2 contingency table for MRONJ was created for each of the 4815 drugs in the FAERS analysis data table, and the p-values for ROR and Fisher’s exact test were calculated (Figure 4). To stabilize the estimate, a correction was applied by adding 0.5 to all cells (Haldane Anscombe 1/2 correction) [67,68].
ROR is a key indicator in nonproportional analysis methods utilized for detecting adverse drug signals in pharmacovigilance [69]. It offers high sensitivity and low bias, enabling the estimation of the association between the drug and the adverse event [19]. However, classical signal detection indicators such as ROR may overestimate the signal and lead to unstable statistical estimates in cases of low reporting [70,71]. To address this, Eudra Vigilance guidelines recommend a minimum number of reports to ensure a stable signal [72]. In the present study, a threshold of 100 reports (Figure 4; a + b ≥ 100) was set for the total number of reports for each drug (Figure 4; a + b) to prevent the oversight of commonly used drugs [73]. In addition, Fisher’s exact test was used to assess the independence of drugs and MRONJ in the 2 × 2 contingency table in Figure 4. Consequently, the criteria for identifying MRONJ-positive drugs included ROR >1, Fisher’s exact test p-values <0.05, and total adverse event reports ≥100, while MRONJ-negative drugs met the criteria of ROR <1, Fisher’s exact test p-values <0.05, and total adverse event reports ≥100.
In addition, this study utilized a scatter plot (volcano plot) to visualize the MRONJ-positive and -negative drug candidates from the FAERS analysis data table. Volcano plots, commonly used in bioinformatics to analyze gene expression trends, were employed in this study [73,74,75]. In the volcano plot, the x-axis represents the natural logarithm of the ROR (lnROR), while the y-axis represents the ordinary logarithm [−log (p-value)] of Fisher’s exact test p-value. The x-axis indicates the risk of MRONJ development when lnROR > 0 (ROR > 1), while the y-axis indicates a −log p-value >1.3 (p < 0.05), indicating a significant difference in the 2 × 2 contingency table shown in Figure 4. Each point on the plot represents a drug, with the color of the point indicating the total number of adverse event reports (a + b in Figure 4), where drugs with a high number of reports are depicted in red and those with a low number in blue. Only drugs with 100 or more adverse event reports were included in the analysis. Therefore, MRONJ-positive drugs are located in the upper right-hand corner of the plot, while MRONJ-negative drugs are in the upper left-hand corner.

4.3. Creation of QSAR Analysis Data Tables (Addition of Chemical Structure Descriptors)

Data tables for the QSAR analysis were created by incorporating chemical structure descriptors for MRONJ-positive and -negative drugs (Figure 5, Supplementary Table S2). The chemical structures of the drugs were obtained from the PubChem compound database in the form of SMILES, a linear representation of molecular structures [76]. Chemical structure descriptors were calculated using the MOE version 2022.02 (Chemical Computing Group, Inc., Montreal, QC, Canada) [77], a specialized chemical computing platform. Prior to descriptor calculations, water molecules and counter ions were eliminated through desalting. Each drug was converted to a three-dimensional structure, assessed for partial charge, and optimized using force field calculations (Amber 10 EHT). A total of 326 chemical structure descriptors were calculated for each drug. Descriptor variables with missing values or perfect collinearity (r2 = 1) were excluded. Mixtures, large peptides, bacterial preparations, inorganic compounds, organometallic compounds, and drugs with unspecified names or abbreviations were also removed. Enoxaparin was excluded due to duplication in the dataset. Consequently, the data table for the QSAR analysis comprised 326 chemical structure descriptors for 60 MRONJ-positive and 108 MRONJ-negative drugs. To validate the model, the data table was randomly divided into a 3:1 ratio for training and validation purposes.

4.4. QSAR Analysis Using Machine Learning Algorithms (Construction of MRONJ-Induced Drug Prediction Model)

A MRONJ-induced drug prediction model was constructed through QSAR analysis using machine learning algorithms (Figure 5). The algorithms considered were random forests, gradient boosting, and artificial neural networks, all available in the JMP analysis software. Each algorithm has distinct approaches and characteristics. Random forest [78] and gradient boosting [79] are ensemble learning methods that combine several weak learners, such as decision trees. Random forest is known for its stability and improved accuracy through bagging [78], while gradient boosting achieves high prediction performance through sequential error correction by boosting [79]. On the other hand, artificial neural networks consist of multi-layered structures with input, hidden, and output layers containing multiple neurons, enabling them to learn complex nonlinear relationships [80]. In this study, the artificial neural network was constructed using a multilayer perceptron neural network with a back-propagation algorithm for nonlinear regression. Boosting was employed as the ensemble method for the artificial neural network. It is crucial to utilize these algorithms differently due to their unique approaches and characteristics. Although z-score normalization can be beneficial in certain contexts, we did not apply it uniformly in this study because the decision tree-based algorithms (random forest and gradient boosting) used do not strictly require data scaling. Instead, we employed the default preprocessing in our software environment (MOE and JMP). Therefore, three supervised machine learning algorithms were examined and compared by constructing predictive models using default hyperparameters and 326 chemical structure descriptors.
Furthermore, this study investigated the optimal number of chemical structure descriptors in the artificial neural network. It is beneficial to develop predictive models with fewer descriptors for computational efficiency and explainability. Artificial neural networks are effective in capturing nonlinear relationships, but determining the significance of each descriptor in the model can be challenging. On the other hand, random forests utilize decision trees to assess feature importance. In this study, the top chemical structure descriptors with the largest contribution in the random forest model were selected and integrated into the artificial neural network algorithm [81,82]. In addition, we analyzed the descriptors used in constructing the MRONJ predictive model and interpreted the drug characteristics associated with MRONJ.
The predictive performance of the MRONJ-induced drug prediction model was evaluated using metrics such as AUROC, accuracy, precision (positive predictive value), negative predictive value, recall-sensitivity, specificity, balanced accuracy, F1-score, and Matthews correlation coefficient. To mitigate overfitting, we employed a hold-out method with a 3:1 split for training and validation sets in addition to built-in regularization parameters (e.g., limiting the maximum tree depth or minimum branch size).
The applicability domain was assessed by determining the cutoff value on the ROC curve of the artificial neural network prediction model [83]. Defining the scope of application helps to establish the reliable prediction range of the constructed model. In this study, the cutoff value was determined using Youden’s index [84] and normalized to 0.5. Additionally, the model’s performance within the applicability domain was assessed by building a predictive model that excluded drugs with deviations of ±0%, ±10%, and ±20% from the cutoff value.

4.5. Statistical Analysis

All analyses were conducted using JMP Pro 16.2.0 (SAS Institute Inc., Cary, NC, USA), and a p-value less than 0.05 was considered significant.

5. Conclusions

In this study, an MRONJ-induced drug prediction model was constructed using chemical structure information, the FEARS database of drug adverse events, and machine learning. The model, based on an artificial neural network algorithm and eight chemical structure descriptors, identified drugs with polar surface area characteristics as potential contributors to MRONJ. These findings could enhance risk assessment in clinical trials and postmarketing surveillance as well as streamline screening in new drug development. Such prediction models can be integrated into clinical decision support tools to guide personalized drug risk management, highlighting the potential of in silico methodologies in drug surveillance and precision medicine.

Supplementary Materials

The following supporting information can be downloaded at: https://www.mdpi.com/article/10.3390/ph18030423/s1, Table S1: 70 MRONJ-positive drugs and 139 MRONJ-negative drugs. Table S2: QSAR analysis data table. Table S3: Contribution of chemical structure descriptors in random forests. Table S4: Accuracy rate by therapeutic class of drugs incorporated into the MRONJ prediction model (all drug classes).

Author Contributions

Conceptualization, S.T. and Y.U.; methodology, Y.U.; software, Y.U.; validation, S.T., K.S., M.Y. and Y.U.; formal analysis, S.T. and Y.U.; investigation, S.T. and Y.U.; resources, S.T. and Y.U.; data curation, S.T. and Y.U.; writing—original draft preparation, S.T., K.S., M.Y. and Y.U.; writing—review and editing, S.T., K.S., M.Y. and Y.U.; visualization, S.T. and Y.U.; supervision, S.T. and Y.U.; project administration, Y.U.; funding acquisition, Y.U. All authors have read and agreed to the published version of the manuscript.

Funding

This research received no external funding.

Institutional Review Board Statement

Ethical review and approval were waived for this study by the Ethics Committee of Meiji Pharmaceutical University as the study used anonymized data from an open-access database.

Informed Consent Statement

Patient consent was waived by the Ethics Committee of Meiji Pharmaceutical University as this study used anonymized data from an open-access database.

Data Availability Statement

Data are contained within the article. Data from the FAERS database were downloaded from the website of the U.S. Food and Drug Administration (FDA) (https://www.fda.gov/drugs/drug-approvals-and-databases/fda-adverse-event-reporting-system-faers-database) in 15 June 2022.

Acknowledgments

The authors thank the staff of the National Hospital Organization Kanagawa Hospital and the Department of Medical Molecular Informatics at Meiji Pharmaceutical University as well as our families for their support.

Conflicts of Interest

The authors declare no conflicts of interest.

Abbreviations

The following abbreviations are used in this manuscript:
AUROCArea under the receiver operating characteristic curve
FDAFood and Drug Administration
MRONJMedication-related osteonecrosis of the jaw
QSARQuantitative structure–activity relationship
RANKLReceptor activator of nuclear factor kappa B ligand
RORReporting odds ratio
SMILESThe Simplified Molecular Input Line-Entry System

References

  1. Khan, A.A.; Morrison, A.; Hanley, D.A.; Felsenberg, D.; McCauley, L.K.; O’Ryan, F.; Reid, I.R.; Ruggiero, S.L.; Taguchi, A.; Tetradis, S.; et al. Diagnosis and management of osteonecrosis of the jaw: A systematic review and international consensus. J. Bone Miner. Res. 2015, 30, 3–23. [Google Scholar] [CrossRef] [PubMed]
  2. Ruggiero, S.L.; Dodson, T.B.; Aghaloo, T.; Carlson, E.R.; Ward, B.B.; Kademani, D. American Association of Oral and Maxillofacial Surgeons’ Position Paper on Medication-Related Osteonecrosis of the Jaws-2022 Update. J. Oral Maxillofac. Surg. 2022, 80, 920–943. [Google Scholar] [CrossRef] [PubMed]
  3. Ishimaru, M.; Ono, S.; Morita, K.; Matsui, H.; Hagiwara, Y.; Yasunaga, H. Prevalence, Incidence Rate, and Risk Factors of Medication-Related Osteonecrosis of the Jaw in Patients with Osteoporosis and Cancer: A Nationwide Population-Based Study in Japan. J. Oral Maxillofac. Surg. 2022, 80, 714–727. [Google Scholar] [CrossRef]
  4. King, R.; Tanna, N.; Patel, V. Medication-related osteonecrosis of the jaw unrelated to bisphosphonates and denosumab—A review. Oral Surg. Oral Med. Oral Pathol. Oral Radiol. 2019, 127, 289–299. [Google Scholar] [CrossRef]
  5. Anastasilakis, A.D.; Pepe, J.; Napoli, N.; Palermo, A.; Magopoulos, C.; Khan, A.A.; Zillikens, M.C.; Body, J.J. Osteonecrosis of the Jaw and Antiresorptive Agents in Benign and Malignant Diseases: A Critical Review Organized by the ECTS. J. Clin. Endocrinol. Metab. 2022, 107, 1441–1460. [Google Scholar] [CrossRef]
  6. Japanese Allied Committee on Osteonecrosis of the Jaw; Yoneda, T.; Hagino, H.; Sugimoto, T.; Ohta, H.; Takahashi, S.; Soen, S.; Taguchi, A.; Nagata, T.; Urade, M.; et al. Antiresorptive agent-related osteonecrosis of the jaw: Position Paper 2017 of the Japanese Allied Committee on Osteonecrosis of the Jaw. J. Bone Miner. Metab. 2017, 35, 6–19. [Google Scholar] [CrossRef]
  7. Schiodt, M.; Otto, S.; Fedele, S.; Bedogni, A.; Nicolatou-Galitis, O.; Guggenberger, R.; Herlofson, B.B.; Ristow, O.; Kofod, T. Workshop of European task force on medication-related osteonecrosis of the jaw-Current challenges. Oral Dis. 2019, 25, 1815–1821. [Google Scholar] [CrossRef]
  8. Campisi, G.; Mauceri, R.; Bertoldo, F.; Bettini, G.; Biasotto, M.; Colella, G.; Consolo, U.; Di Fede, O.; Favia, G.; Fusco, V.; et al. Medication-Related Osteonecrosis of Jaws (MRONJ) Prevention and Diagnosis: Italian Consensus Update 2020. Int. J. Environ. Res. Public Health 2020, 17, 5998. [Google Scholar] [CrossRef]
  9. Edwards, I.R.; Lindquist, M.; Wiholm, B.E.; Napke, E. Quality criteria for early signals of possible adverse drug reactions. Lancet 1990, 336, 156–158. [Google Scholar] [CrossRef]
  10. Kimura, K.; Kikegawa, M.; Kan, Y.; Uesawa, Y. Identifying Crude Drugs in Kampo Medicines Associated with Drug-Induced Liver Injury Using the Japanese Adverse Drug Event Report Database: A Comprehensive Survey. Pharmaceuticals 2023, 16, 678. [Google Scholar] [CrossRef]
  11. Toriumi, S.; Mimori, R.; Sakamoto, H.; Sueki, H.; Yamamoto, M.; Uesawa, Y. Examination of Risk Factors and Expression Patterns of Atypical Femoral Fractures Using the Japanese Adverse Drug Event Report Database: A Retrospective Pharmacovigilance Study. Pharmaceuticals 2023, 16, 626. [Google Scholar] [CrossRef] [PubMed]
  12. Fang, H.; Su, Z.; Wang, Y.; Miller, A.; Liu, Z.; Howard, P.C.; Tong, W.; Lin, S.M. Exploring the FDA Adverse Event Reporting System to generate hypotheses for monitoring of disease characteristics. Clin. Pharmacol. Ther. 2014, 95, 496–498. [Google Scholar] [CrossRef] [PubMed]
  13. Hosoya, R.; Ishii-Nozawa, R.; Terajima, T.; Kagaya, H.; Uesawa, Y. The Association between Molecular Initiating Events and Drug-Induced Hiccups. Pharmaceuticals 2024, 17, 379. [Google Scholar] [CrossRef] [PubMed]
  14. Ahdi, H.S.; Wichelmann, T.A.; Pandravada, S.; Ehrenpreis, E.D. Medication-induced osteonecrosis of the jaw: A review of cases from the Food and Drug Administration Adverse Event Reporting System (FAERS). BMC Pharmacol. Toxicol. 2023, 24, 15. [Google Scholar] [CrossRef]
  15. Nathan, K.T.; Conn, K.M.; van Manen, R.P.; Brown, J.E. Signal detection for bleeding associated with the use of direct oral anticoagulants. Am. J. Health Syst. Pharm. 2018, 75, 973–977. [Google Scholar] [CrossRef]
  16. Sanagawa, A.; Hotta, Y.; Kondo, M.; Nishikawa, R.; Tohkin, M.; Kimura, K. Tumor lysis syndrome associated with bortezomib: A post-hoc analysis after signal detection using the US Food and Drug Administration Adverse Event Reporting System. Anticancer Drugs 2020, 2, 183–189. [Google Scholar] [CrossRef]
  17. Evans, S.J.; Waller, P.C.; Davis, S. Use of proportional reporting ratios (PRRs) for signal generation from spontaneous adverse drug reaction reports. Pharmacoepidemiol. Drug Saf. 2001, 6, 483–486. [Google Scholar] [CrossRef]
  18. Sakaeda, T.; Tamon, A.; Kadoyama, K.; Okuno, Y. Data mining of the public version of the FDA Adverse Event Reporting System. Int. J. Med. Sci. 2013, 7, 796–803. [Google Scholar] [CrossRef]
  19. van Puijenbroek, E.P.; Bate, A.; Leufkens, H.G.; Lindquist, M.; Orre, R.; Egberts, A.C. A comparison of measures of disproportionality for signal detection in spontaneous reporting systems for adverse drug reactions. Pharmacoepidemiol. Drug Saf. 2002, 11, 3–10. [Google Scholar] [CrossRef]
  20. Toriumi, S.; Kobayashi, A.; Sueki, H.; Yamamoto, M.; Uesawa, Y. Exploring the Mechanisms Underlying Drug-Induced Fractures Using the Japanese Adverse Drug Event Reporting Database. Pharmaceuticals 2021, 14, 1299. [Google Scholar] [CrossRef]
  21. FDA Adverse Event Reporting System (FAERS). Available online: https://www.fda.gov/drugs/drug-approvals-and-databases/fda-adverse-event-reporting-system-faers (accessed on 5 June 2022).
  22. Zhang, S. Computer-aided drug discovery and development. Methods Mol. Biol. 2011, 716, 23–38. [Google Scholar] [CrossRef] [PubMed]
  23. Kunimoto, R.; Bajorath, J.; Aoki, K. From traditional to data-driven medicinal chemistry: A case study. Drug Discov. Today 2022, 8, 2065–2070. [Google Scholar] [CrossRef] [PubMed]
  24. Hansch, C.; Maloney, P.; Fujita, T.; Muir, R.M. Correlation of Biological Activity of Phenoxyacetic Acids with Hammett Substituent Constants and Partition Coefficients. Nature 1962, 194, 178–180. [Google Scholar] [CrossRef]
  25. Hansch, C.; Fujita, T. p-σ-π Analysis. A Method for the Correlation of Biological Activity and Chemical Structure. J. Am. Chem. Soc. 1964, 86, 1616–1626. [Google Scholar] [CrossRef]
  26. Hansen, K.; Mika, S.; Schroeter, T.; Sutter, A.; ter Laak, A.; Steger-Hartmann, T.; Heinrich, N.; Müller, K.R. Benchmark data set for in silico prediction of Ames mutagenicity. J. Chem. Inf. Model. 2009, 49, 2077–2081. [Google Scholar] [CrossRef]
  27. Uesawa, Y. Quantitative structure-activity relationship analysis using deep learning based on a novel molecular image input technique. Bioorg. Med. Chem. Lett. 2018, 28, 3400–3403. [Google Scholar] [CrossRef]
  28. Zhang, J.; Mucs, D.; Norinder, U.; Svensson, F. LightGBM: An Effective and Scalable Algorithm for Prediction of Chemical Toxicity-Application to the Tox21 and Mutagenicity Data Sets. J. Chem. Inf. Model. 2019, 59, 4150–4158. [Google Scholar] [CrossRef]
  29. Song, X.; Liu, X.; Liu, F.; Wang, C. Comparison of machine learning and logistic regression models in predicting acute kidney injury: A systematic review and meta-analysis. Int. J. Med. Inform. 2021, 151, 104484. [Google Scholar] [CrossRef]
  30. Liew, B.X.W.; Kovacs, F.M.; Rügamer, D.; Royuela, A. Machine learning versus logistic regression for prognostic modelling in individuals with non-specific neck pain. Eur. Spine J. 2022, 8, 2082–2091. [Google Scholar] [CrossRef]
  31. Song, Y.X.; Yang, X.D.; Luo, Y.G.; Ouyang, C.L.; Yu, Y.; Ma, Y.L.; Li, H.; Lou, J.S.; Liu, Y.H.; Chen, Y.Q.; et al. Comparison of logistic regression and machine learning methods for predicting postoperative delirium in elderly patients: A retrospective study. CNS Neurosci. Ther. 2023, 1, 158–167. [Google Scholar] [CrossRef]
  32. Ranganathan, P.; Pramesh, C.S.; Aggarwal, R. Common pitfalls in statistical analysis: Logistic regression. Perspect. Clin. Res. 2017, 3, 148–151. [Google Scholar] [CrossRef] [PubMed]
  33. Ambe, K.; Ohya, K.; Takada, W.; Suzuki, M.; Tohkin, M. In Silico Approach to Predict Severe Cutaneous Adverse Reactions Using the Japanese Adverse Drug Event Report Database. Clin. Transl. Sci. 2021, 2, 756–763. [Google Scholar] [CrossRef] [PubMed]
  34. Levy, J.J.; O’Malley, A.J. Don’t dismiss logistic regression: The case for sensible extraction of interactions in the era of machine learning. BMC Med. Res. Methodol. 2020, 20, 171. [Google Scholar] [CrossRef]
  35. Polo, T.C.F.; Miot, H.A. Use of ROC curves in clinical and experimental studies. J. Vasc. Bras. 2020, 19, e20200186. [Google Scholar] [CrossRef]
  36. Graharm, R.; Russell, G. Bisphosphonates: The first 40 years. Bone 2011, 49, 2–19. [Google Scholar] [CrossRef]
  37. Saad, F.; Brown, S.F.; Poznak, C.V.; Ibrahim, T.; Stemmer, S.M.; Stopeck, A.T.; Diel, I.J.; Takahashi, S.; Shore, N.; Henry, D.H.; et al. Incidence, risk factors, and outcomes of osteonecrosis of the jaw: Integrated analysis from three blinded active-controlled phase III trials in cancer patients with bone metastases. Ann. Oncol. 2012, 23, 1341–1347. [Google Scholar] [CrossRef]
  38. Hasegawa, S.; Ikesue, H.; Satake, R.; Inoue, M.; Yoshida, Y.; Tanaka, M.; Matsumoto, K.; Wakabayashi, W.; Oura, K.; Muroi, N.; et al. Osteonecrosis of the Jaw Caused by Denosumab in Treatment-Naïve and Pre-Treatment with Zoledronic Acid Groups: A Time-to-Onset Study Using the Japanese Adverse Drug Event Report (JADER) Database. Drugs Real World Outcomes 2022, 9, 659–665. [Google Scholar] [CrossRef]
  39. Brunello, A.; Saia, G.; Bedogni, A.; Scaglione, D.; Basso, U. Worsening of osteonecrosis of the jaw during treatment with sunitinib in a patient with metastatic renal cell carcinoma. Bone 2009, 44, 173–175. [Google Scholar] [CrossRef]
  40. Pimolbutr, K.; Porter, S.; Fedele, S. Osteonecrosis of the Jaw Associated with Antiangiogenics in Antiresorptive-Naïve Patient: A Comprehensive Review of the Literature. Biomed. Res. Int. 2018, 2018, 8071579. [Google Scholar] [CrossRef]
  41. Eguia, A.; Bagán-Debón, L.; Cardona, F. Review and update on drugs related to the development of osteonecrosis of the jaw. Med. Oral Patol. Oral Cir. Bucal. 2020, 25, e71–e83. [Google Scholar] [CrossRef]
  42. Di Fede, O.; Bedogni, A.; Giancola, F.; Saia, G.; Bettini, G.; Toia, F.; D’Alessandro, N.; Firenze, A.; Matranga, D.; Fedele, S.; et al. BRONJ in patients with rheumatoid arthritis: A multicenter case series. Oral Dis. 2016, 22, 543–548. [Google Scholar] [CrossRef] [PubMed]
  43. Tsao, C.; Darby, I.; Ebeling, P.R.; Walsh, K.; O’Brien-Simpson, N.; Reynolds, E.; Borromeo, G. Oral health risk factors for bisphosphonate-associated jaw osteonecrosis. J. Oral Maxillofac. Surg. 2013, 71, 1360–1366. [Google Scholar] [CrossRef] [PubMed]
  44. Khosla, S.K.; Oursler, M.J.; Monroe, D.G. Estrogen and the skeleton. Trends Endocrinol. Metab. 2012, 23, 576–581. [Google Scholar] [CrossRef] [PubMed]
  45. Toriumi, S.; Kobayashi, A.; Uesawa, Y. Comprehensive Study of the Risk Factors for Medication-Related Osteonecrosis of the Jaw Based on the Japanese Adverse Drug Event Report Database. Pharmaceuticals 2020, 13, 467. [Google Scholar] [CrossRef]
  46. Puljula, E.; Turhanen, P.; Vepsäläinen, J.; Monteil, M.; Lecouvey, M.; Weisell, J. Structural requirements for bisphosphonate binding on hydroxyapatite: NMR study of bisphosphonate partial esters. ACS Med. Chem. Lett. 2015, 6, 397–401. [Google Scholar] [CrossRef]
  47. Russell, R.G.; Xia, Z.; Dunford, J.E.; Oppermann, U.; Kwaasi, A.; Hulley, P.A.; Kavanagh, K.L.; Triffitt, J.T.; Lundy, M.W.; Phipps, R.J.; et al. Bisphosphonates: An update on mechanisms of action and how these relate to clinical efficacy. Ann. N. Y. Acad. Sci. 2007, 1117, 209–257. [Google Scholar] [CrossRef]
  48. Hughes, D.E.; MacDonald, B.R.; Russell, R.G.; Gowen, M. Inhibition of osteoclast-like cell formation by bisphosphonates in long-term cultures of human bone marrow. J. Clin. Investig. 1989, 83, 1930–1935. [Google Scholar] [CrossRef]
  49. Chavassieux, P.M.; Arlot, M.E.; Reda, C.; Wei, L.; Yates, A.J.; Meunier, P.J. Histomorphometric assessment of the long-term effects of alendronate on bone quality and remodeling in patients with osteoporosis. J. Clin. Investig. 1997, 100, 1475–1480. [Google Scholar] [CrossRef]
  50. Wood, J.; Bonjean, K.; Ruetz, S.; Bellahcène, A.; Devy, L.; Foidart, J.M.; Castronovo, V.; Green, J.R. Novel antiangiogenic effects of the bisphosphonate compound zoledronic acid. J. Pharmacol. Exp. Ther. 2002, 302, 1055–1061. [Google Scholar] [CrossRef]
  51. Tseng, H.C.; Kanayama, K.; Kaur, K.; Park, S.H.; Park, S.; Kozlowska, A.; Sun, S.; McKenna, C.E.; Nishimura, I.; Jewett, A. Bisphosphonate-induced differential modulation of immune cell function in gingiva and bone marrow in vivo: Role in osteoclast-mediated NK cell activation. Oncotarget 2015, 24, 20002–20025. [Google Scholar] [CrossRef]
  52. Lombard, T.; Neirinckx, V.; Rogister, B.; Gilon, Y.; Wislet, S. Medication-Related Osteonecrosis of the Jaw: New Insights into Molecular Mechanisms and Cellular Therapeutic Approaches. Stem Cells Int. 2016, 8768162. [Google Scholar] [CrossRef] [PubMed]
  53. Roskoski, R., Jr. Properties of FDA-approved small molecule protein kinase inhibitors: A 2024 update. Pharmacol. Res. 2024, 200, 107059. [Google Scholar] [CrossRef]
  54. Aldridge, S.E.; Lennard, T.W.; Williams, J.R.; Birch, M.A. Vascular endothelial growth factor receptors in osteoclast differentiation and function. Biochem. Biophys. Res. Commun. 2005, 335, 793–798. [Google Scholar] [CrossRef]
  55. Pazianas, M. Osteonecrosis of the jaw and the role of macrophages. J. Natl. Cancer Inst. 2011, 103, 232–240. [Google Scholar] [CrossRef] [PubMed]
  56. Madaj, R.; Pawlowska, R.; Chworos, A. In silico exploration of binding of selected bisphosphonate derivatives to placental alkaline phosphatase via docking and molecular dynamics. J. Mol. Graph. Model. 2021, 103, 107801. [Google Scholar] [CrossRef]
  57. Zhuravleva, I.Y.; Dokuchaeva, A.A.; Karpova, E.V.; Timchenko, T.P.; Titov, A.T.; Shatskaya, S.S.; Polienko, Y.F. Immobilized Bisphosphonates as Potential Inhibitors of Bioprosthetic Calcification: Effects on Various Xenogeneic Cardiovascular Tissues. Biomedicines 2021, 10, 65. [Google Scholar] [CrossRef]
  58. Weiss-Smith, S.; Deshpande, G.; Chung, S.; Gogolak, V. The FDA drug safety surveillance program: Adverse event reporting trends. Arch. Intern. Med. 2011, 171, 591–593. [Google Scholar] [CrossRef]
  59. Neha, R.; Beulah, E.; Anusha, B.; Vasista, S.; Stephy, C.; Subeesh, V. Aromatase inhibitors associated osteonecrosis of jaw: Signal refining to identify pseudo safety signals. Int. J. Clin. Pharm. 2020, 42, 721–727. [Google Scholar] [CrossRef]
  60. Gudivada, V.N.; Apon, A.; Ding, J. Data Quality Considerations for Big Data and Machine Learning: Going Beyond Data Cleaning and Transformations. Int. J. Adv. Softw. 2017, 10, 1–20. [Google Scholar]
  61. Joonho, G.; Hyunjoong, K. RHSBoost: Improving classification performance in imbalance data. Comput. Stat. Data Anal. 2017, 111, 1–13. [Google Scholar] [CrossRef]
  62. Ezzat, A.; Wu, M.; Li, X.L.; Kwoh, C.K. Drug-target interaction prediction via class imbalance-aware ensemble learning. BMC Bioinform. 2016, 17, 509. [Google Scholar] [CrossRef] [PubMed]
  63. ATC/DDD Index. Available online: https://atcddd.fhi.no/atc_ddd_index/ (accessed on 3 July 2022).
  64. Lumini, A.; Nanni, L. Convolutional Neural Networks for ATC Classification. Curr. Pharm. Des. 2018, 34, 4007–4012. [Google Scholar] [CrossRef] [PubMed]
  65. ICH Harmonisation for Berrer Health. Available online: https://www.ich.org/ (accessed on 1 July 2022).
  66. MedDRA; Medical Dictionary for Regulatory Activities. Available online: https://www.meddra.org/how-to-use/support-documentation/japanese/welcome (accessed on 3 July 2022).
  67. Kan, Y.; Nagai, J.; Uesawa, Y. Evaluation of antibiotic-induced taste and smell disorders using the FDA Adverse Event Reporting System database. Sci. Rep. 2021, 11, 9625. [Google Scholar] [CrossRef] [PubMed]
  68. Okunaka, M.; Kano, D.; Uesawa, Y. Nuclear receptor and stress response pathways associated with antineoplastic agent-induced diarrhea. Int. J. Mol. Sci. 2022, 23, 12407. [Google Scholar] [CrossRef]
  69. Oshima, Y.; Tanimoto, T.; Yuji, K.; Tojo, A. Association between GvHD and nivolumab in the FDA Adverse Event Reporting System. Bone Marrow Transplant. 2017, 52, 1463–1464. [Google Scholar] [CrossRef]
  70. Rothman, K.J.; Lanes, S.; Sacks, S.T. The reporting odds ratio and its advantages over the proportional reporting ratio. Pharmacoepidemiol. Drug Saf. 2004, 13, 519–523. [Google Scholar] [CrossRef]
  71. Harpaz, R.; DuMouchel, W.; LePendu, P.; Bauer-Mehren, A.; Ryan, P.; Shah, N.H. Performance of pharmacovigilance signal-detection algorithms for the FDA Adverse Event Reporting System. Clin. Pharmacol. Ther. 2013, 93, 539–546. [Google Scholar] [CrossRef]
  72. European Medicines Agency. “Guideline on the Use of Statistical Signal Detection Methods in the Eudravigilance Data Analysis System”. Available online: https://www.ema.europa.eu/en/documents/regulatory-procedural-guideline/draft-guideline-use-statistical-signal-detection-methods-eudravigilance-data-analysis-system_en.pdf (accessed on 5 July 2022).
  73. Kurosaki, K.; Uesawa, Y. Molecular Initiating Events Associated with Drug-Induced Liver Malignant Tumors: An Integrated Study of the FDA Adverse Event Reporting System and Toxicity Predictions. Biomolecules 2021, 11, 944. [Google Scholar] [CrossRef]
  74. Chen, J.J.; Wang, S.J.; Tsai, C.A.; Lin, C.J. Selection of differentially expressed genes in microarray data analysis. Pharmacogenomics J. 2007, 7, 212–220. [Google Scholar] [CrossRef]
  75. Cui, X.; Churchill, G.A. Statistical tests for differential expression in cDNA microarray experiments. Genome Biol. 2003, 4, 210. [Google Scholar] [CrossRef]
  76. PubChem. Available online: https://pubchem.ncbi.nlm.nih.gov/ (accessed on 1 July 2022).
  77. MOE. Available online: https://www.chemcomp.com/Products.htm (accessed on 18 July 2022).
  78. Breiman, L. Random Forests. Mach. Learn. 2001, 45, 5–32. [Google Scholar] [CrossRef]
  79. Friedman, J.H. Greedy function approximation: A gradient boosting machine. Ann. Statist. 2001, 29, 1189–1232. [Google Scholar] [CrossRef]
  80. Hornik, K.; Stinchcombe, M.; White, H. Multilayer feedforward networks are universal approximators. Neural Netw. 1989, 2, 359–366. [Google Scholar] [CrossRef]
  81. Mamada, H.; Iwamoto, K.; Nomura, Y.; Uesawa, Y. Predicting blood-to-plasma concentration ratios of drugs from chemical structures and volumes of distribution in humans. Mol. Divers. 2021, 3, 1261–1270. [Google Scholar] [CrossRef]
  82. Nishikiori, K.; Tanaka, K.; Uesawa, Y. Construction of a prediction model for drug removal rate in hemodialysis based on chemical structures. Mol. Divers. 2022, 5, 2647–2657. [Google Scholar] [CrossRef]
  83. Sahigara, F.; Mansouri, K.; Ballabio, D.; Mauri, A.; Consonni, V.; Todeschini, R. Comparison of different approaches to define the applicability domain of QSAR models. Molecules 2012, 17, 4791–4810. [Google Scholar] [CrossRef]
  84. Akobeng, A.K. Understanding diagnostic tests 3: Receiver operating characteristic curves. Acta Paediatr. 2007, 96, 644–647. [Google Scholar] [CrossRef]
Figure 1. A volcano plot of drugs associated with medication-related osteonecrosis of the jaw (MRONJ). The x-axis represents the natural logarithm of the reporting odds ratios (ln (ROR)), while the y-axis represents the common logarithm of the inverse p-value (−log10 [p]) from Fisher’s exact test. The dotted line on the y-axis represents p = 0.05. The color of the plot represents the total number of adverse events reported for each drug. Drugs associated with MRONJ (MRONJ-positive drugs) are shown in the upper right part of the plot, while drugs not associated with MRONJ (MRONJ-negative drugs) are displayed in the upper left part.
Pharmaceuticals 18 00423 g001
Figure 2. Comparison of the descriptor ASA_P values between MRONJ-positive and -negative drugs.
Pharmaceuticals 18 00423 g002
Figure 3. Procedure for creating the U.S. Food and Drug Administration Adverse Drug Reaction Database System (FAERS) Analysis Data Table. Duplicate data were removed from the Drug, Therapy, Demographic, and Reaction tables. Only the “first suspected drug” and “second suspected drug” were extracted from the Drug table. Initially, the Drug and Therapy tables were merged using the Primary ID and Drug sequence. Subsequently, the Demographic and Reaction tables were joined using the Primary ID. To ensure data accuracy, reports that did not adhere to the order of treatment start date, adverse event onset date, and treatment end date were excluded. Out of the 12,468,455 reports in the FAERS analysis data table, 3427 were related to MRONJ.
Pharmaceuticals 18 00423 g003
Figure 4. Cross-tabulation and formula used to calculate the ROR for an adverse event. The table is organized with reports for the suspected drug, all other reports, reports with an adverse event, and reports without an adverse event (a–d represent the number of reports).
Pharmaceuticals 18 00423 g004
Figure 5. Procedure for building MRONJ-induced drug prediction models. Positive and negative drugs for MRONJ were estimated based on the drugs listed in the FAERS analysis data table. A total of 326 chemical structure descriptions, representing structural features, were added to the positive and negative drugs for MRONJ. In the Quantitative Structure–Activity Relationship (QSAR) analysis, models were constructed and compared using three machine learning algorithms and varying numbers of descriptors. The selection of chemical structure for the artificial neural network was guided by their contribution to the random forest model. The model with the highest performance was checked for accuracy, the significance of the descriptors used, accuracy rates across pharmacological groups of the incorporated drugs, and the applicability domain.
Pharmaceuticals 18 00423 g005
Table 1. Twenty most frequently reported medication-related osteonecrosis of the jaw (MRONJ)-positive drugs.
Drug NameDrug GroupNumber of MRONJ
Reports
RORp-Valueφ Coefficient
DenosumabAnti-RANKL antibody907373.78<0.00010.136
Zoledronic acidBisphosphonates702140.70<0.00010.078
Alendronic acidBisphosphonate26436.69<0.00010.026
Ibandronic acidBisphosphonate9235.77<0.00010.015
SunitinibAnticancer drugs6510.30<0.00010.007
DexamethasoneCorticosteroids604.12<0.00010.003
CholecalciferolVitamin D5521.13<0.00010.009
BevacizumabAnticancer drugs517.96<0.00010.005
LenalidomideAnticancer drugs473.07<0.00010.002
EverolimusAnticancer drugs394.39<0.00010.003
LetrozoleAnticancer drugs3810.34<0.00010.005
PrednisoloneCorticosteroids364.81<0.00010.003
Risedronic acidBisphosphonates3316.50<0.00010.006
ExemestaneAnticancer drugs3213.92<0.00010.005
PalbociclibAnticancer drugs318.96<0.00010.004
PaclitaxelAnticancer drugs293.42<0.00010.002
Calcium carbonateCalcium2818.19<0.00010.006
DocetaxelAnticancer drugs252.64<0.00010.001
PrednisoneCorticosteroids253.97<0.00010.002
Pamidronic acidBisphosphonates2254.81<0.00010.009
ROR, reporting odds ratio; p-value; Fisher’s exact test.
Table 2. Examination of the machine learning algorithms.
Machine Learning AlgorithmsAUROC of the Training DataAUROC of the Validation DataCutoff ValueAccuracyPrecision/Positive Predictive ValueNegative Predictive ValueRecall/
Sensitivity
SpecificityBalanced AccuracyF1-ScoreMatthews Correlation Coefficient
Random Forest0.9960.7260.5330.7140.6000.7780.6000.7780.6890.6000.378
Gradient Boosting0.9560.7140.4840.7140.6360.7420.4670.8520.6590.5380.347
Artificial Neural Networks0.8490.7410.5260.7140.5790.8260.7330.7040.7190.6470.421
Table 3. Examination of the number of chemical structure descriptors in the artificial neural networks.
Number of Chemical Structure Descriptors *AUROC of the Training DataAUROC of the Validation DataCutoff ValueAccuracyPrecision/Positive Predictive ValueNegative Predictive ValueRecall/
Sensitivity
SpecificityBalanced AccuracyF1-ScoreMatthews Correlation Coefficient
5 Descriptors0.7130.6990.3630.6670.6000.6760.2000.9260.5630.3000.186
6 Descriptors0.8370.7240.4790.7140.6000.7780.6000.7780.6890.6000.378
7 Descriptors0.7030.7190.5540.7140.6150.7590.5330.8150.6740.5710.361
8 Descriptors0.8710.7780.2910.7380.6670.7670.5330.8520.6930.5930.409
9 Descriptors0.8710.7610.3830.7140.6000.7780.6000.7780.6890.6000.378
10 Descriptors0.8770.7480.2650.6670.5330.7410.5330.7410.6370.5330.274
20 Descriptors0.7860.7240.4630.7620.7780.7580.4670.9260.6960.5830.458
30 Descriptors0.7770.7160.2740.7380.6670.7670.5330.8520.6930.5930.409
* Chemical structure descriptors incorporated into the artificial neural network were used with the top contributions in the random forest.
Table 4. Eight chemical structure descriptors contributing to the MRONJ prediction model.
DescriptorDefinitionNumber of Branches *
ASA_PTotal polar surface area7
PEOE_VSA_FHYDFractional hydrophobic dw surface area3
PEOE_VSA-5Total negative 5 dw surface area3
h_pavgQTotal average charge (pH = 7)3
lip_accLipinski acceptor count3
vsa_accVDW acceptor surface area (A**2)2
vsa_polVDW polar surface area (A**2)2
CASA-Charge-weighted negative surface area2
* Number of branches in the random forest; VDW, van der Waals surface.
Table 5. Top 20 MRONJ-positive drugs by descriptor ASA_P values.
Drug NameATC CodeDrug GroupASA_P *
DetirelixL02BX02Anticancer drug (hormone-related drugs)533.2
TriptorelinL02AE04Anticancer drug (hormone-related drugs)509.8
LeuprorelinL02AE02Anticancer drug (hormone-related drugs)412.1
CefcapeneJ01DD17Antibiotics322.2
Pamidronic acidM05BA03Bisphosphonates305.2
Alendronic acidM05BA04Bisphosphonates302.7
PemetrexedL01BA04Anticancer drug (metabolic antagonists)294.9
DocetaxelL01CD02Anticancer drug (taxanes)284.6
MelphalanL01AA03Anticancer drug (alkylating agents)283.3
BicalutamideL02BB03Anticancer drug (hormone-related drugs)267.5
EpacadostatL01XX58Anticancer drug (others)267.1
PaclitaxelL01CD01Anticancer drug (taxanes)265.3
Zoledronic acidM05BA08Bisphosphonates263.6
TemsirolimusL01EG01Anticancer drug (protein kinase inhibitors)260.5
AllelismL01EM03Anticancer drug (protein kinase inhibitors)259.5
AnastrozoleL02BG03Anticancer drug (hormone-related drugs)256.4
FulvestrantL02BA03Anticancer drug (hormone-related drugs)254.4
Ibandronic acidM05BA06Bisphosphonates252.1
Risedronic acidM05BA07Bisphosphonates244.2
CapecitabineL01BC06Anticancer drug (metabolic antagonists)240.3
* Number of splits in the random forest.
Table 6. Accuracy rate by therapeutic class of drugs incorporated into the MRONJ prediction model.
Drug Classes in the ATC ClassificationFAERS Analysis
Data Table
Classification Results
for the MRONJ Prediction Model
Number of Drugs
(Positive/Negative)
PositiveNegativeAccuracy
L01E Protein kinase inhibitors14 (11/3)1310.75
L02B Hormone antagonists and related agents7 (7/0)610.75
L01X Other antineoplastic agents6 (6/0)510.71
M05B Drugs affect bone structure and mineralization6 (6/0)601.00
L04A Immunosuppressants9 (5/4)450.80
A11C Vitamin a and d, incl. combinations of the two4 (4/0)401.00
H02A Corticosteroids for systemic use, plain4 (4/0)401.00
L01C Plant alkaloids and other natural products4 (4/0)401.00
R01A Decongestants and other nasal preparations for topical use7 (3/4)520.56
D07A Corticosteroids, plain5 (3/2)500.43
A07E Intestinal antiinflammatory agents4 (3/1)400.60
C05A Agents for treatment of hemorrhoids and anal fissures for topical use4 (3/1)311.00
S01B Antiinflammatory agents4 (3/1)311.00
Table 7. Predictive performance of the MRONJ predictive models for compounds within the application domain.
Applicability DomainNumber of Drugs in Applicability DomainAccuracyPrecision/Positive Predictive ValueNegative Predictive ValueRecall/SensitivitySpecificityBalanced AccuracyF1-ScoreMatthews Correlation Coefficient
Exclusion: Cutoff value 0.5 ± 0
(No exclusion)
420.7380.6670.7670.5330.8520.6930.5930.409
Exclusion: Cutoff value 0.5 ± 0.1 (Applicability: 40–60% exclusion)320.6560.4761.0001.0000.5000.7500.6450.488
Exclusion: Cutoff value 0.5 ± 0.2 (Applicability: 30–70% exclusion)170.7650.6361.0001.0000.6000.8000.7780.618
Disclaimer/Publisher’s Note: The statements, opinions and data contained in all publications are solely those of the individual author(s) and contributor(s) and not of MDPI and/or the editor(s). MDPI and/or the editor(s) disclaim responsibility for any injury to people or property resulting from any ideas, methods, instructions or products referred to in the content.

