Article

Predictive Value of STC2 Gene Expression in Chemotherapy Response in Breast Cancer

by
Juan P. Muñoz
* and
Nicolás Lampe-Huenul
Laboratorio de Bioquímica, Departamento de Química, Facultad de Ciencias, Universidad de Tarapacá, Arica 1000007, Chile
*
Author to whom correspondence should be addressed.
Pharmaceuticals 2025, 18(2), 235; https://doi.org/10.3390/ph18020235
Submission received: 25 September 2024 / Revised: 19 October 2024 / Accepted: 6 November 2024 / Published: 8 February 2025
(This article belongs to the Section Biopharmaceuticals)

Abstract

:
Background: Breast cancer is the most commonly diagnosed cancer among women, and resistance to chemotherapy presents a significant challenge in its treatment. Stanniocalcin-2 (STC2), a glycoprotein involved in calcium homeostasis and cellular stress responses, is frequently overexpressed in various human cancers. Despite its critical role in cellular adaptation to stress, the potential of STC2 as a biomarker for predicting chemotherapy response has not been evaluated. This study aimed to assess the potential of STC2 as a predictive biomarker of response to chemotherapy in breast cancer. Methods: We utilized publicly available databases to characterize STC2 expression in breast cancer patients and its role in predicting relapse-free survival (RFS). Moreover, we evaluated the treatment responses of patients subjected to chemotherapy, correlating their outcomes with STC2 expression levels to determine its potential as a predictive biomarker. Finally, we evaluated the STC2 expression levels in breast cancer cell lines following exposure to doxorubicin (Dox), the primary anthracycline used in chemotherapy, and they were contrasted with the publicly available dataset. Results: The analysis showed that STC2 is significantly overexpressed in luminal A breast cancer, where it is linked to genetic amplifications. High STC2 expression was associated with improved RFS in ER-positive patients but correlated with worse outcomes in ER-negative cases. Furthermore, in grade II ER-positive patients, higher STC2 expression is linked to better chemotherapy response, while in grade II ER-negative patients, it was associated with poorer response. Finally, STC2 downregulation was observed in response to Dox treatment. Conclusions: These findings suggest that STC2 expression serves as a predictive biomarker for chemotherapy response in grade II breast cancer patients.

1. Introduction

Stanniocalcin-2 (STC2) is a member of a conserved family of secreted glycoprotein hormones originally identified in fish, where it plays a role in regulating calcium levels [1]. In humans, the STC2 gene is located on chromosome 5q35.1, and it is widely expressed in various tissues, including the breast, muscle, heart, and pancreas [2]. STC2 has been shown to participate in numerous physiological processes, such as calcium and phosphate homeostasis, cellular stress response, cellular metabolism, inflammation, and antioxidative function [3,4,5,6,7,8].
Recent studies have highlighted STC2 as a gene of interest in cancer biology due to its upregulation in a wide range of human cancers, including breast cancer, esophageal squamous-cell carcinoma, hepatocellular carcinoma, colorectal cancer, gastric cancer, renal cell carcinoma, and prostate cancer [9,10,11,12,13]. Interestingly, the expression of STC2 is closely associated with tumor progression and metastasis [14]. In breast cancer specifically, STC2 is frequently co-expressed with the estrogen receptor (ER) [15], a key driver of tumor growth expressed in about 80% of breast cancer cases [16]. In fact, STC2 expression is positively regulated by estrogen signaling, and higher levels of STC2 have been linked to better disease-free survival rates in ER-positive breast cancer patients. However, this correlation does not hold true for hormone receptor-negative patients [17]. Moreover, recent studies have shown that STC2 suppresses the migration and invasion of triple-negative breast cancer by inhibiting epithelial-mesenchymal transition (EMT) and promoting cell apoptosis [18].
One of the primary challenges in breast cancer treatment is overcoming resistance to chemotherapeutic compounds, particularly anthracyclines and taxanes [19]. Doxorubicin (Dox) is an anthracycline-class anticancer agent widely utilized in the treatment of various human malignancies, including leukemias, neuroblastoma, bone sarcomas, ovarian cancer, thyroid cancer, gastric cancer, lymphoma, lung cancer, and breast cancer [20]. Dox works by intercalating into DNA and inhibiting topoisomerase II, leading to DNA damage and cell death [21]. However, many patients develop resistance, which limits the effectiveness of the drug and leads to cancer recurrence [22,23].
Under stress conditions, including endoplasmic reticulum stress, hypoxia, and nutrient deprivation, STC2 expression is significantly upregulated, promoting the maintenance of redox homeostasis, resistance to apoptosis, and cell survival [7,24,25]. These stress-related functions of STC2 are especially pertinent within the tumor microenvironment, where cancer cells frequently encounter adverse conditions that foster the selection of more aggressive and therapy-resistant cell populations [26]. Despite its critical role in cellular adaptation to stress, the potential of STC2 as a biomarker for predicting chemotherapy response has not yet been evaluated.
Given the critical role of STC2 in the stress response, the aim of this work is to evaluate the potential of STC2 as a predictive biomarker of response to chemotherapeutic agents in breast cancer. To this end, we evaluated STC2 expression patterns from public databases and their impact on treatment outcomes. The results shown here provide evidence that STC2 gene expression could serve as a predictive biomarker for chemotherapy response in breast cancer patients.

2. Results

2.1. STC2 Is Overexpressed in Luminal A Breast Cancer

To assess the expression of the STC2 gene across multiple cancer types, we first analyzed STC2 mRNA expression levels in tumor and normal tissues using the TNM platform, which integrates data from Gene Expression Omnibus (GEO), Genotype-Tissue Expression (GTex), The Cancer Genome Atlas (TCGA), and Therapeutically Applicable Research to Generate Effective Treatments (TARGET) databases. As shown in Figure S1, STC2 is overexpressed across a range of cancers, including bladder, colon, esophagus, liver, lung, ovary, pancreas, prostate, rectum, renal cell carcinoma, skin, testis, thyroid, and uterus. Notably, STC2 mRNA in breast cancer is significantly elevated compared to their corresponding normal tissues (p = 1.44 × 10⁻², Figure 1A). The analysis revealed that all tumors have STC2 expression above the minimum cutoff. The percentage of tumors exceeding higher cutoffs decreases progressively, with 74.3% above Q1, 65.7% above the median, 34.3% above Q3, and only 1.4% above the maximum cutoff (Figure S2). This pattern suggests a widespread but variable overexpression of STC2 in breast cancer cases. Interestingly, STC2 overexpression in breast cancer is strongly associated with genetic alterations, such as amplifications and gains, which could explain its overexpression (Figure S3).
To further explore the expression patterns of STC2 across different molecular subtypes of breast cancer, we analyzed its expression using the Gene Expression Profiling Interactive Analysis 2.0 (GEPIA2.0) platform. Our analysis revealed that STC2 is predominantly overexpressed in the luminal A subtype, while other subtypes exhibit significantly lower or non-significant expression levels (Figure 1B).
To confirm this finding, we performed correlation analyses between STC2 and key luminal A markers, including ESR1, PGR, and GATA3, using the TIMER2.0 platform. As shown in Figure 1C, we observed strong positive correlations, with Spearman’s coefficients of 0.56, 0.596, and 0.554 for ESR1, PGR, and GATA3, respectively, all with highly significant p-values (p < 0.001).

2.2. STC2 Is Associated with ER Regulation

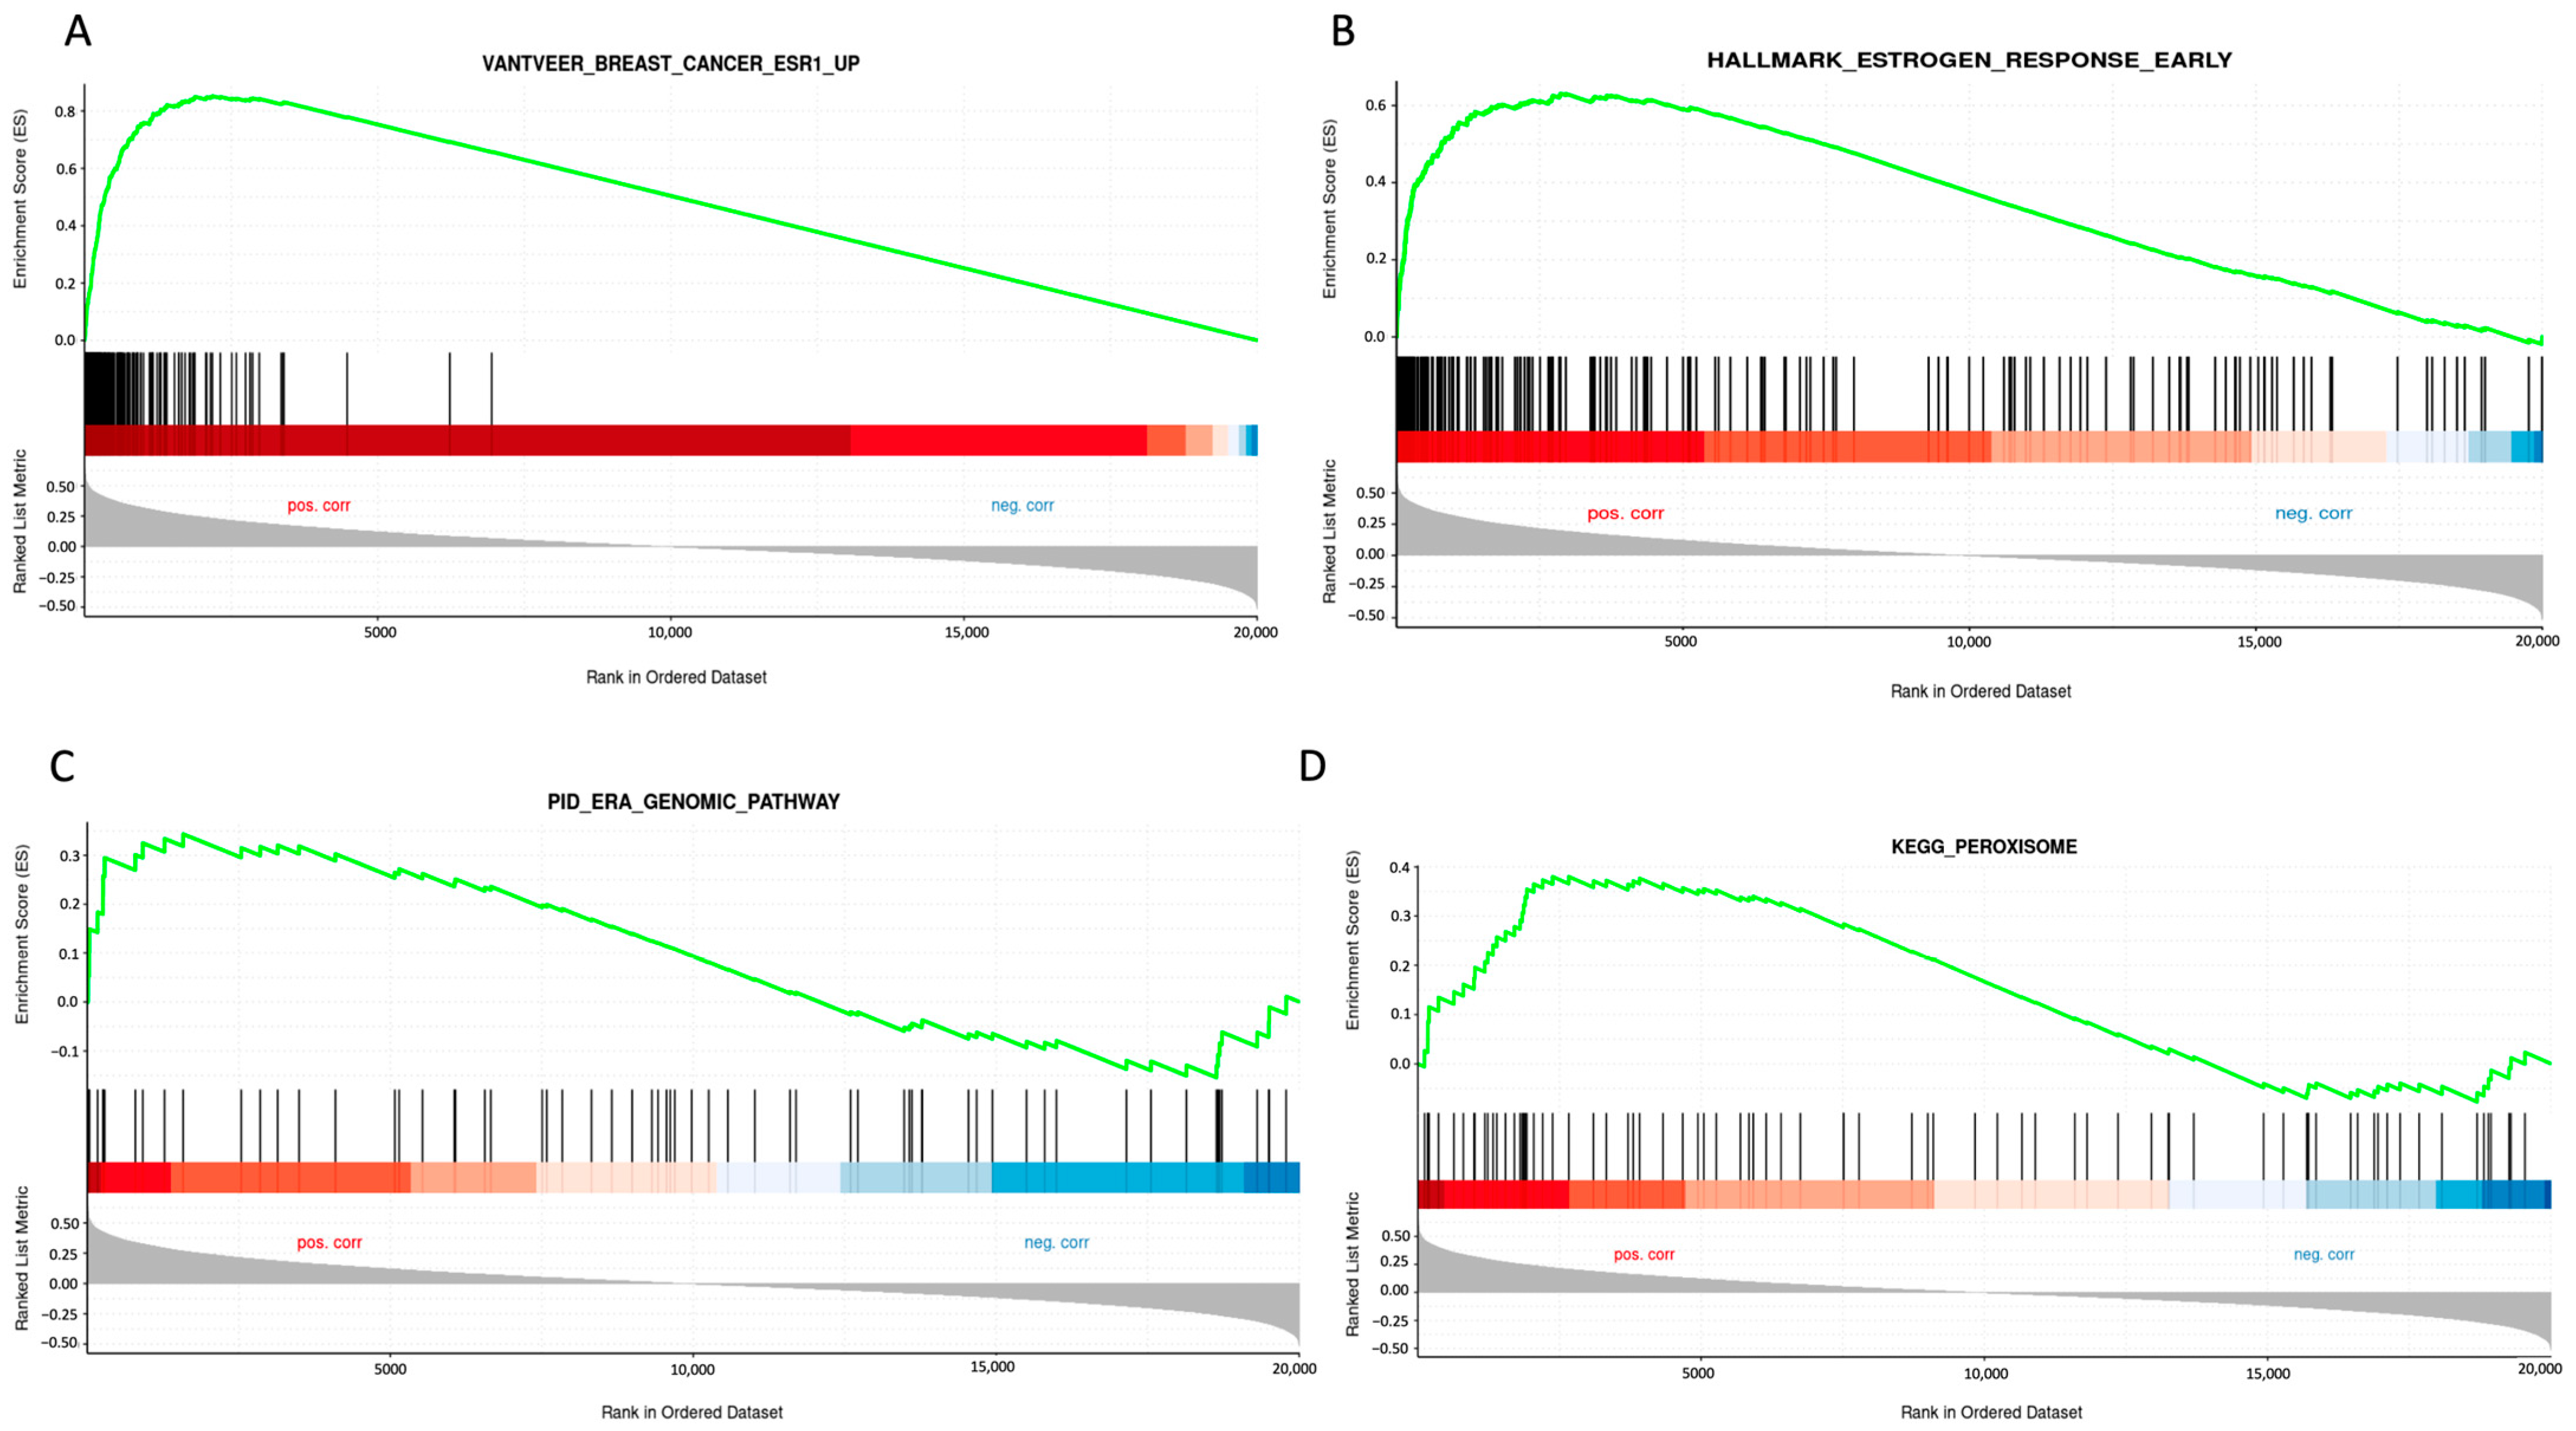
To further elucidate the role of STC2 in luminal A breast cancer, we performed gene set enrichment analysis (GSEA) on breast cancer samples from the TCGA database, focusing on cases with high STC2 expression. This analysis showed a significant enrichment of gene sets related to ER regulation and associated pathways, indicating a strong link between STC2 and ER-driven breast cancer. Notably, the analysis highlights enrichment in gene sets such as “Vantveer_Breast_cancer_ESR1_Up” and “Hallmarck_Estrogen_Response_Early”, suggesting that STC2 expression is positively correlated with genes upregulated in ER-positive breast cancer and early estrogen response (Figure 2). Additionally, the “KEGG_Persoxisome” pathway was also enriched, indicating a potential role of STC2 in peroxisome-related processes linked to cellular metabolism and oxidative stress. Collectively, these findings support the hypothesis that STC2 plays a critical role in ER-positive breast cancer by modulating estrogen signaling and peroxisome-related processes.

2.3. Prognostic Impact of STC2 in Breast Cancer Is Dependent on ER Status

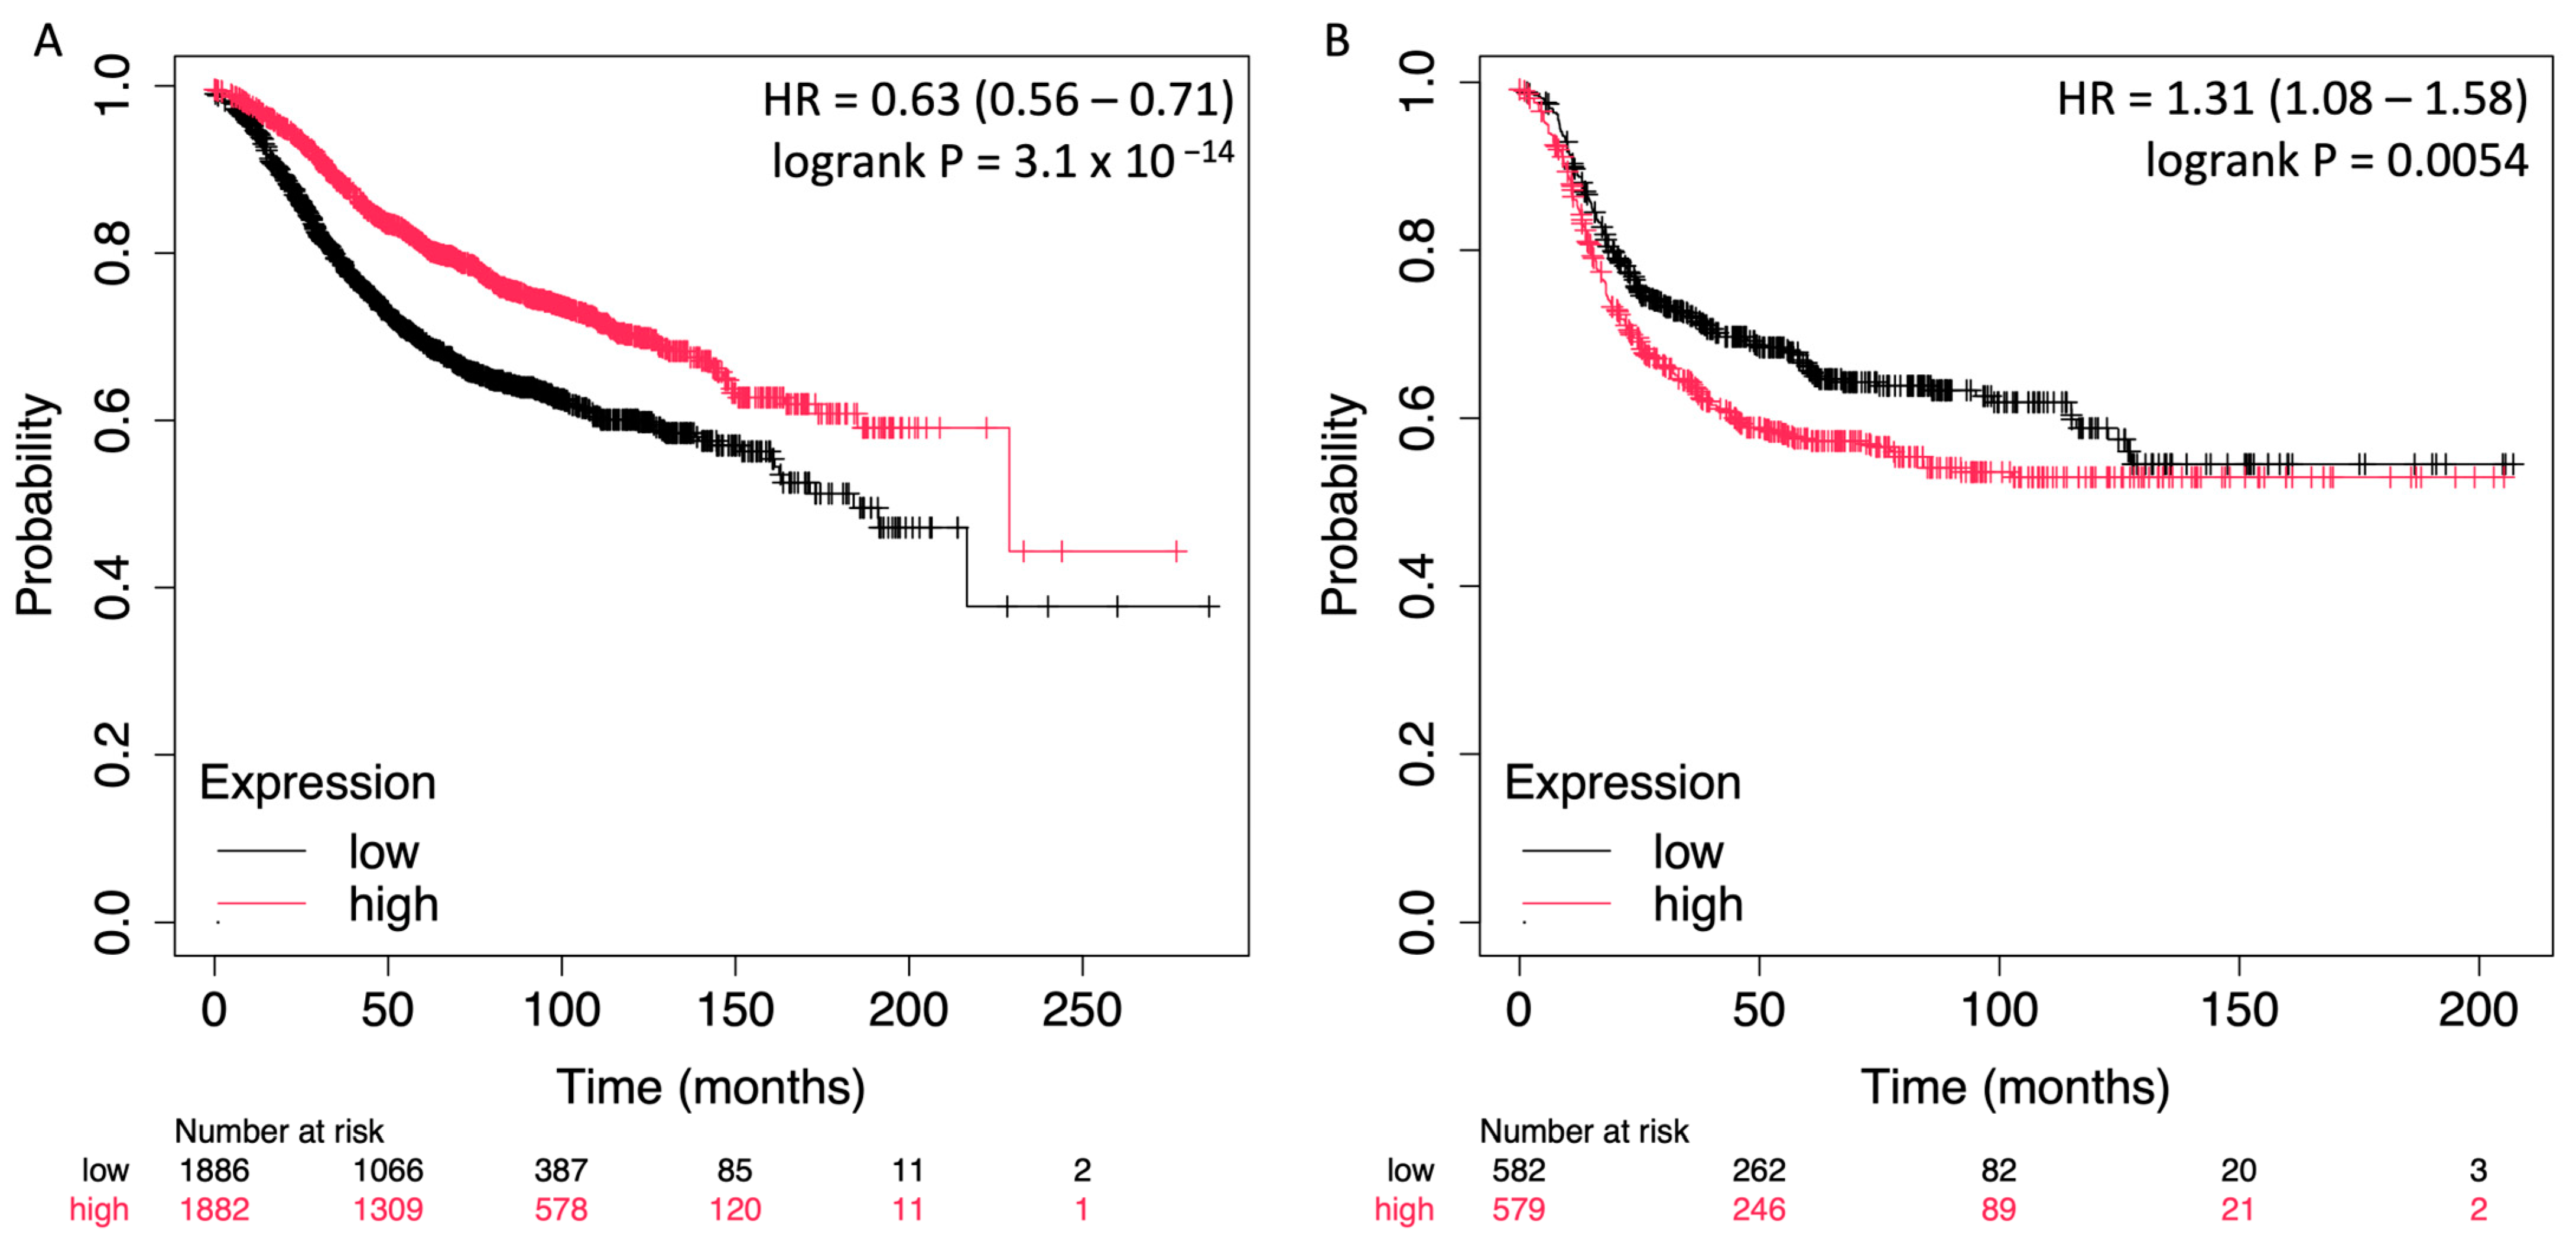
To assess the prognostic value of STC2 in relation to ER expression in breast cancer, survival analyses were conducted using the Kaplan–Meier plotter platform [27]. The analyses were stratified by ER status, allowing for a comparison between ER-positive and ER-negative breast cancer patients, each of whom was followed for relapse-free survival (RFS). For the ER-positive cohort, the results indicated a significant association between high STC2 expression and improved survival outcomes. The hazard ratio (HR) for high vs. low expression was 0.63 (95% CI: 0.56–0.71), with a highly significant log-rank p-value of 3.1 × 10⁻¹⁴. The Kaplan–Meier survival curve shows a clear separation between the high and low STC2 expression groups, with patients in the high-expression group demonstrating substantially better RFS across the follow-up period. (Figure 3A). Conversely, in the ER-negative cohort, high STC2 expression was associated with worse survival outcomes. The hazard ratio for high vs. low expression was 1.31 (95% CI: 1.08–1.58), and the log-rank p-value was 0.0054, indicating a significant correlation. The survival curve demonstrates that patients with higher STC2 expression had a lower probability of RFS compared to those with lower expression, suggesting that STC2 has an adverse prognostic role in ER-negative breast cancer.

2.4. Differential STC2 Expression as a Predictor of Chemotherapy Response in ER-Positive and ER-Negative Breast Cancer Patients

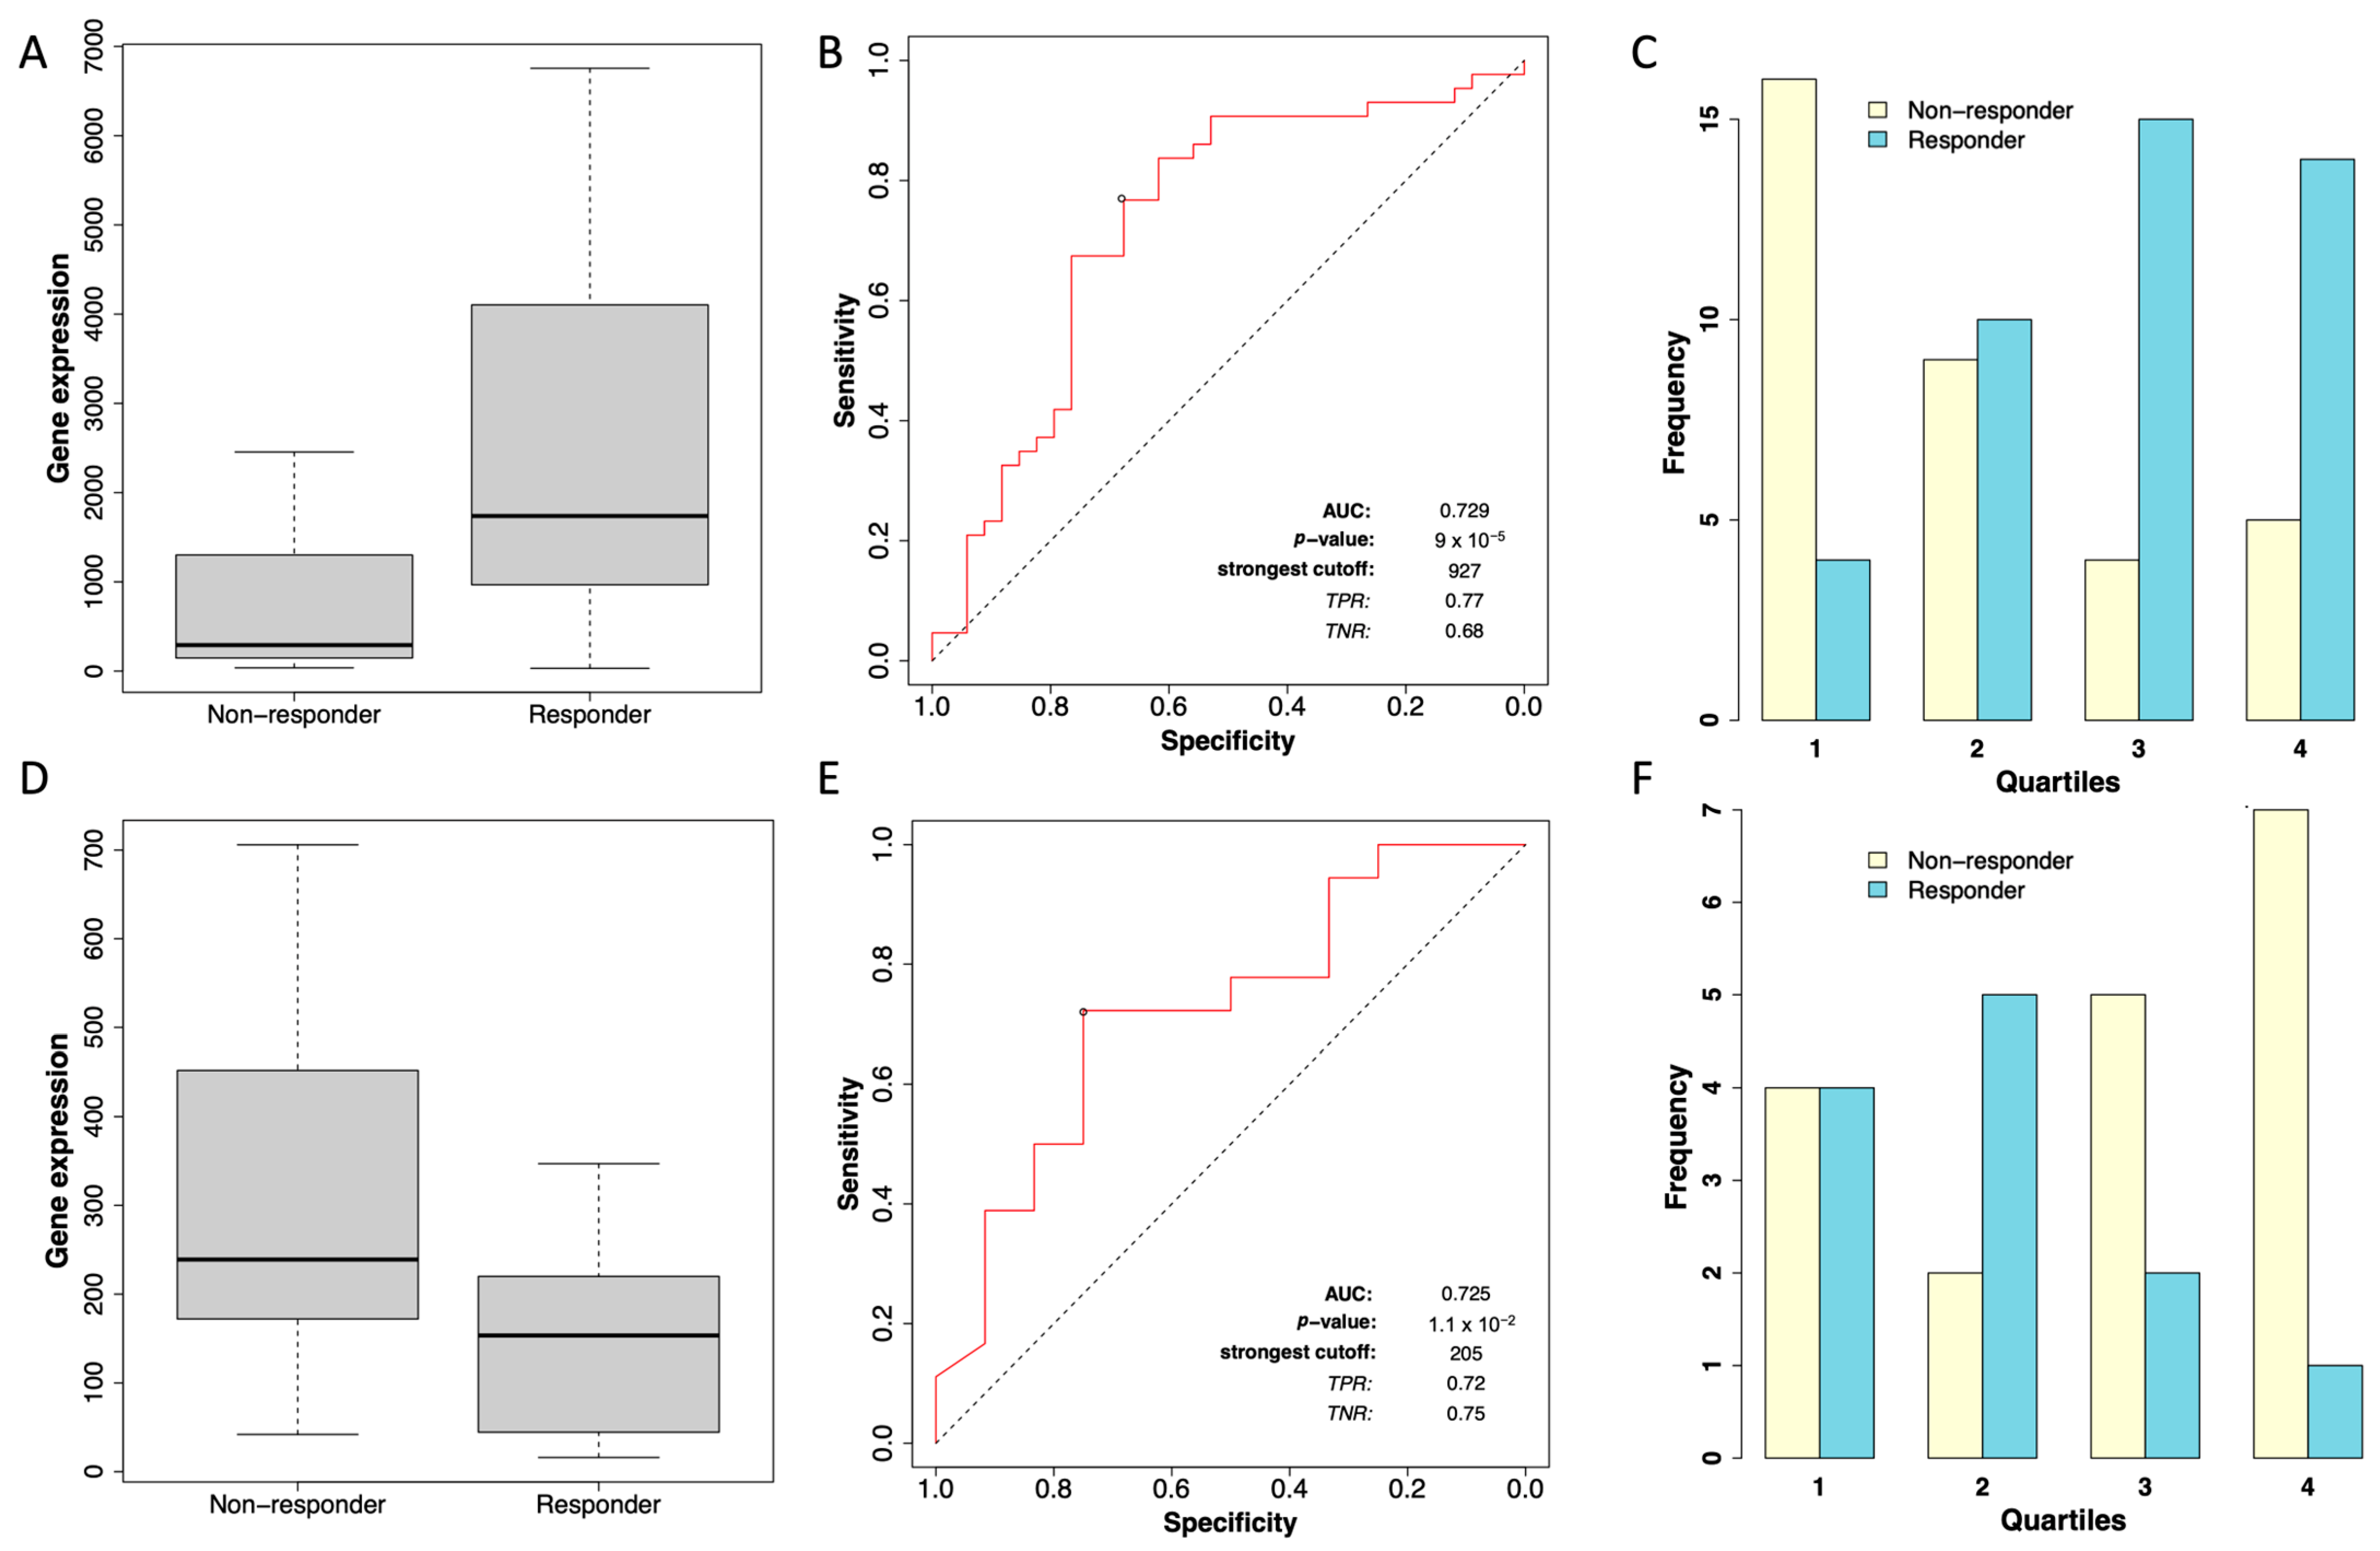
To evaluate the relationship between STC2 expression and its association with RFS in patients treated with chemotherapy, we used the ROC Plotter server, a database designed to identify predictive biomarkers based on gene expression using transcriptomic data from a large cohort of breast cancer patients [28]. In this analysis, we observed that within the cohort of grade II ER-positive breast cancer patients (consisting of 43 responders and 34 non-responders), STC2 expression showed a significantly higher expression in responders, with a fold change of 1.9 between both groups (Figure 4A). The Mann–Whitney test confirmed that this difference in expression levels was statistically significant (p = 4.7 × 10⁻³). The receiver operator characteristic (ROC) curve analysis yielded an area under the curve (AUC) of 0.729 (p = 9 × 10⁻⁵), indicating an acceptable predictive value of STC2 for chemotherapy response in this subgroup (Figure 4B). The distribution of STC2 expression across quartiles (Figure 4C) further highlights a higher frequency of responders in the higher STC2 expression quartiles, supporting the observed trend.
In the grade II ER-negative cohort, the analysis included 12 responders and 18 non-responders. In contrast to the ER-positive group, responders in the ER-negative cohort exhibited reduced expression of STC2, with a median expression of 154 in responders compared to 239 in non-responders (fold change of −1.9 between both groups, Figure 4D), suggesting an inverse relationship between STC2 levels and chemotherapy response in grade II ER-negative patients. The Mann–Whitney test showed that this reduction was statistically significant (p-value = 0.042). The ROC curve analysis for the ER-negative cohort yielded an AUC of 0.725, suggesting an acceptable discriminatory power (Figure 4E). Additionally, the distribution of STC2 expression across quartiles in grade II ER-negative breast cancer patients shows a contrasting pattern to that of the ER-positive cohort (Figure 4F). Although the predictive value of STC2 remains moderate, the pattern of reduced expression in responders suggests a different biological role of STC2 in ER-negative patients compared to ER-positive cases. In grade I or III breast cancer patients, no statistically significant differences were observed between responders and non-responders in either the ER-positive or ER-negative groups.

2.5. Dox Suppress STC2 Expression in Breast Cancer Cells

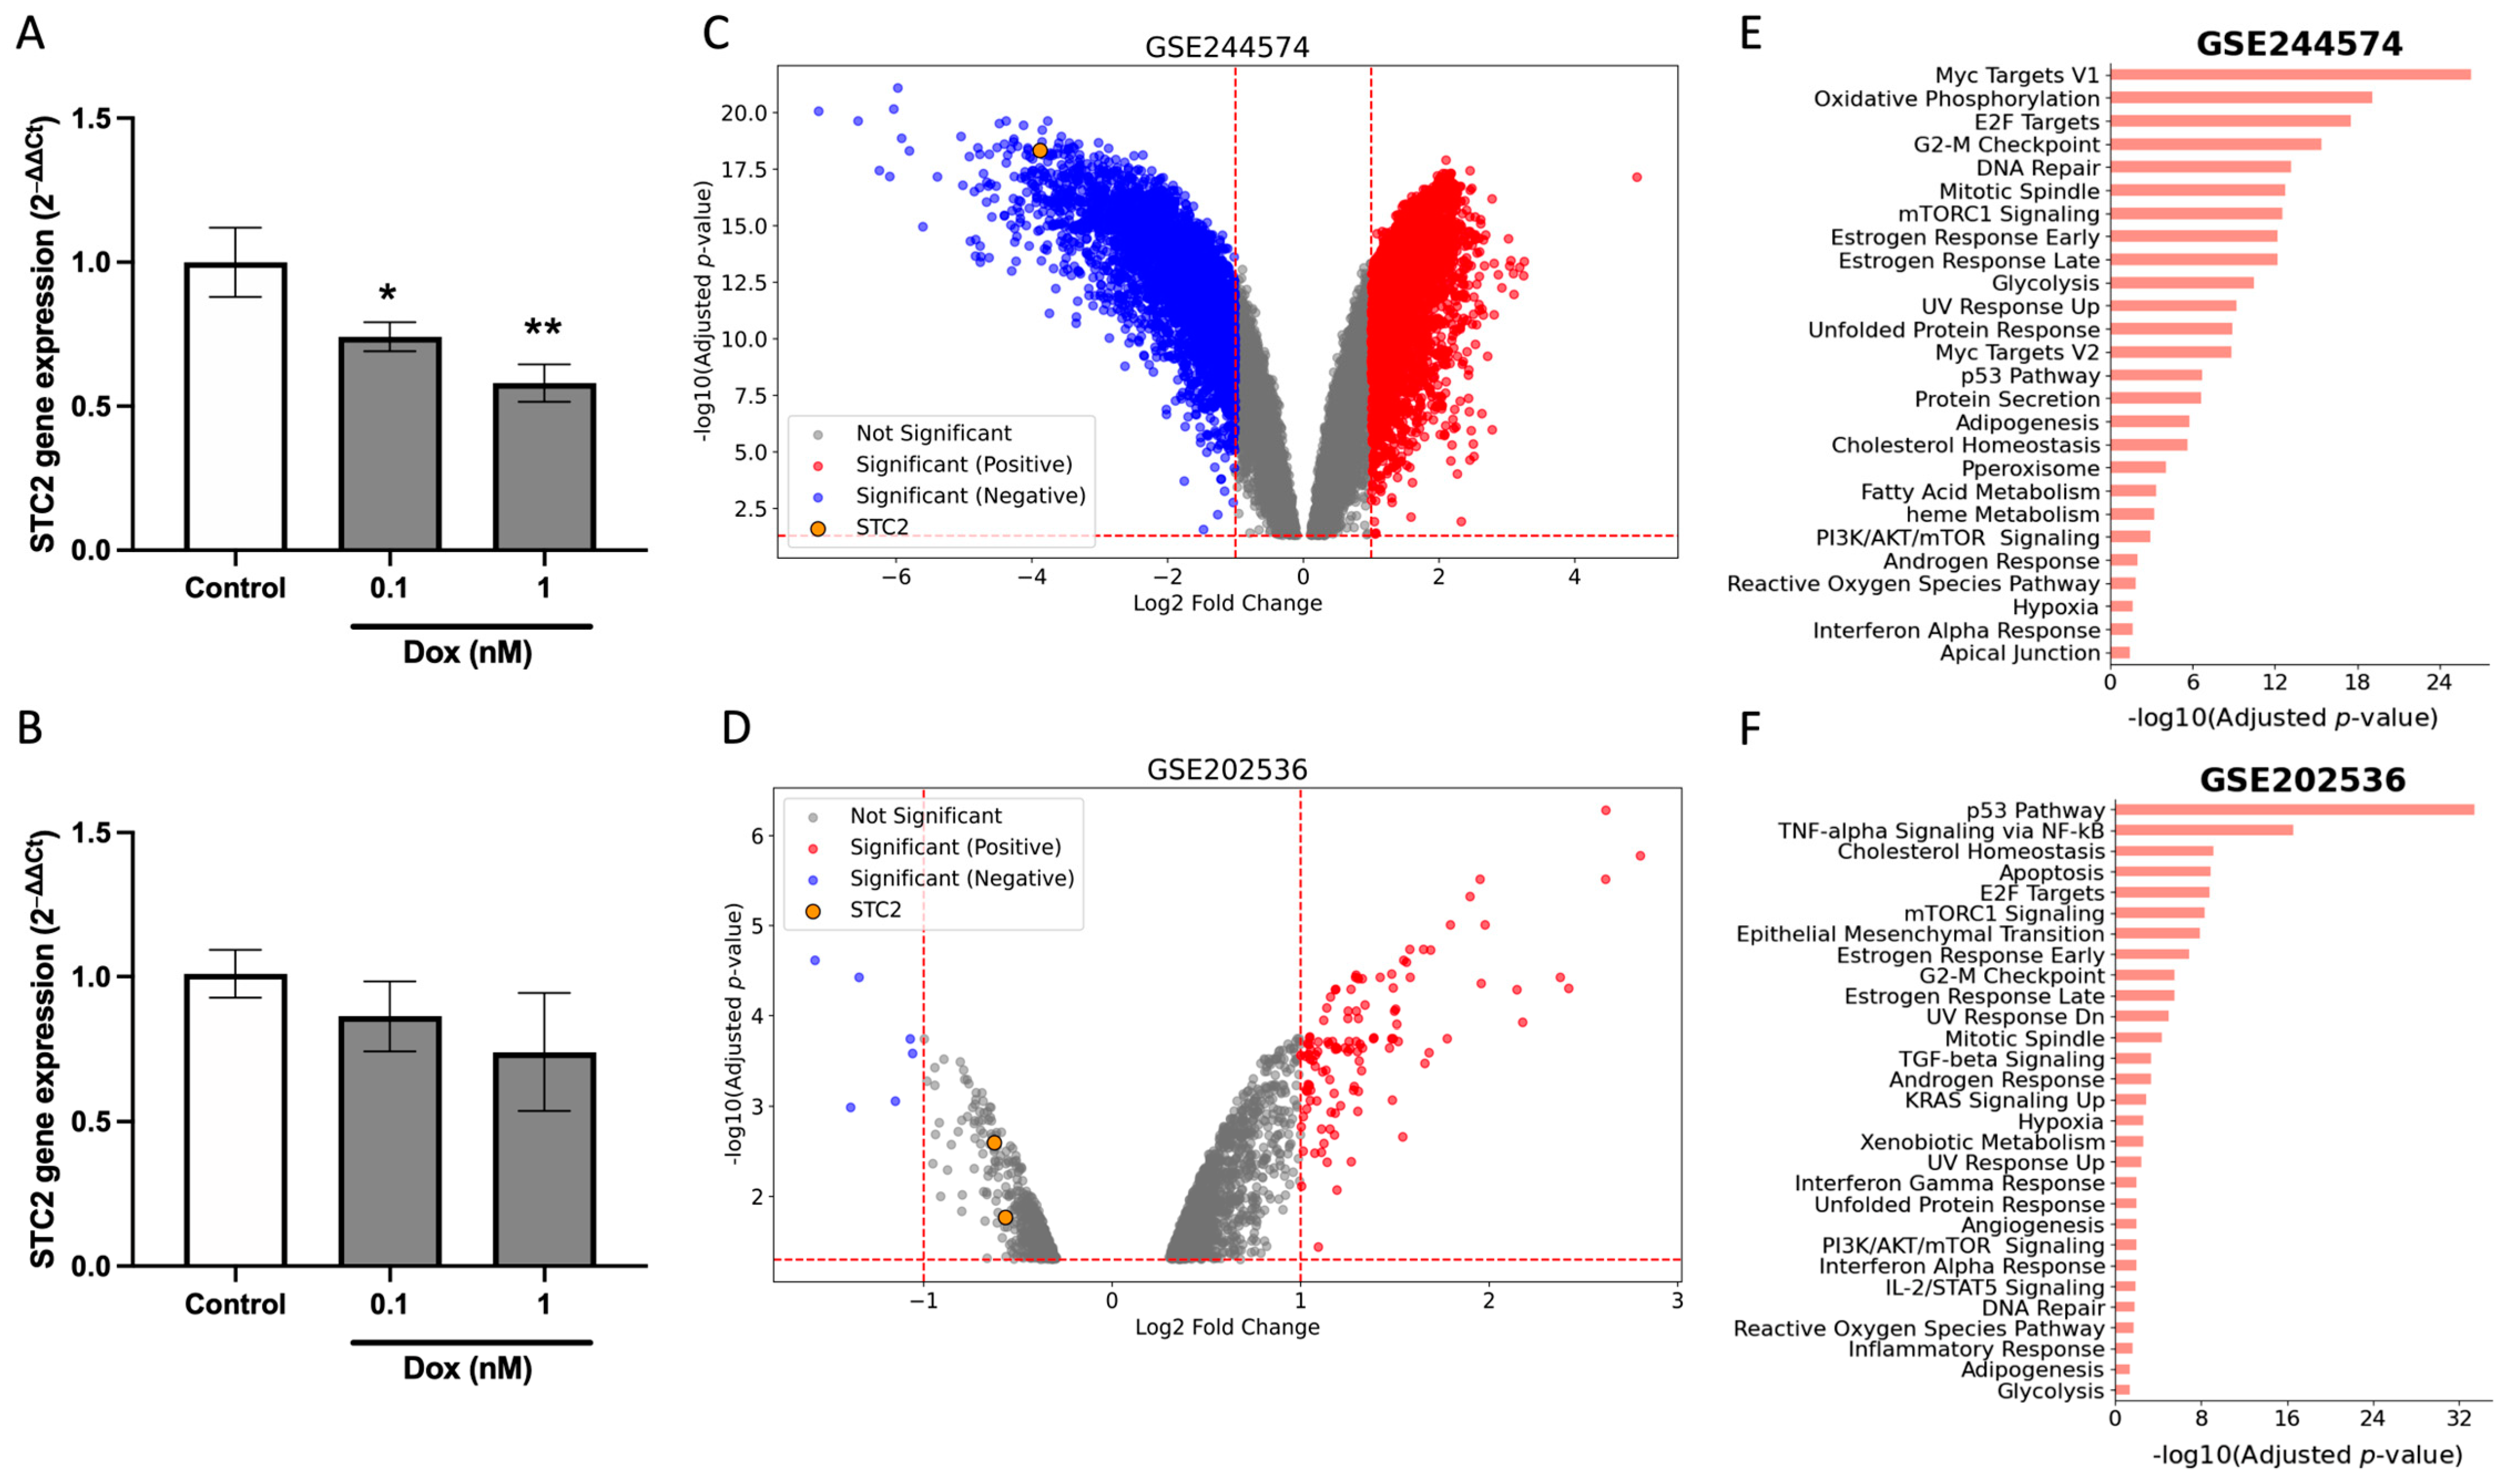
In order to evaluate the underlying mechanisms driving the differential chemotherapy response observed between ER-positive and ER-negative cohorts, we examined the effects of Dox on STC2 expression in breast cancer cell lines. We conducted RT-qPCR experiments on the ER-positive MCF7 and ER-negative MDA-MB-231 cell lines following 24-h Dox treatment. The results revealed a significant downregulation of STC2 mRNA expression in MCF7 cells (Figure 5A), while no significant changes were observed in MDA-MB-231 cells (Figure 5B).
To validate these findings, we analyzed two publicly available transcriptome datasets, GSE244574 [29] and GSE202536 [30], which examined the response to Dox treatment in MCF7 and Cal51 breast cancer cell lines, respectively. Differential expression analysis revealed significant alterations in gene expression following Dox exposure. In the GSE244574 dataset (MCF7 cells), 4302 genes were upregulated, while 4183 genes were downregulated after Dox treatment (Figure 5C). Similarly, in the GSE202536 dataset (Cal51 cells), comparing untreated cells with those exposed to Dox for 24 h, 1067 genes were upregulated, and 268 genes were downregulated (Figure 5D). Functional enrichment analysis of the differentially expressed genes (DEGs) indicated that in MCF7 cells, the DEGs were predominantly associated with Myc and E2F targets, oxidative phosphorylation, G2-M targets, and DNA repair (Figure 5E). In contrast, the DEGs in Cal51 cells were primarily linked to the p53 pathway, TNF-alpha signaling, cholesterol homeostasis, and apoptosis (Figure 5F). Regarding STC2 expression, both datasets demonstrated a statistically significant reduction in STC2 levels following 24 h of Dox exposure (Figure S4). However, the extent of downregulation varied between the two datasets. In the MCF7 cells (GSE244574 dataset, Figure 5C), the downregulation of STC2 was particularly robust, with a log2 fold change of −3.9 (p adj. = 7.37 × 10⁻¹⁸, p-value = 1.38 × 10⁻²⁰). In contrast, while the GSE202536 dataset also showed statistically significant downregulation (p adj. = 2.54 × 10⁻³, p-value = 2.02 × 10⁻⁵), the change in STC2 expression was moderate, with a log2 fold change of −0.62, representing a less pronounced decrease.
Finally, we analyzed STC2 gene expression using the GSE240671 dataset [31], which contains RNA sequencing data from breast cancer patients before and after neoadjuvant chemotherapy. From the available data, we selected samples from three patients who underwent chemotherapy and had residual tumors following treatment. Our analysis showed a consistent downregulation of STC2 gene expression in all three patients after neoadjuvant chemotherapy (Figure S5). The statistical analysis from the three samples confirmed these findings, revealing a log2 fold change of −1.39 with a p-value of 5.29 × 10⁻³.
Therefore, these results suggest that chemotherapy compounds lead to downregulation of STC2 gene expression in both cellular models and clinical samples.

3. Discussion

In breast cancer treatment, chemotherapy remains a cornerstone of breast cancer treatment due to its effectiveness in targeting cancer cells. However, patient responses to chemotherapy are highly variable, influenced by factors such as genetic background, tumor subtype, and the presence of specific biomarkers that affect drug resistance and overall treatment outcomes [32].
This study highlights the complex regulatory mechanisms that cancer cells use to adapt to chemotherapy-induced stress, with a specific focus on STC2, a glycoprotein upregulated under various stress conditions, including hypoxia, endoplasmic reticulum stress, and nutrient deprivation, which are common in tumor microenvironment [33]. The results suggest that STC2 is significantly overexpressed in breast cancer, especially in the luminal A subtype. This overexpression is closely linked to genetic alterations, such as gene amplifications and copy number gains, and it is associated with hormone receptor signaling pathways that are characteristic of luminal A tumors. Amplification of regions encoding STC2 and its regulatory elements may drive its upregulation, suggesting a genetic basis for its elevated expression. Given its connection to hormone receptor signaling, STC2 appears to play a pivotal role within ER pathways, which are central to the development and progression of luminal A tumors.
Since STC2 is associated with ER signaling pathway as well as previous studies identifying STC2 as a potential predictive marker for survival [34], we further analyzed its impact on RFS in breast cancer patients stratified by ER status. Using data from GEO and TCGA, we employed the Kaplan–Meier plotter, which revealed that STC2 prognostic significance in breast cancer is dependent on ER status: The results showed that high STC2 expression was associated with favorable outcomes in ER-positive cases but was linked to poorer prognosis in ER-negative cases. This differential prognostic impact of STC2 expression in breast cancers could be explained by its interaction with ER-mediated signaling pathways. In ER-positive tumors, high STC2 expression may enhance hormone receptor signaling, promoting cell differentiation and growth in a more regulated, less aggressive manner, therefore leading to improved treatment responses and favorable outcomes. Conversely, in ER-negative tumors, high STC2 expression may activate alternative stress-response pathways, such as those related to hypoxia, nutrient deprivation, or endoplasmic reticulum stress, which could contribute to a more aggressive tumor phenotype and poorer prognosis.
In addition to these results, we demonstrated that STC2 expression serves as a potential predictive marker for chemotherapy response in both ER-positive and ER-negative grade II breast cancer patients, but with different outcomes: In grade II ER-positive patients, higher STC2 expression correlates with better chemotherapy response. In grade II ER-negative patients, higher STC2 expression is associated with an unfavorable response to chemotherapy. The context-dependent role of STC2 in breast cancer could explain its differential predictive value for chemotherapy response. In ER-positive tumors, high STC2 expression likely interacts with ER-mediated pathways, reinforcing a more regulated and organized response to chemotherapeutic stress. This interaction may facilitate tumor cell susceptibility to chemotherapy by promoting apoptotic pathways or enhancing DNA damage response mechanisms specific to ER-positive cells, therefore leading to a better treatment outcome. In ER-negative tumors, however, STC2 likely shifts to activating alternative stress-response mechanisms, such as those related to cellular adaptation to hypoxia, nutrient deprivation, or endoplasmic reticulum stress. These mechanisms could enable cancer cells to survive under the harsh conditions imposed by chemotherapy, contributing to chemoresistance. In this context, STC2 overexpression may support cell survival by upregulating pathways that protect the tumor from the cytotoxic effects of treatment, leading to a poor chemotherapy response.
While anticancer therapies often induce a wide array of stress-related proteins, including heat shock proteins, RNA chaperones, and endoplasmic reticulum-associated stress proteins [35], our findings revealed downregulation of STC2 in response to Dox treatment. This is contrary to the typical stress response, where stress-responsive genes are often upregulated, suggesting that STC2 may be regulated by multiple cellular pathways activated by oxidative stress. It is well-documented that oxidative stress can repress gene expression even at non-cytotoxic levels, which may explain the observed downregulation of STC2 [36,37,38]. In fact, in other models have been demonstrated that oxidative stress induces a downregulation of STC2 [39].
On the other hand, Dox treatment is known to interfere with the activity of key transcription factors involved in various cellular processes [40,41]. This interference can occur through alterations in intracellular signaling pathways or direct post-translational modifications of transcription factors, reducing their capacity to promote gene expression. Furthermore, oxidative stress induced by Dox can impair ER function, altering the expression of ER-regulated genes [42]. Given that our data and previous reports suggest STC2 is an estrogen-regulated protein [43], it is plausible that Dox disrupts the ER signaling pathways that typically drive STC2 overexpression in cancer cells, leading to the downregulation of estrogen-responsive genes, including STC2.
The significant suppression of STC2 expression following Dox treatment suggests that the drug may counteract the protective effects of STC2, therefore sensitizing cancer cells to apoptosis. This downregulation of STC2 supports the hypothesis that STC2 may contribute to chemoresistance in cancer therapy [44]. However, it is important to recognize that the datasets used in these analyses are not directly comparable due to several factors. For instance, the datasets were generated using distinct microarray platforms (Agilent and Affymetrix arrays), which can introduce variability in gene detection sensitivity, specificity, and expression quantification. Furthermore, differences in experimental conditions, sample handling, and platform-specific biases can lead to batch effects. Notably, the Dox concentrations varied between experiments, precluding a direct comparison of results. However, despite these limitations, the consistent observation of STC2 downregulation upon Dox treatment across independent studies underscores the robustness of these findings and suggests a critical role for STC2 in modulating the chemotherapeutic response. This warrants further investigation into STC2 as a potential therapeutic target for overcoming chemoresistance.
The identification of STC2 as a potential biomarker for predicting chemotherapy response has significant implications for breast cancer treatment. The ability to predict which patients are likely to respond to chemotherapy could guide personalized treatment strategies, potentially improving outcomes for those at risk of chemoresistance. Specifically, the stronger predictive value of STC2 in ER-positive patients suggests that targeting STC2 could be particularly beneficial in this subgroup.
Future studies should aim to validate these findings in larger and more diverse patient cohorts to confirm the utility of STC2 as a biomarker for chemotherapy response. Additionally, mechanistic studies are needed to elucidate the molecular pathways through which STC2 contributes to chemoresistance, particularly in the context of ER signaling and stress-response pathways. Understanding these mechanisms could provide insights into how STC2 inhibitors might be developed and integrated into breast cancer treatment regimens. Furthermore, investigating the role of STC2 in other subtypes of breast cancer, including triple-negative and HER2-positive cancers, could determine whether the findings are broadly applicable across breast cancer subtypes or specific to luminal A and ER-positive patients.

4. Materials and Methods

4.1. Cell Culture

Human breast cancer cell lines MCF7 (#C0006008) and MDA-MB-231 (#C0006002) were obtained from Addexbio (San Diego, CA, USA). MCF7 cells were cultured in Dulbecco’s Modified Eagle’s Medium (DMEM) (Gibco, Carlsbad, CA, USA) with the addition of 10 µg/mL insulin (Santa Cruz Biotechnology Inc., Santa Cruz, CA, USA) and 10% (v/v) fetal bovine serum (FBS) (Hyclone, Fremont, CA, USA). The MDA-MB-231 cells were grown in high-glucose DMEM (Gibco, Carlsbad, CA, USA) supplemented with 10% (v/v) FBS (Hyclone, Fremont, CA, USA). All cell lines were cultured at 37 °C in a humidified cell incubator with 5% CO2.

4.2. Real-Time Quantitative Reverse Transcription PCR (RT-qPCR)

Total RNA was extracted from the cultured cells using TRIzol Reagent (Invitrogen, Waltham, MA, USA), following the manufacturer’s instructions. Briefly, cells were lysed directly in TRIzol, and the homogenate was subjected to phase separation with chloroform (Merck, Darmstadt, Germany). The aqueous phase containing RNA was carefully transferred, and RNA was precipitated with isopropanol (Merck, Darmstadt, Germany). The RNA pellet was washed with 75% ethanol, briefly air-dried, and resuspended in RNase-free water. RNA concentrations were measured using the Qubit RNA BR assay kit and the Qubit 4 fluorometer (Thermo Fisher, Waltham, MA, USA). cDNA was synthesized from 1 µg of total RNA using the AffinityScript qPCR cDNA Synthesis Kit (Agilent Technologies, Inc., Santa Clara, CA, USA) according to the manufacturer’s protocol. The cDNA synthesis reaction was carried out in a 20 µL reaction volume, containing 10 µL of 2× master mix, 0.1 µg/µL of Oligo dT, and 1 µL of AffinityScript RT/RNase Block enzyme mix, and incubated at 37 °C for 30 min. For RT-qPCR, reactions were set up in a final volume of 25 µL, including 12.5 µL of Brilliant II SYBR Green q-RT-PCR 1-Step Master Mix (Agilent Technologies, Inc., Santa Clara, CA, USA), 0.5 µL of each primer (400 nM), 10.5 µL of nuclease-free water, and 1 µL of cDNA template. The primers used were: β-actin forward: TGCCGACAGGATGCAGAAG, β-actin reverse: GCCGATCCACACGGAGTACT; STC2 forward: TCTTGTGAGATTCGGGGCTT, STC2 reverse: ACAGGTCGTGCTTGAGGTAG. The STC2 sequences were obtained from Huang et al. (2021) [45]. RT-qPCR was conducted on a CFX-96 real-time system (Bio-Rad Laboratories, Inc., Hercules, CA, USA) under the following cycling conditions: 94 °C for 30 s, 60 °C for 20 s, and 72 °C for 20 s, repeated for 40 cycles. All RT-qPCR assays were performed in triplicate, and β-actin was used as a reference gene for normalization. The relative expression levels were calculated using the 2−ΔΔCt method.

4.3. Database Analysis

In this study, STC2 mRNA expression in several cancers and corresponding normal tissues was examined using GEPIA2.0 plattform (http://gepia.cancer-pku.cn/; accessed on 10 July 2024) [46] and TNM web server (https://tnmplot.com/analysis/; accessed on 14 July 2024) [47]. Correlation analyses were conducted using the TIMER2.0 web server. (http://timer.cistrome.org/; accessed on 25 July 2024) [48,49,50]. These platforms facilitate the gene expression quantification using tumor and normal samples from TCGA and the GTEx databases.

4.4. Datasets

The GEO database contains a vast repository of sequencing and microarray data contributed by research institutions worldwide. For this study, we searched datasets related to breast cancer and Dox exposure using the keywords “Breast cancer”, “Dox”, and “Chemotherapy”. This search resulted in the identification of the datasets GSE244574, GSE202536 and GSE240671. The GSE244574 dataset, published on 27 March 2024, by Naso et al. [29], provides transcriptomic data from Dox-treated MCF7 breast cancer cells and was generated using the Agilent-072363 SurePrint G3 Human GE v3 8x60K Microarray platform (039494). The GSE202536 dataset, published on 27 February 2023, by Kumar et al. [30], utilized the [HG-U133_Plus_2] Affymetrix Human Genome U133 Plus 2.0 Array (GPL570) in order to evaluate the differences between long-term resistance and short-term stress responses in triple-negative breast cancer cells. Specifically, in this database, we selected the data from Cal51 cells untreated and exposed to Dox for 24 h. Finally, we utilized the dataset GSE240671, published on 28 February 2024, by Derouane et al. [31]. This dataset, generated using the Illumina NovaSeq 6000 platform (GPL24676), includes RNA sequencing data from human mammary tumors collected from patients both before and after neoadjuvant chemotherapy. From the available data, we selected samples from three patients (R08, R13, and P56) who underwent neoadjuvant chemotherapy and had residual tumors after treatment. The inclusion criteria for this analysis were female patients aged 38 to 57 years at diagnosis, with breast cancer subtypes classified as either luminal B or triple-negative breast cancer (TNBC). All selected patients exhibited moderate or minimal residual disease post-treatment, and their molecular subtypes remained consistent both before and after chemotherapy.

4.5. Identification of DEGs

DEGs were identified using Python (v3.12.5) within a Jupyter Notebook environment. Key libraries employed in the analysis included GSEApy (v1.1.3) for gene set enrichment analysis. Standard libraries such as matplotlib (v3.9.2) were used for plotting, pandas (v2.2.2) for data manipulation, and numpy (v2.1.1) for numerical computations. DEGs were defined as genes with adjusted p-values less than 0.05 and |logFC| > 1. Volcano plots were generated using matplotlib to visualize the DEGs.

4.6. Functional Enrichment Analysis of DEGs

Functional annotation of DEGs was conducted using the GSEApy Python package, which supports GSEA and acts as a wrapper for Enrichr. This package enables easy enrichment analysis for Gene Ontology (GO) and KEGG pathways, producing high-quality figures. Lists of differentially expressed genes were provided for pathway enrichment, leveraging the statistical methods in GSEApy to identify significant biological processes and pathways. Additionally, GSEA analyses were performed using the GENI web server (https://www.shaullab.com/geni; accessed on 18 August 2024) from breast invasive carcinoma (TCGA, PanCancer Atlas) [51].

4.7. Survival Data Analysis

Survival data were analyzed using the Kaplan–Meier Plotter [27], focusing on RFS in breast cancer patients. Patients were divided into low and high STC2 expression groups based on a 50% cutoff for both expression levels. Two separate analyses were performed: one for ER-positive and another for ER-negative breast cancer patients. The ER-positive cohort included 1372 patients (Affy ID: 203438_at), while the ER-negative cohort comprised 243 patients. Quality control steps, such as excluding redundant samples and removing biased arrays, were implemented to ensure the integrity of the data. Survival differences between the low and high STC2 expression groups were assessed using the log-rank test, and hazard ratios (HR) with corresponding confidence intervals were calculated to quantify the risk. Additionally, ROC analyses were conducted using ROC Plotter [28] to evaluate the predictive value of STC2 expression in chemotherapy-treated subgroups. The analyses were performed separately for ER-positive and ER-negative breast cancer patients, with responses based on 5-year RFS and grade II tumors. The predictive performance of STC2 was determined by plotting ROC curves, and AUC values were calculated. The statistical significance of the differences between responders and non-responders was assessed using the Mann–Whitney U test.

4.8. Statistical Analysis

Statistical analyses were conducted using GraphPad Prism version 5.0 (GraphPad Software, Inc., La Jolla, CA, USA). The comparison of STC2 expression between tumor and normal tissues was performed using Student’s t-test. Correlations between STC2 expression and patient survival were analyzed using Spearman’s rank correlation test, a non-parametric approach suitable for assessing relationships between non-normally distributed variables. Kaplan–Meier survival curves were statistically analyzed using the log-rank test, which is appropriate for comparing survival outcomes between two groups. Statistical significance was set at p < 0.05, with thresholds for significance noted as * p < 0.05, ** p < 0.01, *** p < 0.001.

5. Conclusions

This study demonstrates that STC2 plays a significant role in the progression of ER-positive breast cancer and may serve as a reliable marker for predicting both survival outcomes and positive responses to chemotherapy, particularly in grade II ER-positive breast cancer patients.

Supplementary Materials

The following supporting information can be downloaded at: https://www.mdpi.com/article/10.3390/ph18020235/s1, Figure S1: STC2 expression across various cancer types compared to normal tissues; Figure S2: Bar graph showing the percentage of tumors with STC2 expression higher than different cut-offs in normal tissues, along with specificity data; Figure S3: STC2 mRNA expression and genetic alterations across various cancer types from the TCGA Pan-Cancer Atlas; Figure S4: STC2 expression levels in breast cancer cell lines treated with Dox compared to control groups across three datasets; Figure S5: STC2 gene expression levels before and after neoadjuvant chemotherapy in breast cancer patients.

Author Contributions

Conceptualization, J.P.M.; methodology, J.P.M.; software, J.P.M. and N.L.-H.; validation, J.P.M.; formal analysis, J.P.M. and N.L.-H.; investigation, J.P.M.; resources, J.P.M.; data curation, J.P.M. and N.L.-H.; writing—original draft preparation, J.P.M.; writing—review and editing, J.P.M.; visualization, N.L.-H.; supervision, J.P.M.; project administration, J.P.M.; funding acquisition, J.P.M. All authors have read and agreed to the published version of the manuscript.

Funding

This study was supported by FONDECYT grant 11231072 (to J.P.M.) and UTA MAYOR grant 4765-24 (to J.P.M).

Institutional Review Board Statement

Not applicable.

Informed Consent Statement

Not applicable.

Data Availability Statement

The data supporting the findings of this study are publicly available. The transcriptomic data analyzed in this study were obtained from the GEO under the following accession numbers: GSE244574 [29], GSE202536 [30] and GSE GSE240671 [31]. These datasets provide information on breast cancer cell lines treated with Dox and other chemotherapeutic agents. All datasets can be accessed through the GEO database (https://www.ncbi.nlm.nih.gov/geo/; accessed on 15 August 2024).

Acknowledgments

The authors would like to thank the National Agency for Research and Development (ANID) and Universidad de Tarapacá (UTA) for their support through research grants that facilitated this study.

Conflicts of Interest

The authors declare no conflicts of interest.

References

  1. Qie, S.; Sang, N. Stanniocalcin 2 (STC2): A universal tumour biomarker and a potential therapeutical target. J. Exp. Clin. Cancer Res. 2022, 41, 161. [Google Scholar] [CrossRef] [PubMed]
  2. Joshi, A.D. New Insights Into Physiological and Pathophysiological Functions of Stanniocalcin 2. Front. Endocrinol. 2020, 11, 172. [Google Scholar] [CrossRef] [PubMed]
  3. Zeiger, W.; Ito, D.; Swetlik, C.; Oh-hora, M.; Villereal, M.L.; Thinakaran, G. Stanniocalcin 2 is a negative modulator of store-operated calcium entry. Mol. Cell Biol. 2011, 31, 3710–3722. [Google Scholar] [CrossRef] [PubMed]
  4. Zhao, J.; Jiao, Y.; Song, Y.; Liu, J.; Li, X.; Zhang, H.; Yang, J.; Lu, Y. Stanniocalcin 2 Ameliorates Hepatosteatosis Through Activation of STAT3 Signaling. Front. Physiol. 2018, 9, 873. [Google Scholar] [CrossRef]
  5. Joshi, A.D.; Carter, D.E.; Harper, T.A., Jr.; Elferink, C.J. Aryl hydrocarbon receptor-dependent stanniocalcin 2 induction by cinnabarinic acid provides cytoprotection against endoplasmic reticulum and oxidative stress. J. Pharmacol. Exp. Ther. 2015, 353, 201–212. [Google Scholar] [CrossRef]
  6. McCudden, C.R.; James, K.A.; Hasilo, C.; Wagner, G.F. Characterization of mammalian stanniocalcin receptors. Mitochondrial targeting of ligand and receptor for regulation of cellular metabolism. J. Biol. Chem. 2002, 277, 45249–45258. [Google Scholar] [CrossRef]
  7. Ito, D.; Walker, J.R.; Thompson, C.S.; Moroz, I.; Lin, W.; Veselits, M.L.; Hakim, A.M.; Fienberg, A.A.; Thinakaran, G. Characterization of stanniocalcin 2, a novel target of the mammalian unfolded protein response with cytoprotective properties. Mol. Cell. Biol. 2004, 24, 9456–9469. [Google Scholar] [CrossRef]
  8. Law, A.Y.; Wong, C.K. Stanniocalcin-1 and -2 promote angiogenic sprouting in HUVECs via VEGF/VEGFR2 and angiopoietin signaling pathways. Mol. Cell. Endocrinol. 2013, 374, 73–81. [Google Scholar] [CrossRef]
  9. Hou, J.; Wang, Z.; Xu, H.; Yang, L.; Yu, X.; Yang, Z.; Deng, Y.; Meng, J.; Feng, Y.; Guo, X.; et al. Stanniocalicin 2 suppresses breast cancer cell migration and invasion via the PKC/claudin-1-mediated signaling. PLoS ONE 2015, 10, e0122179. [Google Scholar] [CrossRef]
  10. Kita, Y.; Mimori, K.; Iwatsuki, M.; Yokobori, T.; Ieta, K.; Tanaka, F.; Ishii, H.; Okumura, H.; Natsugoe, S.; Mori, M. STC2: A predictive marker for lymph node metastasis in esophageal squamous-cell carcinoma. Ann. Surg. Oncol. 2011, 18, 261–272. [Google Scholar] [CrossRef]
  11. Meyer, H.A.; Tölle, A.; Jung, M.; Fritzsche, F.R.; Haendler, B.; Kristiansen, I.; Gaspert, A.; Johannsen, M.; Jung, K.; Kristiansen, G. Identification of stanniocalcin 2 as prognostic marker in renal cell carcinoma. Eur. Urol. 2009, 55, 669–678. [Google Scholar] [CrossRef] [PubMed]
  12. Tamura, K.; Furihata, M.; Chung, S.Y.; Uemura, M.; Yoshioka, H.; Iiyama, T.; Ashida, S.; Nasu, Y.; Fujioka, T.; Shuin, T.; et al. Stanniocalcin 2 overexpression in castration-resistant prostate cancer and aggressive prostate cancer. Cancer Sci. 2009, 100, 914–919. [Google Scholar] [CrossRef] [PubMed]
  13. Volland, S.; Kugler, W.; Schweigerer, L.; Wilting, J.; Becker, J. Stanniocalcin 2 promotes invasion and is associated with metastatic stages in neuroblastoma. Int. J. Cancer 2009, 125, 2049–2057. [Google Scholar] [CrossRef] [PubMed]
  14. Zhang, C.; Chen, S.; Ma, X.; Yang, Q.; Su, F.; Shu, X.; Xie, W.; Feng, M.; Xiong, B. Upregulation of STC2 in colorectal cancer and its clinicopathological significance. OncoTargets Ther. 2019, 12, 1249–1258. [Google Scholar] [CrossRef] [PubMed]
  15. Bouras, T.; Southey, M.C.; Chang, A.C.; Reddel, R.R.; Willhite, D.; Glynne, R.; Henderson, M.A.; Armes, J.E.; Venter, D.J. Stanniocalcin 2 is an estrogen-responsive gene coexpressed with the estrogen receptor in human breast cancer. Cancer Res. 2002, 62, 1289–1295. [Google Scholar]
  16. Makhlouf, S.; Althobiti, M.; Toss, M.; Muftah, A.A.; Mongan, N.P.; Lee, A.H.S.; Green, A.R.; Rakha, E.A. The Clinical and Biological Significance of Estrogen Receptor-Low Positive Breast Cancer. Mod. Pathol. 2023, 36, 100284. [Google Scholar] [CrossRef]
  17. Yamamura, J.; Miyoshi, Y.; Tamaki, Y.; Taguchi, T.; Iwao, K.; Monden, M.; Kato, K.; Noguchi, S. mRNA expression level of estrogen-inducible gene, alpha 1-antichymotrypsin, is a predictor of early tumor recurrence in patients with invasive breast cancers. Cancer Sci. 2004, 95, 887–892. [Google Scholar] [CrossRef]
  18. Lei, R.; Yao, C.; Huang, R.; Wu, W.; Ou, L.; Yang, C. STC2 suppresses triple-negative breast cancer migration and invasion by inhibition on EMT and promotion on cell apoptosis. Discov. Oncol. 2024, 15, 339. [Google Scholar] [CrossRef]
  19. Luque-Bolivar, A.; Pérez-Mora, E.; Villegas, V.E.; Rondón-Lagos, M. Resistance and Overcoming Resistance in Breast Cancer. Breast Cancer Targets Ther. 2020, 12, 211–229. [Google Scholar] [CrossRef]
  20. Zhu, H.; Sarkar, S.; Scott, L.; Danelisen, I.; Trush, M.A.; Jia, Z.; Li, Y.R. Doxorubicin Redox Biology: Redox Cycling, Topoisomerase Inhibition, and Oxidative Stress. React. Oxyg. Species 2016, 1, 189–198. [Google Scholar] [CrossRef]
  21. Kciuk, M.; Gielecińska, A.; Mujwar, S.; Kołat, D.; Kałuzińska-Kołat, Ż.; Celik, I.; Kontek, R. Doxorubicin-An Agent with Multiple Mechanisms of Anticancer Activity. Cells 2023, 12, 659. [Google Scholar] [CrossRef] [PubMed]
  22. Paskeh, M.D.A.; Saebfar, H.; Mahabady, M.K.; Orouei, S.; Hushmandi, K.; Entezari, M.; Hashemi, M.; Aref, A.R.; Hamblin, M.R.; Ang, H.L.; et al. Overcoming doxorubicin resistance in cancer: siRNA-loaded nanoarchitectures for cancer gene therapy. Life Sci. 2022, 298, 120463. [Google Scholar] [CrossRef] [PubMed]
  23. Tufail, M.; Cui, J.; Wu, C. Breast cancer: Molecular mechanisms of underlying resistance and therapeutic approaches. Am. J. Cancer Res. 2022, 12, 2920–2949. [Google Scholar] [PubMed]
  24. Yu, Y.; Yu, J.; Pan, Z. Endoplasmic reticulum stress-related features predict the prognosis of osteosarcoma and reveal STC2 as a novel risk indicator for disease progression. Front. Oncol. 2024, 14, 1453173. [Google Scholar] [CrossRef] [PubMed]
  25. Qie, S.; Xiong, H.; Liu, Y.; Yan, C.; Wang, Y.; Tian, L.; Wang, C.; Sang, N. Stanniocalcin 2 governs cancer cell adaptation to nutrient insufficiency through alleviation of oxidative stress. Cell Death Dis. 2024, 15, 567. [Google Scholar] [CrossRef]
  26. Tiwari, A.; Trivedi, R.; Lin, S.-Y. Tumor microenvironment: Barrier or opportunity towards effective cancer therapy. J. Biomed. Sci. 2022, 29, 83. [Google Scholar] [CrossRef]
  27. Győrffy, B. Survival analysis across the entire transcriptome identifies biomarkers with the highest prognostic power in breast cancer. Comput. Struct. Biotechnol. J. 2021, 19, 4101–4109. [Google Scholar] [CrossRef]
  28. Fekete, J.T.; Győrffy, B. ROCplot.org: Validating predictive biomarkers of chemotherapy/hormonal therapy/anti-HER2 therapy using transcriptomic data of 3,104 breast cancer patients. Int. J. Cancer 2019, 145, 3140–3151. [Google Scholar] [CrossRef]
  29. Naso, F.D.; Bruqi, K.; Manzini, V.; Chiurchiù, V.; D’Onofrio, M.; Arisi, I.; Strappazzon, F. miR-218-5p and doxorubicin combination enhances anticancer activity in breast cancer cells through Parkin-dependent mitophagy inhibition. Cell Death Discov. 2024, 10, 149. [Google Scholar] [CrossRef]
  30. Kumar, U.; Castellanos-Uribe, M.; May, S.T.; Yagüe, E. Adaptive resistance is not responsible for long-term drug resistance in a cellular model of triple negative breast cancer. Gene 2023, 850, 146930. [Google Scholar] [CrossRef]
  31. Derouane, F.; Desgres, M.; Moroni, C.; Ambroise, J.; Berlière, M.; Van Bockstal, M.R.; Galant, C.; van Marcke, C.; Vara-Messler, M.; Hutten, S.J.; et al. Metabolic adaptation towards glycolysis supports resistance to neoadjuvant chemotherapy in early triple negative breast cancers. Breast Cancer Res. 2024, 26, 29. [Google Scholar] [CrossRef]
  32. van der Zanden, S.Y.; Qiao, X.; Neefjes, J. New insights into the activities and toxicities of the old anticancer drug doxorubicin. FEBS J. 2021, 288, 6095–6111. [Google Scholar] [CrossRef]
  33. He, H.; Qie, S.; Guo, Q.; Chen, S.; Zou, C.; Lu, T.; Su, Y.; Zong, J.; Xu, H.; He, D.; et al. Stanniocalcin 2 (STC2) expression promotes post-radiation survival, migration and invasion of nasopharyngeal carcinoma cells. Cancer Manag. Res. 2019, 11, 6411–6424. [Google Scholar] [CrossRef]
  34. Esseghir, S.; Kennedy, A.; Seedhar, P.; Nerurkar, A.; Poulsom, R.; Reis-Filho, J.S.; Isacke, C.M. Identification of NTN4, TRA1, and STC2 as prognostic markers in breast cancer in a screen for signal sequence encoding proteins. Clin. Cancer Res. 2007, 13, 3164–3173. [Google Scholar] [CrossRef]
  35. Yun, C.W.; Kim, H.J.; Lim, J.H.; Lee, S.H. Heat Shock Proteins: Agents of Cancer Development and Therapeutic Targets in Anti-Cancer Therapy. Cells 2020, 9, 60. [Google Scholar] [CrossRef]
  36. MOREL, Y.; BAROUKI, R. Repression of gene expression by oxidative stress. Biochem. J. 1999, 342, 481–496. [Google Scholar] [CrossRef]
  37. Bhargavan, B.; Chhunchha, B.; Kubo, E.; Singh, D.P. DNA methylation as an epigenetic mechanism in the regulation of LEDGF expression and biological response in aging and oxidative stress. Cell Death Discov. 2024, 10, 296. [Google Scholar] [CrossRef]
  38. Posadino, A.M.; Phu, H.T.; Cossu, A.; Giordo, R.; Fois, M.; Thuan, D.T.B.; Piga, A.; Sotgia, S.; Zinellu, A.; Carru, C.; et al. Oxidative stress-induced Akt downregulation mediates green tea toxicity towards prostate cancer cells. Toxicol. In Vitro 2017, 42, 255–262. [Google Scholar] [CrossRef]
  39. Kim, P.H.; Na, S.S.; Lee, B.; Kim, J.H.; Cho, J.Y. Stanniocalcin 2 enhances mesenchymal stem cell survival by suppressing oxidative stress. BMB Rep. 2015, 48, 702–707. [Google Scholar] [CrossRef]
  40. Bartlett, J.J.; Trivedi, P.C.; Yeung, P.; Kienesberger, P.C.; Pulinilkunnil, T. Doxorubicin impairs cardiomyocyte viability by suppressing transcription factor EB expression and disrupting autophagy. Biochem. J. 2016, 473, 3769–3789. [Google Scholar] [CrossRef]
  41. AbuHammad, S.; Zihlif, M. Gene expression alterations in doxorubicin resistant MCF7 breast cancer cell line. Genomics 2013, 101, 213–220. [Google Scholar] [CrossRef]
  42. Liang, X.; Lu, B.; Scott, G.K.; Chang, C.H.; Baldwin, M.A.; Benz, C.C. Oxidant stress impaired DNA-binding of estrogen receptor from human breast cancer. Mol. Cell. Endocrinol. 1998, 146, 151–161. [Google Scholar] [CrossRef]
  43. Jiang, S.-t.; Wang, H.-q.; Yang, T.-c.; Wang, D.-w.; Yang, L.-j.; Xi, Y.-q.; Kong, F.-z.; Pan, X.-k.; Xu, L.-h.; Feng, M.-h.; et al. Expression of Stanniocalcin 2 in Breast Cancer and Its Clinical Significance. Curr. Med. Sci. 2019, 39, 978–983. [Google Scholar] [CrossRef]
  44. Niu, X.; Zhan, Y.; Zhang, S.; Liu, Z.; Qu, C. Research progress of STC2 in breast cancer. Biophys. Rep. 2021, 7, 185–192. [Google Scholar]
  45. Huang, F.; Li, H.; Qin, Z.; Wang, A.; Zhang, Y.; Guo, J.; Wei, M.; Guo, H.; Pu, J. SNHG17 Serves as an Oncogenic lncRNA by Regulating the miR-361-3p/STC2 Axis in Rectal Cancer. Front. Genet. 2021, 12, 654686. [Google Scholar] [CrossRef]
  46. Tang, Z.; Kang, B.; Li, C.; Chen, T.; Zhang, Z. GEPIA2: An enhanced web server for large-scale expression profiling and interactive analysis. Nucleic Acids Res. 2019, 47, W556–W560. [Google Scholar] [CrossRef]
  47. Bartha, Á.; Győrffy, B. TNMplot.com: A Web Tool for the Comparison of Gene Expression in Normal, Tumor and Metastatic Tissues. Int. J. Mol. Sci. 2021, 22, 2622. [Google Scholar] [CrossRef]
  48. Li, T.; Fu, J.; Zeng, Z.; Cohen, D.; Li, J.; Chen, Q.; Li, B.; Liu, X.S. TIMER2.0 for analysis of tumor-infiltrating immune cells. Nucleic Acids Res. 2020, 48, W509–W514. [Google Scholar] [CrossRef]
  49. Li, T.; Fan, J.; Wang, B.; Traugh, N.; Chen, Q.; Liu, J.S.; Li, B.; Liu, X.S. TIMER: A Web Server for Comprehensive Analysis of Tumor-Infiltrating Immune Cells. Cancer Res. 2017, 77, e108–e110. [Google Scholar] [CrossRef]
  50. Li, B.; Severson, E.; Pignon, J.C.; Zhao, H.; Li, T.; Novak, J.; Jiang, P.; Shen, H.; Aster, J.C.; Rodig, S.; et al. Comprehensive analyses of tumor immunity: Implications for cancer immunotherapy. Genome Biol. 2016, 17, 174. [Google Scholar] [CrossRef]
  51. Hayashi, A.; Ruppo, S.; Heilbrun, E.E.; Mazzoni, C.; Adar, S.; Yassour, M.; Rmaileh, A.A.; Shaul, Y.D. GENI: A web server to identify gene set enrichments in tumor samples. Comput. Struct. Biotechnol. J. 2023, 21, 5531–5537. [Google Scholar] [CrossRef] [PubMed]
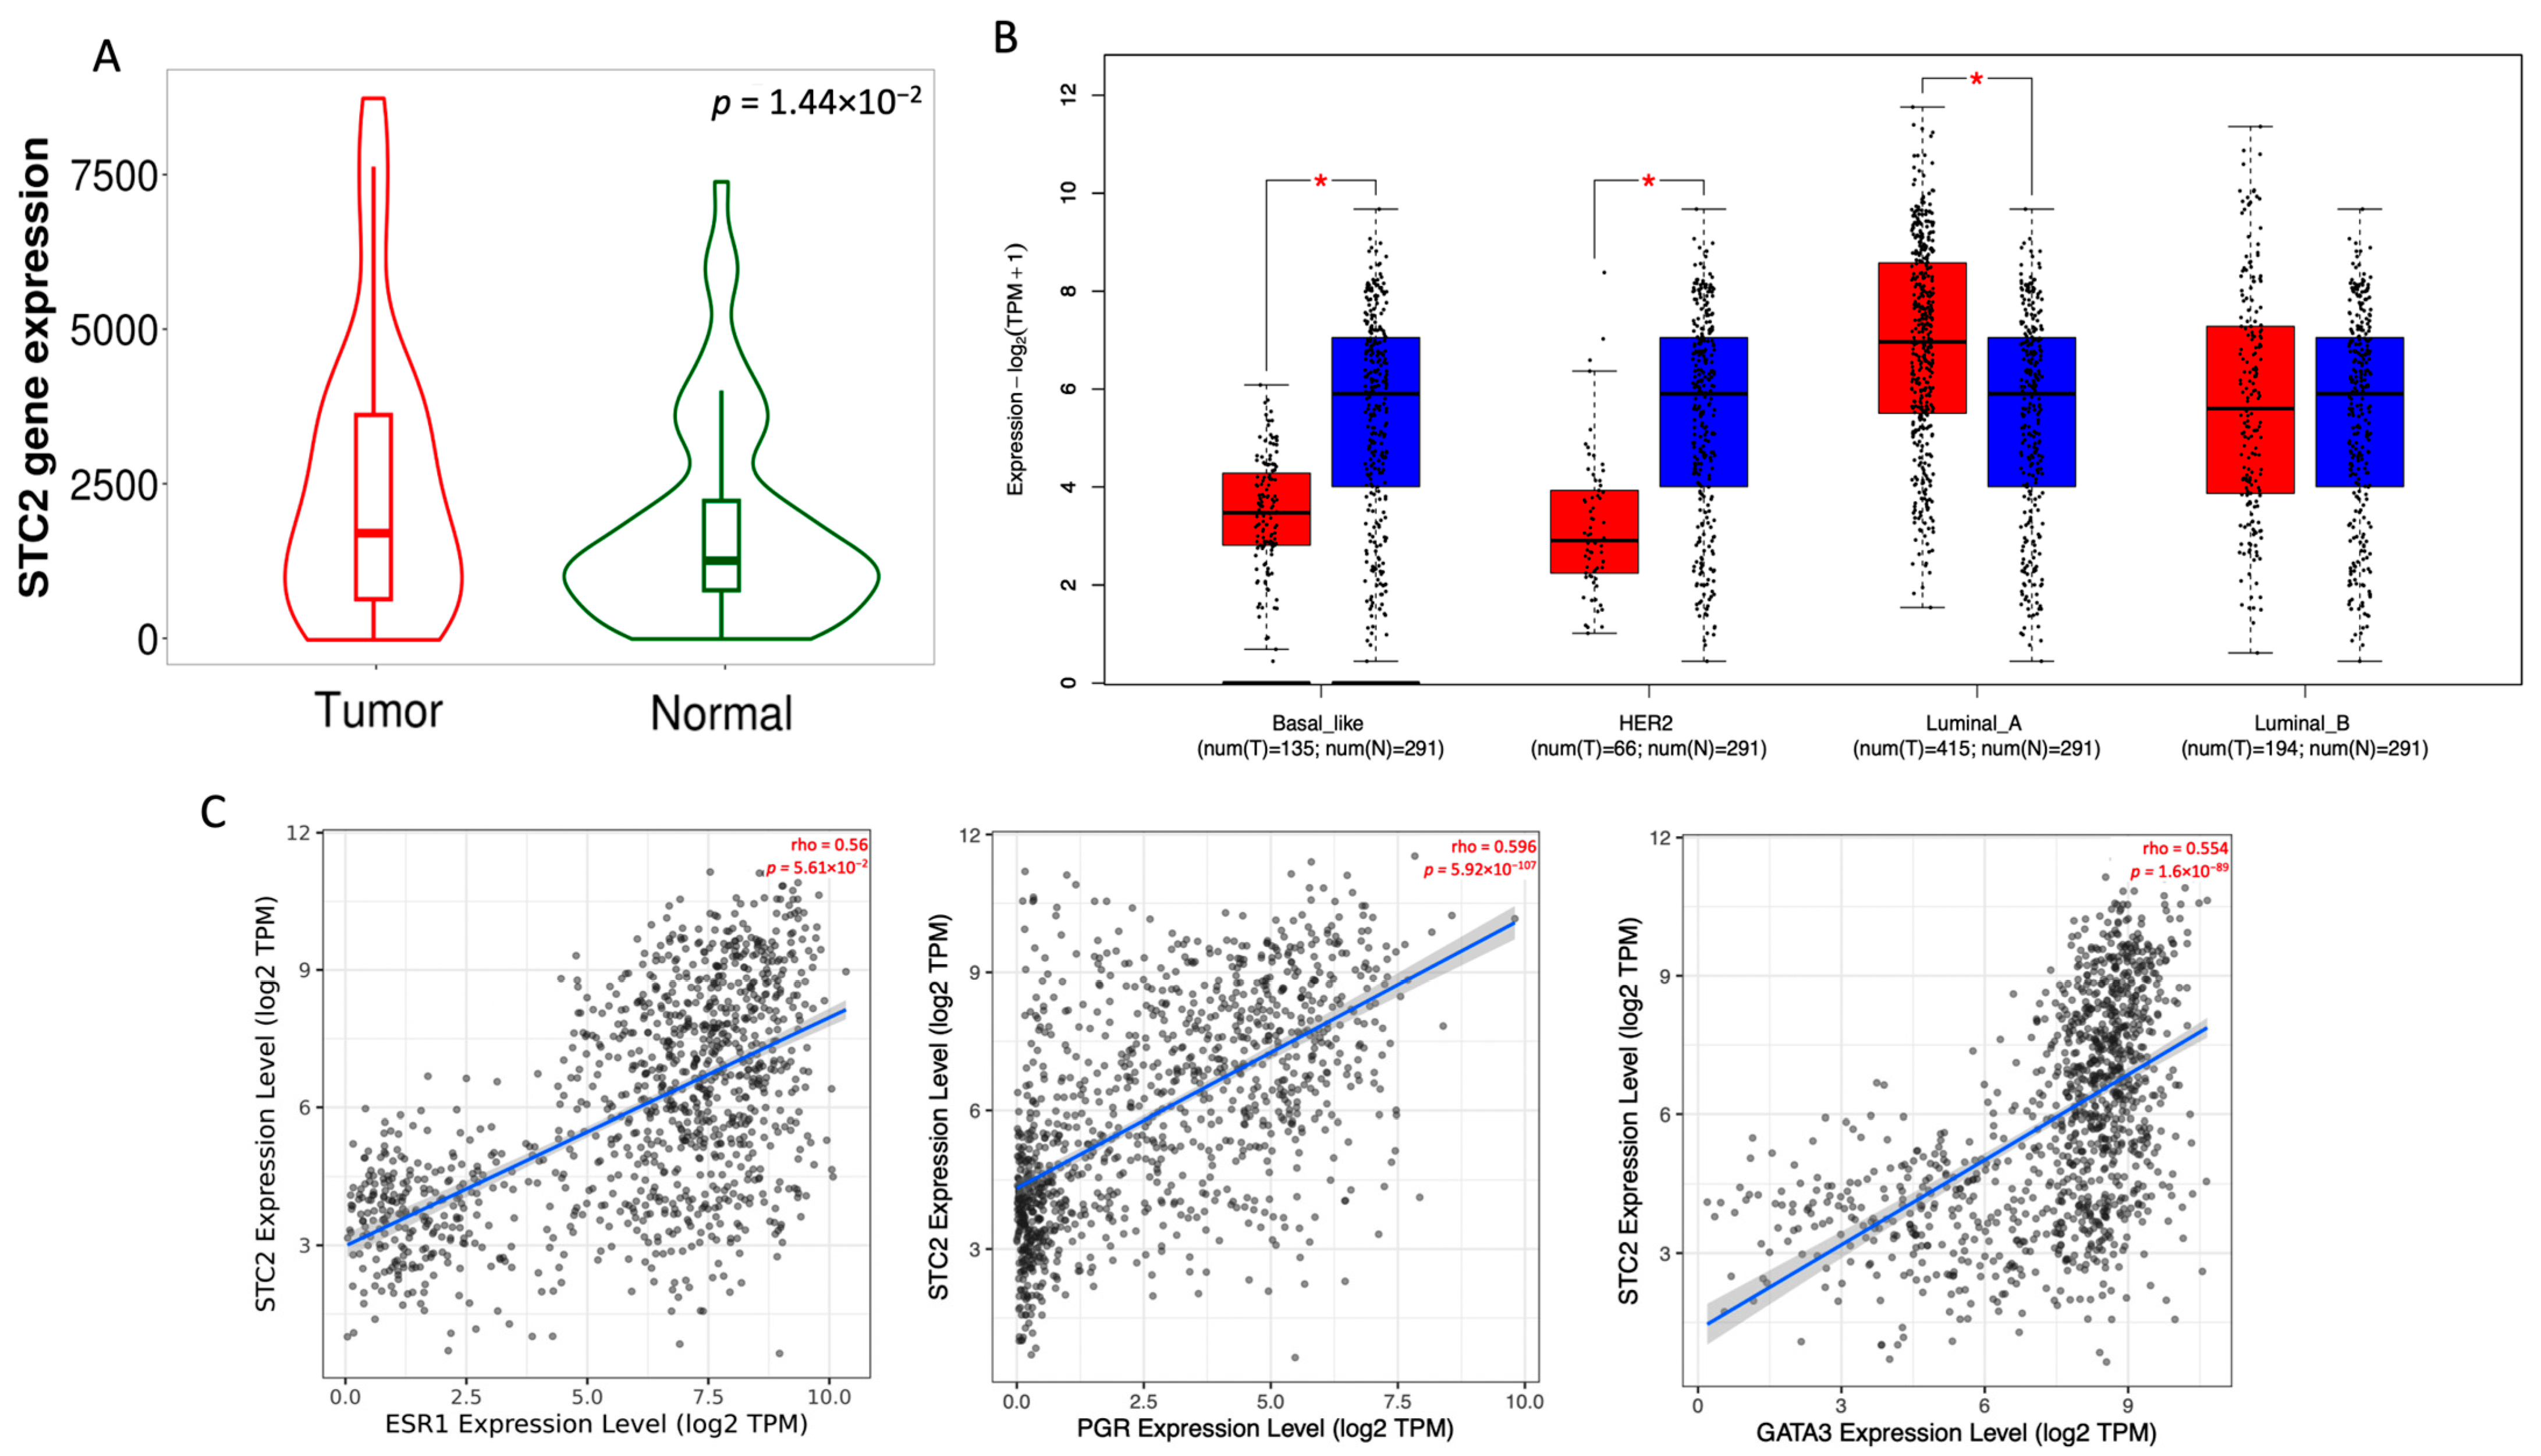
Figure 1. STC2 expression analysis in breast cancer tissues compared to normal tissues. (A) Violin plot showing STC2 gene expression levels in normal and tumor tissues. The plot includes paired tumor and adjacent normal tissues (B) Box plots showing STC2 expression in different breast cancer subtypes. Tumor samples are shown in red; Normal samples in blue. (C) Correlation plots showing the association of STC2 expression with luminal markers ESR1, PGR, and GATA3. Each plot displays the correlation coefficient (rho) and p-value, indicating significant positive correlations between STC2 and the luminal markers. * p < 0.05.
Pharmaceuticals 18 00235 g001
Figure 2. GSEA of STC2 expression in breast invasive carcinoma using GENI web server. The analysis was conducted by selecting breast tissue and focusing on STC2 from the TCGA PanCancer Atlas dataset. Predefined Curated (A), Hallmark (B), PID (C), and KEGG (D) gene sets were applied. The colors in the gradient below the enrichment curve reflect the correlation with the studied condition: the red area indicates genes positively correlated with STC2 expression in breast invasive carcinoma, while the blue area represents genes with a negative correlation.
Pharmaceuticals 18 00235 g002
Figure 3. Kaplan–Meier survival curves showing the impact of STC2 expression on RFS in ER-positive (A) and ER-negative (B) breast cancer patients. The curves depict the probability of RFS over time for each group, with high STC2 expression denoted in red and low STC2 expression in black.
Pharmaceuticals 18 00235 g003
Figure 4. Expression of STC2 and its association with chemotherapy response in grade II breast cancer patients. (A) Box plot showing STC2 expression levels comparing non-responders and responders to chemotherapy in grade II ER-positive breast cancer patients. (B) ROC curve evaluating the diagnostic performance of STC2 expression in ER-positive breast cancer patients. (C) Distribution of response status across quartiles of STC2 expression in ER-positive breast cancer patients. (D) Box plot comparing STC2 expression levels between non-responders and responders to chemotherapy in grade II ER-negative breast cancer patients. (E) ROC curve assessing the predictive value of STC2 expression for chemotherapy response in ER-negative breast cancer patients. (F) Distribution of response status across STC2 expression quartiles in ER-negative breast cancer patients.
Pharmaceuticals 18 00235 g004
Figure 5. Dox induces a suppression of STC2 gene expression. (A,B) RT-qPCR analysis of STC2 gene expression in MCF7 (A) and MDA-MB-231 (B) cells exposed to Dox for 24 h. (C,D) Volcano plots of datasets GSE244574 and GSE202536 showing differentially upregulated (red) and downregulated (blue) genes, with STC2 highlighted in a yellow dot. (E,F) Bar charts represent the top enriched pathways based on adjusted p-values. Data are presented as mean ± standard error of the mean from triplicate experiments. (* p < 0.05, ** p < 0.01).
Pharmaceuticals 18 00235 g005
Disclaimer/Publisher’s Note: The statements, opinions and data contained in all publications are solely those of the individual author(s) and contributor(s) and not of MDPI and/or the editor(s). MDPI and/or the editor(s) disclaim responsibility for any injury to people or property resulting from any ideas, methods, instructions or products referred to in the content.