
A Simple Machine Learning-Based Quantitative Structure–Activity Relationship Model for Predicting pIC50 Inhibition Values of FLT3 Tyrosine Kinase

 ,
,
Abstract

1. Introduction
2. Results and Discussion
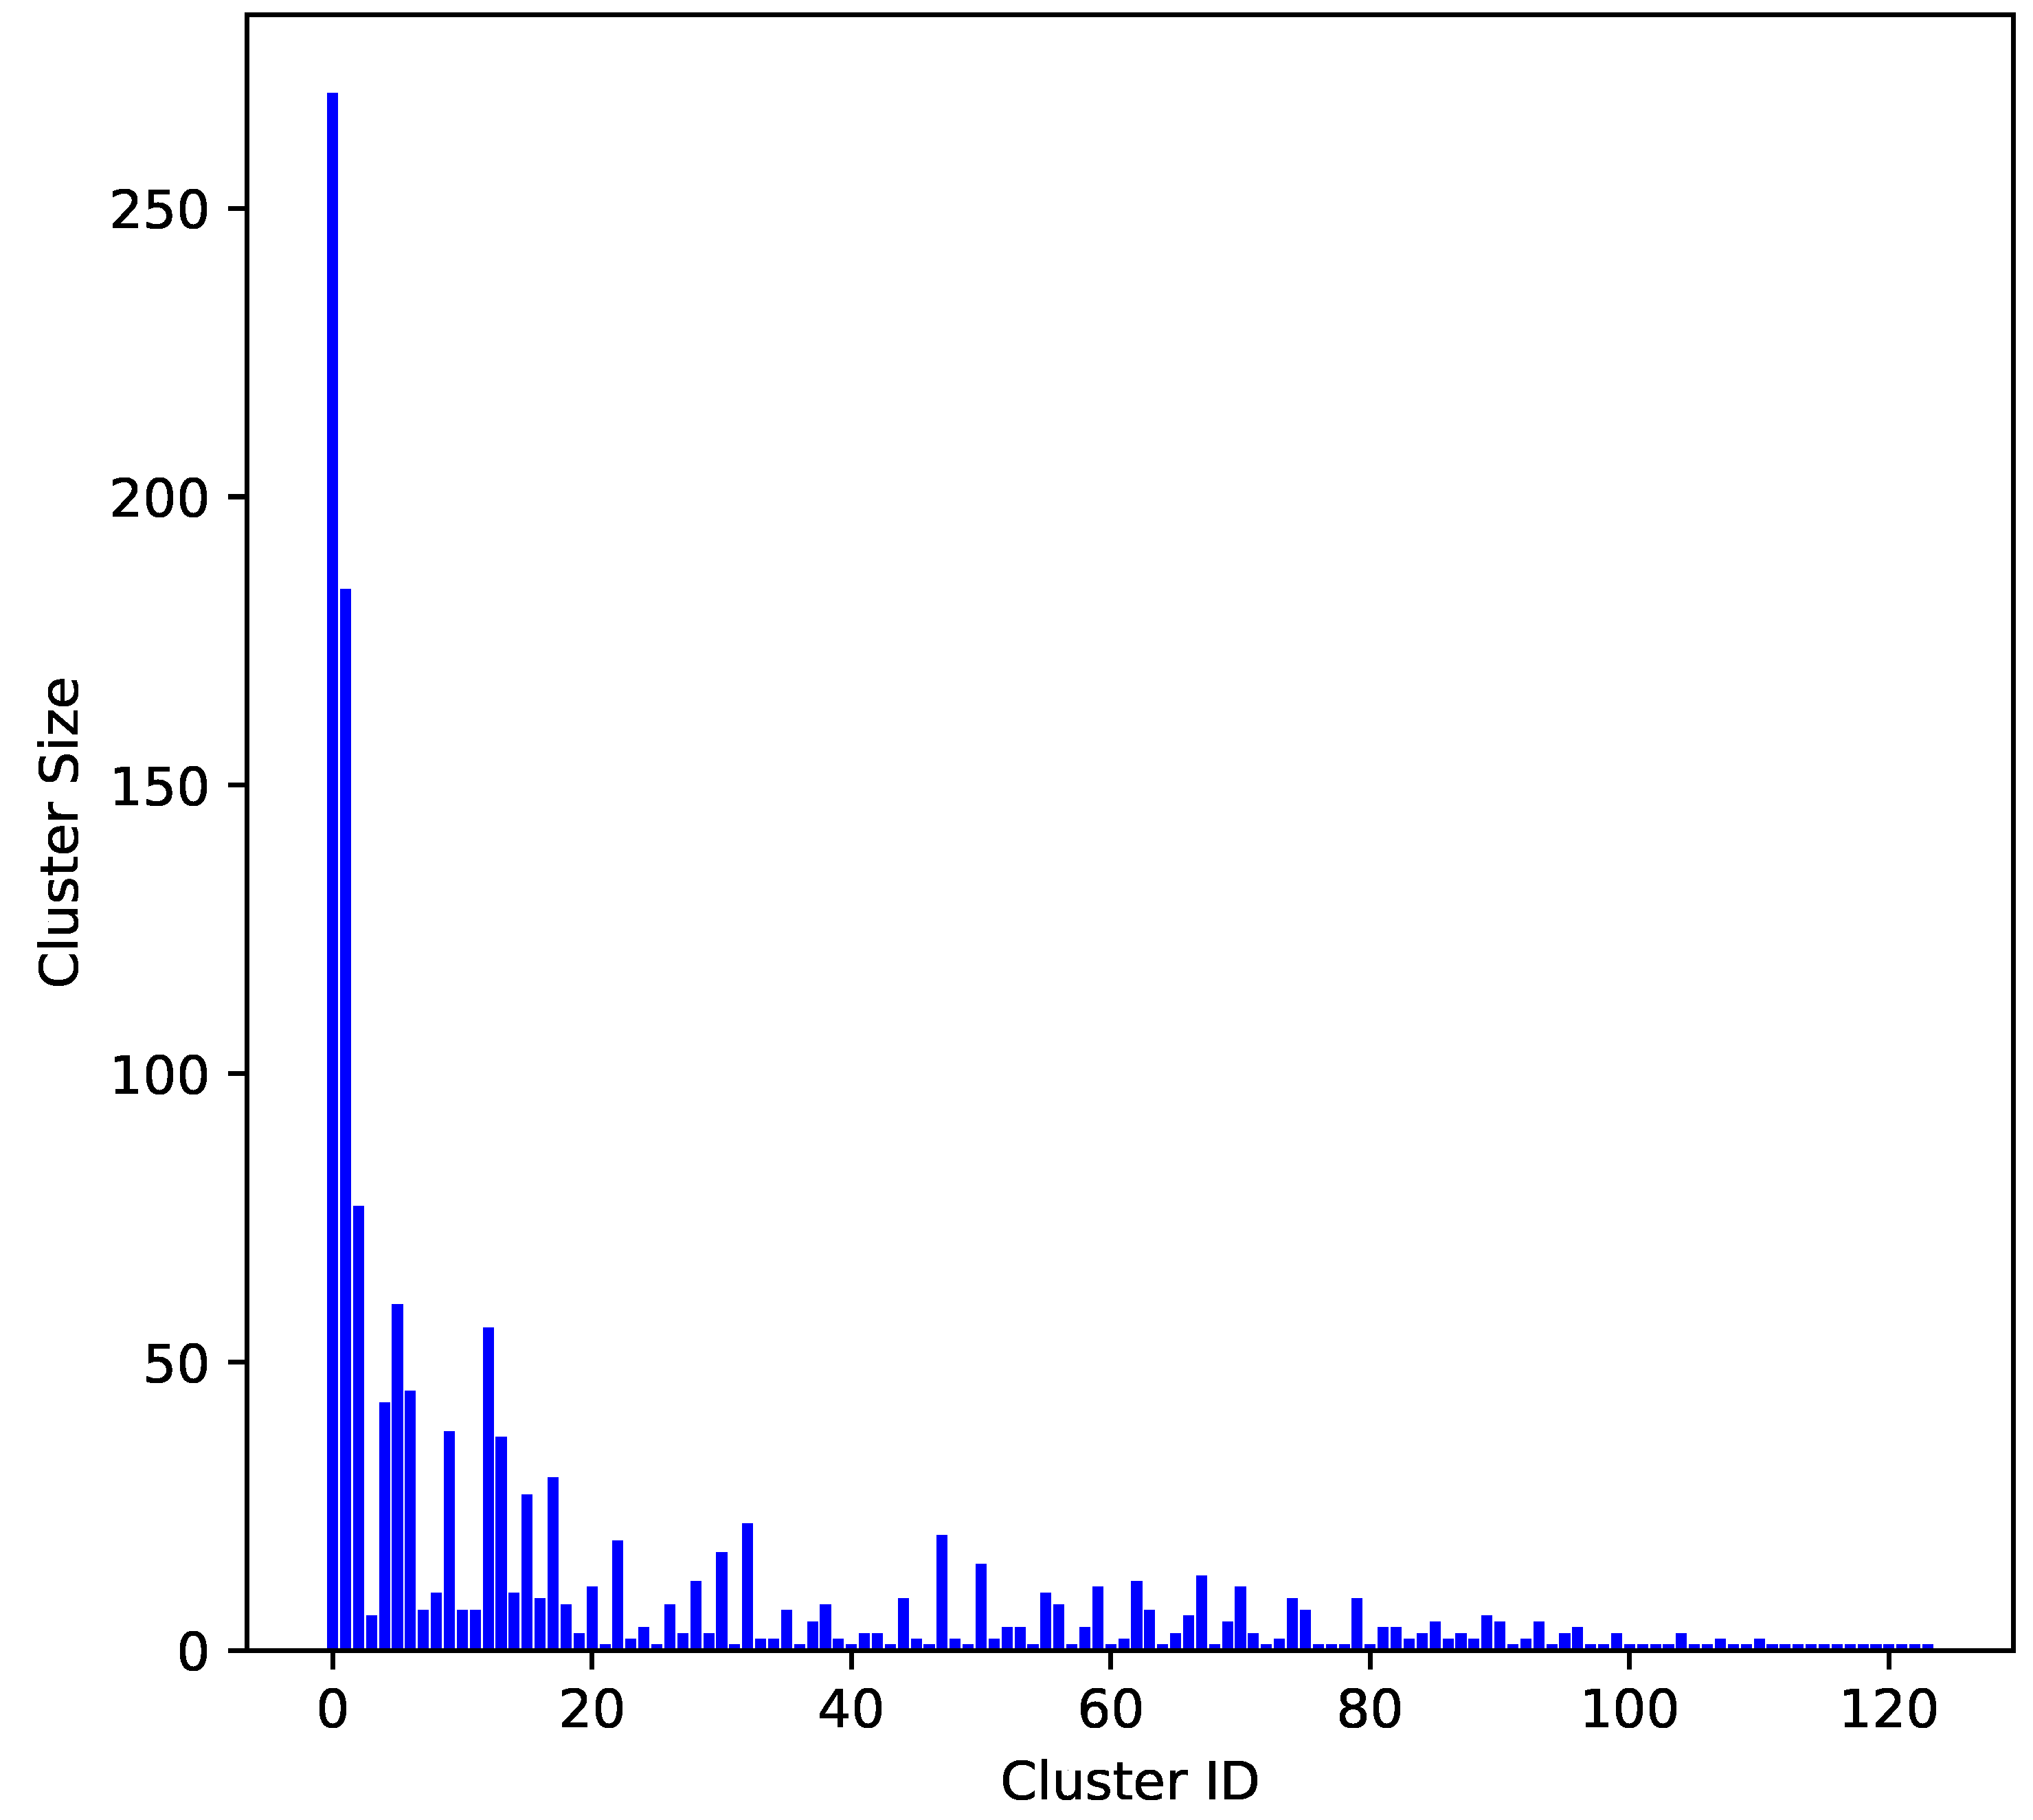
2.1. Molecular Diversity of the Dataset
2.2. Benchmarking Machine Learning Methods
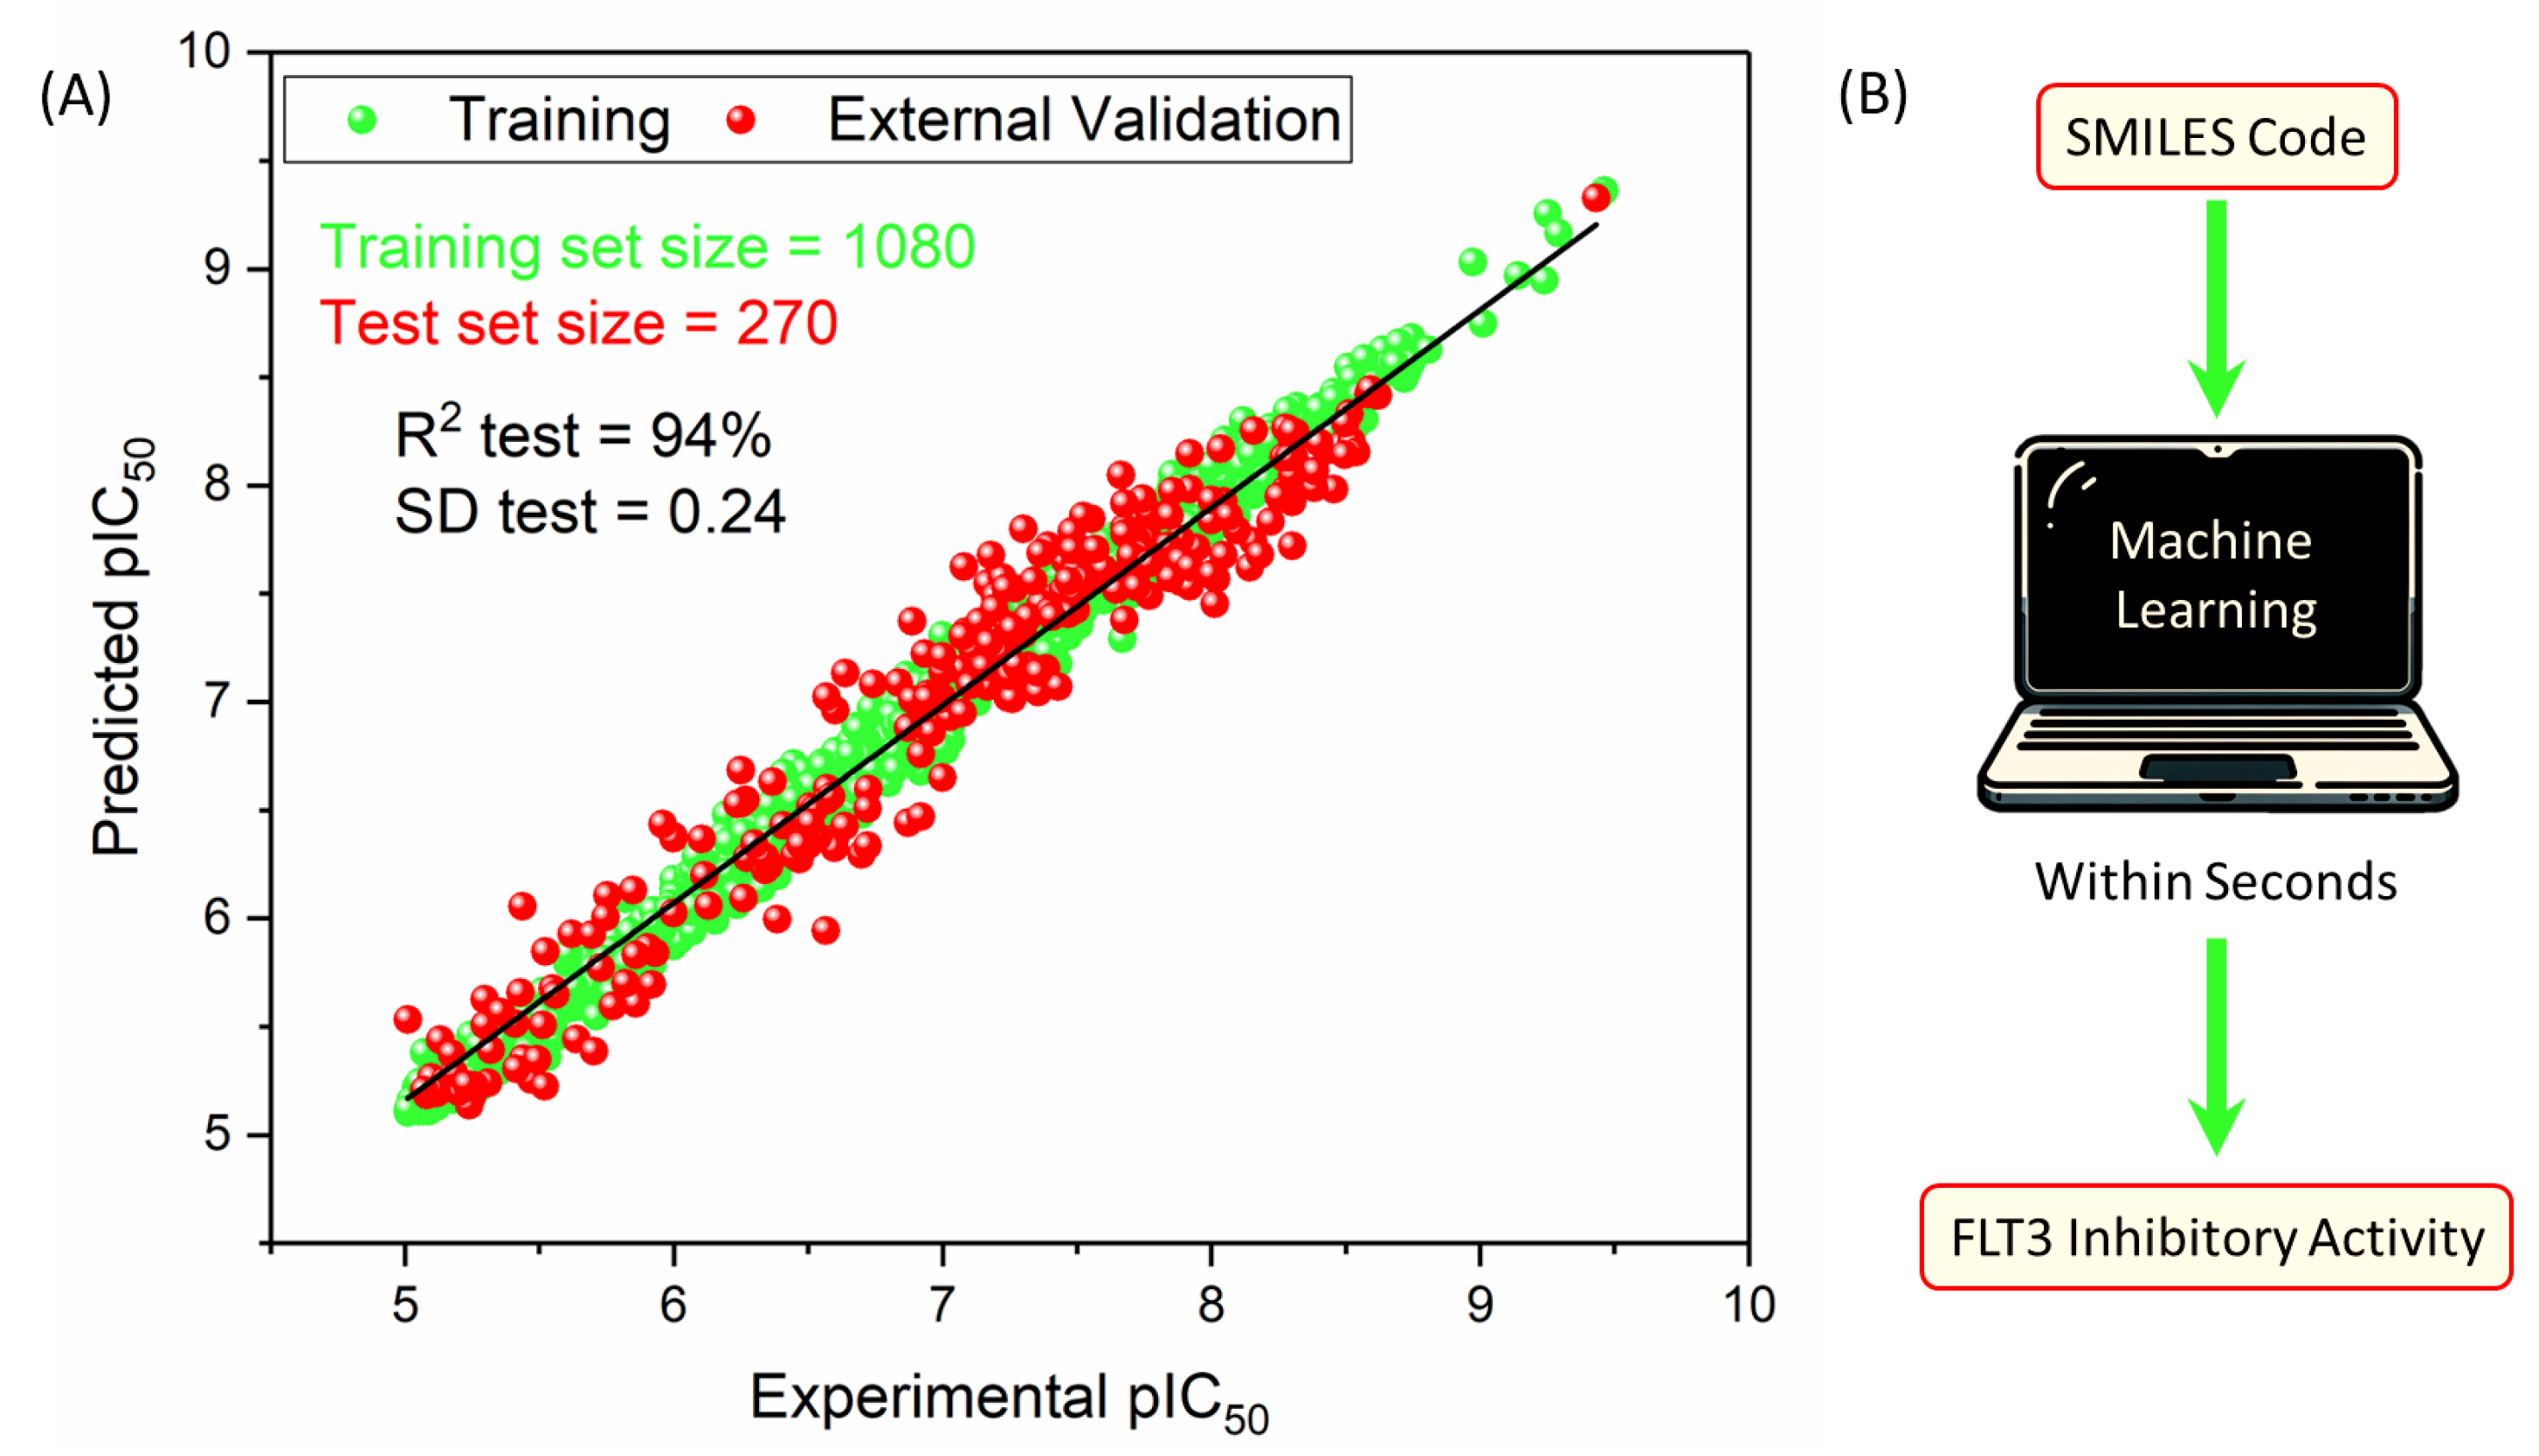
2.3. Model Performance Overview
2.3.1. Training Performance
2.3.2. Testing Performance
2.4. The Model
2.5. Comparative Analysis: QSAR Modeling
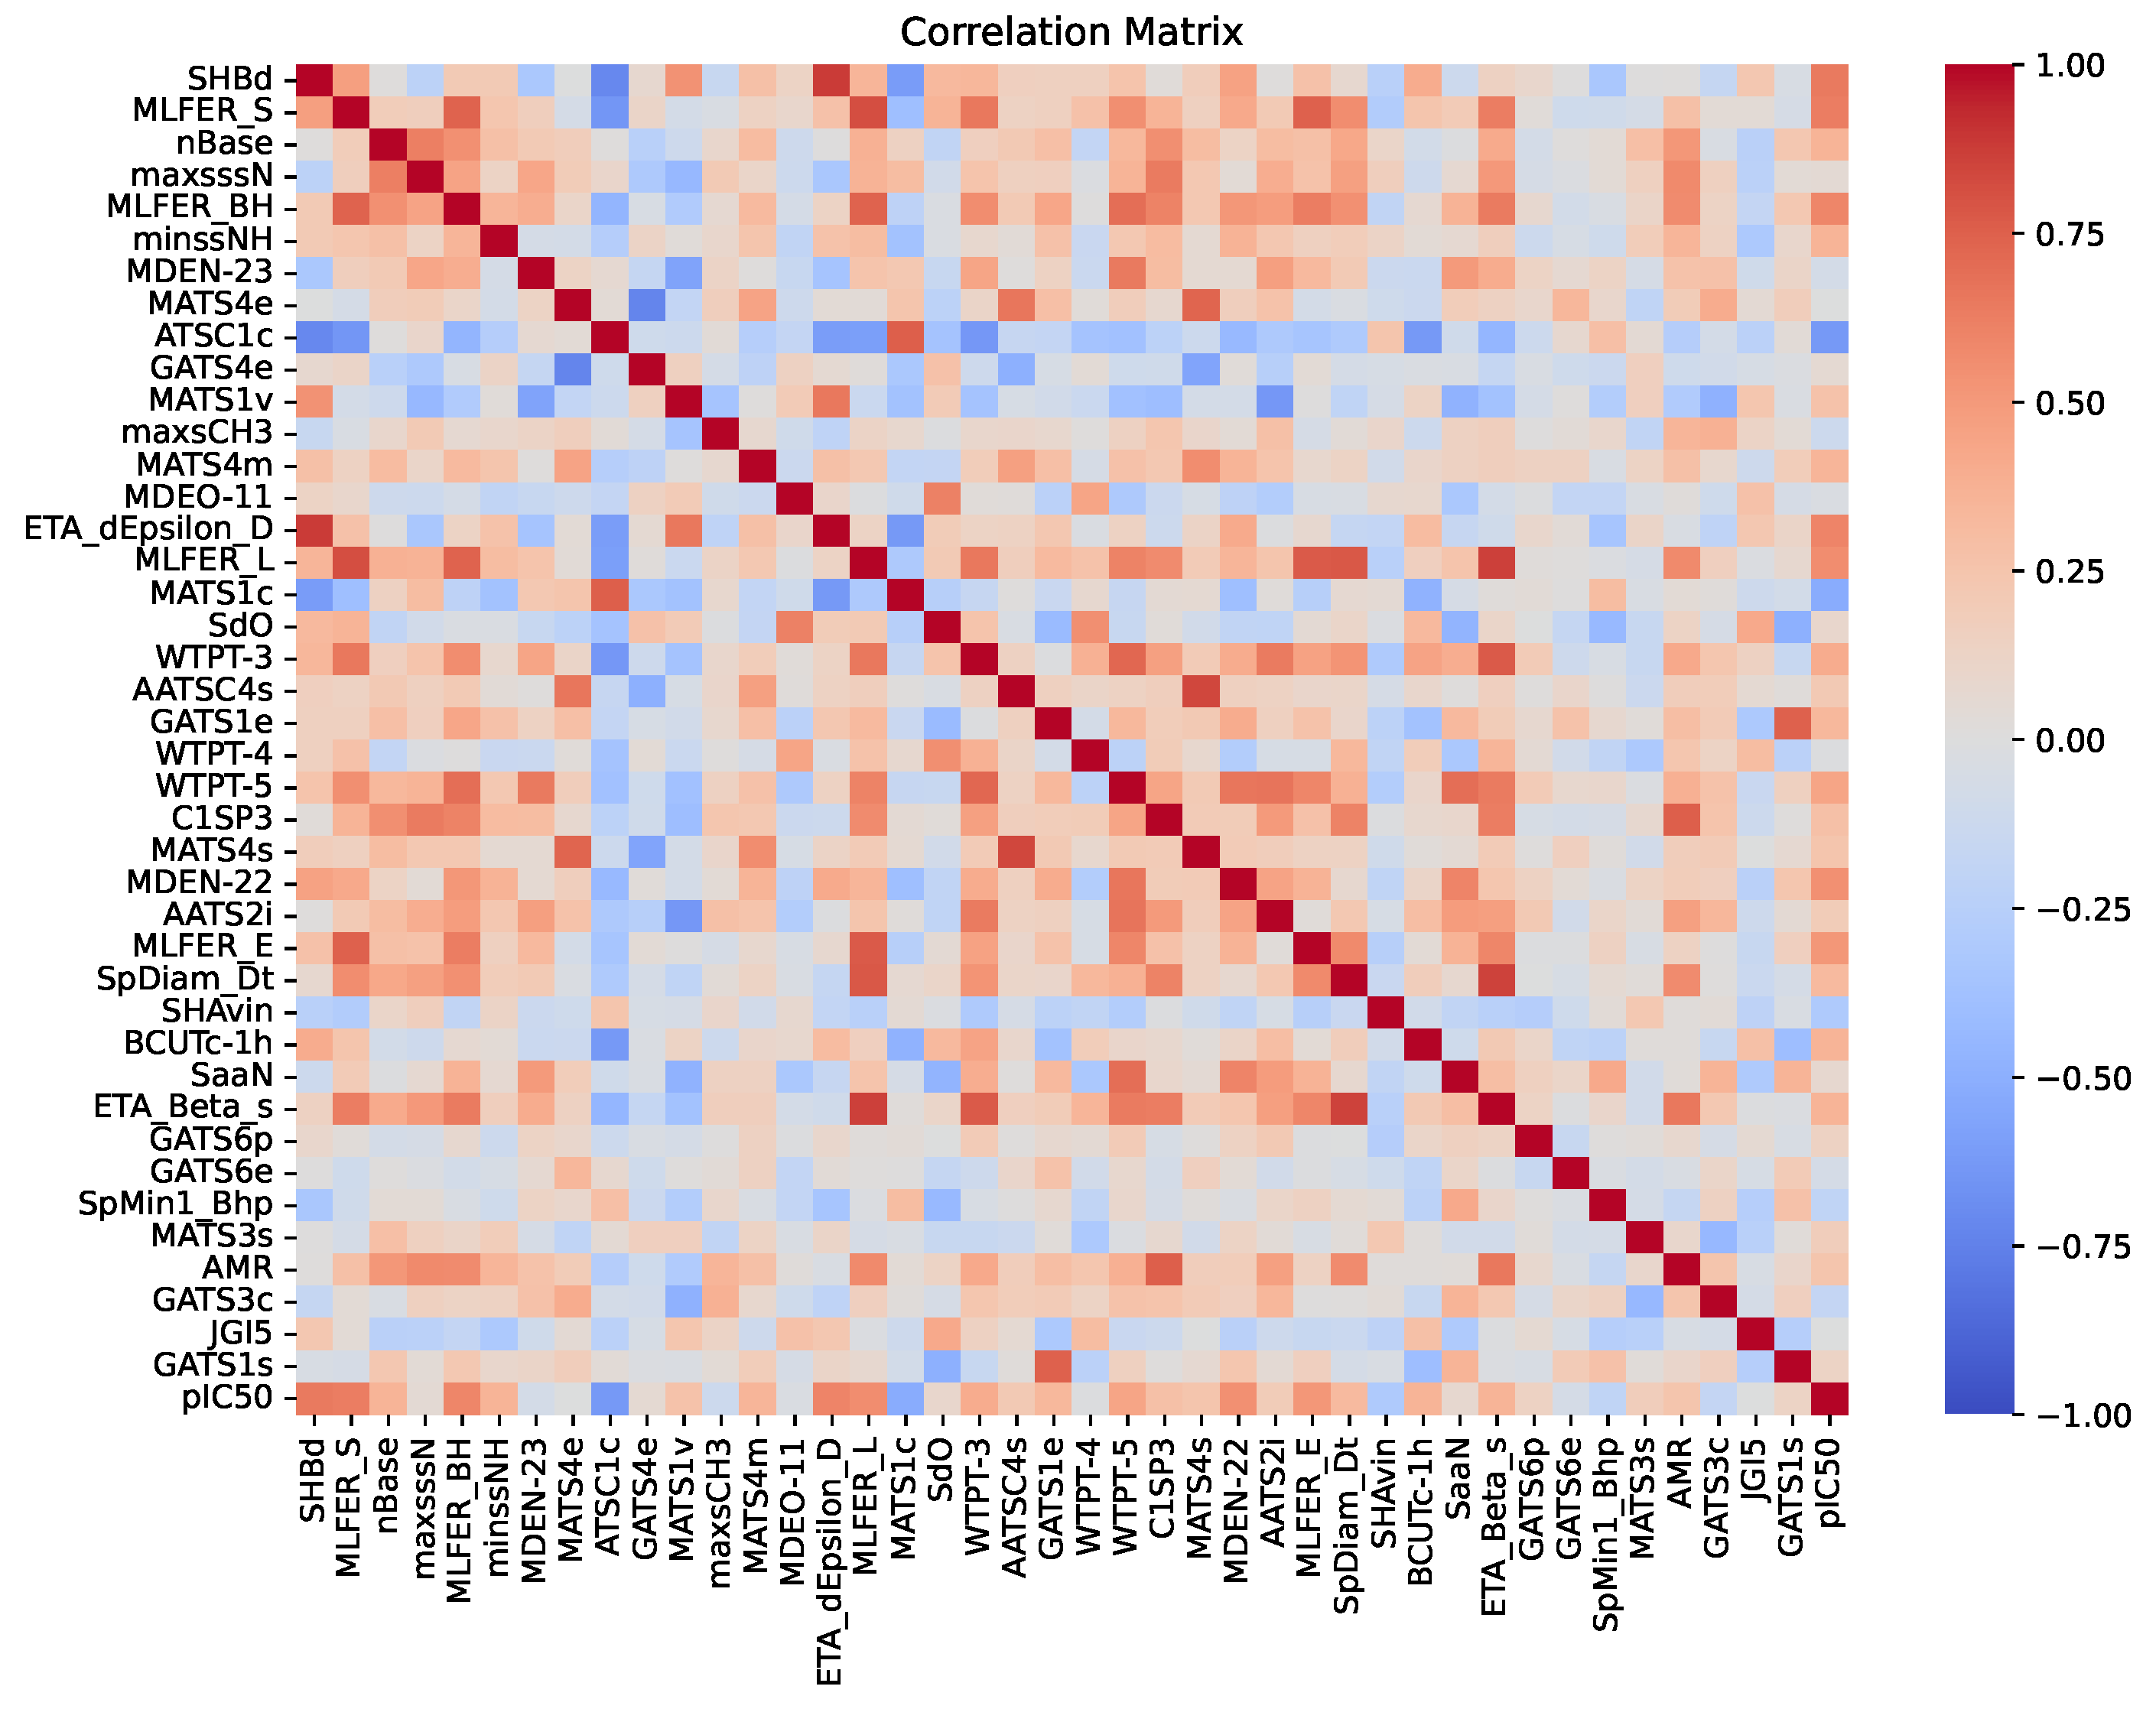
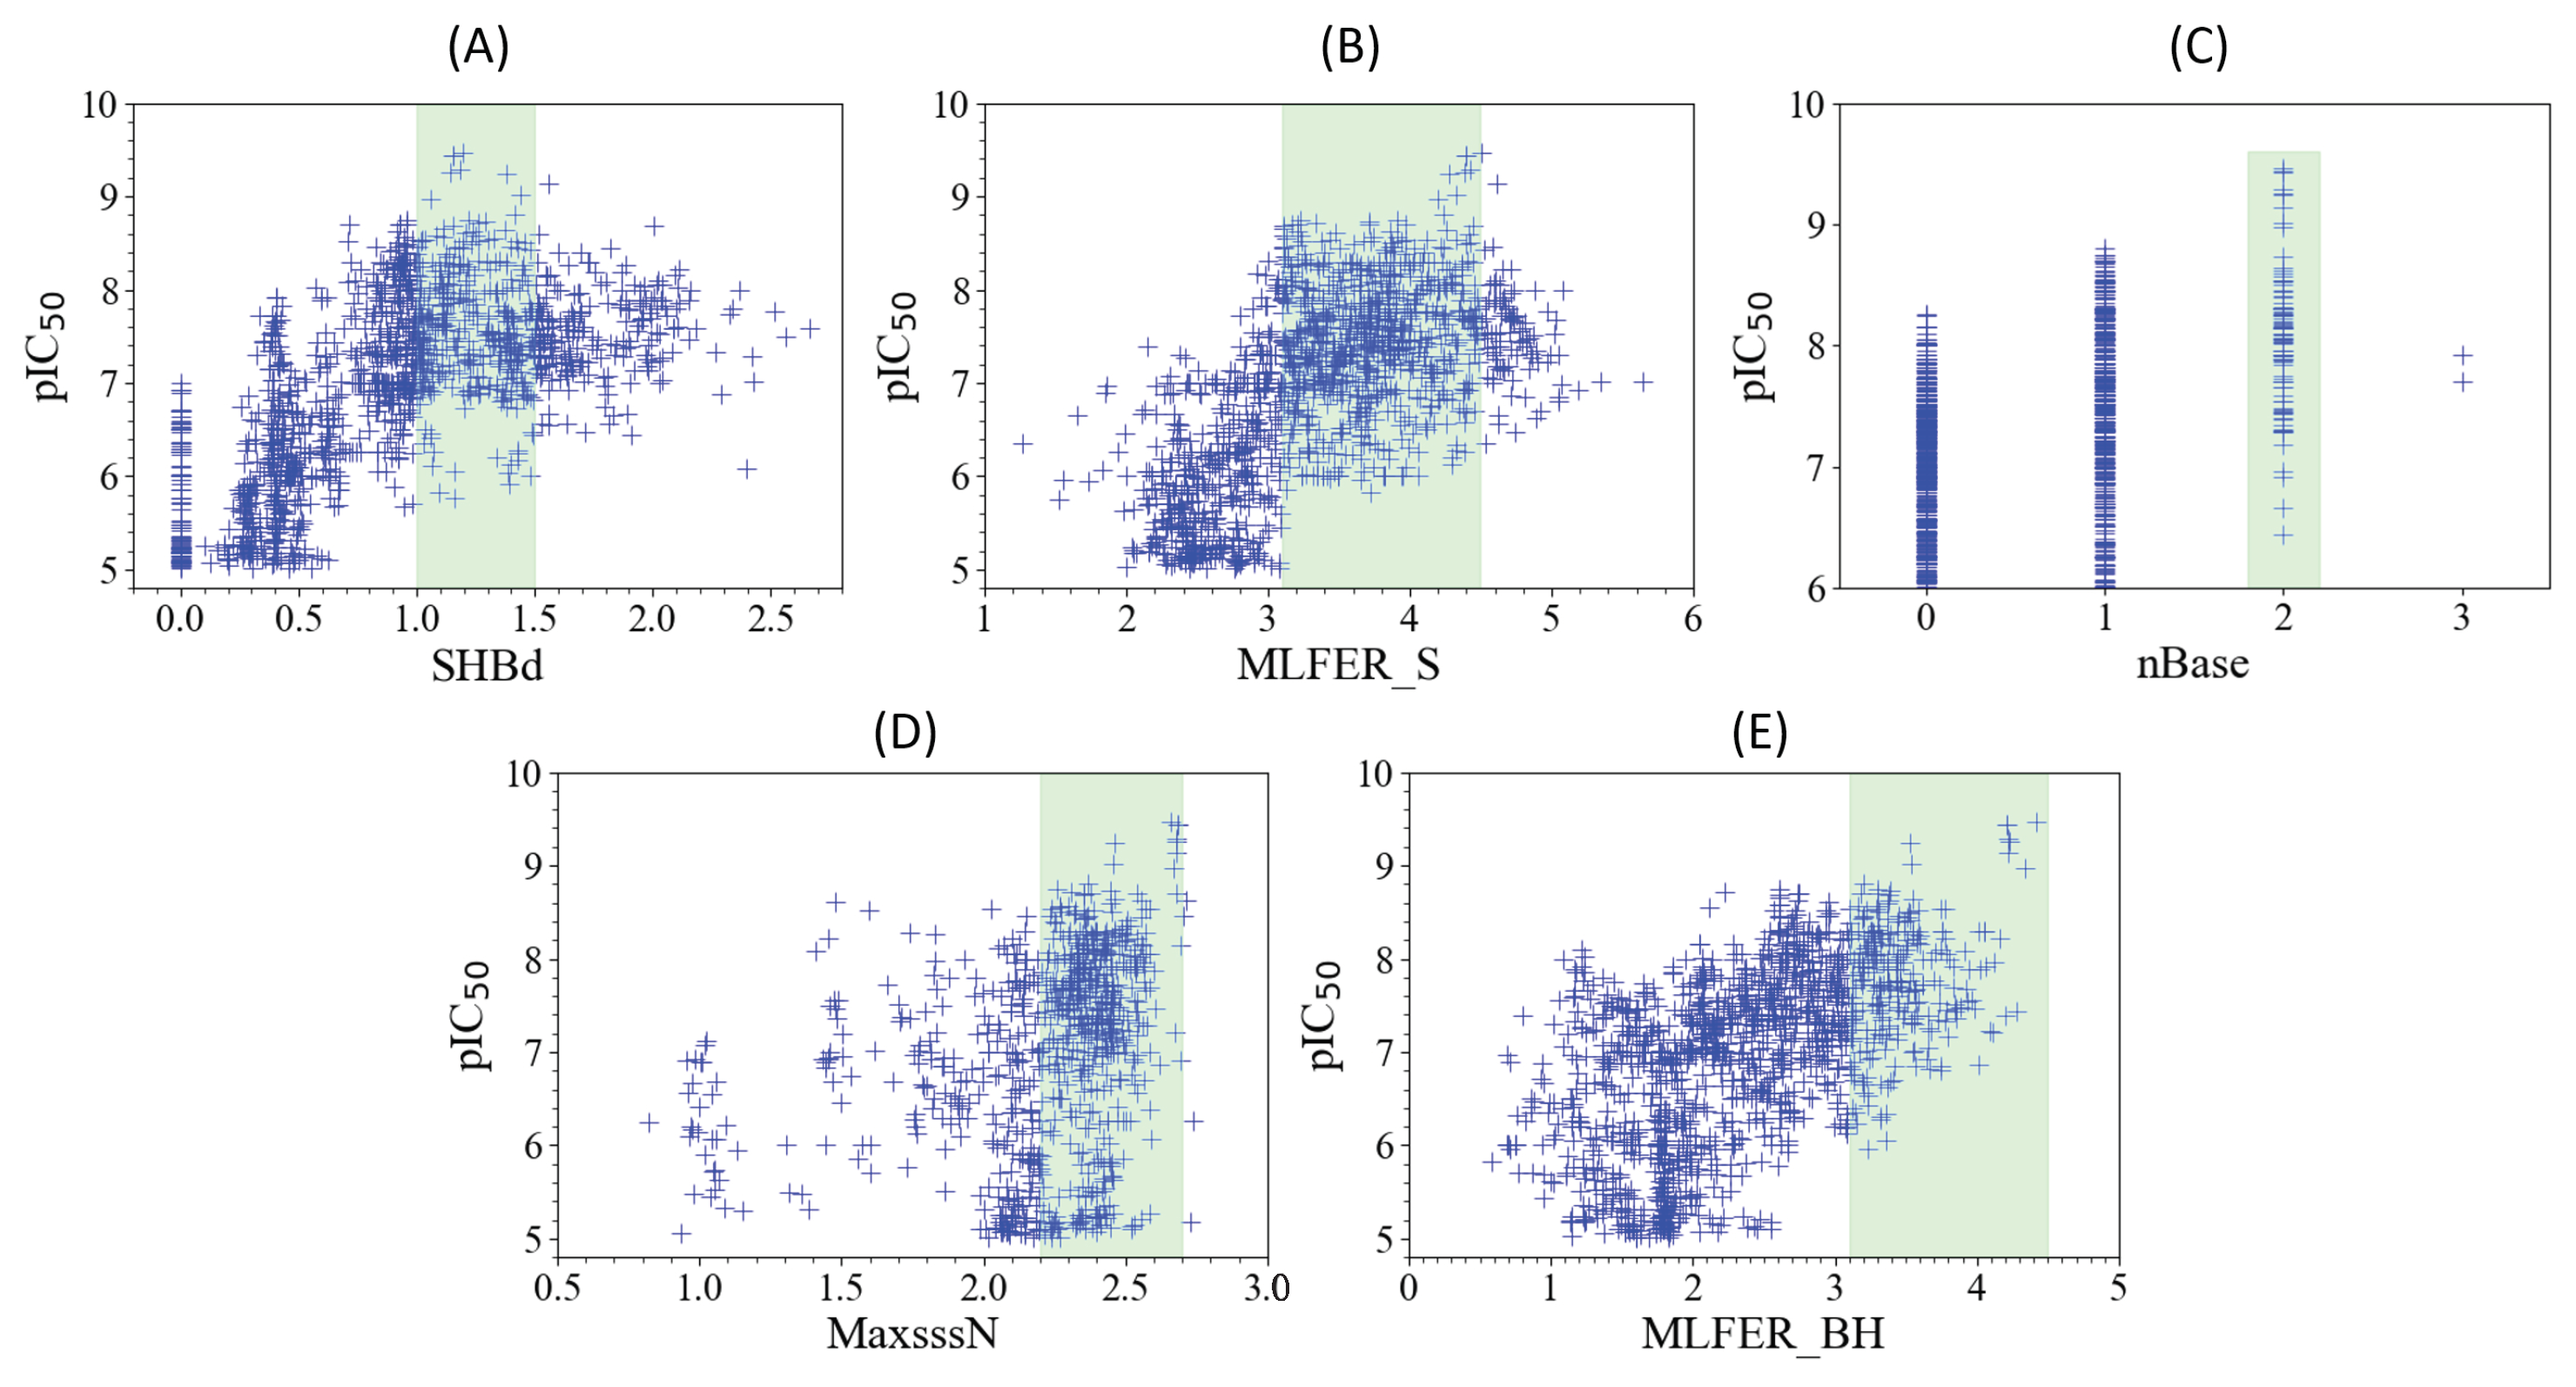
2.6. Model Interpretation
2.6.1. SHBd
2.6.2. MLFER_S
2.6.3. nBase, MaxsssN, and MLFER_BH
2.7. Novel FLT3 Inhibitors Identified by Ligand-Based Screening
2.8. Script-like Tool Description
3. Materials and Methods
3.1. Data Curation
3.2. Molecular Descriptor Calculation
3.3. Benchmarking Machine Learning Methods with External Validation
3.3.1. ANN Architecture
3.3.2. Model Evaluation and External Validation
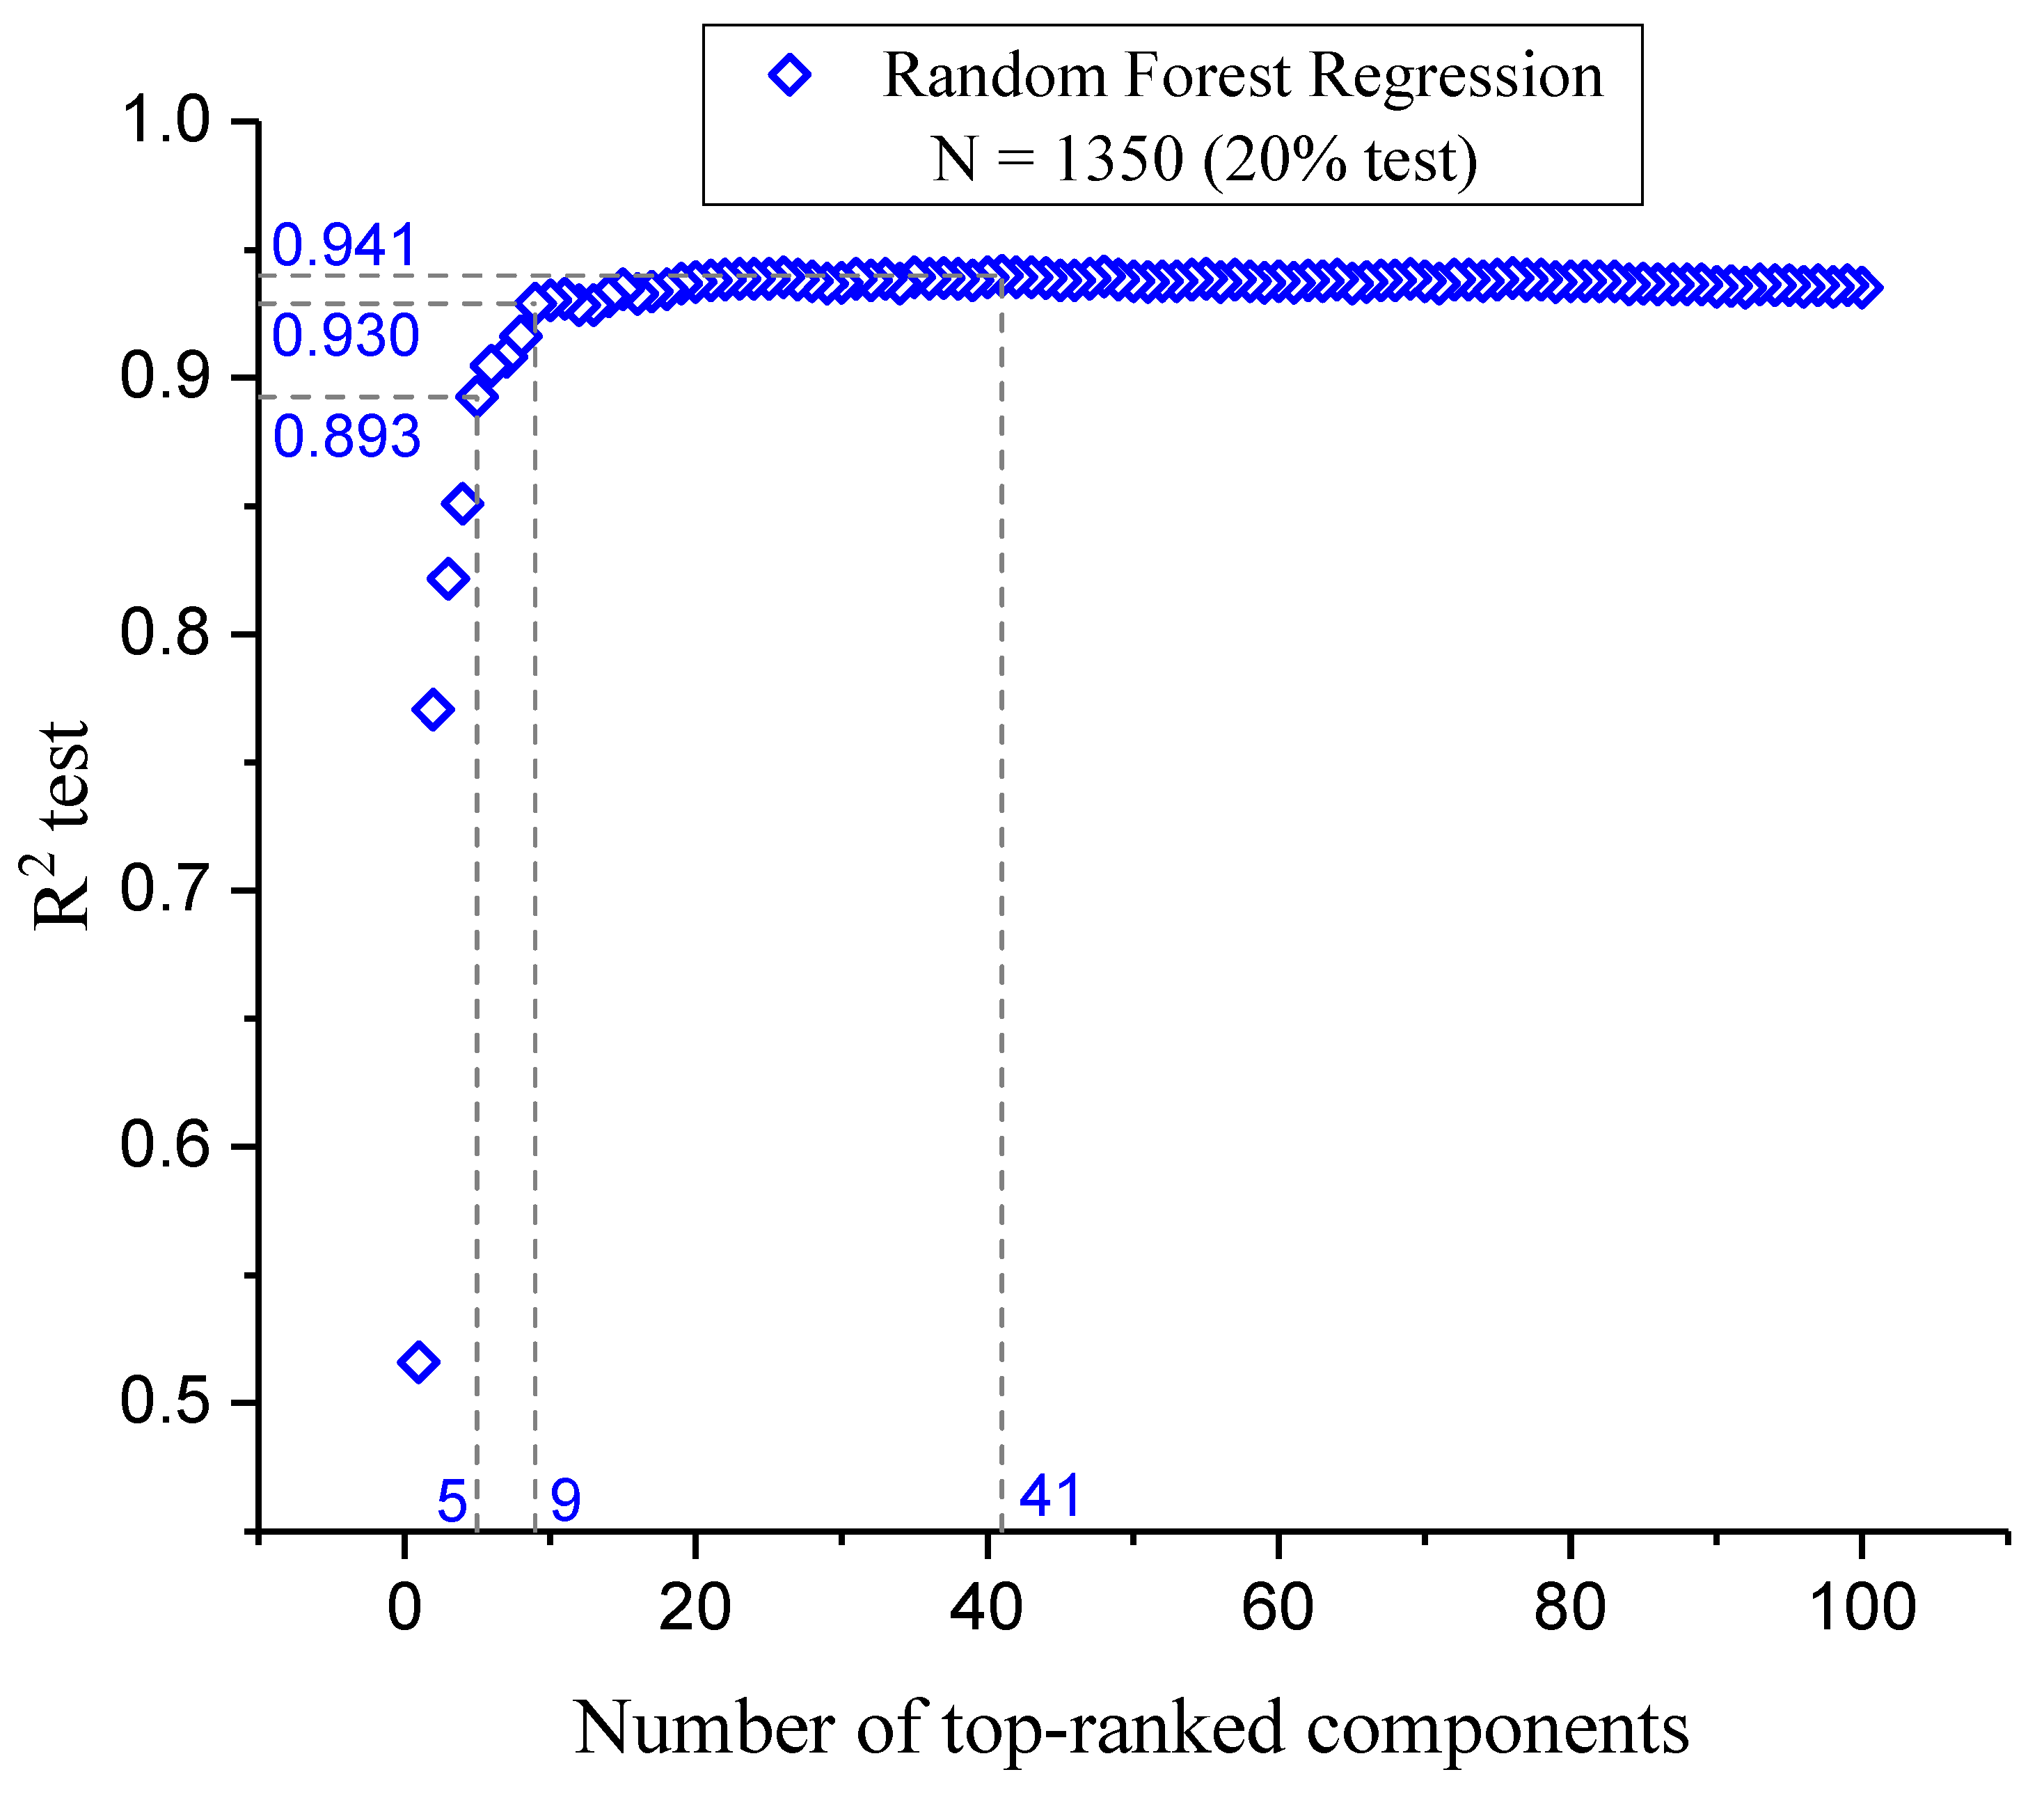
3.4. Component Optimization Through Feature Selection
3.4.1. Individual Descriptor Evaluation
3.4.2. Analysis and Feature Selection Process
3.5. Internal Validation
3.6. Ligand-Based Virtual Screening
4. Conclusions
Supplementary Materials
Author Contributions
Funding
Institutional Review Board Statement
Informed Consent Statement
Data Availability Statement
Acknowledgments
Conflicts of Interest
References
- Birg, F.; Courcoul, M.; Rosnet, O.; Bardin, F.; Pébusque, M.J.; Marchetto, S.; Tabilio, A.; Mannoni, P.; Birnbaum, D. Expression of the FMS/KIT-like gene FLT3 in human acute leukemias of the myeloid and lymphoid lineages. Blood 1992, 80, 2584–2593. [Google Scholar] [CrossRef] [PubMed]
- Small, D. FLT3 mutations: Biology and treatment. Hematol. Am. Soc. Hematol. Educ. Program 2006, 2006, 178–184. [Google Scholar] [CrossRef]
- Barley, K.; Navada, S.C. Acute myeloid leukemia. Oncology 2019, 373, 308–318. [Google Scholar] [CrossRef]
- Kazi, J.U.; Rönnstrand, L. FMS-like tyrosine kinase 3/FLT3: From basic science to clinical implications. Physiol. Rev. 2019, 99, 1433–1466. [Google Scholar] [CrossRef] [PubMed]
- Kantarjian, H.M.; Short, N.J.; Fathi, A.T.; Marcucci, G.; Ravandi, F.; Tallman, M.; Wang, E.S.; Wei, A.H. Acute Myeloid Leukemia: Historical Perspective and Progress in Research and Therapy Over 5 Decades. Clin. Lymphoma Myeloma Leuk. 2021, 21, 580–597. [Google Scholar] [CrossRef] [PubMed]
- Wei, A.H.; Tiong, I.S. Midostaurin, enasidenib, CPX-351, gemtuzumab ozogamicin, and venetoclax bring new hope to AML. Blood 2017, 130, 2469–2474. [Google Scholar] [CrossRef]
- Daver, N.; Wei, A.H.; Pollyea, D.A.; Fathi, A.T.; Vyas, P.; DiNardo, C.D. New directions for emerging therapies in acute myeloid leukemia: The next chapter. Blood Cancer J. 2020, 10, 1–12. [Google Scholar] [CrossRef] [PubMed]
- Kantarjian, H.; Kadia, T.; DiNardo, C.; Daver, N.; Borthakur, G.; Jabbour, E.; Garcia-Manero, G.; Konopleva, M.; Ravandi, F. Acute myeloid leukemia: Current progress and future directions. Blood Cancer J. 2021, 11, 1–25. [Google Scholar] [CrossRef] [PubMed]
- Jaramillo, S.; Schlenk, R.F. Update on current treatments for adult acute myeloid leukemia: To treat acute myeloid leukemia intensively or non-intensively? That is the question. Haematologica 2023, 108, 342–352. [Google Scholar] [CrossRef] [PubMed]
- Kumar Kar, R.; Suryadevara, P.; Roushan, R.; Chandra Sahoo, G.; Ranjan Dikhit, M.; Das, P. Quantifying the Structural Requirements for Designing Newer FLT3 Inhibitors. Med. Chem. 2012, 8, 913–927. [Google Scholar] [CrossRef] [PubMed]
- Shih, K.C.; Lin, C.Y.; Chi, H.C.; Hwang, C.S.; Chen, T.S.; Tang, C.Y.; Hsiao, N.W. Design of novel FLT-3 inhibitors based on dual-layer 3D-QSAR model and fragment-based compounds in silico. J. Chem. Inf. Model. 2012, 52, 146–155. [Google Scholar] [CrossRef] [PubMed]
- Abutayeh, R.F.; Taha, M.O. Discovery of novel Flt3 inhibitory chemotypes through extensive ligand-based and new structure-based pharmacophore modelling methods. J. Mol. Graph. Model. 2019, 88, 128–151. [Google Scholar] [CrossRef] [PubMed]
- Bhujbal, S.P.; Keretsu, S.; Cho, S.J. Design of New Therapeutic Agents Targeting FLT3 Receptor Tyrosine Kinase Using Molecular Docking and 3D-QSAR Approach. Lett. Drug Des. Discov. 2019, 17, 585–596. [Google Scholar] [CrossRef]
- Fernandes, Í.A.; Resende, D.B.; Ramalho, T.C.; Kuca, K.; Da Cunha, E.F.F. Theoretical studies aimed at finding FLT3 inhibitors and a promising compound and molecular pattern with dual aurora B/FLT3 activity. Molecules 2020, 25, 1726. [Google Scholar] [CrossRef] [PubMed]
- Ghosh, S.; Keretsu, S.; Cho, S.J. Molecular modeling studies of n-phenylpyrimidine-4-amine derivatives for inhibiting FMS-like tyrosine kinase-3. Int. J. Mol. Sci. 2021, 22, 12511. [Google Scholar] [CrossRef] [PubMed]
- Sandoval, C.; Torrens, F.; Godoy, K.; Reyes, C.; Farías, J. Application of Quantitative Structure-Activity Relationships in the Prediction of New Compounds with Anti-Leukemic Activity. Int. J. Mol. Sci. 2023, 24, 12258. [Google Scholar] [CrossRef]
- Islam, M.R.; Osman, O.I.; Hassan, W.M. Identifying novel therapeutic inhibitors to target FMS-like tyrosine kinase-3 (FLT3) against acute myeloid leukemia: A molecular docking, molecular dynamics, and DFT study. J. Biomol. Struct. Dyn. 2023. [Google Scholar] [CrossRef]
- Liu, K.; Hu, J. Classification of acute myeloid leukemia M1 and M2 subtypes using machine learning. Comput. Biol. Med. 2022, 147, 105741. [Google Scholar] [CrossRef]
- Abhishek, A.; Jha, R.K.; Sinha, R.; Jha, K. Automated classification of acute leukemia on a heterogeneous dataset using machine learning and deep learning techniques. Biomed. Signal Process. Control 2022, 72, 103341. [Google Scholar] [CrossRef]
- Monaghan, S.A.; Li, J.L.; Liu, Y.C.; Ko, M.Y.; Boyiadzis, M.; Chang, T.Y.; Wang, Y.F.; Lee, C.C.; Swerdlow, S.H.; Ko, B.S. A machine learning approach to the classification of acute leukemias and distinction from nonneoplastic cytopenias using flow cytometry data. Am. J. Clin. Pathol. 2022, 157, 546–553. [Google Scholar] [CrossRef] [PubMed]
- Awada, H.; Durmaz, A.; Gurnari, C.; Kishtagari, A.; Meggendorfer, M.; Kerr, C.M.; Kuzmanovic, T.; Durrani, J.; Shreve, J.; Nagata, Y.; et al. Machine learning integrates genomic signatures for subclassification beyond primary and secondary acute myeloid leukemia. Blood J. Am. Soc. Hematol. 2021, 138, 1885–1895. [Google Scholar] [CrossRef] [PubMed]
- Dese, K.; Raj, H.; Ayana, G.; Yemane, T.; Adissu, W.; Krishnamoorthy, J.; Kwa, T. Accurate machine-learning-based classification of leukemia from blood smear images. Clin. Lymphoma Myeloma Leuk. 2021, 21, e903–e914. [Google Scholar] [CrossRef] [PubMed]
- Talaat, F.M.; Gamel, S.A. Machine learning in detection and classification of leukemia using C-NMC_Leukemia. Multimed. Tools Appl. 2024, 83, 8063–8076. [Google Scholar] [CrossRef]
- Nasimian, A.; Al Ashiri, L.; Ahmed, M.; Duan, H.; Zhang, X.; Rönnstrand, L.; Kazi, J.U. A Receptor Tyrosine Kinase Inhibitor Sensitivity Prediction Model Identifies AXL Dependency in Leukemia. Int. J. Mol. Sci. 2023, 24, 3830. [Google Scholar] [CrossRef] [PubMed]
- Janssen, A.P.; Grimm, S.H.; Wijdeven, R.H.; Lenselink, E.B.; Neefjes, J.; Van Boeckel, C.A.; Van Westen, G.J.; Van Der Stelt, M. Drug Discovery Maps, a Machine Learning Model That Visualizes and Predicts Kinome-Inhibitor Interaction Landscapes. J. Chem. Inf. Model. 2019, 59, 1221–1229. [Google Scholar] [CrossRef] [PubMed]
- Zhao, Y.; Tian, Y.; Pang, X.; Li, G.; Shi, S.; Yan, A. Classification of FLT3 inhibitors and SAR analysis by machine learning methods. Mol. Divers. 2023, 1, 1–17. [Google Scholar] [CrossRef] [PubMed]
- Eckardt, J.N.; Bornhäuser, M.; Wendt, K.; Middeke, J.M. Application of machine learning in the management of acute myeloid leukemia: Current practice and future prospects. Blood Adv. 2020, 4, 6077–6085. [Google Scholar] [CrossRef] [PubMed]
- Landrum, G. RDKit: Open-Source Cheminformatics 2022_9_5 (Q3 2022). Available online: https://zenodo.org/records/7671152 (accessed on 23 February 2023).
- Durant, J.L.; Leland, B.A.; Henry, D.R.; Nourse, J.G. Reoptimization of MDL keys for use in drug discovery. J. Chem. Inf. Comput. Sci. 2002, 42, 1273–1280. [Google Scholar] [CrossRef] [PubMed]
- Butina, D. Unsupervised data base clustering based on daylight’s fingerprint and Tanimoto similarity: A fast and automated way to cluster small and large data sets. J. Chem. Inf. Comput. Sci. 1999, 39, 747–750. [Google Scholar] [CrossRef]
- Marino, S.; Zhao, Y.; Zhou, N.; Zhou, Y.; Toga, A.W.; Zhao, L.; Jian, Y.; Yang, Y.; Chen, Y.; Wu, Q.; et al. Compressive Big Data Analytics: An ensemble meta-algorithm for high-dimensional multisource datasets. PLoS ONE 2020, 15, e0228520. [Google Scholar] [CrossRef]
- Hall, L.H.; Kier, L.B. Electrotopological State Indices for Atom Types: A Novel Combination of Electronic, Topological, and Valence State Information. J. Chem. Inf. Comput. Sci. 1995, 35, 1039–1045. [Google Scholar] [CrossRef]
- Euldji, I.; Si-Moussa, C.; Hamadache, M.; Benkortbi, O. QSPR Modelling of the Solubility of Drug and Drug-like Compounds in Supercritical Carbon Dioxide. Mol. Inform. 2022, 41, 2200026. [Google Scholar] [CrossRef] [PubMed]
- Platts, J.A.; Butina, D.; Abraham, M.H.; Hersey, A. Estimation of molecular linear free energy relation descriptors using a group contribution approach. J. Chem. Inf. Comput. Sci. 1999, 39, 835–845. [Google Scholar] [CrossRef]
- Lin, C.; Xiaoxiao, Z. Optimizing Drug Screening with Machine Learning. In Proceedings of the 2022 19th International Computer Conference on Wavelet Active Media Technology and Information Processing, ICCWAMTIP 2022, Chengdu, China, 16–18 December 2022. [Google Scholar] [CrossRef]
- Ibrahim, Z.Y.; Uzairu, A.; Shallangwa, G.; Abechi, S. QSAR and molecular docking based design of some indolyl-3-ethanone-α-thioethers derivatives as Plasmodium falciparum dihydroorotate dehydrogenase (PfDHODH) inhibitors. SN Appl. Sci. 2020, 2, 1–12. [Google Scholar] [CrossRef]
- Lee, L.Y.; Hernandez, D.; Rajkhowa, T.; Smith, S.C.; Raman, J.R.; Nguyen, B.; Small, D.; Levis, M. Preclinical studies of gilteritinib, a next-generation FLT3 inhibitor. Blood 2017, 129, 257–260. [Google Scholar] [CrossRef]
- Shimada, I.; Kurosawa, K.; Matsuya, T.; Iikubo, K.; Kondoh, Y.; Kamikawa, A.; Tomiyama, H.; Iwai, Y. Patent US8969336. 2015. Available online: https://patents.google.com/patent/US8969336B2 (accessed on 25 April 2024).
- Kim, S.; Chen, J.; Cheng, T.; Gindulyte, A.; He, J.; He, S.; Li, Q.; Shoemaker, B.A.; Thiessen, P.A.; Yu, B.; et al. PubChem 2023 update. Nucleic Acids Res. 2023, 51, D1373–D1380. [Google Scholar] [CrossRef]
- PubChem Database. Available online: https://pubchem.ncbi.nlm.nih.gov (accessed on 28 November 2023).
- Kenneth Reitz. Requests: HTTP for Humans™ — Requests 2.26.0 Documentation. 2021. Available online: https://docs.python-requests.org/en/latest/ (accessed on 7 February 2024).
- McKinney, W.; Team, P.D. Pandas—Powerful Python Data Analysis Toolkit. 2015. Available online: https://pandas.pydata.org (accessed on 7 February 2024).
- Pedregosa, F.; Varoquaux, G.; Gramfort, A.; Michel, V.; Thirion, B.; Grisel, O.; Blondel, O.; Blondel, M.; Prettenhofer, P.; Weiss, R.; et al. Scikit-learn: Machine Learning in Python. J. Mach. Learn. Res. 2011, 12, 2825–2830. [Google Scholar]
- Yap, C.W. PaDEL-descriptor: An open source software to calculate molecular descriptors and fingerprints. J. Comput. Chem. 2011, 32, 1466–1474. [Google Scholar] [CrossRef] [PubMed]
- Breiman, L. Random forests. Mach. Learn. 2001, 45, 5–32. [Google Scholar] [CrossRef]
- Friedman, J.H. Greedy function approximation: A gradient boosting machine. Ann. Stat. 2001, 29, 1189–1232. [Google Scholar] [CrossRef]
- Hearst, M.A.; Dumais, S.T.; Osuna, E.; Platt, J.; Scholkopf, B. Support vector machines. IEEE Intell. Syst. Their Appl. 1998, 13, 18–28. [Google Scholar] [CrossRef]
- Williams, C.K.; Rasmussen, C.E. Gaussian Processes for Machine Learning; MIT Press: Cambridge, MA, USA, 2006; Volume 2, p. 3. [Google Scholar]
- Altman, N.; Krzywinski, M. Ensemble methods: Bagging and random forests. Nat. Pubchemds 2017, 14, 933–935. [Google Scholar] [CrossRef]
- Chollet, F. Keras, 2015. In: Github Repos. Available online: https://github.com/fchollet/keras (accessed on 15 September 2023).
- Paszke, A.; Gross, S.; Massa, F.; Lerer, A.; Bradbury, J.; Chanan, G.; Killeen, T.; Lin, Z.; Gimelshein, N.; Antiga, L.; et al. Pytorch: An imperative style, high-performance deep learning library. Adv. Neural Inf. Process. Syst. 2019, 32, 8026–8037. [Google Scholar]
- Bajusz, D.; Rácz, A.; Héberger, K. Why is Tanimoto index an appropriate choice for fingerprint-based similarity calculations? J. Cheminform. 2015, 7, 1–13. [Google Scholar] [CrossRef] [PubMed]
- PubChem Substructure Fingerprint. Available online: https://pubchem.ncbi.nlm.nih.gov/docs/data-specification (accessed on 10 December 2023).

| Metric and ML | RFR | GBR | KRR | GPR | BRF | ANN-K | ANN-P |
|---|---|---|---|---|---|---|---|
| R2 training | 0.988 | 0.973 | 0.546 | 0.641 | 0.967 | 0.988 | 0.983 |
| MAE training | 0.082 | 0.126 | 0.489 | 0.469 | 0.136 | 0.070 | 0.082 |
| SD training | 0.102 | 0.154 | 0.638 | 0.526 | 0.172 | 0.101 | 0.121 |
| RMSE training | 0.102 | 0.154 | 0.638 | 0.568 | 0.172 | 0.103 | 0.123 |
| R2 test | 0.936 | 0.939 | 0.592 | −0.228 | 0.931 | 0.907 | 0.895 |
| MAE test | 0.197 | 0.195 | 0.484 | 0.876 | 0.207 | 0.235 | 0.248 |
| SD test | 0.246 | 0.237 | 0.619 | 0.932 | 0.255 | 0.296 | 0.313 |
| RMSE test | 0.246 | 0.239 | 0.620 | 1.076 | 0.256 | 0.297 | 0.315 |
| Training Set | Test Set | |
|---|---|---|
| Size | 1080 | 270 |
| R2 | 0.989 | 0.941 |
| MAE | 0.081 | 0.193 |
| SD | 0.101 | 0.237 |
| RMSE | 0.101 | 0.238 |
| 0.926 | ||
| 0.922 | ||
| Kar a | Shiha a | Abutayeha a | Bhujbala a | Fernandesa a | Ghosha a | This | |
|---|---|---|---|---|---|---|---|
| (2012) | (2012) | (2019) | (2020) | (2020) | (2021) | Work | |
| Dataset size | 67 | 72 | 93 | 63 | 40 | 40 | 1350 |
| Train set size | 51 | 25 | 76 | 45 | 28 | 30 | 1080 |
| Test set size | 16 | 47 | 17 | 18 | 12 | 10 | 270 |
| R2 training | 0.956 | 0.98 | 0.86 | 0.956 | 0.80 | 0.983 | 0.989 |
| R2 test | 0.891 | 0.76 | 0.57 | 0.707 | 0.80 | 0.698 | 0.941 |
| SD test | 0.435 | 0.66 | - | >0.895 | 0.31 | 0.452 | 0.237 |
| 0.747 | 0.58 | 0.65 | 0.57 | 0.60 | 0.802 | 0.926 |
| Priority | Descriptor | Name | Description |
|---|---|---|---|
| 1° | SHBdb [32,33] | Sum of E-states for (strong) hydrogen bond donors | The value is calculated as the sum of each atom capable of donating a hydrogen atom, weighted by its electronic environment and topological position (E-state). |
| 2° | MLFER_S [33,34] | Molecular linear free energy relation_S | Cumulative sum of the free energy contributions of the solvatophilic groups in a molecule, calculated using previously established empirical values for their interactions with solvents. |
| 3° | nBase | Number of basic groups | Number of basic groups in the molecule, especially nitrogenous groups. |
| 4° | MaxsssN [32,35] | Maximum atom-type E-state: > N- | Maximum electrotopological state present in nitrogen atoms with three single bonds. |
| 5° | MLFER_BH [34,36] | Overall or summation solute hydrogen bond basicity | Total hydrogen bond basicity in a molecule calculated by summing the contributions of all possible hydrogen bond acceptor sites in the molecule. |
| IUPAC Name | Structure | pIC50 |
|---|---|---|
| 6-Ethyl-3-[3-methoxy-4-[4-(1-methylpiperidin-4-yl)piperazin-1-yl]anilino]-5-(oxan-4-ylamino)pyrazine-2-carboxamide |  | 9.34 |
| 6-Ethyl-3-[3-methoxy-4-[4-(4-propan-2-ylpiperazin-1-yl) piperidin-1-yl]anilino]-5-(oxan-4-ylamino)pyrazine-2-carboxamide |  | 9.34 |
| 3-[4-[4-(1-Methylpiperidin-4-yl)piperazin-1-yl]anilino]-5-(oxan-4-ylamino)-6-propan-2-ylpyrazine-2-carboxamide | 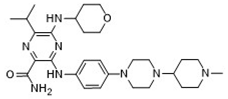 | 9.29 |
| 6-(1-Methyl-3,6-dihydro-2H-pyridin-4-yl)-3-[4-[4-(4-methylpiperazin-1-yl)piperidin-1-yl]anilino]-5-(oxan-4-ylamino)pyrazine-2-carboxamide |  | 9.27 |
| 6-Ethyl-3-[4-[4-(4-methylpiperazin-1-yl)piperidin-1-yl]-3-propan-2-yloxyanilino]-5-(oxan-4-ylamino)pyrazine-2-carboxamide | 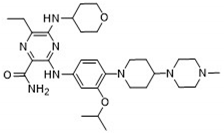 | 9.27 |
Disclaimer/Publisher’s Note: The statements, opinions and data contained in all publications are solely those of the individual author(s) and contributor(s) and not of MDPI and/or the editor(s). MDPI and/or the editor(s) disclaim responsibility for any injury to people or property resulting from any ideas, methods, instructions or products referred to in the content. |
© 2025 by the authors. Licensee MDPI, Basel, Switzerland. This article is an open access article distributed under the terms and conditions of the Creative Commons Attribution (CC BY) license (https://creativecommons.org/licenses/by/4.0/).
Share and Cite
Alcázar, J.J.; Sánchez, I.; Merino, C.; Monasterio, B.; Sajuria, G.; Miranda, D.; Díaz, F.; Campodónico, P.R. A Simple Machine Learning-Based Quantitative Structure–Activity Relationship Model for Predicting pIC50 Inhibition Values of FLT3 Tyrosine Kinase. Pharmaceuticals 2025, 18, 96. https://doi.org/10.3390/ph18010096
Alcázar JJ, Sánchez I, Merino C, Monasterio B, Sajuria G, Miranda D, Díaz F, Campodónico PR. A Simple Machine Learning-Based Quantitative Structure–Activity Relationship Model for Predicting pIC50 Inhibition Values of FLT3 Tyrosine Kinase. Pharmaceuticals. 2025; 18(1):96. https://doi.org/10.3390/ph18010096
Chicago/Turabian StyleAlcázar, Jackson J., Ignacio Sánchez, Cristian Merino, Bruno Monasterio, Gaspar Sajuria, Diego Miranda, Felipe Díaz, and Paola R. Campodónico. 2025. "A Simple Machine Learning-Based Quantitative Structure–Activity Relationship Model for Predicting pIC50 Inhibition Values of FLT3 Tyrosine Kinase" Pharmaceuticals 18, no. 1: 96. https://doi.org/10.3390/ph18010096
APA StyleAlcázar, J. J., Sánchez, I., Merino, C., Monasterio, B., Sajuria, G., Miranda, D., Díaz, F., & Campodónico, P. R. (2025). A Simple Machine Learning-Based Quantitative Structure–Activity Relationship Model for Predicting pIC50 Inhibition Values of FLT3 Tyrosine Kinase. Pharmaceuticals, 18(1), 96. https://doi.org/10.3390/ph18010096