
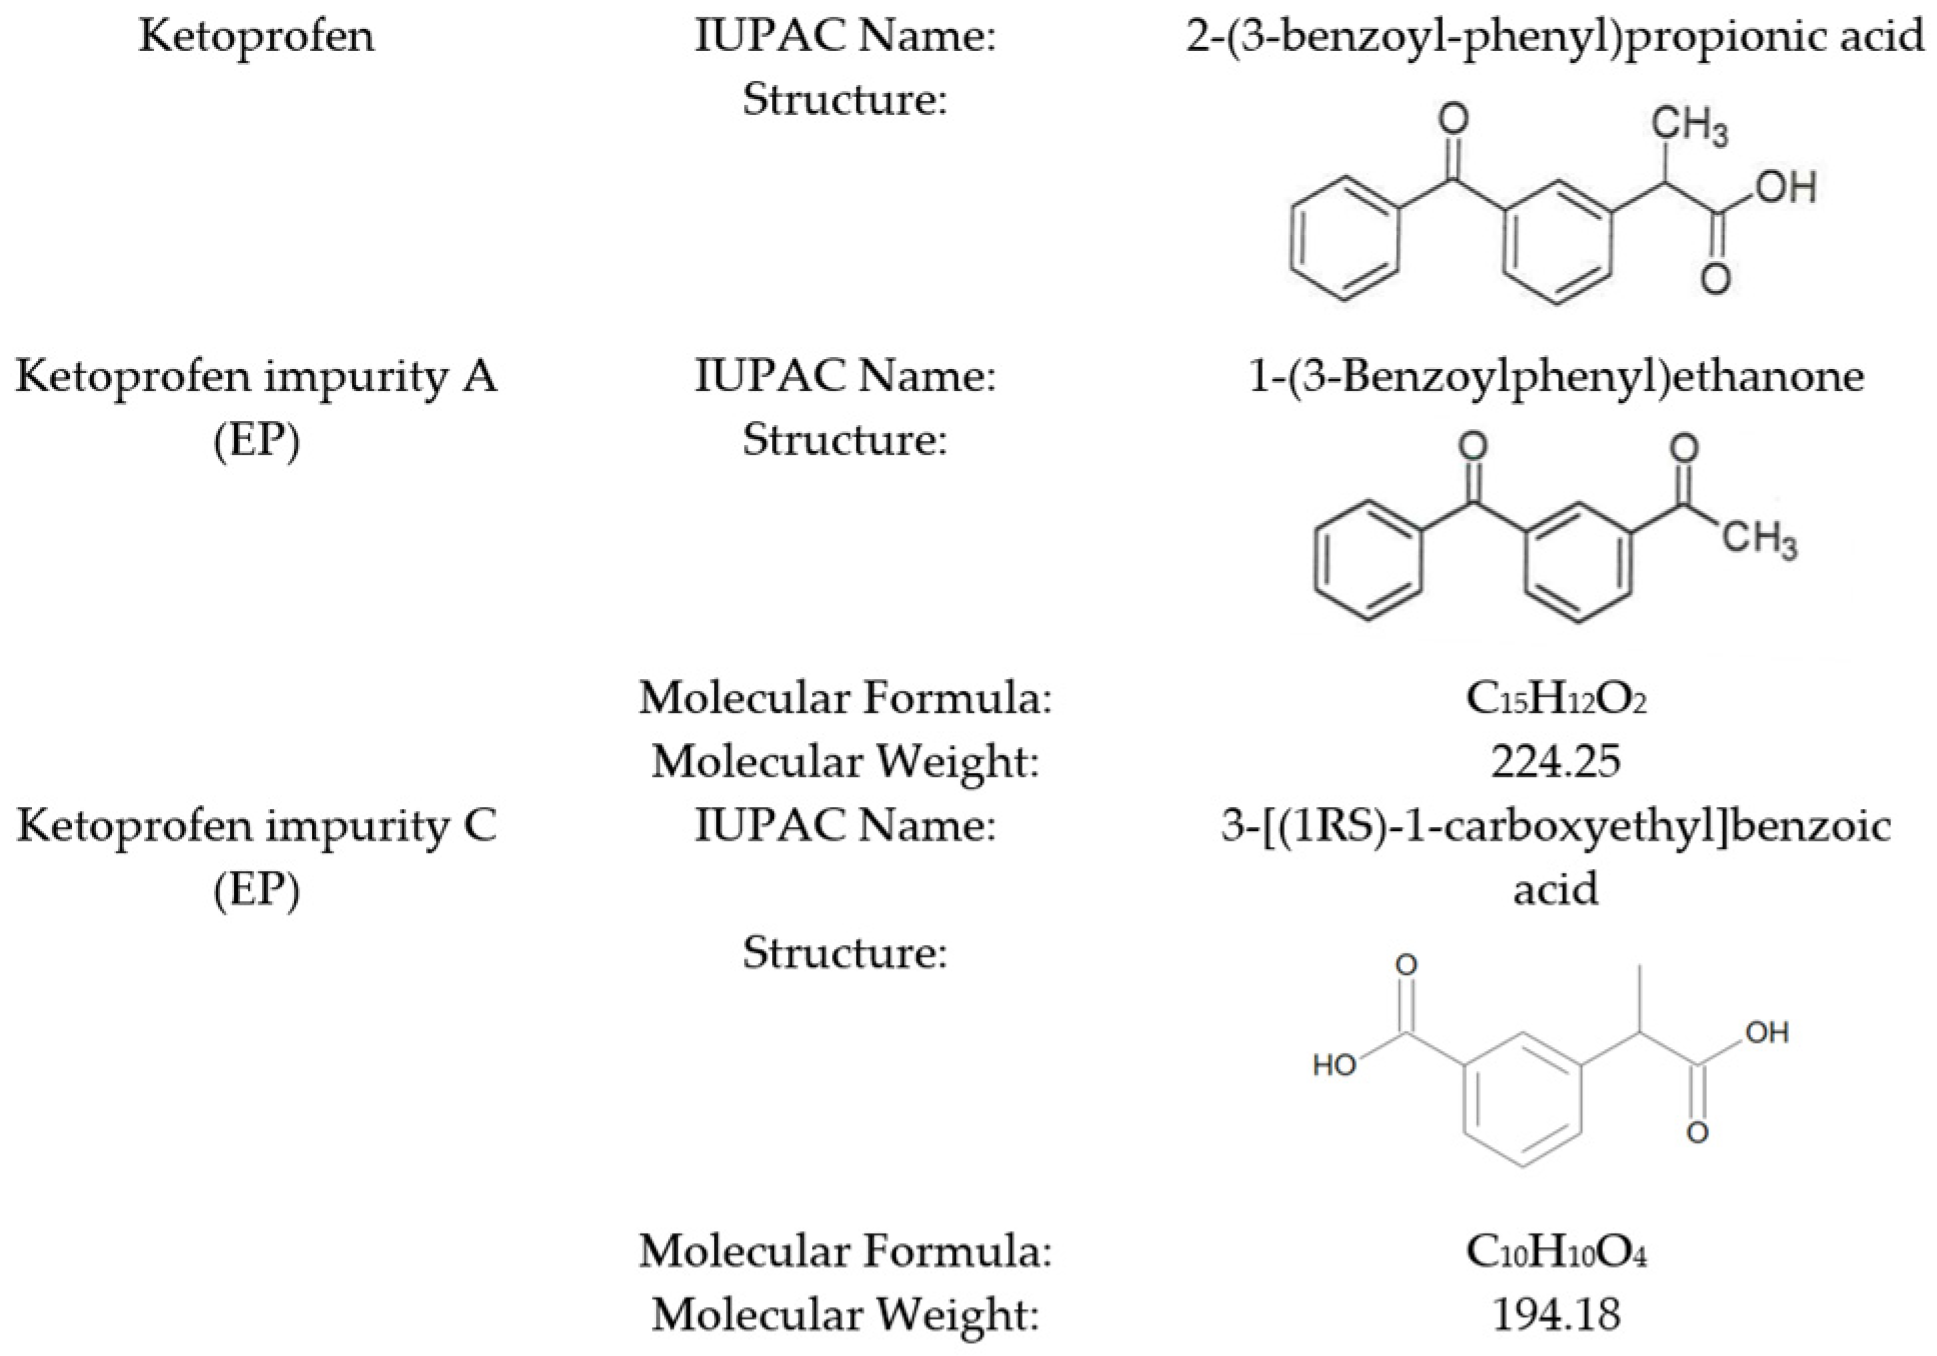
Development of Ketoprofen Impurity A (1-(3-Benzoylphenyl)ethanone) as a Certified Reference Material for Pharmaceutical Quality Control

 ,
,
Abstract
1. Introduction
2. Results and Discussion
2.1. Selection of the Method for Obtaining the Material
- -
- Availability of raw materials;
- -
- Economic efficiency;
- -
- The smallest number of stages of production;
- -
- The highest purity of the RM material.
- -
- Organic synthesis;
- -
- Enrichment of APIs or other products with an appropriate impurity;
- -
- Separation of the impurity from the API or other product.
2.2. Purification
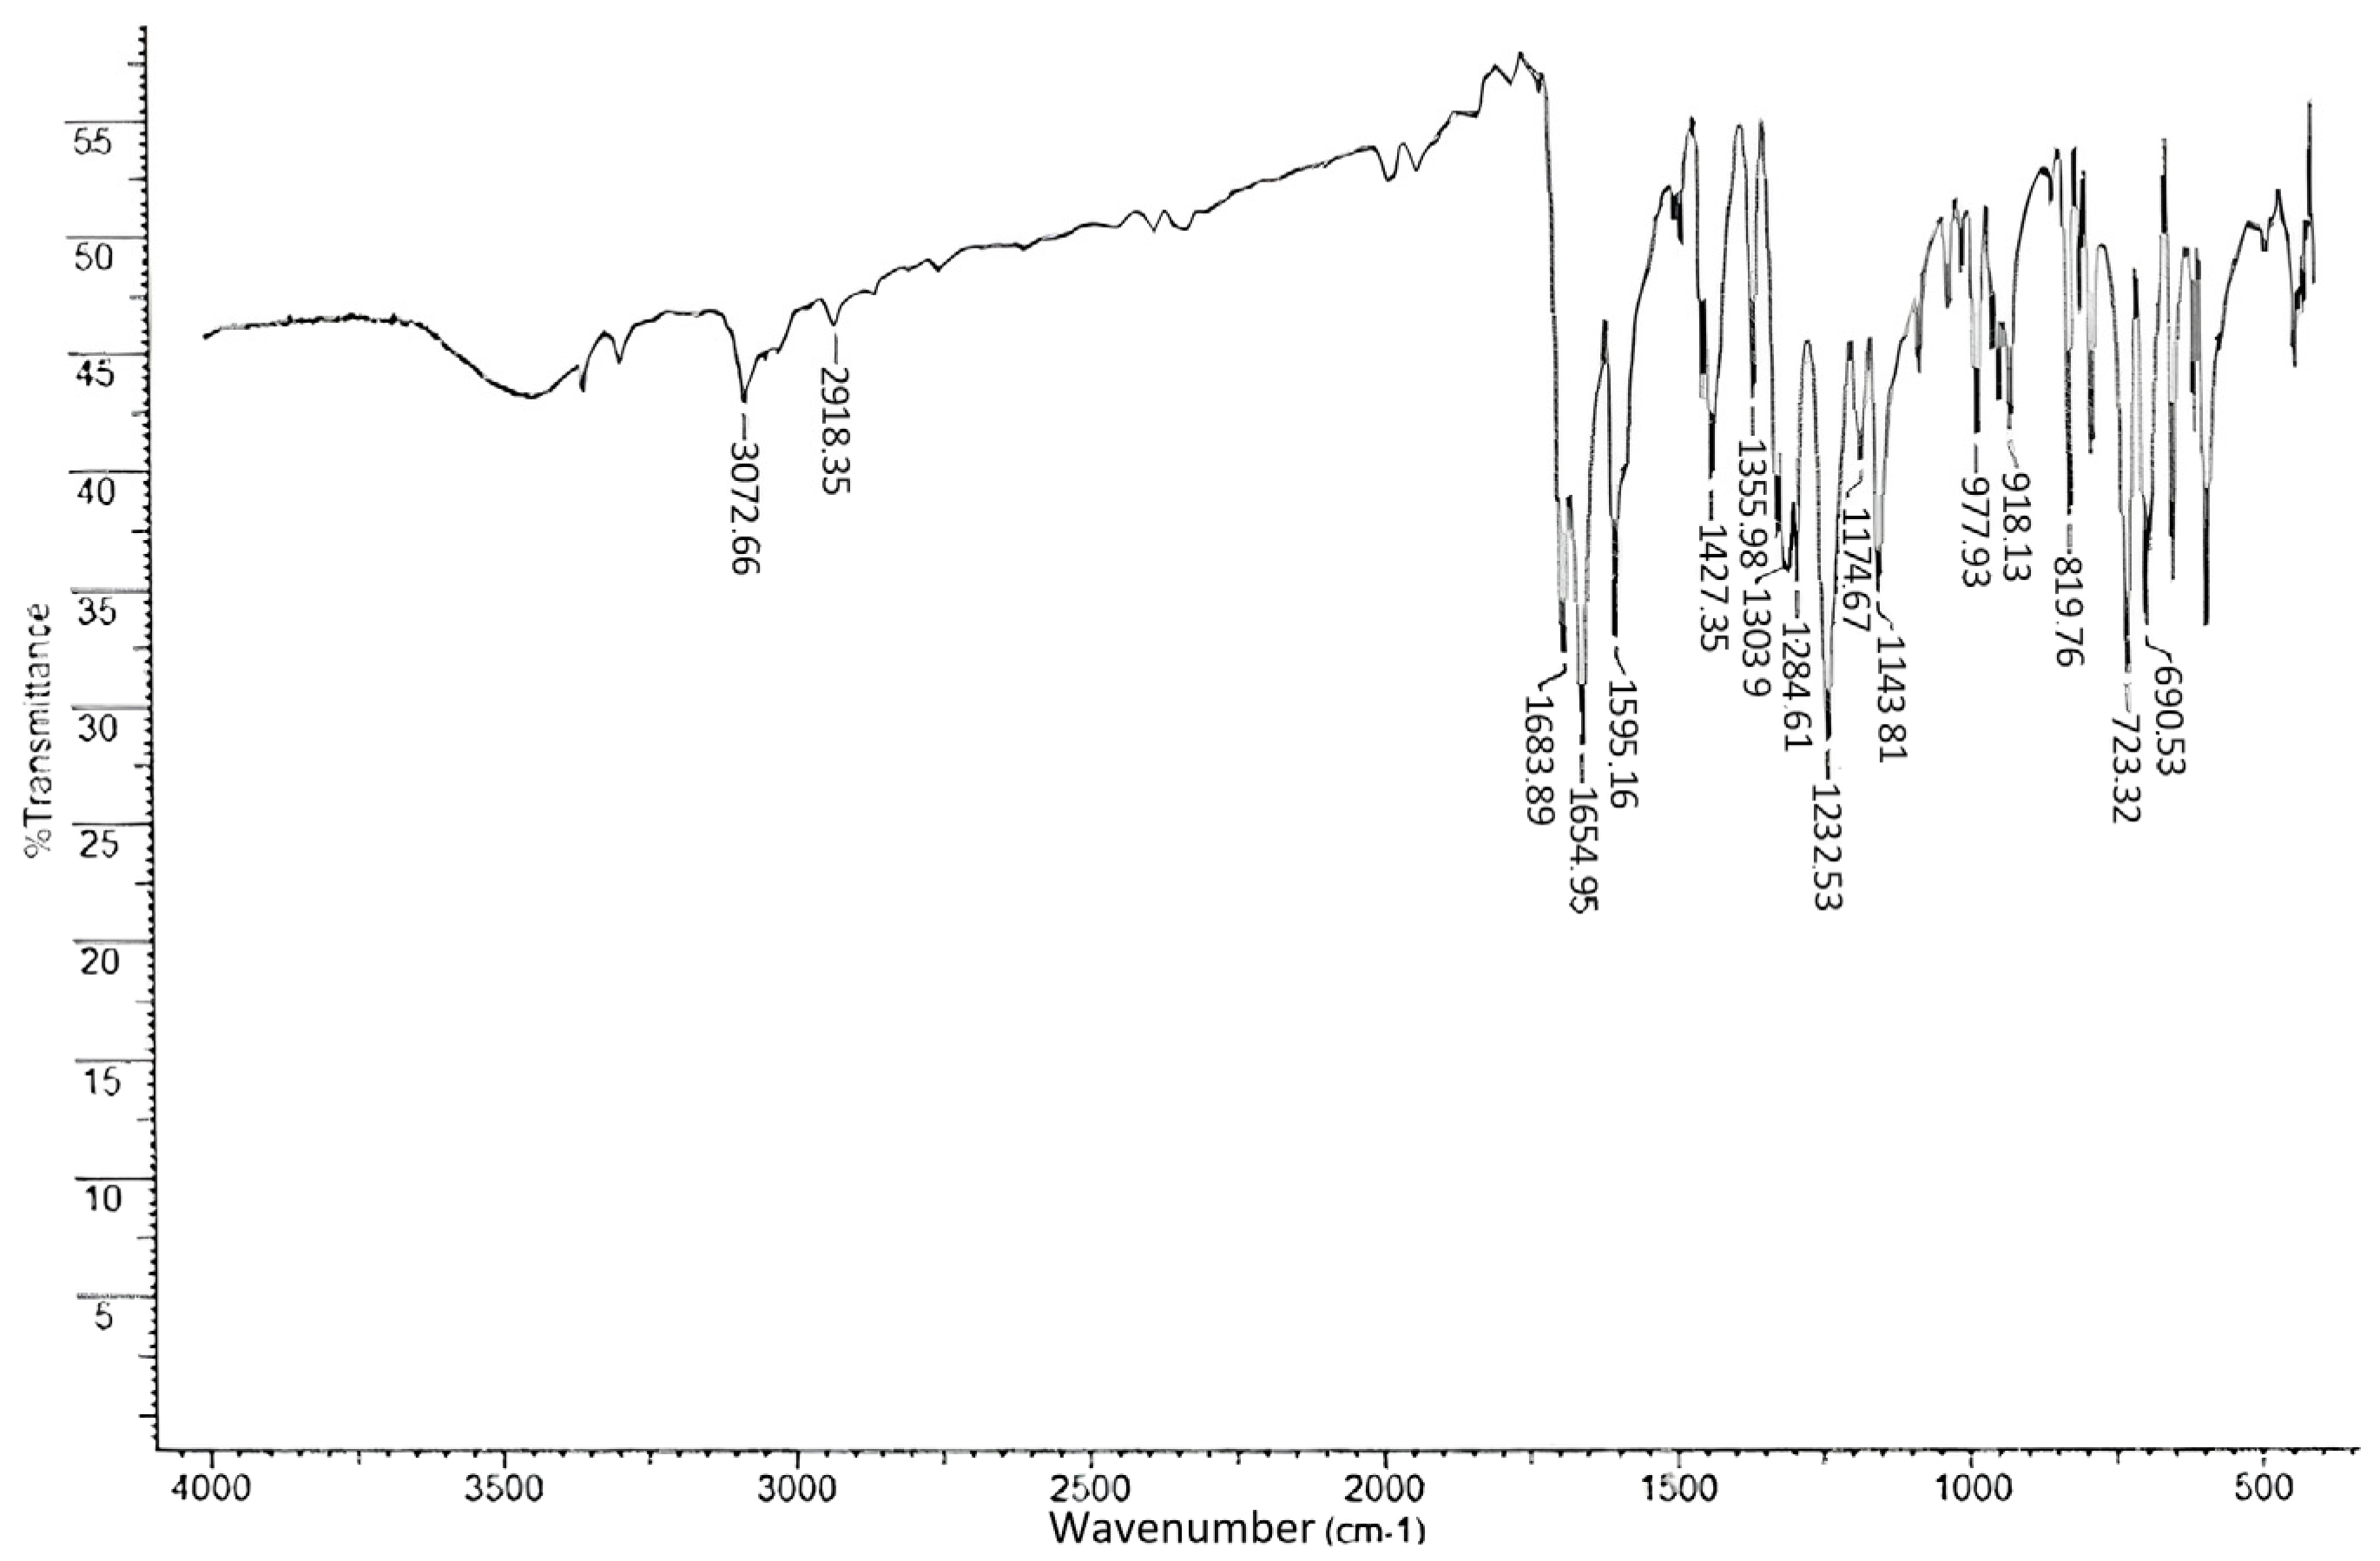
2.3. IR
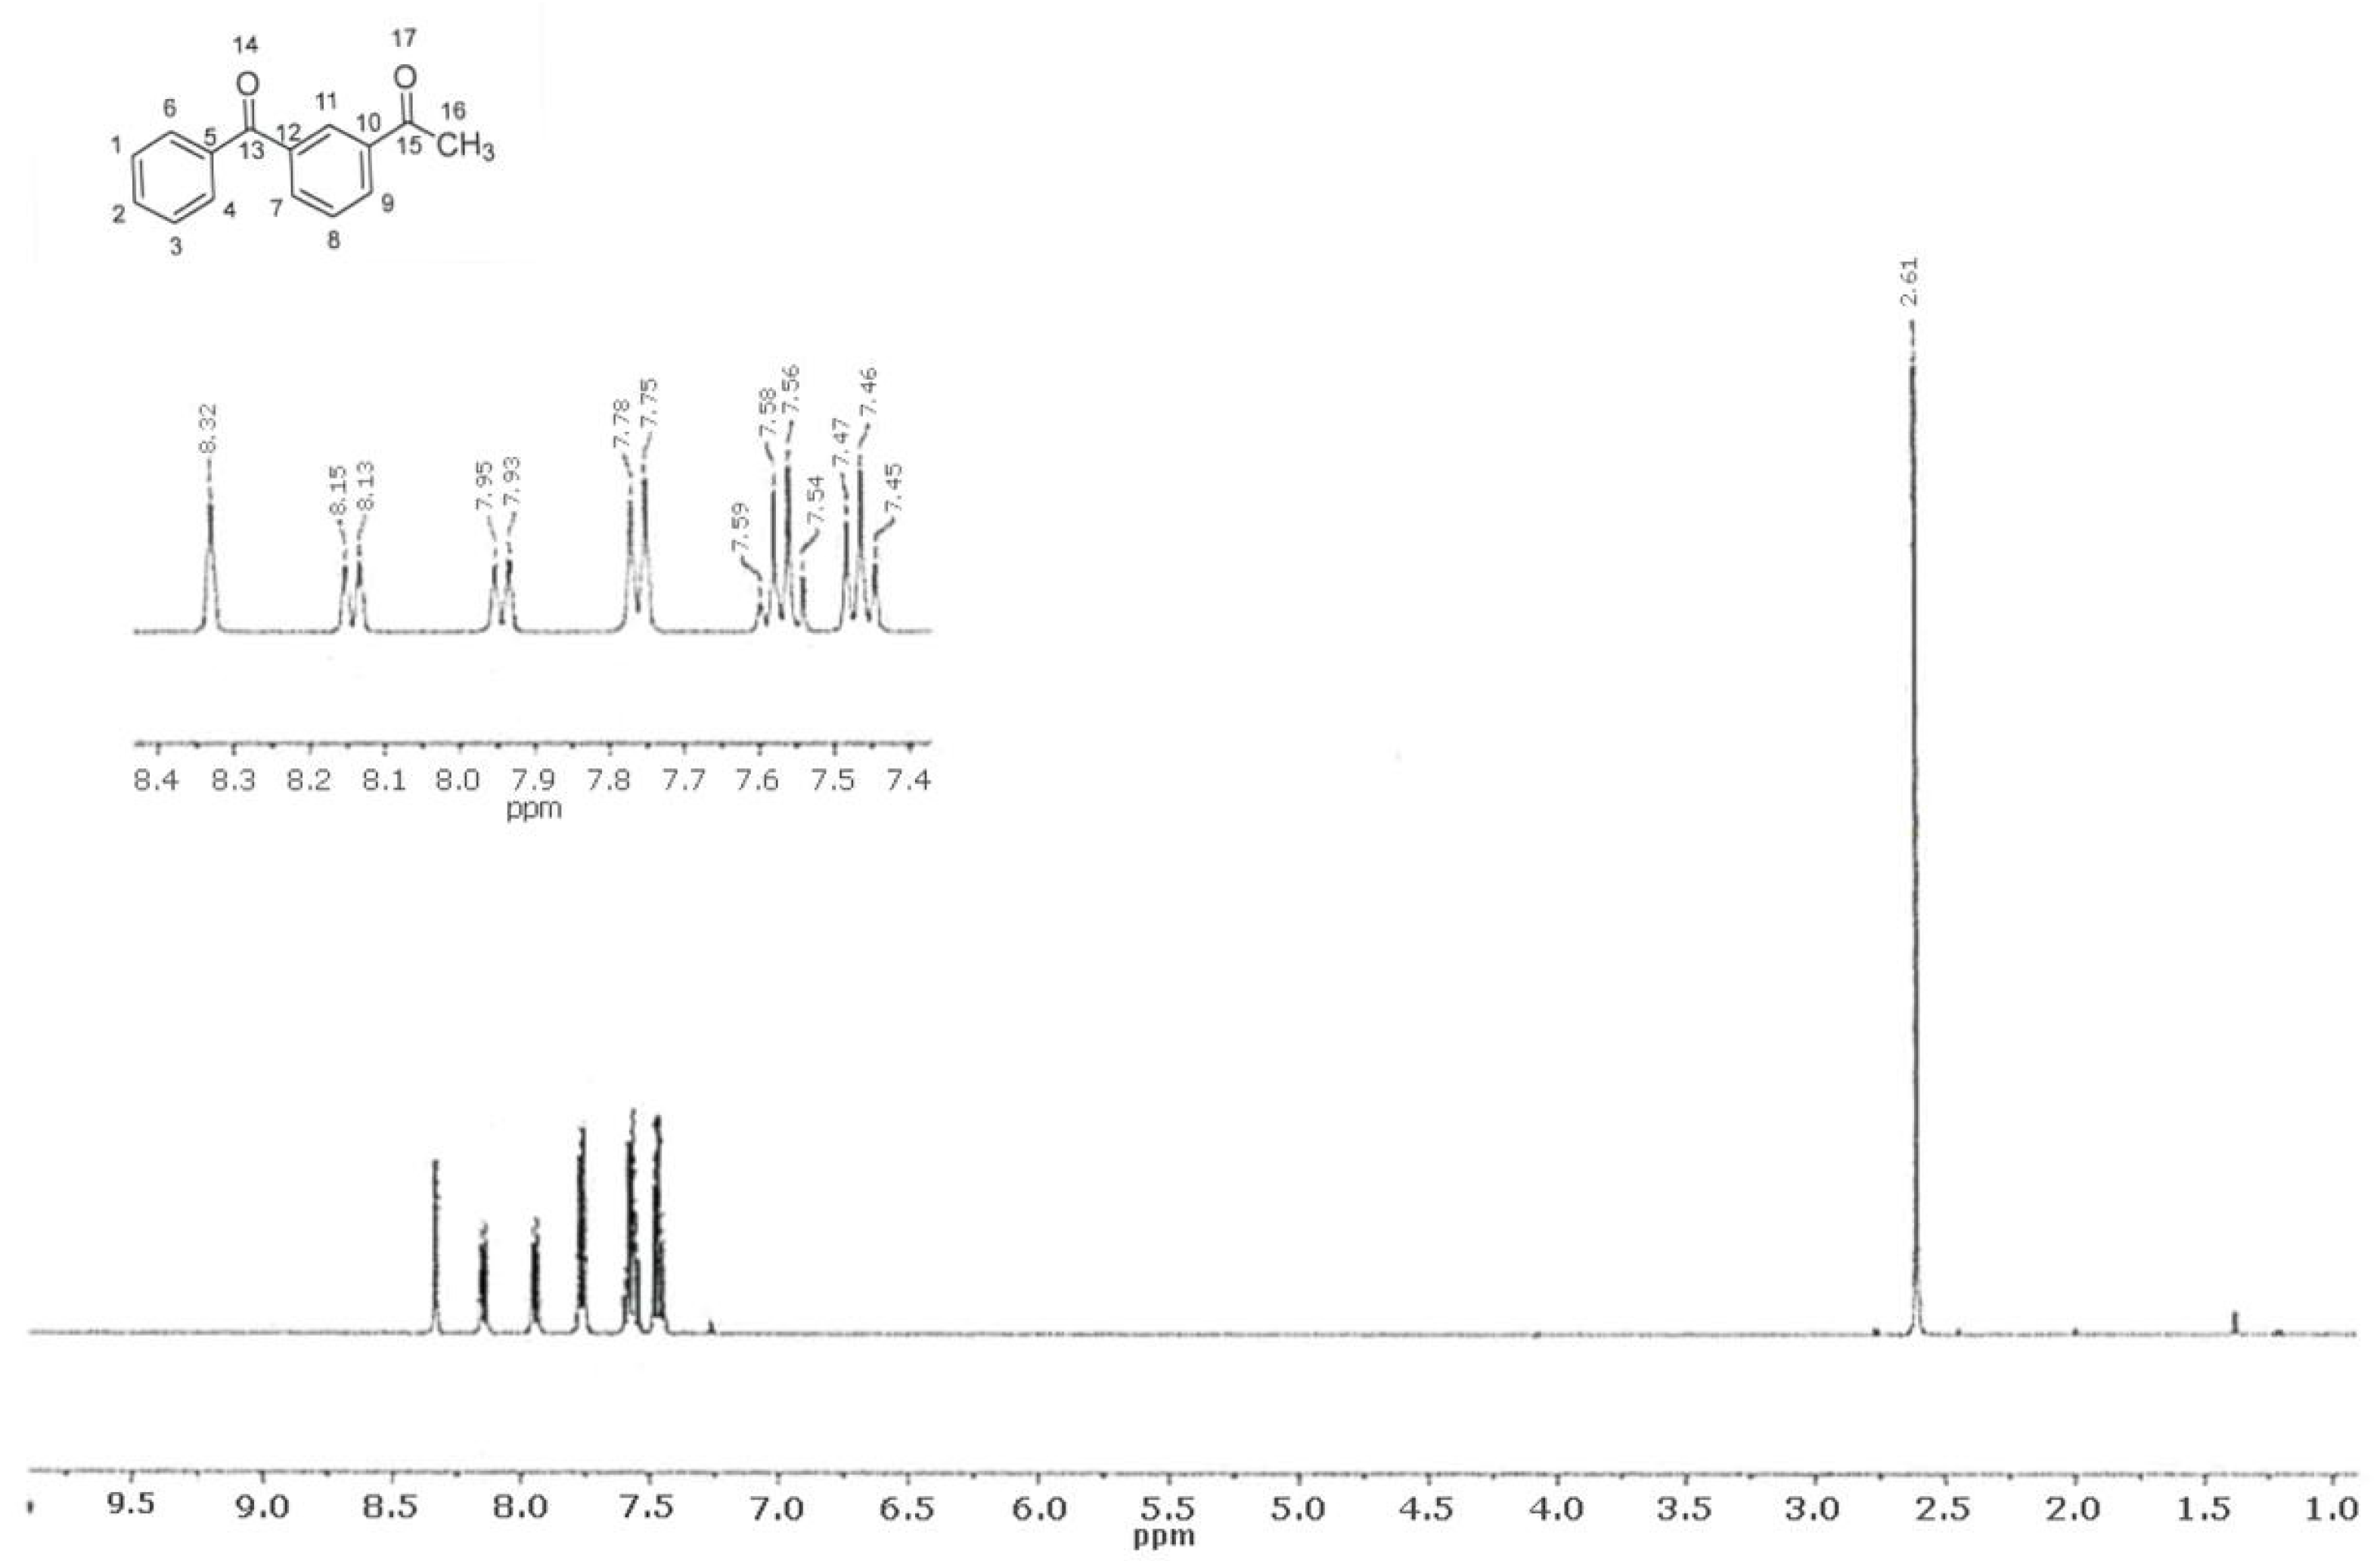
2.4. 1H NMR Spectroscopy
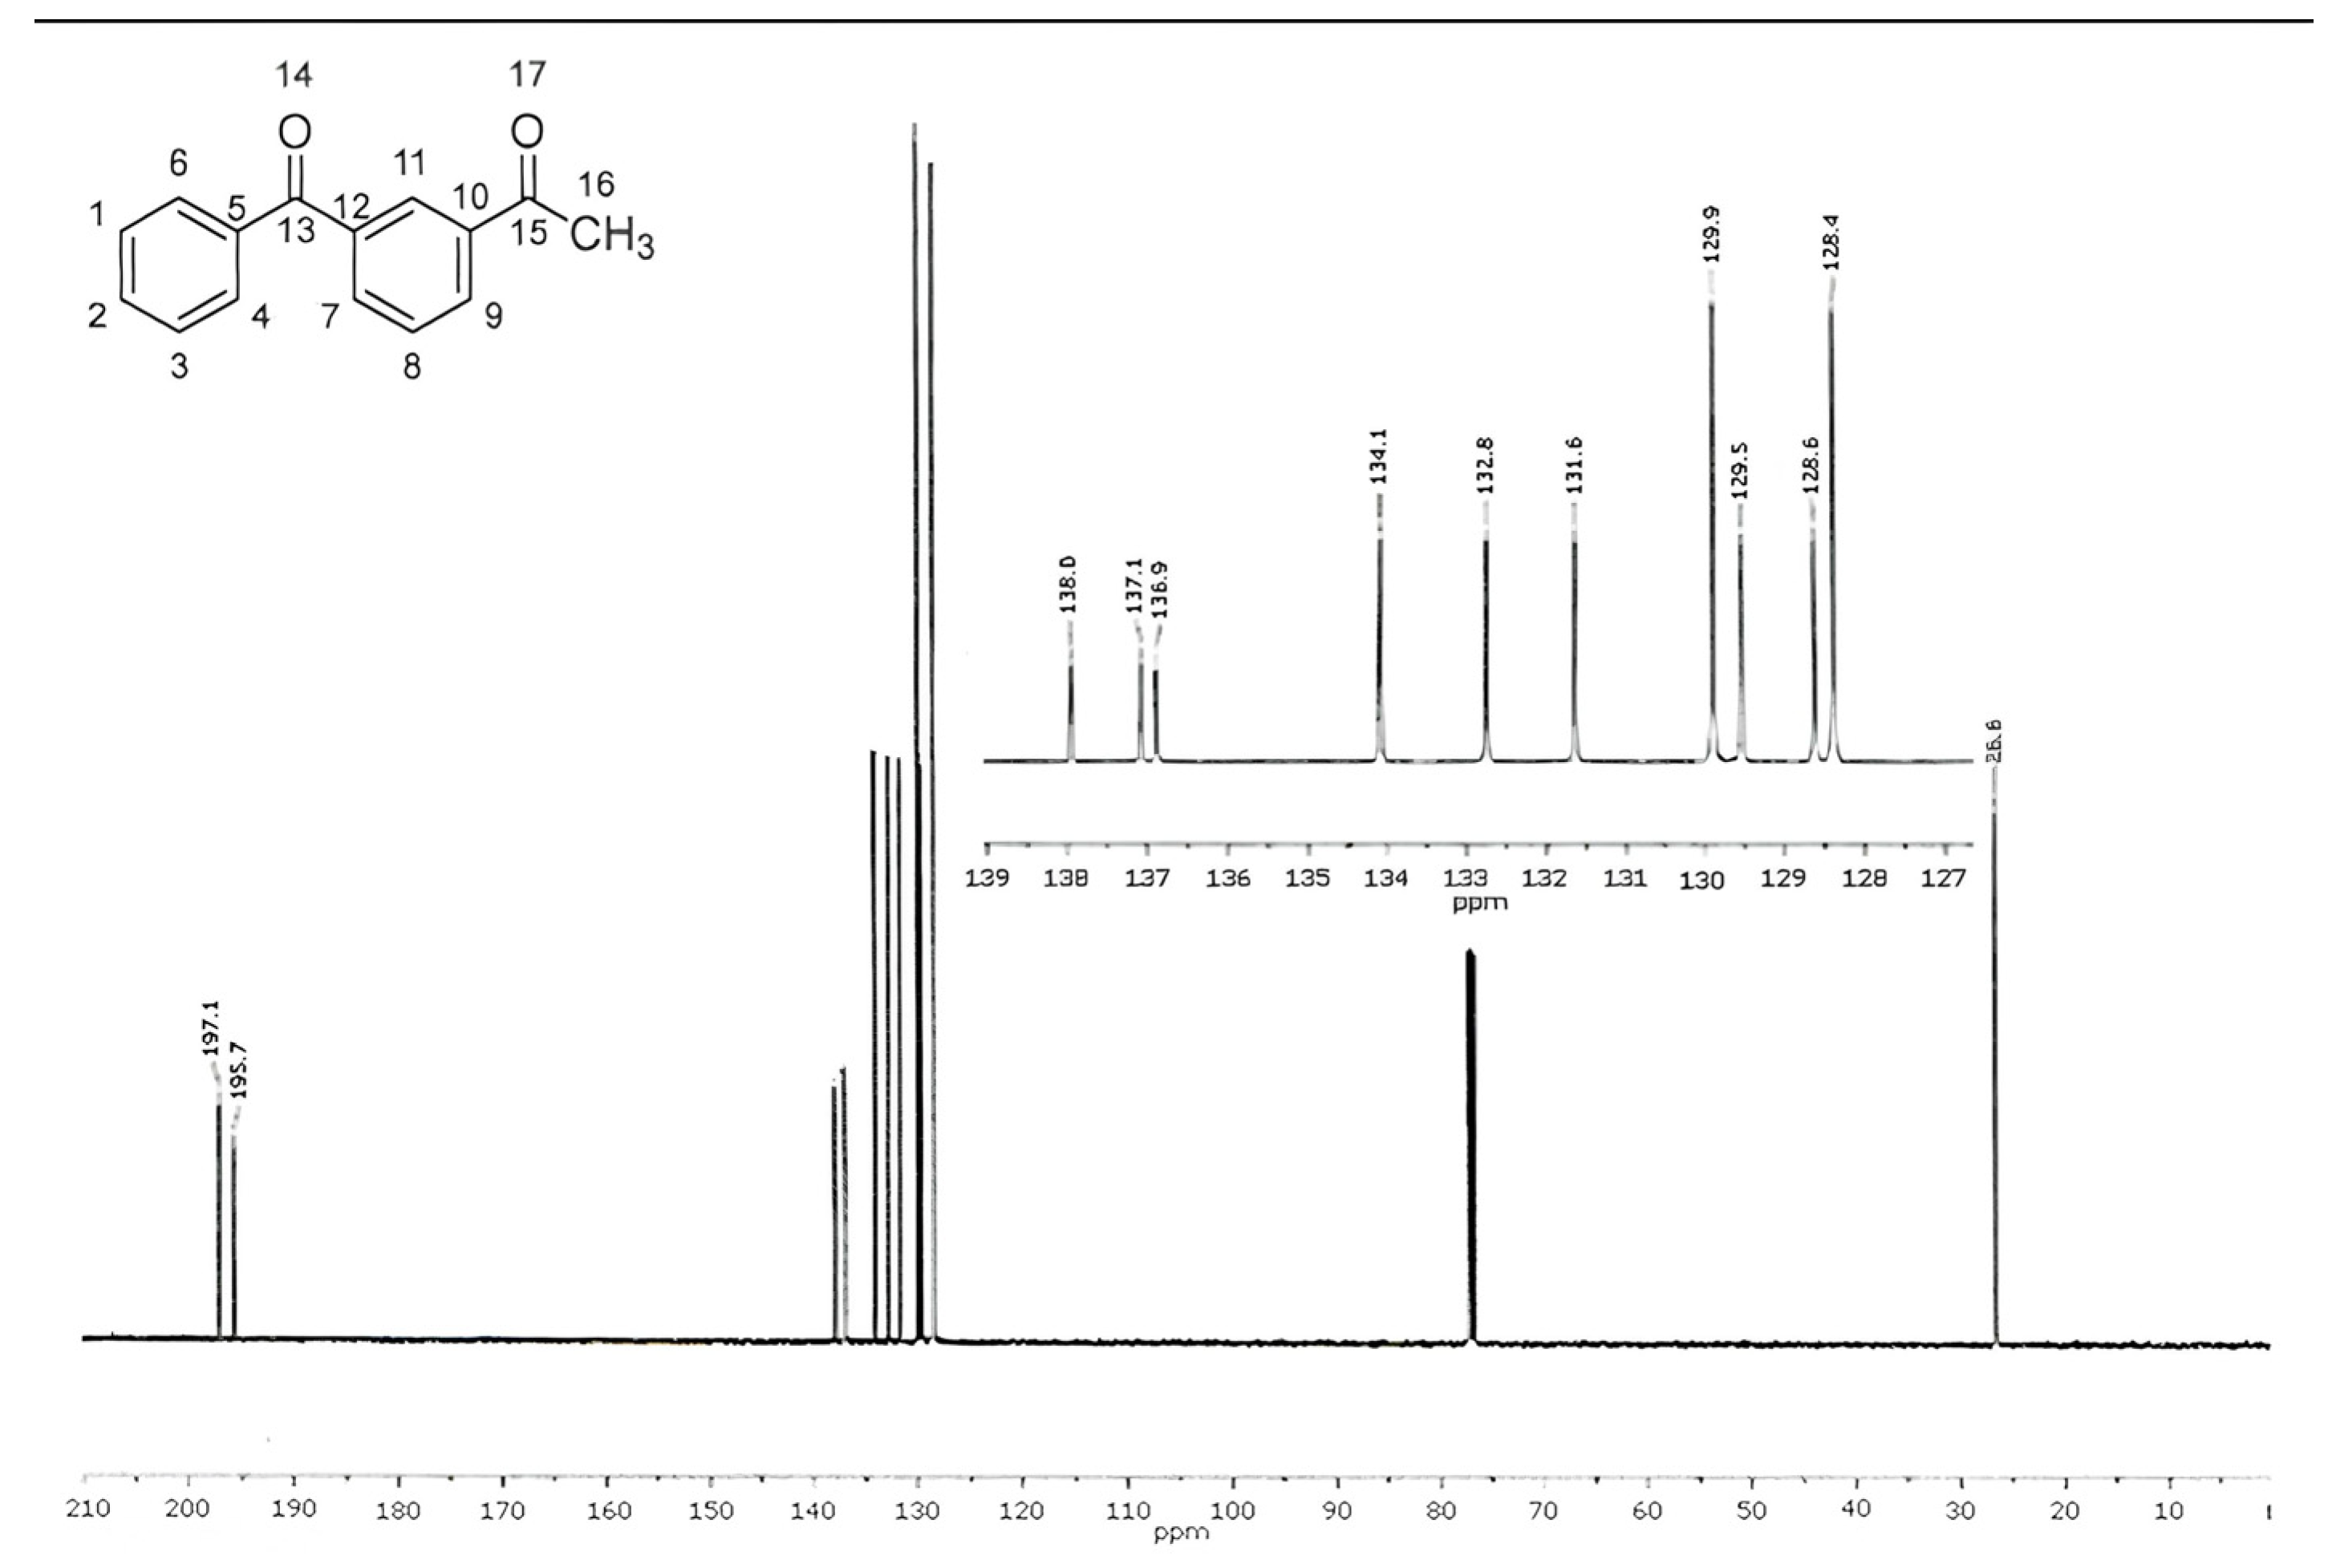
2.5. 13C NMR Spectroscopy
2.6. Mass Spectrometry
3. Materials and Methods
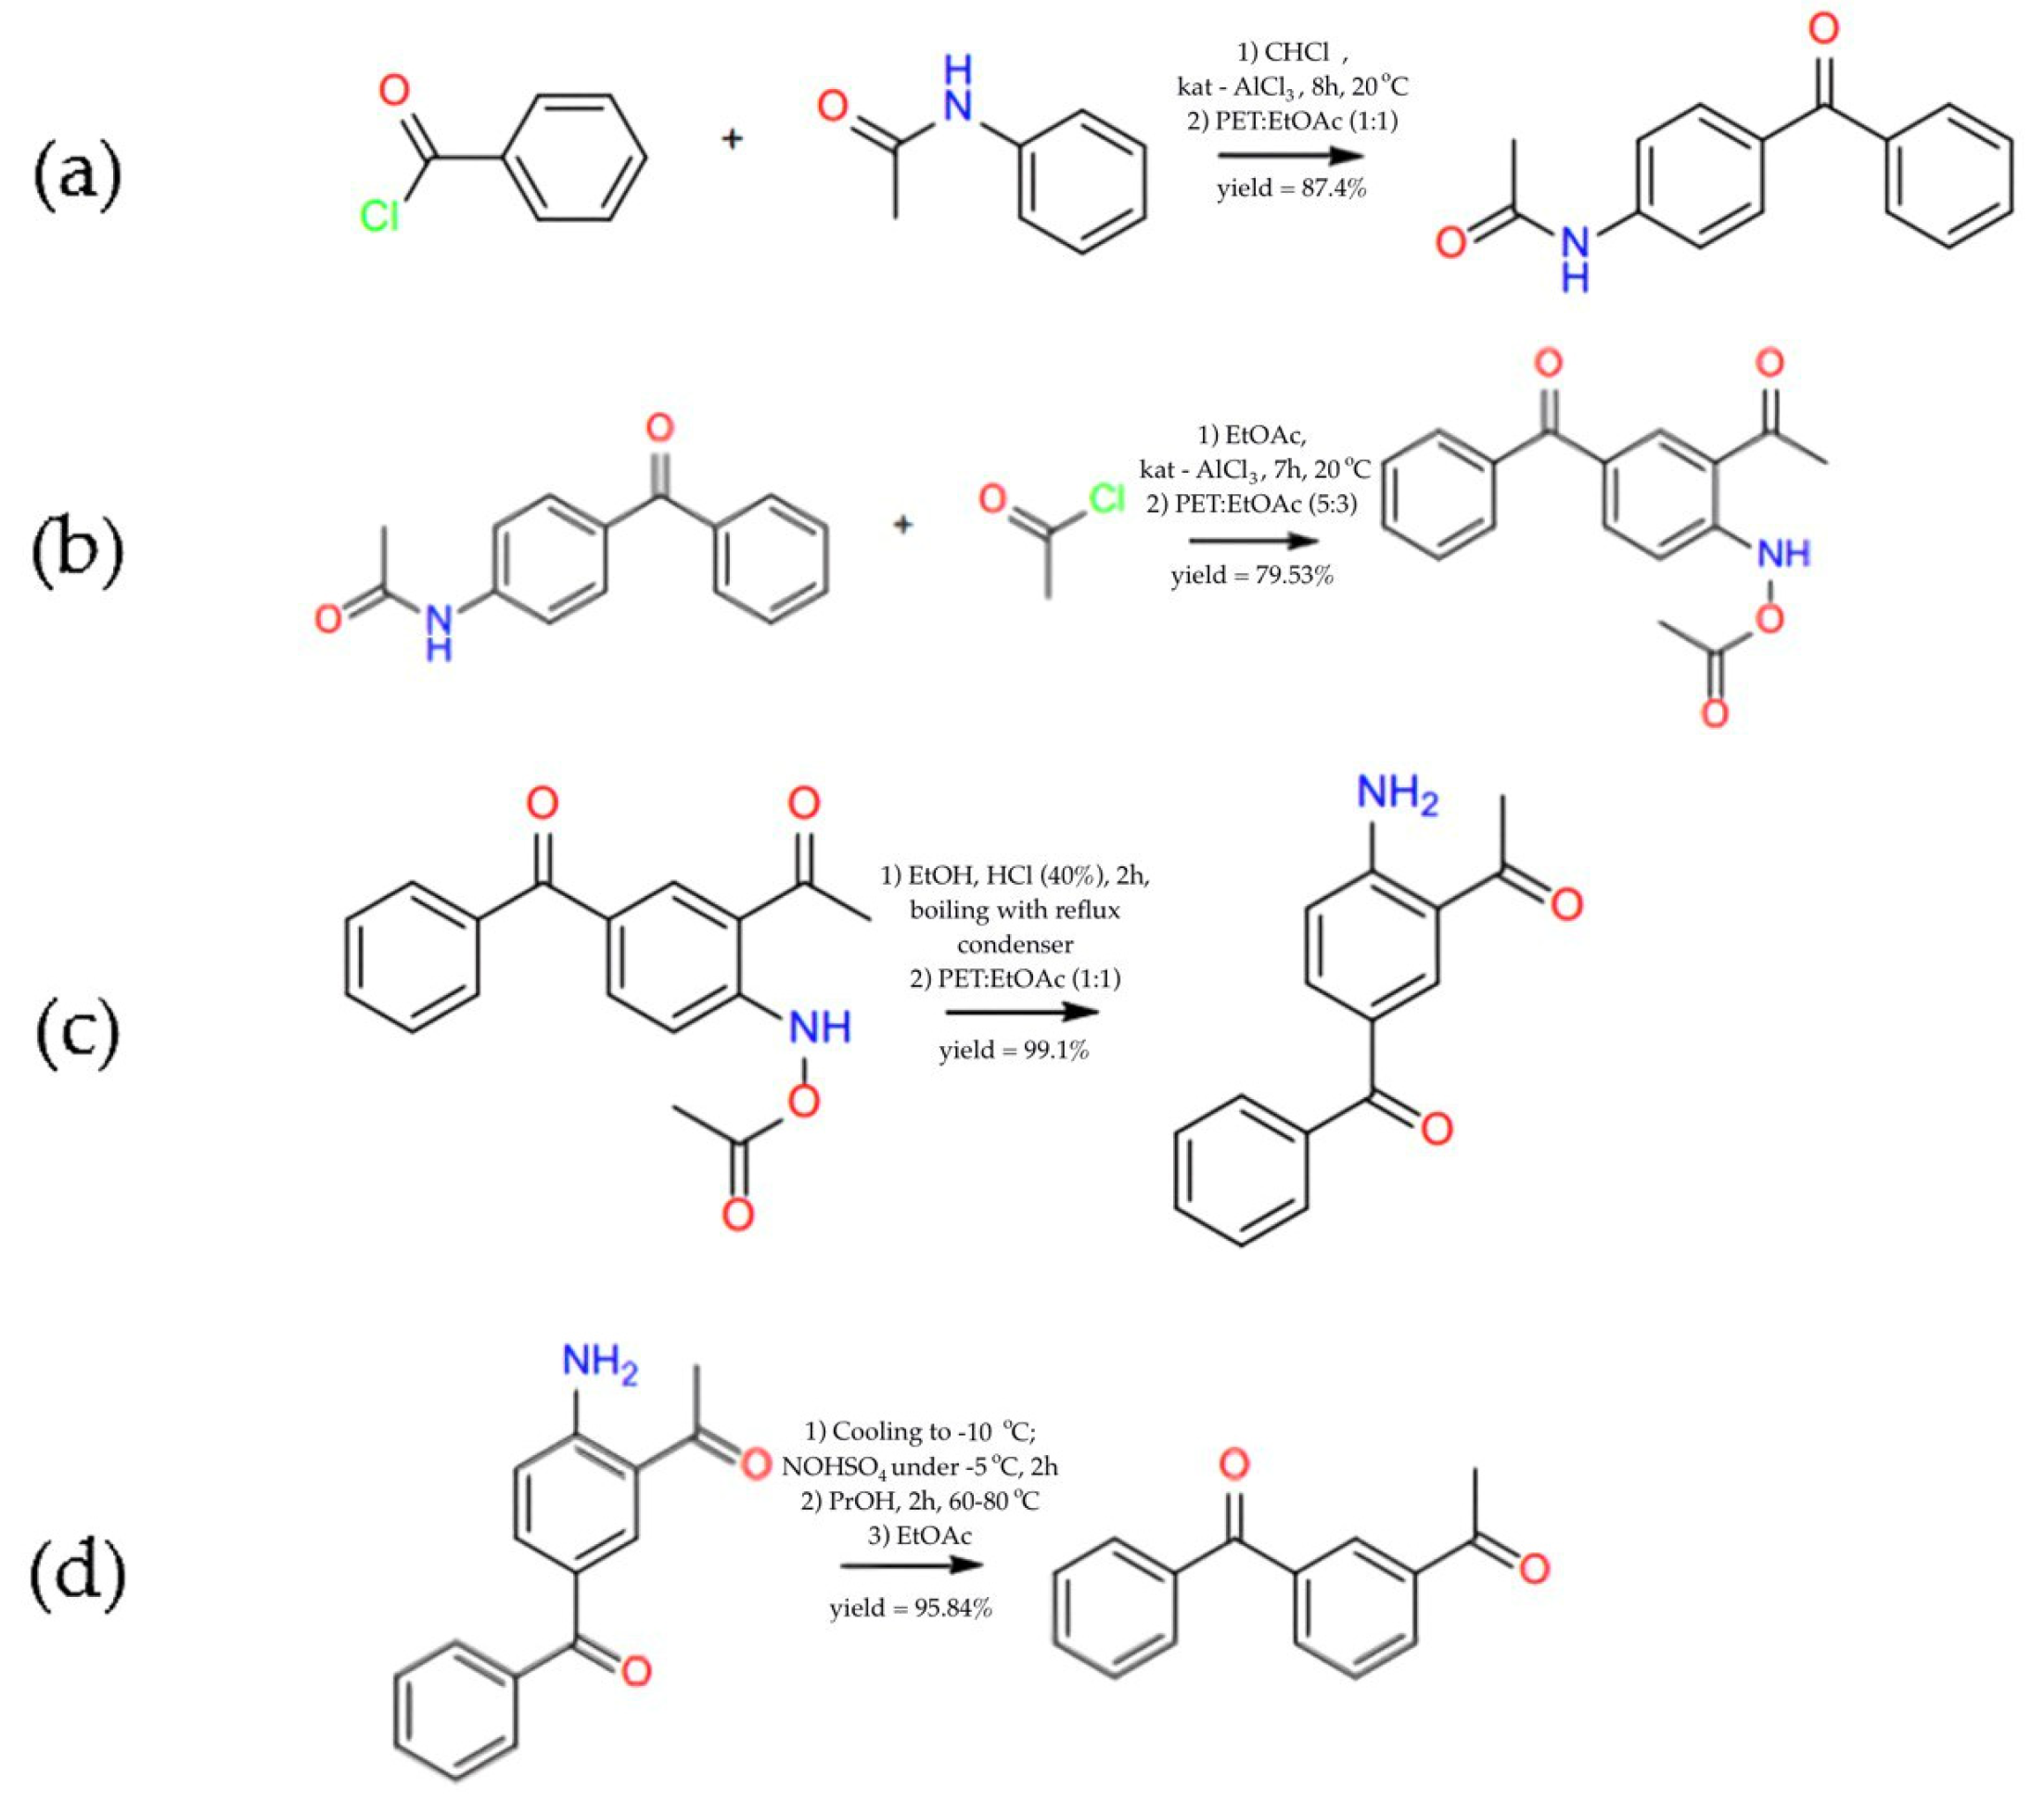
3.1. Synthesis of 1-(3-Benzoylphenyl)ethanone
- Reagents: 16.4 g of benzoyl chloride, 15.8 g of acetanilide, 17.1 g of aluminium chloride. Reaction conditions: chloroform (400 mL), 8 h at room temperature, addition to ice water with HCl (8.3%), drying over Na2SO4, evaporation. Recrystallisation from a mixture of petroleum ether–ethyl acetate (1:1). The product of this stage is 24.4 g 4-Acetamidobenzophenone.
- Reagents: 24.4 g of 4-acetamidobenzophenone and 24.4 g of aluminium chloride. Reaction conditions: ethyl acetate (100 mL), slow addition of acetyl chloride (10 mL) over 20 min, reaction at room temperature for 7 h. Reaction is ended by adding ice water with HCl (8.3%), drying over Na2SO4 and evaporating over a vacuum. Recrystallisation from petroleum ether–ethyl acetate (5:3). The product of this stage is 22.8 g 2-Acetamido-5-benzoyl-acetophenone.
- Reagents: 22.8 g of 2-acetamido-5-benzoyl-yl-acetophenone. Reaction conditions: ethanol (50 mL), HCl 40% (20 mL), boiling for 2 h, addition of Na2CO3 solution with cooling, drying, and evaporation under a vacuum. Recrystallisation from petroleum ether–ethyl acetate (1:1). The product of this stage is 22.6 g 2-Acetyl-4-benzoylaniline.
- Reagents: 22.6 g of 2-acetamido-5-benzo-yl-acetophenone. Reaction conditions: cooling to −10 °C, addition of 50 mL of nitrosyl sulphate solution (34 g/100 mL) at −5 °C, stirring for 2 h, addition of propanol (50 mL), heating to 60–80 °C, reaction for 2 h. Extraction with ethyl acetate, drying, and evaporation under vacuum. The product of the stage is 20.3 g 1-(3-benzoylphenyl)ethenone.
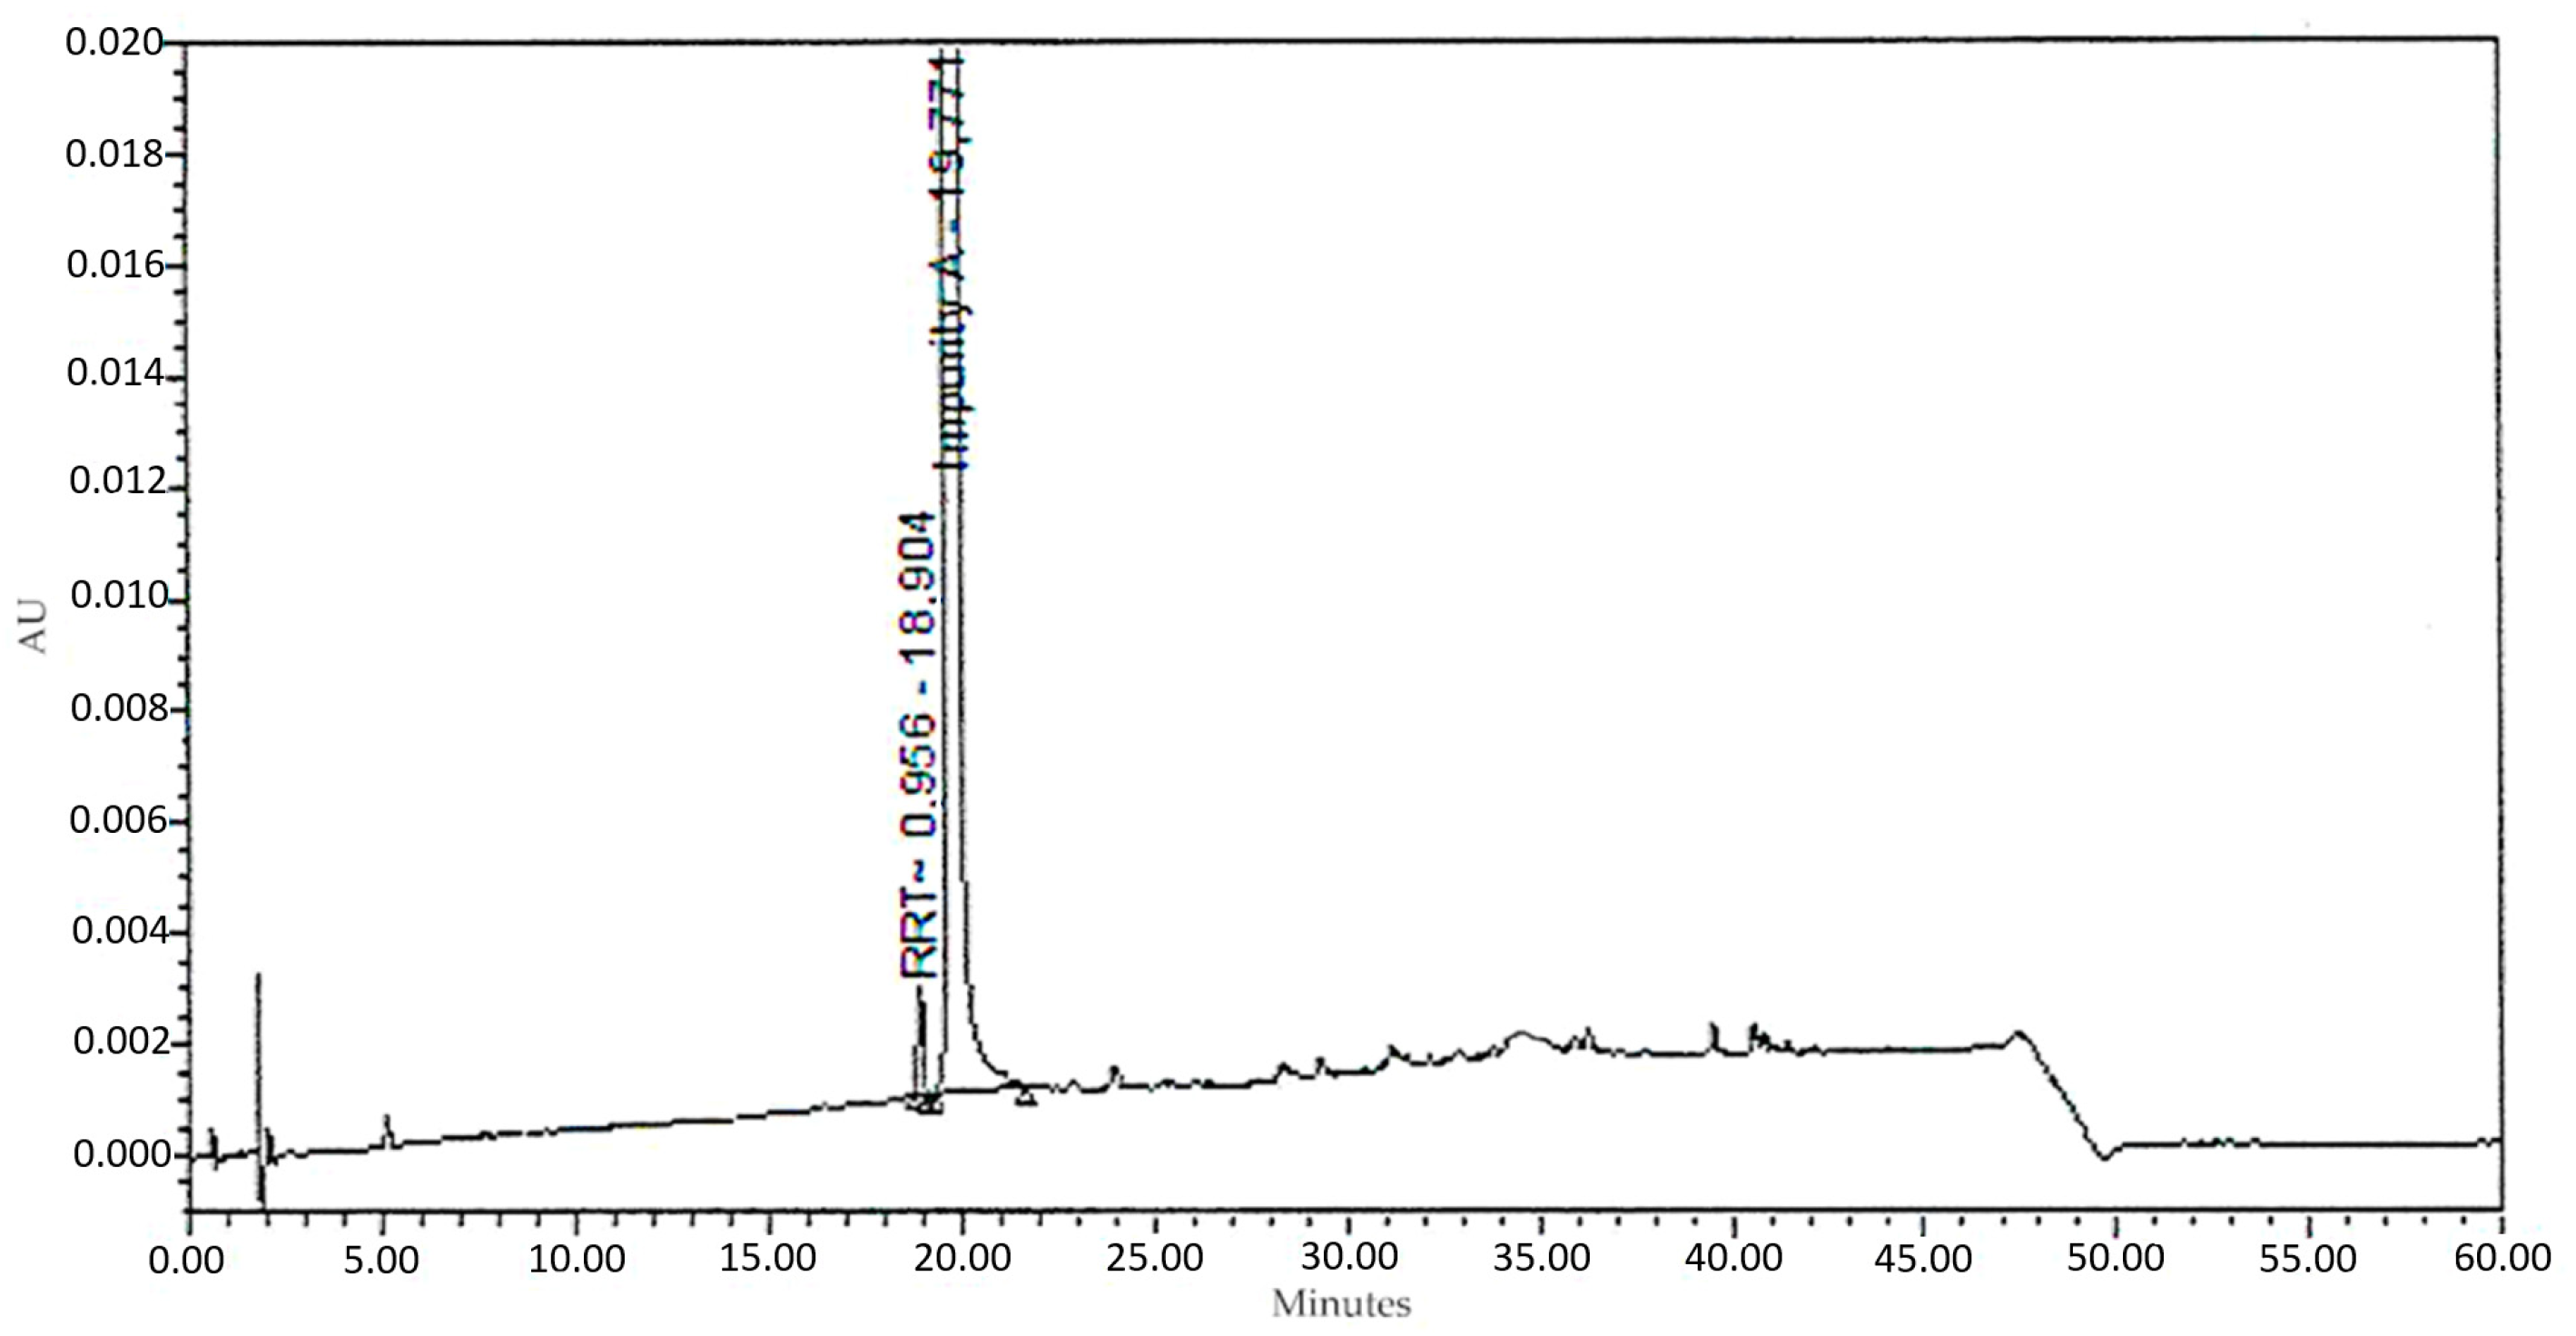
3.2. Analytical HPLC of 1-(3-Benzoylphenyl)ethanone
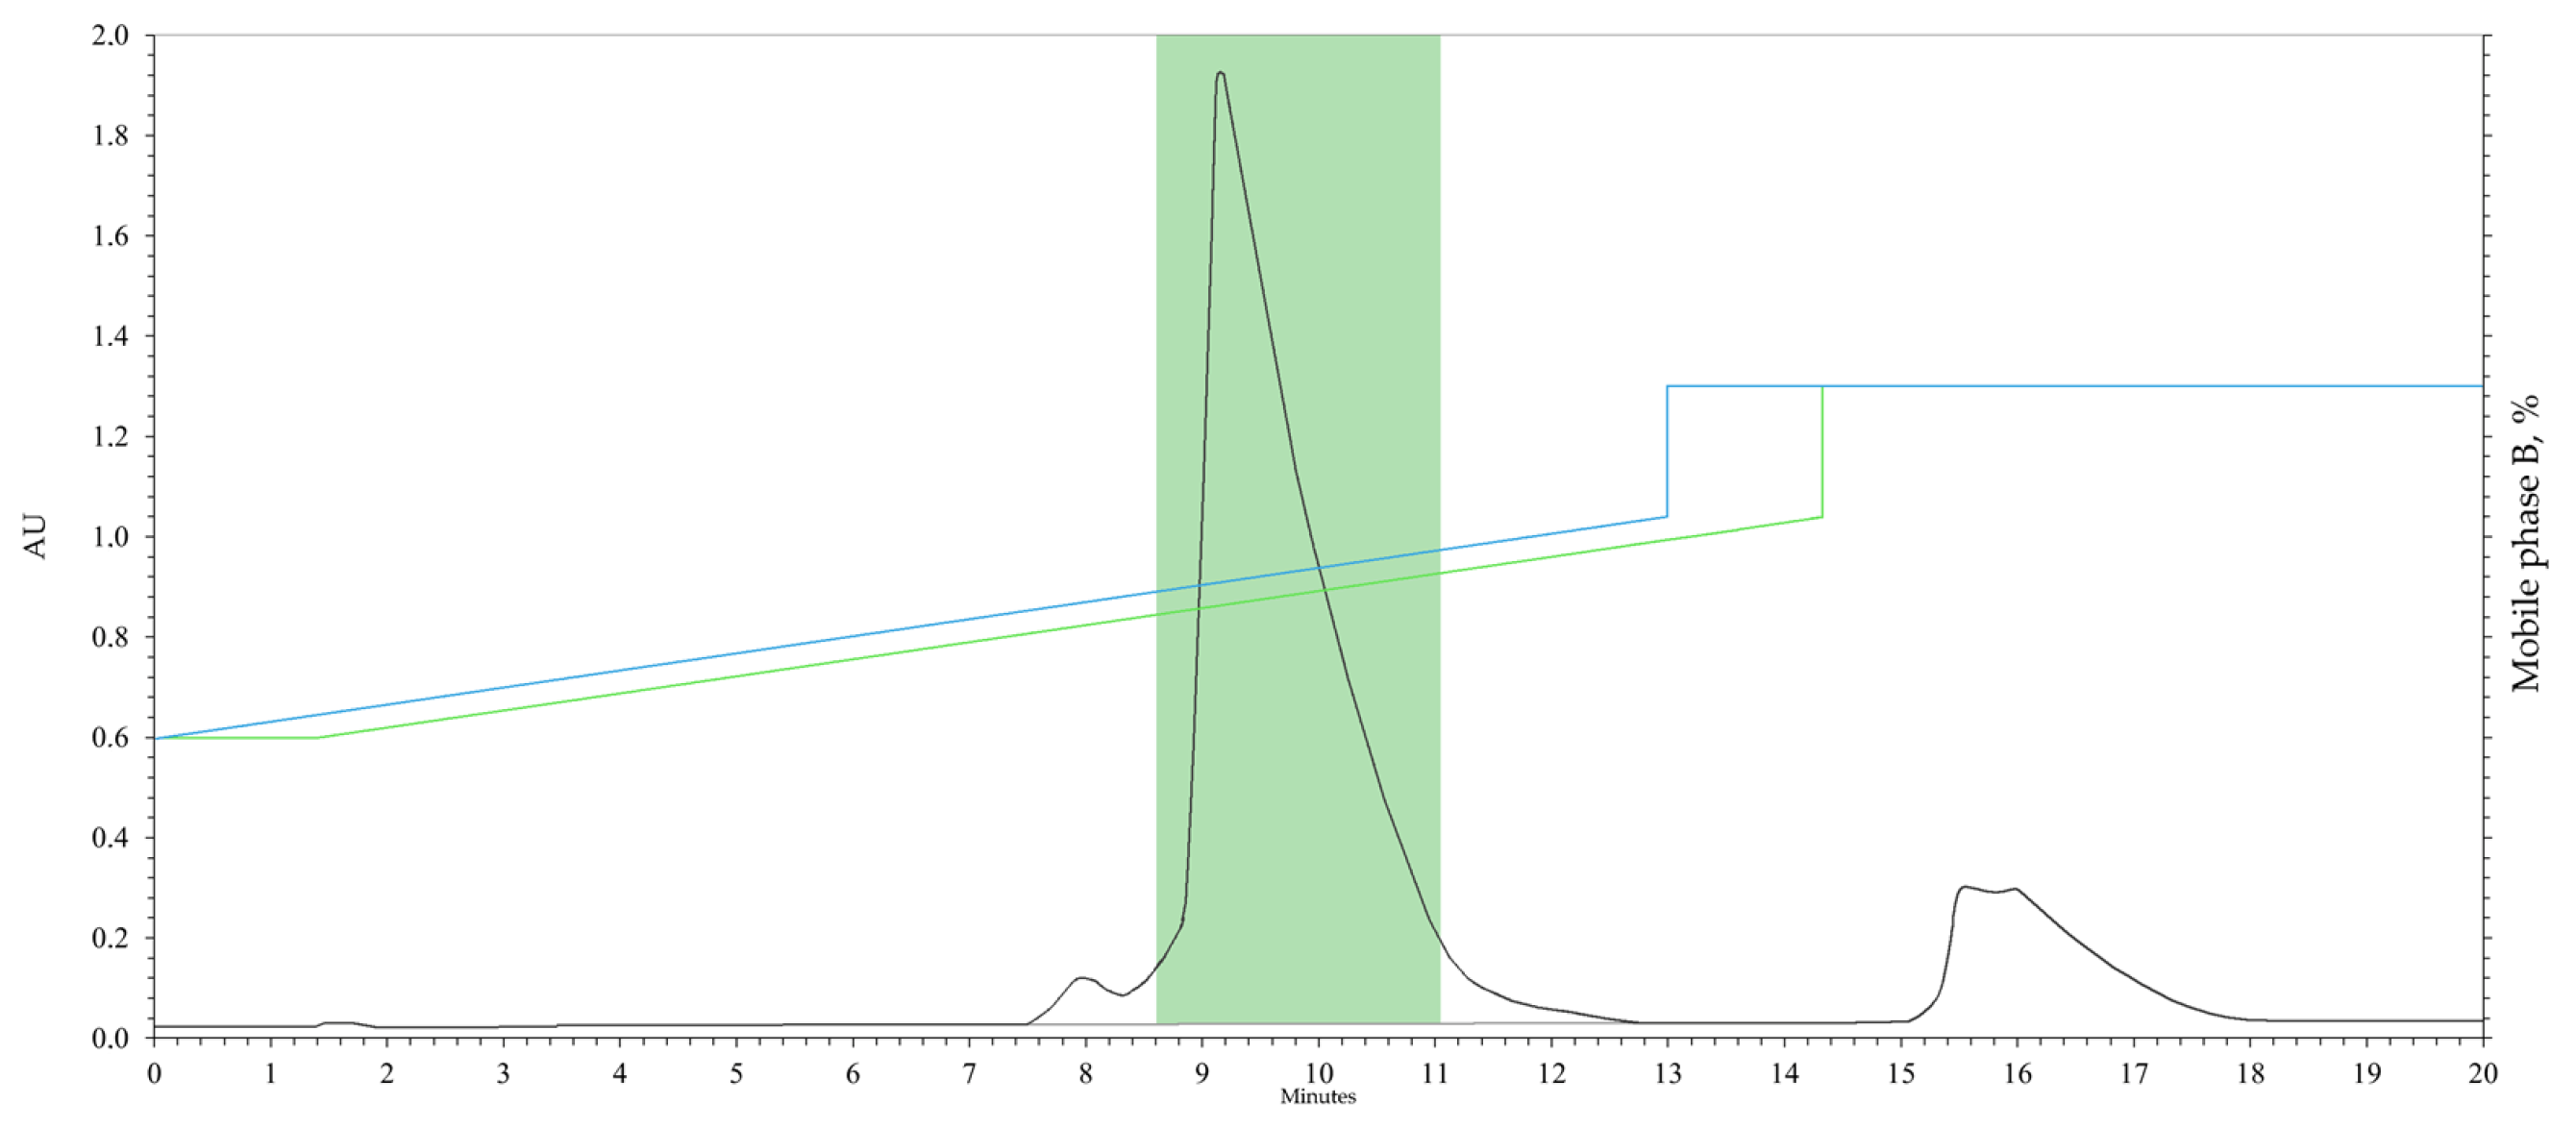
3.3. Preparative HPLC of 1-(3-Benzoylphenyl)ethanone
3.4. IR
3.5. NMR
3.6. Mass Spectrometry
4. Conclusions
Author Contributions
Funding
Institutional Review Board Statement
Informed Consent Statement
Data Availability Statement
Conflicts of Interest
References
- Pokar, D.; Rajput, N.; Sengupta, P. Industrial approaches and consideration of clinical relevance in setting impurity level specification for drug substances and drug products. Int. J. Pharm. 2020, 576, 119018. [Google Scholar] [CrossRef] [PubMed]
- Dhangar, K.; Jagtap, R.; Surana, S.; Shirkhedkar, A. Impurity profiling of drugs towards safety and efficacy: Theory and practice. J. Chil. Chem. Soc. 2017, 62, 3543–3557. [Google Scholar] [CrossRef]
- International Council for Harmonisation. ICH Q3A(R2): Impurities in New Drug Substances. Available online: https://www.ema.europa.eu/en/ich-q3a-r2-impurities-new-drug-substances-scientific-guideline (accessed on 12 December 2024).
- International Council for Harmonisation. ICH Q3B(R2): Impurities in New Drug Products. Available online: https://www.ema.europa.eu/en/ich-q3b-r2-impurities-new-drug-products-scientific-guideline (accessed on 12 December 2024).
- Bhagwat, A.B.; Khedkar, K.M. Impurity Profiling: A Review. Asian J. Pharm. Res. Dev. 2022, 10, 135–143. [Google Scholar] [CrossRef]
- Wicht, K.; Baert, M.; Kajtazi, A.; Schipperges, S.; von Doehren, N.; Desmet, G.; de Villiers, A.; Lynen, F. Pharmaceutical impurity analysis by comprehensive two-dimensional temperature responsive × reversed phase liquid chromatography. J. Chromatogr. A 2020, 1630, 461561. [Google Scholar] [CrossRef] [PubMed]
- Görög, S. Critical review of reports on impurity and degradation product profiling in the last decade. TrAC Trends Anal. Chem. 2018, 101, 2–16. [Google Scholar] [CrossRef]
- Singh, D.K.; Sahu, A.; Kumar, S.; Singh, S. Critical review on establishment and availability of impurity and degradation product reference standards, challenges faced by the users, recent developments, and trends. TrAC Trends Anal. Chem. 2018, 101, 85–107. [Google Scholar] [CrossRef]
- World Health Organization. WHO General Guidelines for the Establishment, Maintenance and Distribution of Chemical Reference Substances; Annex 3, WHO Technical Report Series 943; World Health Organization: Geneva, Switzerland, 2007.
- Atzeni, F.; Masala, I.F.; Bagnasco, M.; Lanata, L.; Mantelli, F.; Sarzi-Puttini, P. Comparison of Efficacy of Ketoprofen and Ibuprofen in Treating Pain in Patients with Rheumatoid Arthritis: A Systematic Review and Meta-Analysis. Pain Ther. 2021, 10, 577–588. [Google Scholar] [CrossRef] [PubMed]
- European Pharmacopoeia, 10th ed.; European Directorate for the Quality of Medicines & HealthCare, Council of Europe: Strasbourg, France, 2019; Volumes 1–3.
- Luo, L.; Tan, M.; Luo, Y. Determination of related substances in ketoprofen injection by RP-HPLC method. Pak. J. Pharm. Sci. 2019, 32, 1607–1614. [Google Scholar] [PubMed]
- Liu, K.T.; Chen, C.H. Determination of impurities in pharmaceuticals: Why and how? Quality Management and Quality Control: New Trends and Developments. In Quality Management and Quality Control-New Trends and Developments; IntechOpen: London, UK, 2019. [Google Scholar] [CrossRef]
- Costanzo, L.L.; De Guidi, G.; Condorelli, G.; Cambria, A.; Fama, M. Molecular mechanism of drug photosensitization–II. Photohemolysis Sensitized Ketoprofen 1989, 50, 359–365. [Google Scholar] [CrossRef]
- Hykrdová, L.; Bajt, O.; Jirkovský, J. Mechanism and kinetics of photochemical transformation of ketoprofen and its degradation intermediates. J. Hazard. Mater. 2018, 353, 70–79. [Google Scholar] [CrossRef]
- Epshtein, N. Certification of Reference Standards in Pharmacy: Mass Balance Method. Pharm. Chem. J. 2018, 51, 928–937. [Google Scholar] [CrossRef]
- Gegechkori, V.I.; Shulga, N.A.; Shchepochkina, O.I.; Gorokhovets, N.V.; Levko, A.A.; Chadova, N.N.; Shestakov, V.N. Procedure of matter identification of reference material for composition of azithromycin with use of spectral method. Measurement Standards. Ref. Mater. 2021, 17, 21–34. (In Russian) [Google Scholar] [CrossRef]
- Chepilo, D.A.; Gegechkori, V.I.; Shchepochkina, O.Y.; Efremov, A.Y.; Levko, A.A.; Chadova, N.N.; Shestakov, V.N. A Complex Approach to the Determination of Authenticity in the Development of Standard Samples for Ace Inhibitors. Pharm. Chem. J. 2022, 56, 515–521. [Google Scholar] [CrossRef]
- Feng, C.; Yin, G.; Yan, B. Preparation Process of Ketoprofen. Patent No. CN106748718B; China National Intellectual Property Administration, 7 December 2016. [Google Scholar]
- Lu, B.; Wang, Y.Z.; Li, Y. Study on the synthesis of ketoprofen. Chin. J. Med. Chem. 2000, 10, 127–128. [Google Scholar]
- Hu, Z. Synthesis of ketoprofen. J. Chin. Pharm. Ind. 2004, 35, 520–521. [Google Scholar]
- Feng, L.; Oturan, N.; van Hullebusch, E.D.; Esposito, G.; Oturan, M.A. Degradation of anti-inflammatory drug ketoprofen by electro-oxidation: Comparison of electro-Fenton and anodic oxidation processes. Environ. Sci. Pollut. Res. Int. 2014, 21, 8406–8416. [Google Scholar] [CrossRef] [PubMed]
- Illés, E.; Szabó, E.; Takács, E.; Wojnárovits, L.; Dombi, A.; Gajda-Schrantz, K. Ketoprofen removal by O3 and O3/UV processes: Kinetics, transformation products and ecotoxicity. Sci. Total Environment. 2014, 472, 178–184. [Google Scholar] [CrossRef] [PubMed]
- Gabrič, A.; Hodnik, Ž.; Pajk, S. Oxidation of Drugs during Drug Product Development: Problems and Solutions. Pharmaceutics 2022, 14, 325. [Google Scholar] [CrossRef] [PubMed]
- Aranyi, A. High performance liquid chromatography (HPLC) and related techniques: 2.7.2. Isolation of impurities by (semi)preparative HPLC. In Progress in Pharmaceutical and Biomedical Analysis, 2nd ed.; Görög, S., Ed.; Elsevier: Amsterdam, The Netherlands, 2000; Volume 4, pp. 240–251. [Google Scholar] [CrossRef]
- Jadhav, B.G.; Jadhav, A.M.; Shirode, A.R.; Kadam, V.J. A Comprehensive Review for the Learners and Users: Preparative High Performance Liquid Chromatography. Int. J. Chem. Pharm. Anal. 2014, 1, 121–129. [Google Scholar]
- Silver, J. Overview of Analytical-to-Preparative Liquid Chromatography Method Development. ACS Comb. Sci. 2019, 21, 609–613. [Google Scholar] [CrossRef] [PubMed]


| Peak Name | RT (min) | Area | Area (%) | Height |
|---|---|---|---|---|
| RTT 0.956 | 18.93 | 191,950 | 1.7437 | 76,780 |
| Impurity A | 19.80 | 9,957,204 | 90.4542 | 1,659,534 |
| RTT 1.747 | 34.59 | 583,328 | 5.2991 | 145,832 |
| RTT 1.766 | 34.96 | 275,520 | 2.5029 | 78,720 |
| Peak Name | RT (min) | Mobile Phase Composition with Consideration of Elution Delay. (Mobile Phase B (%)) |
|---|---|---|
| RTT 0.956 | 18.93 | 41 |
| Impurity A | 19.80 | 43 |
| RTT 1.747 | 34.59 | 63 |
| RTT 1.766 | 34.96 | 64 |
| Peak Name | RT (min) | Area | Area (%) | Height |
|---|---|---|---|---|
| RTT 0.956 | 18.9 | 16,648 | 0.1394 | 2081 |
| Impurity A | 19.8 | 11,926,584 | 99.8606 | 1,490,823 |
| Absorption Maximum (nm) | Vibrational Mode | Attribution |
|---|---|---|
| 3073–2918 | ν C–H | –CH3, –CHAr |
| 1684 | ν C=O | 15 C=O |
| 1655 | ν C=O | 13 C=O |
| 1595 | σ C–C | –C–CAr |
| 1427 | σasC–H | –CH3 |
| 1356 | σsC–H | |
| 1304–1233 | νasC–CO–C | –C–CO–C |
| 1175–1144 | νsC–CO–C | |
| 820 | ω C–H | –C–HAr |
| 723–691 | σ C–C | –C–CAr |
| Chemical Shift (ppm) | Multiplicity | SSC J (Hz) | Intensity | Attribution |
|---|---|---|---|---|
| 2.61 | Singlet | - | 3 | 16 |
| 7.46 | Triplet | 7.7 | 2 | 1, 2, 3, 8 |
| 7.57 | Quartet | 7.5 | 2 | |
| 7.76 | Doublet | 7.3 | 2 | 4, 6 |
| 7.94 | Doublet | 7.7 | 1 | 7, 9 |
| 8.14 | Doublet | 7.8 | 1 | |
| 8.33 | Singlet | - | 1 | 11 |
| Chemical Shift (ppm) | Attribution | Chemical Shift (ppm) | Attribution |
|---|---|---|---|
| 26.6 | 16 | 132.8 | 7 |
| 128.4 | 1, 3 | 134.1 | 11 |
| 128.6 | 2, 8 | 136.9 | 5, 10, 12 |
| 129.5 | 137.1 | ||
| 129.9 | 4, 6 | 138.0 | |
| 131.6 | 9 | 195.7 | 13, 15 |
| 197.1 |
| Time (min) | Mobile Phase B (%) |
|---|---|
| 0 → 13 | 32 → 52 |
| 13 | 65 |
| 20 | 65 |
Disclaimer/Publisher’s Note: The statements, opinions and data contained in all publications are solely those of the individual author(s) and contributor(s) and not of MDPI and/or the editor(s). MDPI and/or the editor(s) disclaim responsibility for any injury to people or property resulting from any ideas, methods, instructions or products referred to in the content. |
© 2025 by the authors. Licensee MDPI, Basel, Switzerland. This article is an open access article distributed under the terms and conditions of the Creative Commons Attribution (CC BY) license (https://creativecommons.org/licenses/by/4.0/).
Share and Cite
Shulga, N.A.; Gegechkori, V.I.; Gorpinchenko, N.V.; Smirnov, V.V.; Dementyev, S.P.; Ramenskaya, G.V. Development of Ketoprofen Impurity A (1-(3-Benzoylphenyl)ethanone) as a Certified Reference Material for Pharmaceutical Quality Control. Pharmaceuticals 2025, 18, 59. https://doi.org/10.3390/ph18010059
Shulga NA, Gegechkori VI, Gorpinchenko NV, Smirnov VV, Dementyev SP, Ramenskaya GV. Development of Ketoprofen Impurity A (1-(3-Benzoylphenyl)ethanone) as a Certified Reference Material for Pharmaceutical Quality Control. Pharmaceuticals. 2025; 18(1):59. https://doi.org/10.3390/ph18010059
Chicago/Turabian StyleShulga, Nikolay A., Vladimir I. Gegechkori, Natalya V. Gorpinchenko, Valery V. Smirnov, Sergey P. Dementyev, and Galina V. Ramenskaya. 2025. "Development of Ketoprofen Impurity A (1-(3-Benzoylphenyl)ethanone) as a Certified Reference Material for Pharmaceutical Quality Control" Pharmaceuticals 18, no. 1: 59. https://doi.org/10.3390/ph18010059
APA StyleShulga, N. A., Gegechkori, V. I., Gorpinchenko, N. V., Smirnov, V. V., Dementyev, S. P., & Ramenskaya, G. V. (2025). Development of Ketoprofen Impurity A (1-(3-Benzoylphenyl)ethanone) as a Certified Reference Material for Pharmaceutical Quality Control. Pharmaceuticals, 18(1), 59. https://doi.org/10.3390/ph18010059