Abstract
Aim: Idiopathic pulmonary fibrosis (IPF) is associated with a poor prognosis, presenting the most aggressive form of interstitial lung diseases (ILDs). Activated fibroblasts are crucial for pathological processes. Fibroblast activation protein (FAP) inhibitor (FAPI) tracers would be promising imaging agents for these diseases. The purpose of this study was to evaluate a 99mTc-labeled FAPI tracer, 99mTc-HFAPI imaging in IPF patients. Methods: Eleven IPF patients (nine males and two females; age range 55–75 year) were included in this pilot study. 99mTc-HFAPI serial whole-body scintigraphy at 5 min, 20 min, 40 min, 1 h, 2 h, 3 h, 4 h, and 6 h was acquired for dynamic biodistribution and dosimetry estimation in seven representative patients. SPECT/CT tomography fusion imaging of the chest region was performed in all patients at 4 h post-injection, which was considered as the optimal acquisition time. Dosimetry was calculated using OLINDA/EXM software (version 2.0; HERMES Medical Solutions). The quantified or semi-quantified standardized uptake values (SUVs) and lesion-to-background ratios (LBRs) of affected lung parenchyma were also calculated. The high-resolution CT (HRCT) stage was determined with visual evaluation, and the total HRCT score of each patient was measured using a weighting factor formula. Pulmonary function tests (PFTs) were recorded as well. Then, the relationships between the 99mTc-HFAPI results, disease extent on HRCT, and PFT results were investigated. Results: Normal physiological uptake of 99mTc-HFAPI was observed mainly in the liver, intestinal tract, pancreas, gallbladder, and to a lesser extent in the spleen, kidneys, and thyroid, with no apparent retention in the blood circulation at the late time point. The mean injected activity of 99mTc-HFAPI was 813.4 MBq (range 695.6–888.0 MBq). No subjective side effects were noticed. The average whole-body effective dose was 0.0041 mSv/MBq per patient. IPF patients exhibited elevated pulmonary 99mTc-HFAPI uptake in abnormal lung regions, which was correlated with fibrotic regions on HRCT. Among different HRCT stage groups, both SUVmax and LBR showed significant differences (p < 0.001). The higher HRCT stage demonstrated significantly higher SUVmax and LBR. A linear correlation between 99mTc-HFAPI uptake and total HRCT score was observed for SUVmax (r = 0.7839, F = 54.41, p = 0.0094) and LBR (r = 0.7402, F = 56.33, p = 0.0092). 99mTc-HFAPI uptake also had moderate correlations with PFT results. Conclusions: Our preliminary data show that the 99mTc-HFAPI SPECT imaging is a promising new imaging modality in IPF patients. Investigations of its clinical value in monitoring disease progression and treatment response are needed in the future.
1. Introduction
Interstitial lung diseases (ILDs) are a heterogeneous group of parenchymal lung diseases which can cause a highly morbid and fatal pathological response. ILDs are divided into those that are associated with known causes, such as autoimmune connective tissue diseases, drugs, radiation, and environmental agents, and those that are idiopathic, classified as idiopathic interstitial pneumonia (IIP), including idiopathic pulmonary fibrosis (IPF), non-specific interstitial pneumonia (NSIP), cryptogenic organizing pneumonia (COP), etc. [1,2]. Among them, IPF is the most common and aggressive form with an extremely poor prognosis, with a median survival of 3 years after diagnosis [3]. Other forms of ILDs display a variable clinical course. The diagnostic criteria of the American Thoracic Society/European Thoracic Society guidelines are based on clinical–radiologic distinctive features and allow a confident diagnosis in typical cases, with pathologic confirmation only in atypical cases [4].
High-resolution CT (HRCT) is the current imaging modality for IPF diagnosis and has become an integral part of the evaluation of follow-up patients. HRCT patterns, including honeycombing and traction bronchiectasis, have been reported as outcome predictors in IPF patients. However, HRCT could not assess disease activity in ILDs [5]. 18F-fluorodeoxyglucose (18F-FDG) positron emission tomography (PET) is also used for the imaging of ILDs since 18F-FDG uptake by tissues is a marker of glucose metabolism. It has recently been demonstrated that the 18F-FDG signal is raised in the fibrotic pulmonary lesions (reticulation and honeycombing) in ILDs due to increased glucose transporter-1 expression in inflammatory cells and erythrocytes, as a result of neovascularization in fibrotic areas [6]. Hence, the 18F-FDG signal depicts inflammatory reactions but not the activated fibrotic process.
A number of studies have highlighted the importance of the fibroblastic foci (aggregates of collagen-producing activated fibroblasts or myofibroblasts) as a manifestation of active lung injury, and their profusion may predict physiologic decline and mortality, particularly in IPF [7]. Fibroblastic foci are the key histologic feature of fibrotic progress in ILDs, and their extent correlates with a worse clinical outcome [8,9,10]. Activated fibroblasts are essential for various physiological and pathologic conditions with the remodeling of the extracellular matrix, causing progressive tissue fibrosis [11]. Fibroblast activation protein (FAP), which is overexpressed by activated fibroblasts, is associated with wound healing, fibrotic lesions, inflammation, and cancer [12,13]. Fibroblast activation protein (FAP) is highly expressed in these activated fibroblast cells. Moreover, the activated fibroblasts are essential in the pathogenesis and progression of fibrotic processes in fibrotic ILD [10].
Recently, FAP-specific inhibitor (FAPI) quinoline-based derivatives have been designed into radiopharmaceutical agents. FAPI tracers have already been developed and demonstrated promising clinical results not only in different tumor types but also in various benign diseases, including inflammatory bowel disease, arthritis, atherosclerosis and myocardial infarction, IgG4-related Disease, etc. [14,15,16]. There have been few reports of the application of FAPI tracers in ILDs. Drug-induced pulmonary fibrosis in a mouse model demonstrated that FAPIs were involved in the pathogenesis of lung tissue fibrosis. FAPI PET could detect lung fibrogenesis, both the early presence and activity of the disease, while CT was unable to assess disease activity. So, FAPI PET could be a promising tool for assessing early disease activity and evaluating the efficacy of therapeutic interventions in lung fibrosis patients [17,18]. Bergmann and Distler et al. evaluated the value of 68Ga-FAPI-04 PET/CT in the assessment of fibrotic activity and risk stratification in systemic sclerosis-related (SSc) interstitial lung disease [19]. Rohrich et al. found elevated 68Ga-FAPI uptake in fibrotic ILD lesions and lung cancer [20]. Yang et al. revealed that the FAP signal was upregulated in vitro and in vivo in ILD patients’ lungs. FAP expression level was correlated with the existence of fibroblastic foci on human lung biopsy sections from ILD patients. In addition, the total standard uptake value (SUV) of FAPI PET was significantly related to lung function decline, indicating that FAPI PET may aid in the early diagnosis and identify the perfect treatment window period of the diseases [21].
On the basis of the above findings, FAPI tracers would be promising imaging agents for ILDs. Compared to PET tracers, the single photon emission computed tomography (SPECT) tracer technetium-99 m (99mTc) is more economical. 99mTc-labeled FAPI imaging could be a cost-saving alternative method to PET imaging since 99mTc is the most widely used radionuclide in nuclear medicine. Lindner et al. revealed that 99mTc-labeled FAPI tracers showed excellent binding properties, high affinity, and significant tumor uptake in biodistribution studies in tumor-bearing mice.99mTc-FAPI-34 accumulated in the tumor lesions in patients with metastasized ovarian and pancreatic cancer, as also shown on PET imaging using 68Ga-FAPI-46 [22]. Jia et al. developed a 99mTc-labeled FAPI tracer, 99mTc-HYNIC-FAPI-04 (99mTc-HFAPI), which can be obtained by a reliable kit-labeling procedure [23]. They demonstrated its SPECT application in patients with digestive system tumors, and 99mTc-HFAPI showed a greater diagnostic efficiency than contrast-enhanced CT. To our knowledge, the application of 99mTc-HFAPI in interstitial lung diseases has not been reported yet. In this current study, we report our first clinical experience of 99mTc-HFAPI in ILD patients. We aim to evaluate the distribution and uptake of 99mTc-HFAPI in ILD patients. The potential role of 99mTc-HFAPI in ILD patients and its relationship with pulmonary function tests and HRCT imaging are also demonstrated.
2. Results
2.1. Quality Control and Stability
Radio-ITLC was used for QC developed in ACN/Saline. As shown in Figure 1, the radiochemical purity of 99mTc-HFAPI was greater than 95%. 99mTc-HFAPI was stable in cystine for at least 2 h, with a radiochemical purity of greater than 95% (shown in Figure 2).
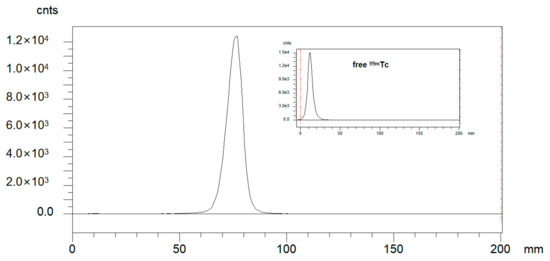
Figure 1.
Integration diagram of analytical radio-iTLC radioactive traces of 99mTc-HFAPI and free 99mTc.
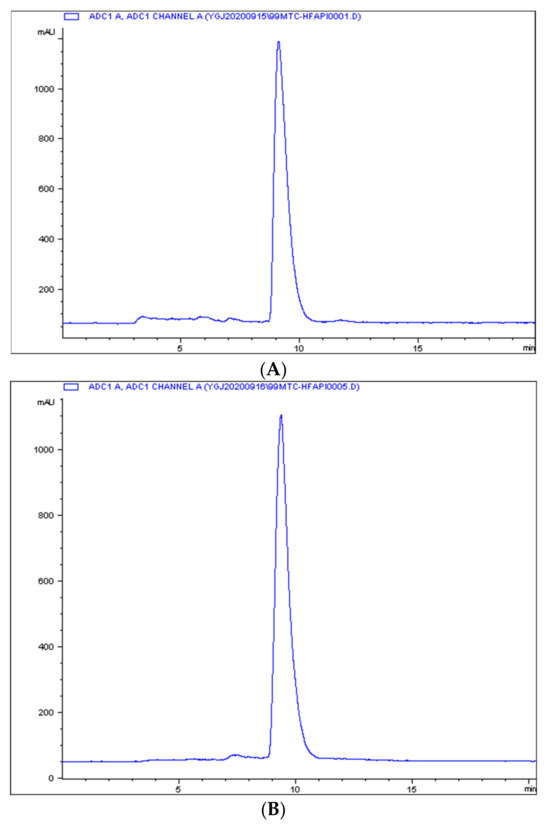
Figure 2.
The in vitro stability of 99mTc-HFAPI. Integration diagram of analytical radio-HPLC of 99mTc-HFAPI at labeling (A) and 2 h in cystine (B).
2.2. Baseline Demographic Data and Safety Assessment
The baseline demographic data of the study population of the 11 patients are summarized in Table 1. The eleven patients (nine males and two females, 62.0 ± 5.8 years of age) were diagnosed with IPF. All these patients were defined with the usual interstitial pneumonia (UIP) pattern according to HRCT. None of them had been treated with anti-fibrosis therapy.

Table 1.
Baseline demographic data for the study patients.
99mTc-HFAPI was safe and well tolerated in all subjects. With a mean injected dose of 813.4 MBq (range 695.6–888.0 MBq) of 99mTc-HFAPI, no toxic-related side effects were experienced. Vital parameters remained stable, and no adverse symptoms were noticed.
2.3. Dosimetry and Distribution Analysis
Normal physiological uptake of 99mTc-HFAPI was observed mainly in the liver, intestinal tract, pancreas, gallbladder, and to a lesser extent in the spleen, kidneys, and thyroid, with rapid clearance and no apparent retention in the blood circulation at the late time point, which was the same as in Jia et al.’s work [23]. Excessive uptake was seen in the lung area in the ILD patients at the early time points and was still visible even at 6 h after injection. A representative example of 99mTc-HFAPI distribution from whole-body scintigraphy in one of the ILD patients is shown in Figure 3. In addition, one ovarian cancer patient without affected lungs was purposely enrolled to evaluate the 99mTc-HFAPI distribution in the normal lung region. No abnormal uptake was observed in the healthy lung region (Figure S2).
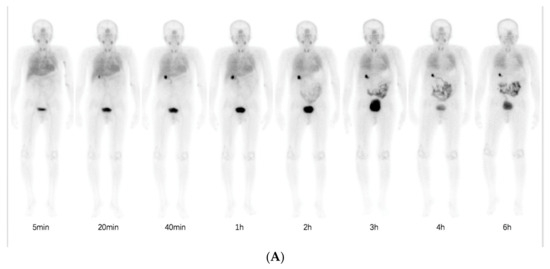
Figure 3.
Representative whole-body anterior projection images of a 59-year-old male patient at different time points (5 min, 20 min, 40 min, 1 h, 2 h, 3 h, 4 h, and 6 h) after intravenous injection of 99mTc-HFAPI (A). The semi-quantification of signal intensity ratios over time using whole-body planar images. The signal intensity ratios are the ratios of geometric mean counts of lung to whole body from anterior and posterior counts (B).
The whole-body and organ effective doses shown in Table 2 were calculated based on the serial whole-body scintigraphy. The whole-body effective dose was 0.0041 ± 0.000559 mSv/MBq per patient, which is consistent with other 99mTc-labeled agents [24].
Table 2.
Organ effective doses of 99mTc-HFAPI.
2.4. 99mTc-HFAPI Uptake in IPF Patients
In healthy human subjects, there is no pulmonary 99mTc-HFAPI uptake (Figure S2). So, any region of tracer uptake within the lungs was considered abnormal. IPF patients exhibited raised pulmonary 99mTc-HFAPI uptake, with a subpleural and peripheral distribution, involving especially the base of both lungs, as shown in Figure 4. In the corresponding areas of elevated tracer uptake, fibrotic abnormalities, including reticular opacity, traction bronchiectasis, and honeycombing, were observed in HRCT images.
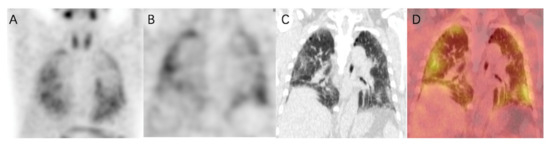
Figure 4.
99mTc-HFAPI SPECT/CT maximum-intensity-projection (MIP) (A), coronal SPECT (B), CT (C), and fused (D) images of a 65-year-old IPF patient. Increased tracer uptake is observed in a subpleural and peripheral distribution, which matches the fibrotic abnormalities in CT images.
In addition, the degree of increased uptake was associated with fibrotic severity. In Figure 5, fibrotic regions were found in the subpleural of basal parts, and corresponding elevated 99mTc-HFAPI uptake was observed, with an SUVmax of 4.5 and LBR of 3.0 in the right lung and an SUVmax of 4.4 and LBR of 2.9 in the left lung. A minor abnormality was also found in the apex parts, with less tracer uptake (SUVmax of 3.4 and LBR of 2.3 in the right lung and SUVmax of 3.7 and LBR of 2.5 in the left lung).
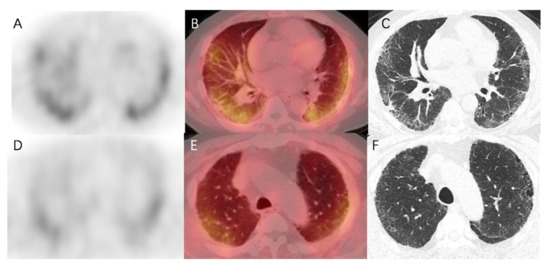
Figure 5.
99mTc-HFAPI SPECT/CT and HRCT images of a 65-year-old IPF patient. High 99mTc-HFAPI uptake (SUVmax of 4.5 and LBR of 3.0 in the right lung and SUVmax of 4.4 and LBR of 2.9 in the left lung) in the subpleural of basal parts corresponded to the areas of reticular opacity on HRCT images (A–C). Minor abnormality in HRCT images in the apex parts level demonstrated an SUVmax of 3.4 and LBR of 2.3 in the right lung and SUVmax of 3.7 and LBR of 2.5 in the left lung (D–F).
2.5. Relationship between 99mTc-HFAPI Uptake and HRCT Findings
The severity of the affected pulmonary tissue was visually evaluated in HRCT images using a 5-point HRCT stage. Both the SUVmax and LBR showed significant differences (p < 0.001) among different HRCT stage groups (Figure 6). The mean (SD) SUVmax was 1.09 (0.30), 2.37 (0.77), 3.68 (0.87), 4.48 (1.16), and 3.77 (0.64), and the mean (SD) LBR was 0.74 (0.22), 1.64 (0.55), 2.47 (0.53), 2.87 (0.55), and 2.72 (0.45), for HRCT stage 0–4, respectively. The higher HRCT stages demonstrated significantly higher SUVmax and LBR, except for stage 4. The total SUVmax had a strong and statistically significant correlation with the total HRCT score (r = 0.7839, F = 54.41, p = 0.0094), indicating that 99mTc-HFAPI uptake was comparable with disease extent on HRCT. Similarly, a significant moderate correlation between the total LBR and total HRCT score (r = 0.7402, F = 56.33, p = 0.0092) was observed as well (Figure 7).
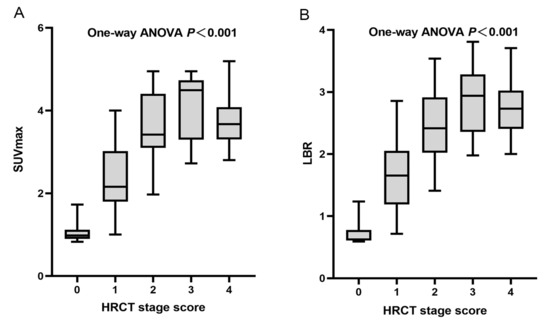
Figure 6.
Plots of SUVmax and LBR according to HRCT stage. (A) Mean (SD) SUVmax were 1.09 (0.30), 2.37 (0.77), 3.68 (0.87), 4.48 (1.16), and 3.77 (0.64) for stage 0, 1, 2, 3, and 4, respectively (one-way ANOVA, p < 0.001). (B) Mean (SD) LBRs were 0.74 (0.22), 1.64 (0.55), 2.47 (0.53), 2.87 (0.55), and 2.72 (0.45) for stage 0, 1, 2, 3, and 4, respectively (one-way ANOVA, p < 0.001).
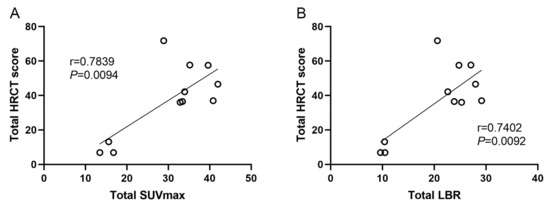
Figure 7.
Linear correlation between total SUVmax or LBR with total HRCT score. (A) Total SUVmax, r = 0.7839, p = 0.0094. (B) Total LBR, r = 0.7402, p = 0.0092.
2.6. Correlations between 99mTc-HFAPI Uptake and PFTs
Regarding the results of pulmonary tests, the total SUVmax had moderate correlations with CPI (r = 0.5584, p = 0.0742), percentage predicted DLCO (r = −0.5127, p = 0.1068), percentage predicted FEV1 (r = 0.−3347, p = 0.3144), and FEV1/FVC (r = 0.3279, p = 0.3249) (Figure 7). In addition, analysis of the total LBR between the above parameters also showed similarly moderate correlations.
3. Discussion
In our preliminary study, we report the ability of the 99mTc-labeled FAPI tracer 99mTc-HFAPI to evaluate fibrotic abnormalities in IPF patients. With a mean injected dose of 813.4 MBq of 99mTc-HFAPI, no side effects and no adverse symptoms were noticed. The mean whole-body effective dose was 0.0041 mSv/MBq, comparable to those of known single-photon tracers [24] and lower than those of 68Ga- or 18F-labeled FAPI [25]. 99mTc-HFAPI SPECT findings were compared with disease sites and the extent of HRCT. IPF patients exhibited elevated 99mTc-HFAPI uptake in fibrotic abnormal regions, as shown by HRCT. A strong linear correlation was found between 99mTc-HFAPI uptake and disease extent on HRCT. A moderate correlation was also found between 99mTc-HFAPI uptake and PFT results.
18F-FDG is the most widely used PET tracer in nuclear medicine. The value of 18F-FDG PET/CT in the assessment of disease severity, therapy efficacy, and prognosis in IPF patients has been widely studied [6,26]. High 18F-FDG SUV parameters were associated with poor pulmonary function and increased risk of mortality [27,28]. In addition, the early response to anti-fibrotic treatments has been evaluated. Although a reduction in pulmonary 18F-FDG uptake was observed in an IPF mouse model, the same result was not obtained in subsequent clinical studies in IPF patients 3 months after the initiation of anti-fibrotic therapy [29]. Other PET tracers, including CXCR4-targeted [30], SSTR-targeted [31], αvβ6 integrin-targeted [32] agents, have also been studied. The elevated signal in affected lung regions in IPF patients demonstrated a significant correlation with HRCT score and may identify disease severity and predict anti-fibrotic treatment outcome. In general, these tracers do not visualize fibroblast activation, which plays a principal role in driving lung fibrogenesis in IPF.
Recently, the application of FAP-targeted tracers demonstrated promising results. Bergmann and Distler et al. found that 68Ga-FAPI-04 significantly accumulated in fibrotic areas of the lungs in SSc-related ILD, especially in patients with extensive disease, previous ILD progression, or high EUSTAR activity scores. Moreover, increased baseline uptake was associated with disease progression, and changes in the tracer uptake were correlated with response to the anti-fibrotic agent nintedanib [19]. Another study by Rohrich et al. demonstrated elevated 68Ga-FAPI uptake in fibrotic ILD lesions, which had a positive correlation with the CT-based fibrosis index [20]. Yang et al. reported that the total SUV of 68Ga-FAPI-04 PET was significantly related to lung function decline in ILD patients, and FAP expression level was closely correlated with the abundance of fibroblastic foci on biopsy sections from these patients [21]. A preclinical study by Rosenkrans et al. found that 68Ga-FAPI-46 had the potential to detect the early onset of fibrotic injury, where current diagnostic tools such as HRCT or spirometry provided inadequate diagnostic sensitivity [17].
Since 99mTc is a more widely used radionuclide and has a lower radiation dose than PET tracers, 99mTc-HFAPI was developed as an alternative choice. In this study, we validated the feasibility of using a 99mTc-labeled FAPI tracer in the evaluation of IPF disease. IPF patients exhibited characteristic subpleural and peripheral 99mTc-HFAPI uptake that corresponded to regions of fibrotic abnormalities on HRCT. The uptake of the tracer was compared with the disease extent shown on HRCT. We found positive and significant correlations between the total SUVmax or LBR and total HRCT score, for SUVmax (r = 0.7839, F = 54.41, p = 0.0094) and LBR (r = 0.7402, F = 56.33, p = 0.0092).
This is consistent with the previous literature, which indicated that 68Ga-FAPI PET signal intensity correlated with the fibrosis index and disease extent determined by HRCT [19,20]. Of note, significantly higher SUVmax and LBR were observed in the higher HRCT stage (p < 0.001), except for HRCT stage 4 (more than 75% affected pulmonary tissue). We thought one explanation could be that massive vesicles found in the honeycombing and reticular opacity regions of HRCT stage 4 might reduce tracer signal intensity. The other explanation could be that 99mTc-HFAPI specifically detects fibroblast activity. The FAPI signal might be weaker in the late phase where matrix deposition and tissue remodeling occur than in the activation phase during the pathophysiologic fibrotic process of IPF. Further investigations are needed to verify the accuracy of this interpretation. In addition, we found moderate but not significant correlations between 99mTc-HFAPI uptake and PFT parameters. A correlation between FAPI uptake and PFT parameters was also observed which showed that 68Ga-FAPI uptake was significantly correlated with the corresponding FVC, DLCO results, and the changes in the previous 1 year [19]. The relationship between changes in FAPI uptake and lung function needs further verification.
There are several limitations in our study. First, we have preliminarily verified the feasibility of the application of 99mTc-HFAPI in ILDs. The total number of patients was rather small. A larger cohort of IPF patients and other types of ILDs is necessary to validate our data and conclusions. Next, the changes in 99mTc-HFAPI uptake and clinical outcomes have not been included in our preliminary research. Further follow-up study is warranted to assess the relationships between the changes in 99mTc-HFAPI uptake, clinical features, and prognosis. Anti-fibrotic therapy response should also be evaluated in future studies. Another limitation is the lack of tissue biopsy. All patients recruited in our research have typical IPF. A confident diagnosis could be made according to clinical imaging criteria [4], making biopsy not necessary. Therefore, the immunohistochemical expression of FAP and its correlation with 99mTc-HFAPI uptake could not be confirmed in our report.
4. Materials and Methods
4.1. Study Design and Patient Characteristics
This is a pilot study of calculating radiation dosimetry, distribution, and performance of a 99mTc-HFAPI imaging probe in IPF patients. This study was approved by the institutional review board of Peking Union Medical College Hospital, Chinese Academy of Medical Sciences and Peking Union Medical College (Ethics committee approval No. ZS-3038). Written informed consent was obtained before patient participation. All procedures were in accordance with the ethical standards of the institutional and national research committees and with the 1964 Helsinki Declaration and its later amendments or comparable ethical standards. A total of eleven patients (nine males and two females, 62.0 ± 5.8 years of age) diagnosed with interstitial lung diseases were enrolled from December 2021 to March 2022 and imaged using serial scintigraphy and SPECT/CT. All patients were diagnosed with idiopathic pulmonary fibrosis by an experienced pulmonologist according to American Thoracic Society/European Thoracic Society guidelines [4] based on clinical–radiologic distinctive features. All these patients were defined with the usual interstitial pneumonia (UIP) pattern according to HRCT.
4.2. HRCT Imaging Protocol and Analysis
Non-contrast breath-hold high-resolution CT (HRCT) of the chest region was performed using a multi-slice CT scanner (Siemens Healthcare, Munich, Germany) with a slice thickness of 0.6 mm, at 120 kV tube voltage and 90 mAs current. The signs of pulmonary fibrosis were defined as reticular opacity, honeycombing, traction bronchiectasis, or lung architectural distortion, with absent or minor ground-glass opacity. In the areas of usual interstitial pneumonia (UIP) pattern on the images, the extent of affected pulmonary tissue was determined with visual evaluation using a 5-point stage (0, no involvement; 1, involving up to 25%, 2, involving from 26% to 50%; 3, involving from 51% to 75%; 4, involving from 76% to 100%; to the nearest 10%) at 5 levels (1, aortic arch; 2, tracheal bifurcation; 3, the origin of the apical segmental bronchus of the right lower lobe; 4, the entrance of the lower right pulmonary vein in the left atrium; 5, a level above top of the right hemidiaphragm) in the axial orientation according to the previous literature [33,34]. HRCT stage for each patient at 5 levels was recorded. In addition, the total HRCT score of each patient was also evaluated by summing up the estimated percentage of interstitial lung involvement using the ‘weighting’ factor to correct for differences in each lung zone volume at each HRCT level, based on methods reported previously [35,36]. The ratio of the weights for the five levels was 0.129 for level 1, 0.190 for level 2, 0.222 for level 3, 0.228 for level 4, and 0.230 for level 5. The percentage of abnormal lung at each level was multiplied by the corresponding ratio; the sum of the adjusted percentage of abnormal lung areas gave the total HRCT score of each patient.
4.3. Pulmonary Function Test
Pulmonary function tests (PFTs) were performed in all patients in a standard methodology according to ERS/ATS guidelines [37]. The following parameters were documented, including forced expiratory volume in the first second (FEV1), forced vital capacity (FVC), FEV1/FVC ratio, and diffusing capacity of the lung for carbon monoxide (DLCO), expressed as percentages of the predicted normal values except FEV1/FVC ratio. The composite physiologic index (CPI) was also calculated based on the previous literature using the following formula: CPI = 91.0 − (0.65 × percent predicted DLCO) − (0.53 × percent predicted FVC) + (0.34 × percent predicted FEV1) [38].
4.4. Preparation of 99mTc-HFAPI
HFAPI was obtained by conjugating 99mTc-chelator moiety (6-hydrazinonicotinamide, HYNIC) with the FAP targeting moiety (Figure S1). A single-dose lyophilized HFAPI kit containing 20 μg HFAPI, 6.5 mg tricine, 5 mg Tris (3-sulfonatophenyl) phosphine sodium salt (TPPTS), 12.7 mg succinic acid, and 38.5 mg disodium succinate was prepared. 99mTc-HFAPI was prepared via the HFAPI kit. In short, one milliliter of Na99mTcO4 solution (~1110 MBq) was added to the HFAPI kit, and the reaction mixture was heated to 95 °C for 15~20 min. After cooling down to room temperature, 99mTc-HFAPI was added. The radiochemical purity of 99mTc-HFAPI was >95% analyzed by radio-ITLC. Subsequently, the 99mTc-HFAPI was then formulated in phosphate-buffered saline and passed through a 0.22 μm Millipore filter for imaging purposes immediately. The in vitro stability was evaluated with radio-HPLC.
4.5. Whole-Body Scintigraphy and SPECT/CT Imaging Protocol
No fasting, special diet, hydration, or other specific preparation was required on the day of the 99mTc-HFAPI injection. 99mTc-HFAPI was injected intravenously with a quick bolus injection in a volume up to 1 mL with a mean administered activity of 813.4 ± 57.3 MBq (range 695.6–888.0 MBq). Serial whole-body scintigraphy at 5 min, 20 min, 40 min, 1 h, 2 h, 3 h, 4 h, and 6 h post-injection was performed using a Philips Precedence scanner (Philips Healthcare, Amsterdam, Netherlands) equipped with a low-energy general-purpose collimator, 20% symmetric energy window, with a peak at 140 keV photopeaks of 99mTc. The whole-body anterior and posterior scintigraphy was acquired with the camera configured for dual-head planar imaging with a 256 × 1024-pixel matrix at a scan speed of 18 cm/min. Based on biodistribution results, 99mTc-HFAPI SPECT/CT imaging of the chest region was performed after 4 h whole-body scintigraphy, with 32 frames and a 40 s exposure time per frame for each tomographic scan, including the chest region, followed by a low-dose CT acquisition (for attenuation correction and anatomic localization). The SPECT data were normalized and corrected for attenuation, decay, and scatter with the manufacturer-supplied reconstruction technique using an iterative ordered-subset maximum-likelihood expectation maximization algorithm with 3 iterations and 8 subsets.
Vital signs were measured, a physical examination was performed, and any possible adverse clinical symptoms were documented within 1 h before 99mTc-HFAPI injection, during the scans, and at 24 h after injection.
4.6. Distribution and Dosimetry Calculation
Visual analysis was used to determine the general distribution and the temporal and inter-subject stability. The dosimetry calculation was performed according to the European Association of Nuclear Medicine Dosimetry Guidance [39] and was conducted in seven representative patients out of a total of eleven patients. The target organs, including lungs, liver, spleen, kidneys, thyroid, small intestine, large intestine, and urinary bladder, and the remainder of the body were manually drawn on whole-body planar images. The activities were extracted from the regions of interest (ROIs) using the geometric mean of both the anterior and posterior projections of the planar images. The number of disintegrations for the target organs was obtained by fitting the data using a mono-exponential or a bi-exponential model, and the integration of the time–activity curve was calculated for every target organ. The curve-fitting and effective radiation dose calculation was performed using HERMES Hybrid Viewer 4.0 Dosimetry (HERMES Medical Solutions) according to the OLINDA/EXM (version 2.0) methodology. The absorbed dose of different organs and effective dose were calculated for dosimetry estimation as well. In addition, SPECT images were visually evaluated for the presence of FAP-positive lung parenchyma areas. For quantitative or semi-quantitative analysis, ROIs were drawn on transaxial images in the affected fibrotic lung region with increased tracer uptake on fused SPECT/CT images. The standardized uptake value (SUV) was calculated using the patient weight, injected activity, and 99mTc camera calibration factor with HERMES HybridRecon standardized uptake value (SUV) SPECT (HERMES Medical Solutions) [40]. We recorded SUVmax from the highest voxel value in the fibrotic region of the image slice. The lesion-to-background ratio (LBR), namely the SUVmax of affected lung parenchyma divided by SUV of the blood pool (measured by drawing a 15 mm circle in the aorta arch), was calculated to adjust the differences among individuals. The SUVmax of FAP-positive affected lung parenchyma and LBR at 5 sections of each lung, corresponding to HRCT, were recorded. The SUVmax and LBR at each lung section were also summed up into a total SUVmax and LBR in each patient.
4.7. Statistical Analysis
All statistical analysis was performed using GraphPad Prism software, version 6.0. (GraphPad Software Inc., San Diego, CA, USA). 99mTc-HFAPI findings were compared with HRCT results. The SUVmax and LBR were plotted by different HRCT stages. Correlation was performed between the 99mTc-HFAPI results and total HRCT score or PFTs values. Correlations analyses were assessed using the Pearson correlation test. Continuous variables were compared using an independent sample one-way ANOVA test. For all tests, a p-value < 0.05 was considered statistically significant. All quantitative data were expressed as mean ± standard deviation (SD).
5. Conclusions
Our initial findings demonstrated that 99mTc-HFAPI SPECT is a promising new imaging modality in IPF patients. A dosimetry study showed the effective dose of 99mTc-HFAPI was comparable to those of known 99mTc tracers and was lower than those of the 68Ga- and 18F-labeled FAPI tracers. Further investigations with larger patient cohorts are warranted to evaluate the potential clinical value of 99mTc-HFAPI SPECT imaging.
Supplementary Materials
The following supporting information can be downloaded at https://www.mdpi.com/article/10.3390/ph16101434/s1, Figure S1: Chemical synthesis and 99mTc radiolabeling of HFAPI; Figure S2: Representative whole-body anterior projection images (A) at different time points (5 min, 20 min, 40 min, 1 h, 2 h, 3 h, 4 h, 6 h) after intravenous injection of 99mTc-HFAPI and SPECT/CT MIP (B) of a 56-year-old female ovarian cancer patient without affected lungs. Note that there is no evident uptake in the healthy lung region.
Author Contributions
Conceptualization, F.W., Z.X. and H.J.; methodology, Y.L., Z.X. and H.J.; investigation, Y.L., Q.Z., Y.Z., J.W., Y.W., G.Y. and J.S.; resources, F.W.; data curation, Y.L. and Y.Z.; writing—original draft preparation, Y.L. and Y.Z.; writing—review and editing, Y.W.; supervision, F.W., Z.X. and H.J.; project administration, Z.X. and H.J.; funding acquisition, H.J. All authors have read and agreed to the published version of the manuscript.
Funding
Supported by National High Level Hospital Clinical Research Funding (grant number: 2022-PUMCH-B-071).
Institutional Review Board Statement
This study was approved by the institutional review board of Peking Union Medical College Hospital, Chinese Academy of Medical Sciences and Peking Union Medical College (Ethics committee approval No. ZS-3038).
Informed Consent Statement
Informed consent was obtained from all subjects involved in the study. Written informed consent has been obtained from the patient(s) to publish this paper.
Data Availability Statement
The data presented in this study are available on request from the corresponding author.
Conflicts of Interest
The authors declare that they have no conflict of interest.
References
- Barratt, S.L.; Creamer, A.; Hayton, C.; Chaudhuri, N. Idiopathic Pulmonary Fibrosis (IPF): An Overview. J. Clin. Med. 2018, 7, 201. [Google Scholar] [CrossRef] [PubMed]
- Podolanczuk, A.J.; Wong, A.W.; Saito, S.; Lasky, J.A.; Ryerson, C.J.; Eickelberg, O. Update in Interstitial Lung Disease 2020. Am. J. Respir. Crit. Care Med. 2021, 203, 1343–1352. [Google Scholar] [CrossRef] [PubMed]
- Samarelli, A.V.; Tonelli, R.; Marchioni, A.; Bruzzi, G.; Gozzi, F.; Andrisani, D.; Castaniere, I.; Manicardi, L.; Moretti, A.; Tabbì, L.; et al. Fibrotic Idiopathic Interstitial Lung Disease: The Molecular and Cellular Key Players. Int. J. Mol. Sci. 2021, 22, 8952. [Google Scholar] [CrossRef] [PubMed]
- American Thoracic Society. Idiopathic pulmonary fibrosis: Diagnosis and treatment. International consensus statement. American Thoracic Society (ATS), and the European Respiratory Society (ERS). Am. J. Respir. Crit. Care Med. 2000, 161 2 Pt 1, 646–664. [Google Scholar] [CrossRef]
- Walsh, S.L.; Wells, A.U.; Sverzellati, N.; Devaraj, A.; von der Thüsen, J.; Yousem, S.A.; Colby, T.V.; Nicholson, A.G.; Hansell, D.M. Relationship between fibroblastic foci profusion and high resolution CT morphology in fibrotic lung disease. BMC Med. 2015, 13, 241. [Google Scholar] [CrossRef] [PubMed]
- Groves, A.M.; Win, T.; Screaton, N.J.; Berovic, M.; Endozo, R.; Booth, H.; Kayani, I.; Menezes, L.J.; Dickson, J.C.; Ell, P.J. Idiopathic pulmonary fibrosis and diffuse parenchymal lung disease: Implications from initial experience with 18F-FDG PET/CT. J. Nucl. Med. Off. Publ. Soc. Nucl. Med. 2009, 50, 538–545. [Google Scholar] [CrossRef] [PubMed]
- Harada, T.; Watanabe, K.; Nabeshima, K.; Hamasaki, M.; Iwasaki, H. Prognostic significance of fibroblastic foci in usual interstitial pneumonia and non-specific interstitial pneumonia. Respirology (Carlton Vic.) 2013, 18, 278–283. [Google Scholar] [CrossRef]
- Rabeyrin, M.; Thivolet, F.; Ferretti, G.R.; Chalabreysse, L.; Jankowski, A.; Cottin, V.; Pison, C.; Cordier, J.F.; Lantuejoul, S. Usual interstitial pneumonia end-stage features from explants with radiologic and pathological correlations. Ann. Diagn. Pathol. 2015, 19, 269–276. [Google Scholar] [CrossRef]
- Acharya, P.S.; Zukas, A.; Chandan, V.; Katzenstein, A.L.; Puré, E. Fibroblast activation protein: A serine protease expressed at the remodeling interface in idiopathic pulmonary fibrosis. Hum. Pathol. 2006, 37, 352–360. [Google Scholar] [CrossRef]
- Egger, C.; Cannet, C.; Gérard, C.; Suply, T.; Ksiazek, I.; Jarman, E.; Beckmann, N. Effects of the fibroblast activation protein inhibitor, PT100, in a murine model of pulmonary fibrosis. Eur. J. Pharmacol. 2017, 809, 64–72. [Google Scholar] [CrossRef]
- Schuster, R.; Rockel, J.S.; Kapoor, M.; Hinz, B. The inflammatory speech of fibroblasts. Immunol. Rev. 2021, 302, 126–146. [Google Scholar] [CrossRef] [PubMed]
- Barbazán, J.; Matic Vignjevic, D. Cancer associated fibroblasts: Is the force the path to the dark side? Curr. Opin. Cell Biol. 2019, 56, 71–79. [Google Scholar] [CrossRef] [PubMed]
- Fitzgerald, A.A.; Weiner, L.M. The role of fibroblast activation protein in health and malignancy. Cancer Metastasis Rev. 2020, 39, 783–803. [Google Scholar] [CrossRef]
- Kratochwil, C.; Flechsig, P.; Lindner, T.; Abderrahim, L.; Altmann, A.; Mier, W.; Adeberg, S.; Rathke, H.; Röhrich, M.; Winter, H.; et al. 68Ga-FAPI PET/CT: Tracer Uptake in 28 Different Kinds of Cancer. J. Nucl. Med. Off. Publ. Soc. Nucl. Med. 2019, 60, 801–805. [Google Scholar] [CrossRef] [PubMed]
- Dendl, K.; Koerber, S.A.; Kratochwil, C.; Cardinale, J.; Finck, R.; Dabir, M.; Novruzov, E.; Watabe, T.; Kramer, V.; Choyke, P.L.; et al. FAP and FAPI-PET/CT in Malignant and Non-Malignant Diseases: A Perfect Symbiosis? Cancers 2021, 13, 4946. [Google Scholar] [CrossRef] [PubMed]
- Zheng, S.; Lin, R.; Chen, S.; Zheng, J.; Lin, Z.; Zhang, Y.; Xue, Q.; Chen, Y.; Zhang, J.; Lin, K.; et al. Characterization of the benign lesions with increased 68Ga-FAPI-04 uptake in PET/CT. Ann. Nucl. Med. 2021, 35, 1312–1320. [Google Scholar] [CrossRef]
- Rosenkrans, Z.T.; Massey, C.F.; Bernau, K.; Ferreira, C.A.; Jeffery, J.J.; Schulte, J.J.; Moore, M.; Valla, F.; Batterton, J.M.; Drake, C.R.; et al. [68Ga]Ga-FAPI-46 PET for non-invasive detection of pulmonary fibrosis disease activity. Eur. J. Nucl. Med. Mol. Imaging 2022, 49, 3705–3716. [Google Scholar] [CrossRef]
- Song, C.Y.; Liu, Z.F.; Wang, P.; Su, X.H.; Lu, Y.Q. Assessment of pulmonary fibrosis induced by paraquat using Al18F-NODA-FAPI-04 PET/CT. Intern. Emerg. Med. 2023. [CrossRef]
- Bergmann, C.; Jörg, H.W.; Treutlein, C.; Tascilar, K.; Müller, A.-T.; Atzinger, A.; Matei, A.-E.; Knitza, J.; Györfi, A.-H.; Lück, A.; et al. 68Ga-FAPI-04 PET-CT for molecular assessment of fibroblast activation and risk evaluation in systemic sclerosis-associated interstitial lung disease: A single-centre, pilot study. Lancet Rheumatol. 2021, 3, E185–E194. [Google Scholar] [CrossRef]
- Röhrich, M.; Leitz, D.; Glatting, F.M.; Wefers, A.K.; Weinheimer, O.; Flechsig, P.; Kahn, N.; Mall, M.A.; Giesel, F.L.; Kratochwil, C.; et al. Fibroblast Activation Protein-Specific PET/CT Imaging in Fibrotic Interstitial Lung Diseases and Lung Cancer: A Translational Exploratory Study. J. Nucl. Med. Off. Publ. Soc. Nucl. Med. 2022, 63, 127–133. [Google Scholar] [CrossRef]
- Yang, P.; Luo, Q.; Wang, X.; Fang, Q.; Fu, Z.; Li, J.; Lai, Y.; Chen, X.; Xu, X.; Peng, X.; et al. Comprehensive Analysis of Fibroblast Activation Protein Expression in Interstitial Lung Diseases. Am. J. Respir. Crit. Care Med. 2023, 207, 160–172. [Google Scholar] [CrossRef] [PubMed]
- Lindner, T.; Altmann, A.; Krämer, S.; Kleist, C.; Loktev, A.; Kratochwil, C.; Giesel, F.; Mier, W.; Marme, F.; Debus, J.; et al. Design and Development of 99mTc-Labeled FAPI Tracers for SPECT Imaging and 188Re Therapy. J. Nucl. Med. Off. Publ. Soc. Nucl. Med. 2020, 61, 1507–1513. [Google Scholar] [CrossRef] [PubMed]
- Jia, X.; Li, X.; Jia, B.; Yang, Y.; Wang, Y.; Liu, Y.; Ji, T.; Xie, X.; Yao, Y.; Qiu, G.; et al. The role of [99mTc]Tc-HFAPi SPECT/CT in patients with malignancies of digestive system: First clinical experience. Eur. J. Nucl. Med. Mol. Imaging 2023, 50, 1228–1239. [Google Scholar] [CrossRef] [PubMed]
- Urbán, S.; Meyer, C.; Dahlbom, M.; Farkas, I.; Sipka, G.; Besenyi, Z.; Czernin, J.; Calais, J.; Pávics, L. Radiation Dosimetry of 99mTc-PSMA I&S: A Single-Center Prospective Study. J. Nucl. Med. Off. Publ. Soc. Nucl. Med. 2021, 62, 1075–1081. [Google Scholar]
- Giesel, F.L.; Adeberg, S.; Syed, M.; Lindner, T.; Jiménez-Franco, L.D.; Mavriopoulou, E.; Staudinger, F.; Tonndorf-Martini, E.; Regnery, S.; Rieken, S.; et al. FAPI-74 PET/CT Using Either 18F-AlF or Cold-Kit 68Ga Labeling: Biodistribution, Radiation Dosimetry, and Tumor Delineation in Lung Cancer Patients. J. Nucl. Med. Off. Publ. Soc. Nucl. Med. 2021, 62, 201–207. [Google Scholar] [CrossRef]
- Justet, A.; Laurent-Bellue, A.; Thabut, G.; Dieudonné, A.; Debray, M.P.; Borie, R.; Aubier, M.; Lebtahi, R.; Crestani, B. [18F]FDG PET/CT predicts progression-free survival in patients with idiopathic pulmonary fibrosis. Respir. Res. 2017, 18, 74. [Google Scholar] [CrossRef]
- Win, T.; Screaton, N.J.; Porter, J.C.; Ganeshan, B.; Maher, T.M.; Fraioli, F.; Endozo, R.; Shortman, R.I.; Hurrell, L.; Holman, B.F.; et al. Pulmonary 18F-FDG uptake helps refine current risk stratification in idiopathic pulmonary fibrosis (IPF). Eur. J. Nucl. Med. Mol. Imaging 2018, 45, 806–815. [Google Scholar] [CrossRef]
- Yoon, H.Y.; Lee, S.H.; Ha, S.; Ryu, J.S.; Song, J.W. The Value of 18F-FDG PET/CT in Evaluating Disease Severity and Prognosis in Idiopathic Pulmonary Fibrosis Patients. J. Korean Med. Sci. 2021, 36, e257. [Google Scholar] [CrossRef]
- Bondue, B.; Castiaux, A.; Van Simaeys, G.; Mathey, C.; Sherer, F.; Egrise, D.; Lacroix, S.; Huaux, F.; Doumont, G.; Goldman, S. Absence of early metabolic response assessed by 18F-FDG PET/CT after initiation of antifibrotic drugs in IPF patients. Respir. Res. 2019, 20, 10. [Google Scholar] [CrossRef]
- Derlin, T.; Jaeger, B.; Jonigk, D.; Apel, R.M.; Freise, J.; Shin, H.O.; Weiberg, D.; Warnecke, G.; Ross, T.L.; Wester, H.J.; et al. Clinical Molecular Imaging of Pulmonary CXCR4 Expression to Predict Outcome of Pirfenidone Treatment in Idiopathic Pulmonary Fibrosis. Chest 2021, 159, 1094–1106. [Google Scholar] [CrossRef]
- Ambrosini, V.; Zompatori, M.; De Luca, F.; Antonia, D.; Allegri, V.; Nanni, C.; Malvi, D.; Tonveronachi, E.; Fasano, L.; Fabbri, M.; et al. 68Ga-DOTANOC PET/CT allows somatostatin receptor imaging in idiopathic pulmonary fibrosis: Preliminary results. J. Nucl. Med. Off. Publ. Soc. Nucl. Med. 2010, 51, 1950–1955. [Google Scholar] [CrossRef] [PubMed]
- Kimura, R.H.; Wang, L.; Shen, B.; Huo, L.; Tummers, W.; Filipp, F.V.; Guo, H.H.; Haywood, T.; Abou-Elkacem, L.; Baratto, L.; et al. Evaluation of integrin αvβ6 cystine knot PET tracers to detect cancer and idiopathic pulmonary fibrosis. Nat. Commun. 2019, 10, 4673. [Google Scholar] [CrossRef] [PubMed]
- Lynch, D.A.; Godwin, J.D.; Safrin, S.; Starko, K.M.; Hormel, P.; Brown, K.K.; Raghu, G.; King, T.E.; Bradford, W.Z., Jr.; Schwartz, D.A.; et al. High-resolution computed tomography in idiopathic pulmonary fibrosis: Diagnosis and prognosis. Am. J. Respir. Crit. Care Med. 2005, 172, 488–493. [Google Scholar] [CrossRef] [PubMed]
- Best, A.C.; Meng, J.; Lynch, A.M.; Bozic, C.M.; Miller, D.; Grunwald, G.K.; Lynch, D.A. Idiopathic pulmonary fibrosis: Physiologic tests, quantitative CT indexes, and CT visual scores as predictors of mortality. Radiology 2008, 246, 935–940. [Google Scholar] [CrossRef] [PubMed]
- Wells, A.U.; Rubens, M.B.; du Bois, R.M.; Hansell, D.M. Serial CT in fibrosing alveolitis: Prognostic significance of the initial pattern. AJR Am. J. Roentgenol. 1993, 161, 1159–1165. [Google Scholar] [CrossRef][Green Version]
- Lopes, A.J.; Capone, D.; Mogami, R.; Cunha, D.L.; Melo, P.L.; Jansen, J.M. Correlação dos achados tomográficos com parâmetros de função pulmonar na fibrose pulmonar idiopática em não fumantes [Correlation of tomographic findings with pulmonary function parameters in nonsmoking patients with idiopathic pulmonary fibrosis]. J. Bras. De Pneumol. Publicacao Of. Da Soc. Bras. De Pneumol. E Tisilogia 2007, 33, 671–678. [Google Scholar]
- Graham, B.L.; Brusasco, V.; Burgos, F.; Cooper, B.G.; Jensen, R.; Kendrick, A.; MacIntyre, N.R.; Thompson, B.R.; Wanger, J. 2017 ERS/ATS standards for single-breath carbon monoxide uptake in the lung. Eur. Respir. J. 2017, 49, 1600016. [Google Scholar] [CrossRef]
- Wells, A.U.; Desai, S.R.; Rubens, M.B.; Goh, N.S.; Cramer, D.; Nicholson, A.G.; Colby, T.V.; du Bois, R.M.; Hansell, D.M. Idiopathic pulmonary fibrosis: A composite physiologic index derived from disease extent observed by computed tomography. Am. J. Respir. Crit. Care Med. 2003, 167, 962–969. [Google Scholar] [CrossRef]
- Lassmann, M.; Chiesa, C.; Flux, G.; Bardiès, M.; EANM Dosimetry Committee. EANM Dosimetry Committee guidance document: Good practice of clinical dosimetry reporting. Eur. J. Nucl. Med. Mol. Imaging 2011, 38, 192–200. [Google Scholar] [CrossRef]
- Kangasmaa, T.S.; Constable, C.; Hippeläinen, E.; Sohlberg, A.O. Multicenter evaluation of single-photon emission computed tomography quantification with third-party reconstruction software. Nucl. Med. Commun. 2016, 37, 983–987. [Google Scholar] [CrossRef]
Disclaimer/Publisher’s Note: The statements, opinions and data contained in all publications are solely those of the individual author(s) and contributor(s) and not of MDPI and/or the editor(s). MDPI and/or the editor(s) disclaim responsibility for any injury to people or property resulting from any ideas, methods, instructions or products referred to in the content. |
© 2023 by the authors. Licensee MDPI, Basel, Switzerland. This article is an open access article distributed under the terms and conditions of the Creative Commons Attribution (CC BY) license (https://creativecommons.org/licenses/by/4.0/).