
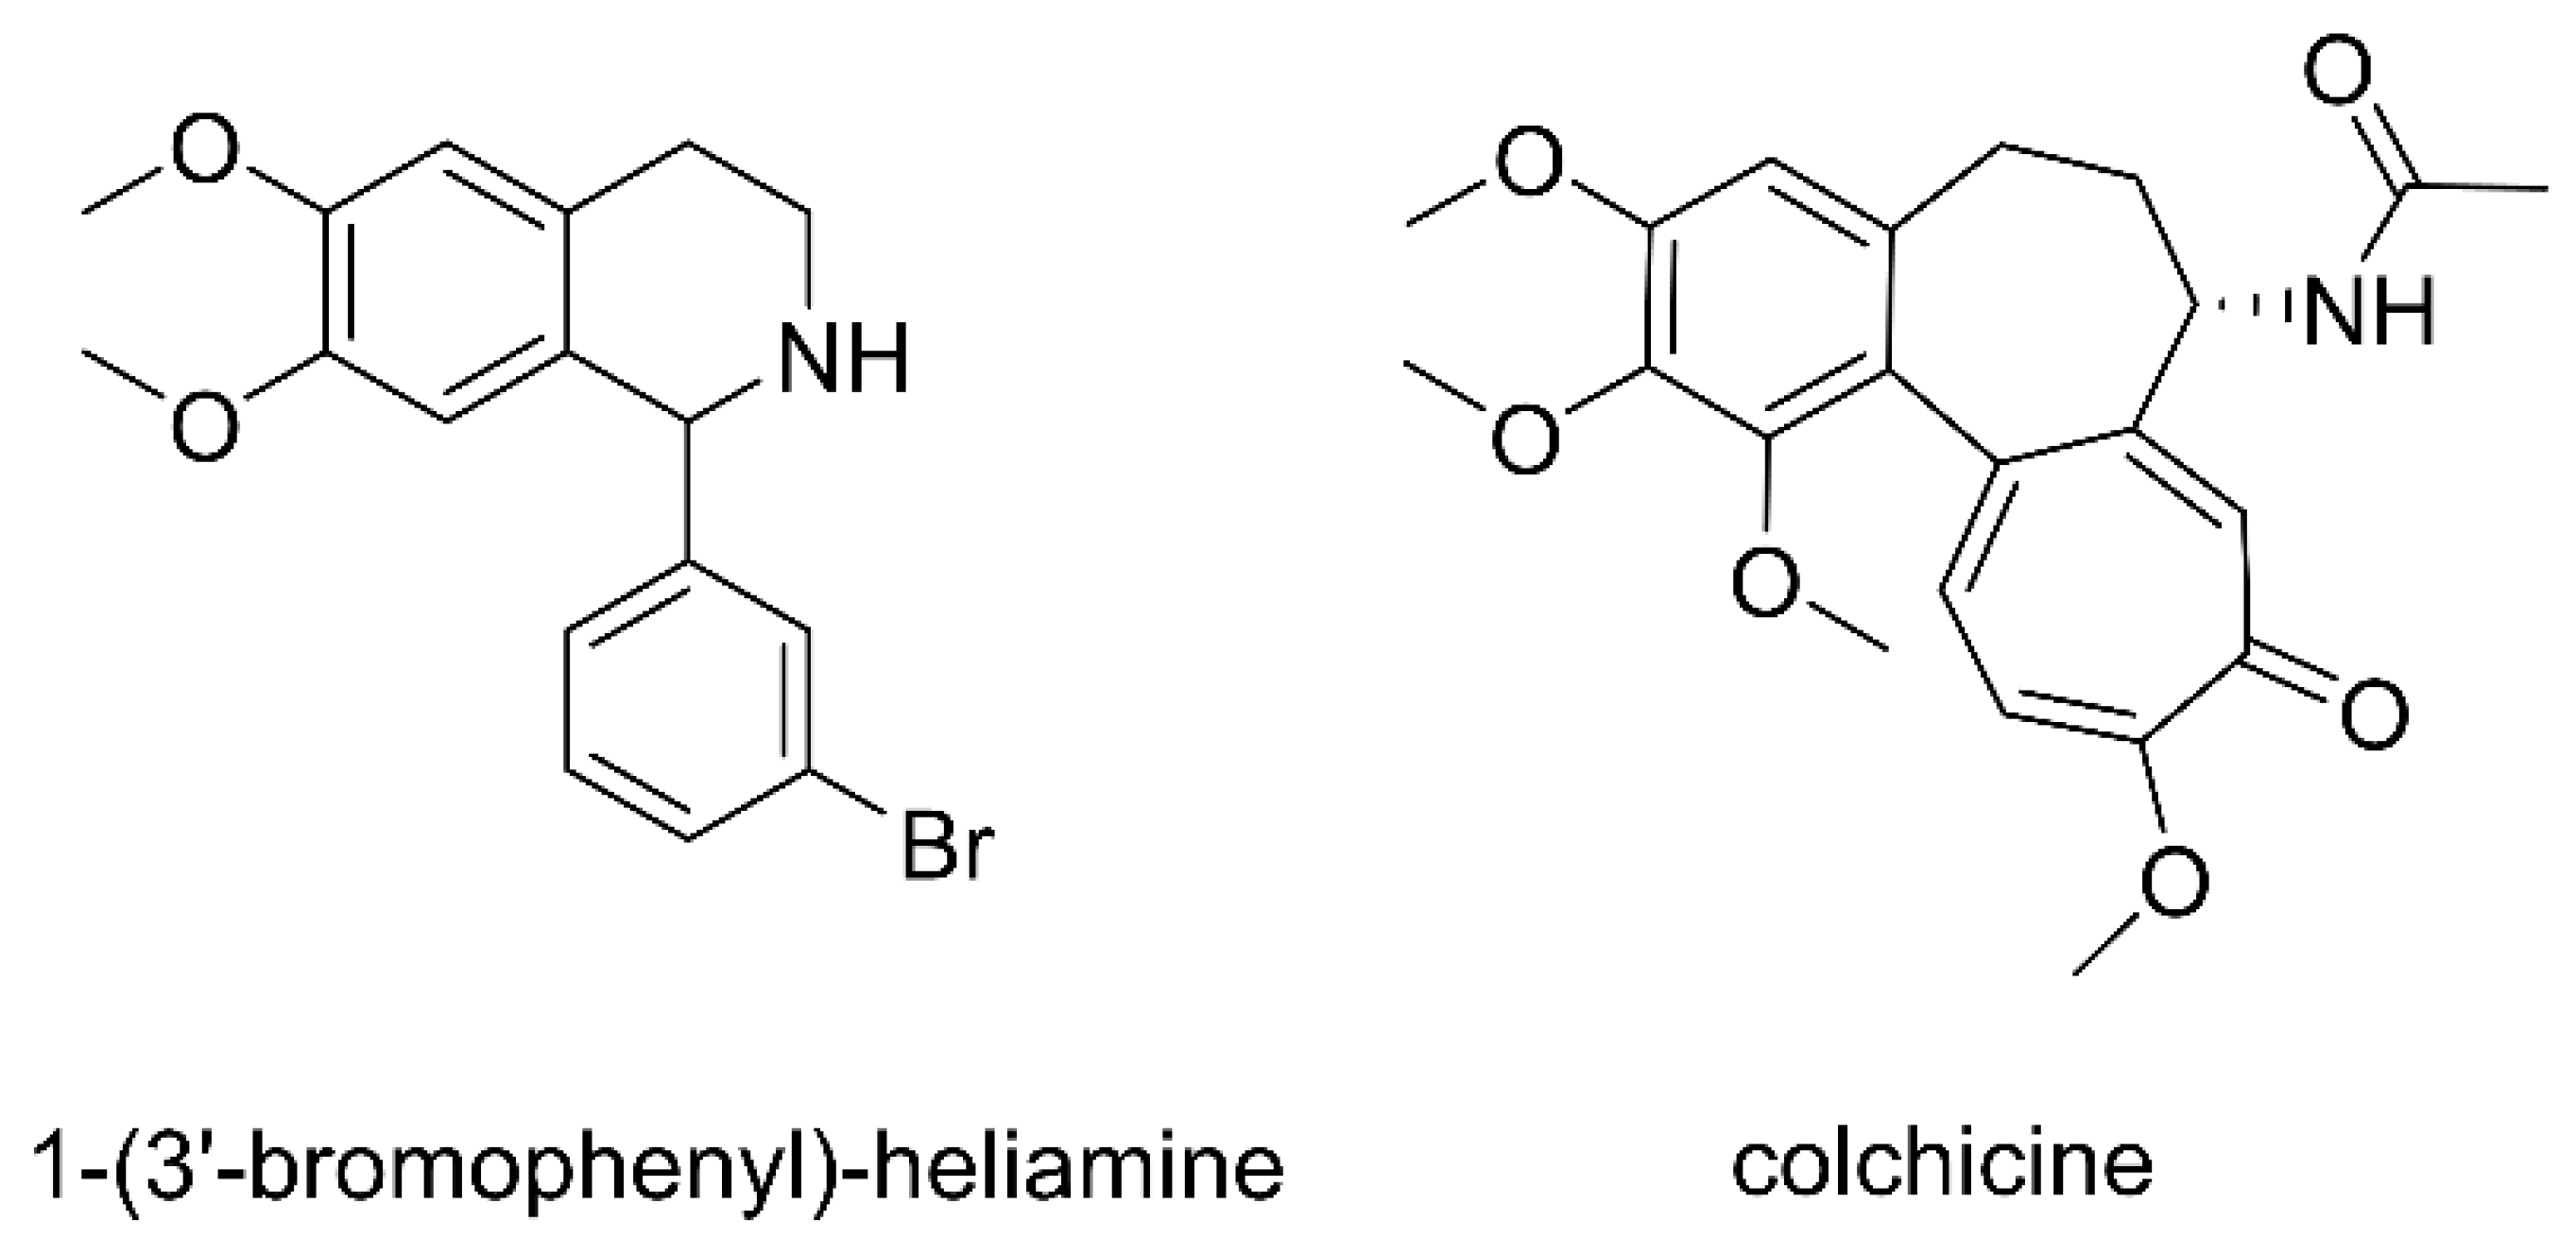
Pharmacokinetic Study and Metabolite Identification of 1-(3′-bromophenyl)-heliamine in Rats


Abstract
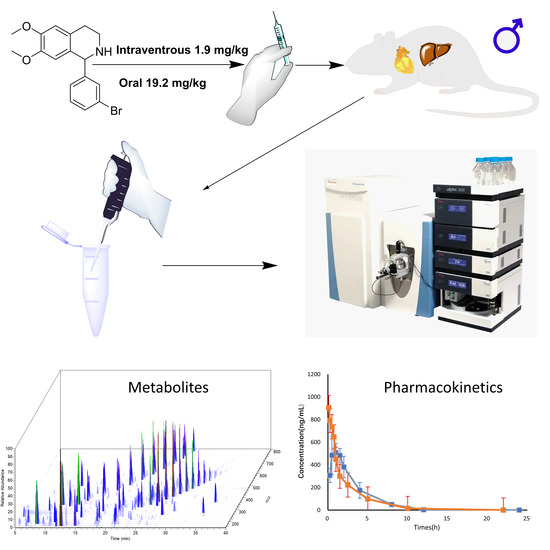
1. Introduction
2. Results and Discussion
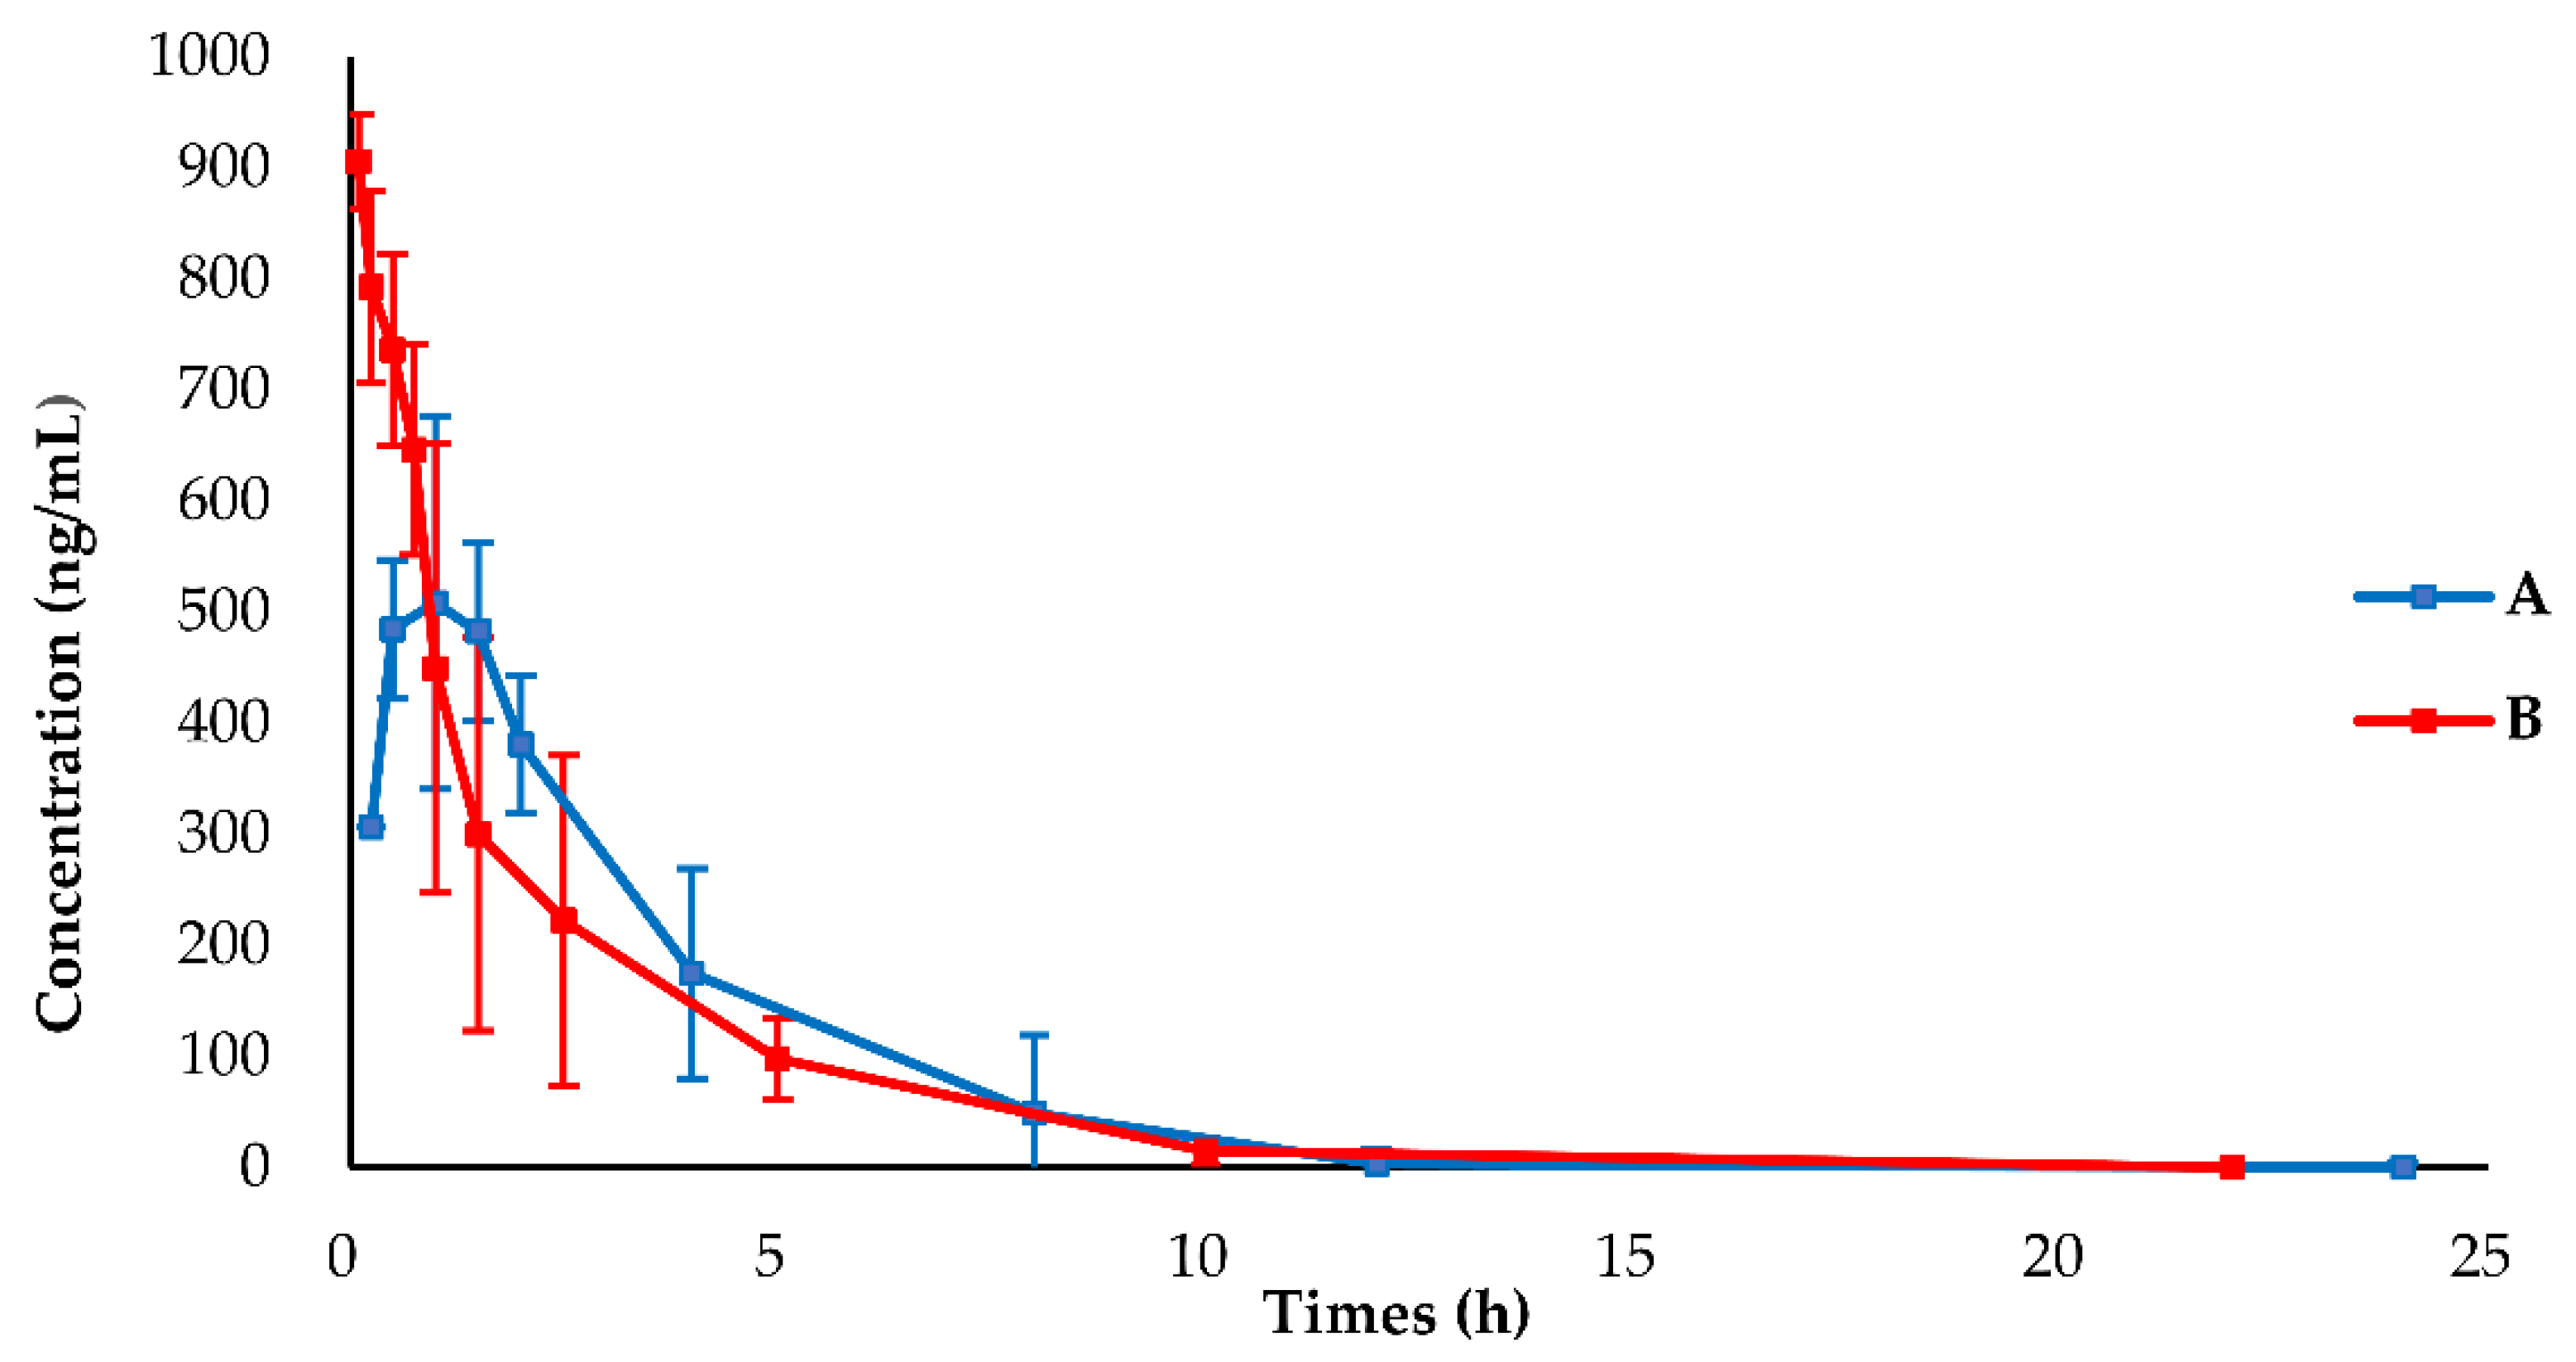
2.1. Pharmacokinetic (PK) Analysis and PK Parameter
2.2. Metabolites of BH
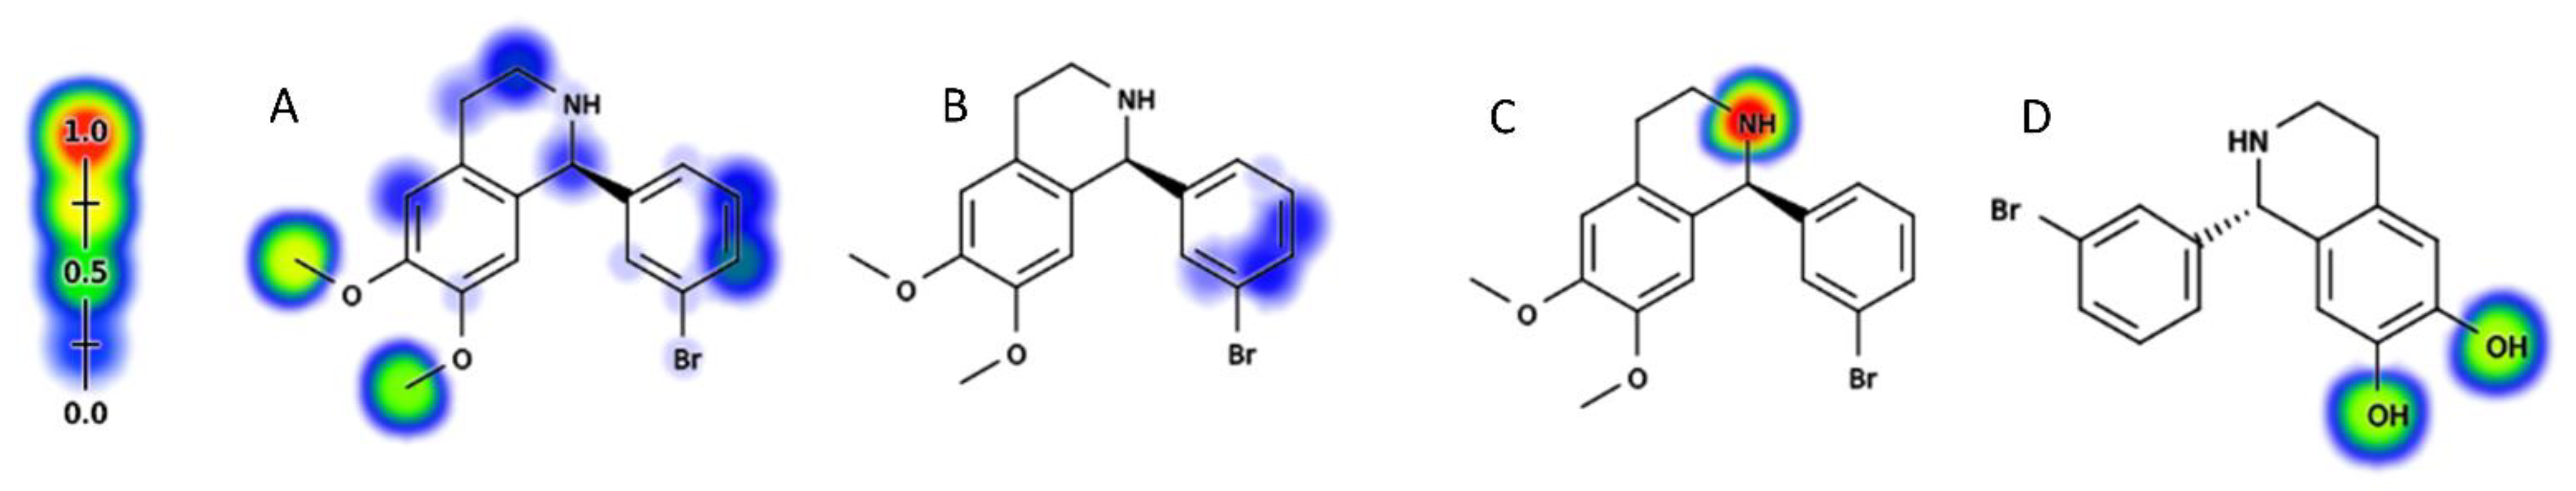
2.2.1. Metabolic Sites Prediction of BH
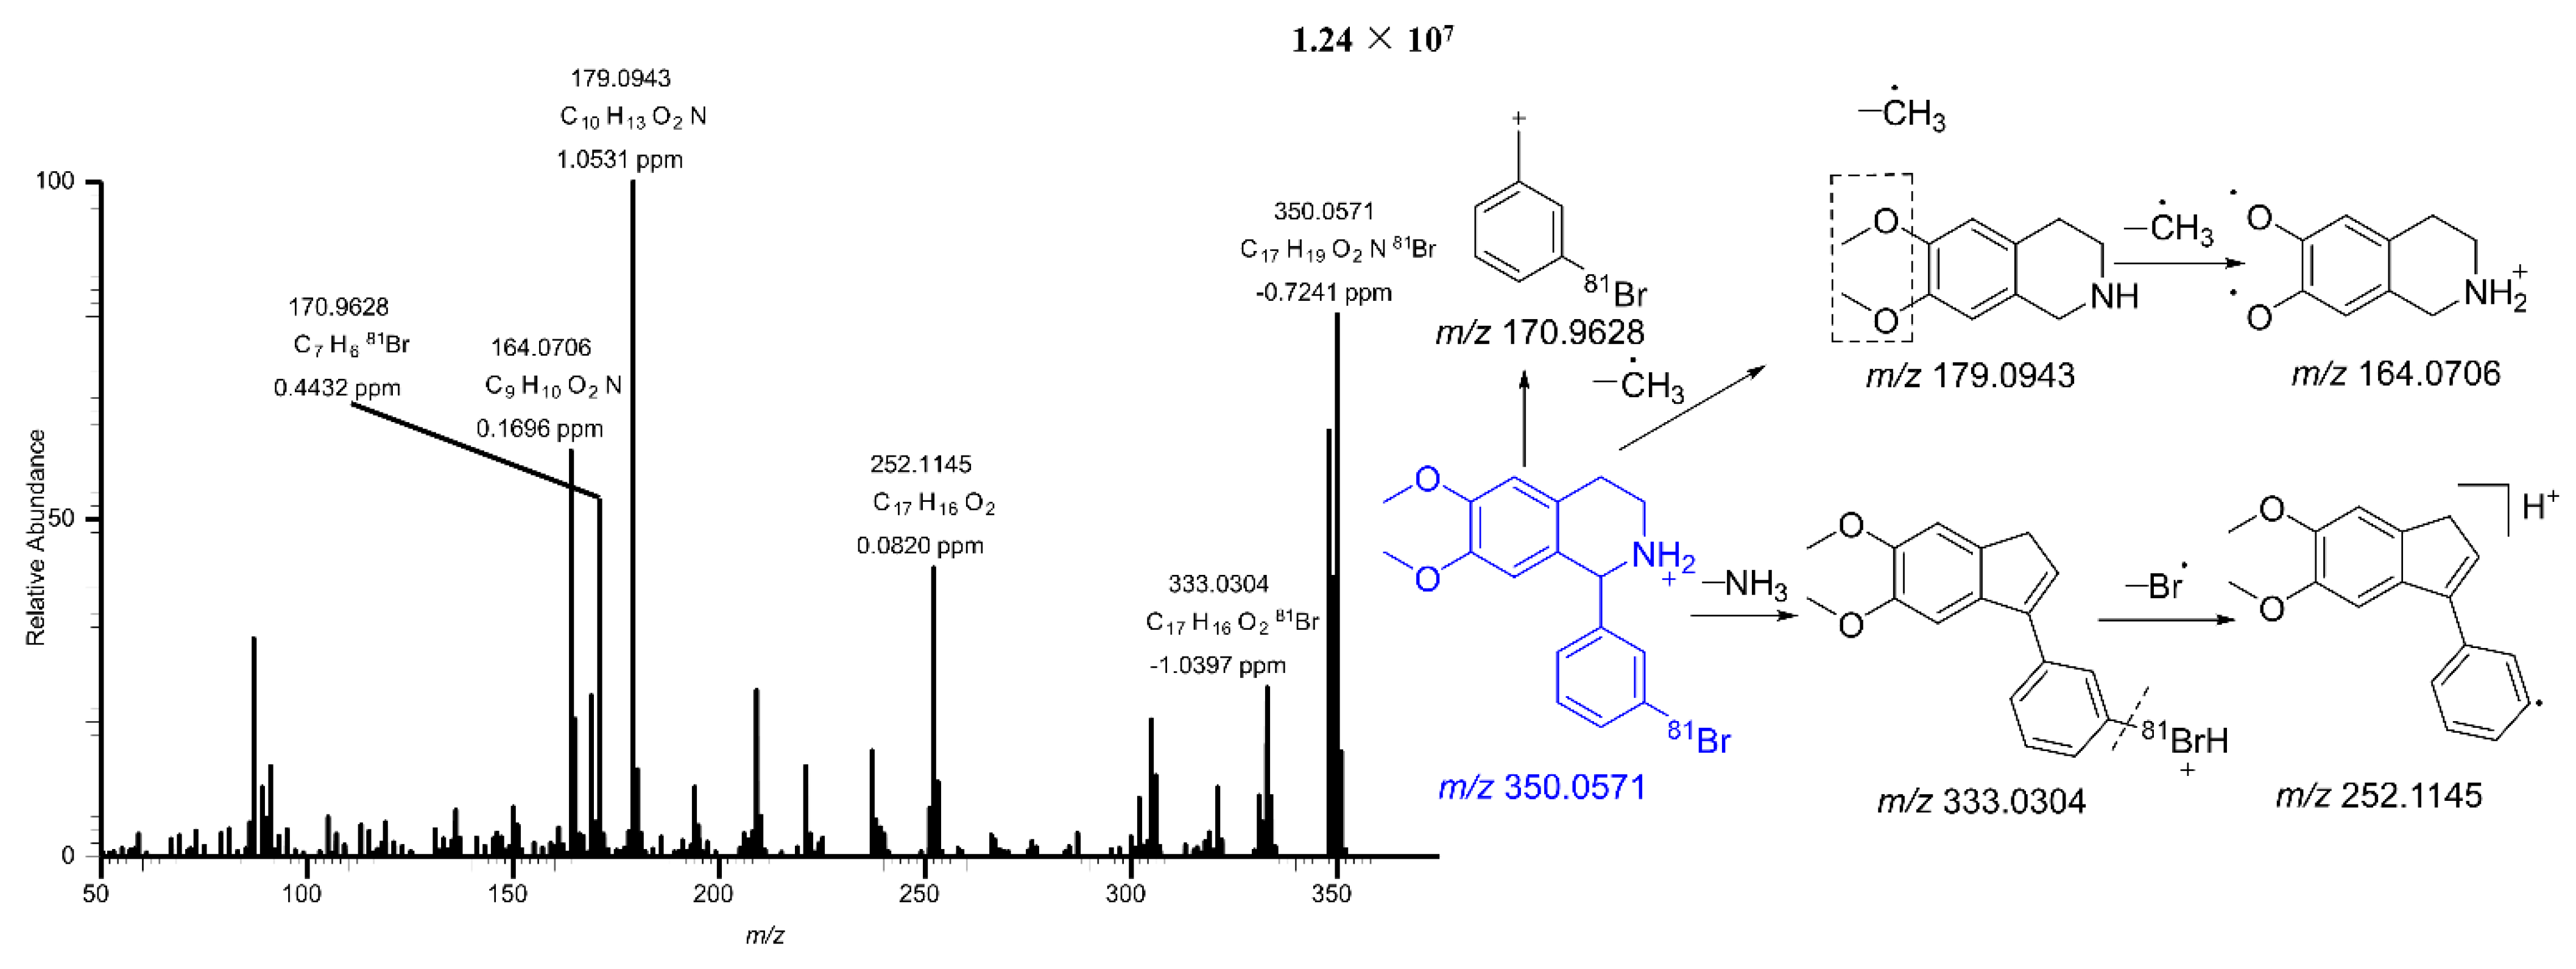
2.2.2. Mass Fragmentation of BH
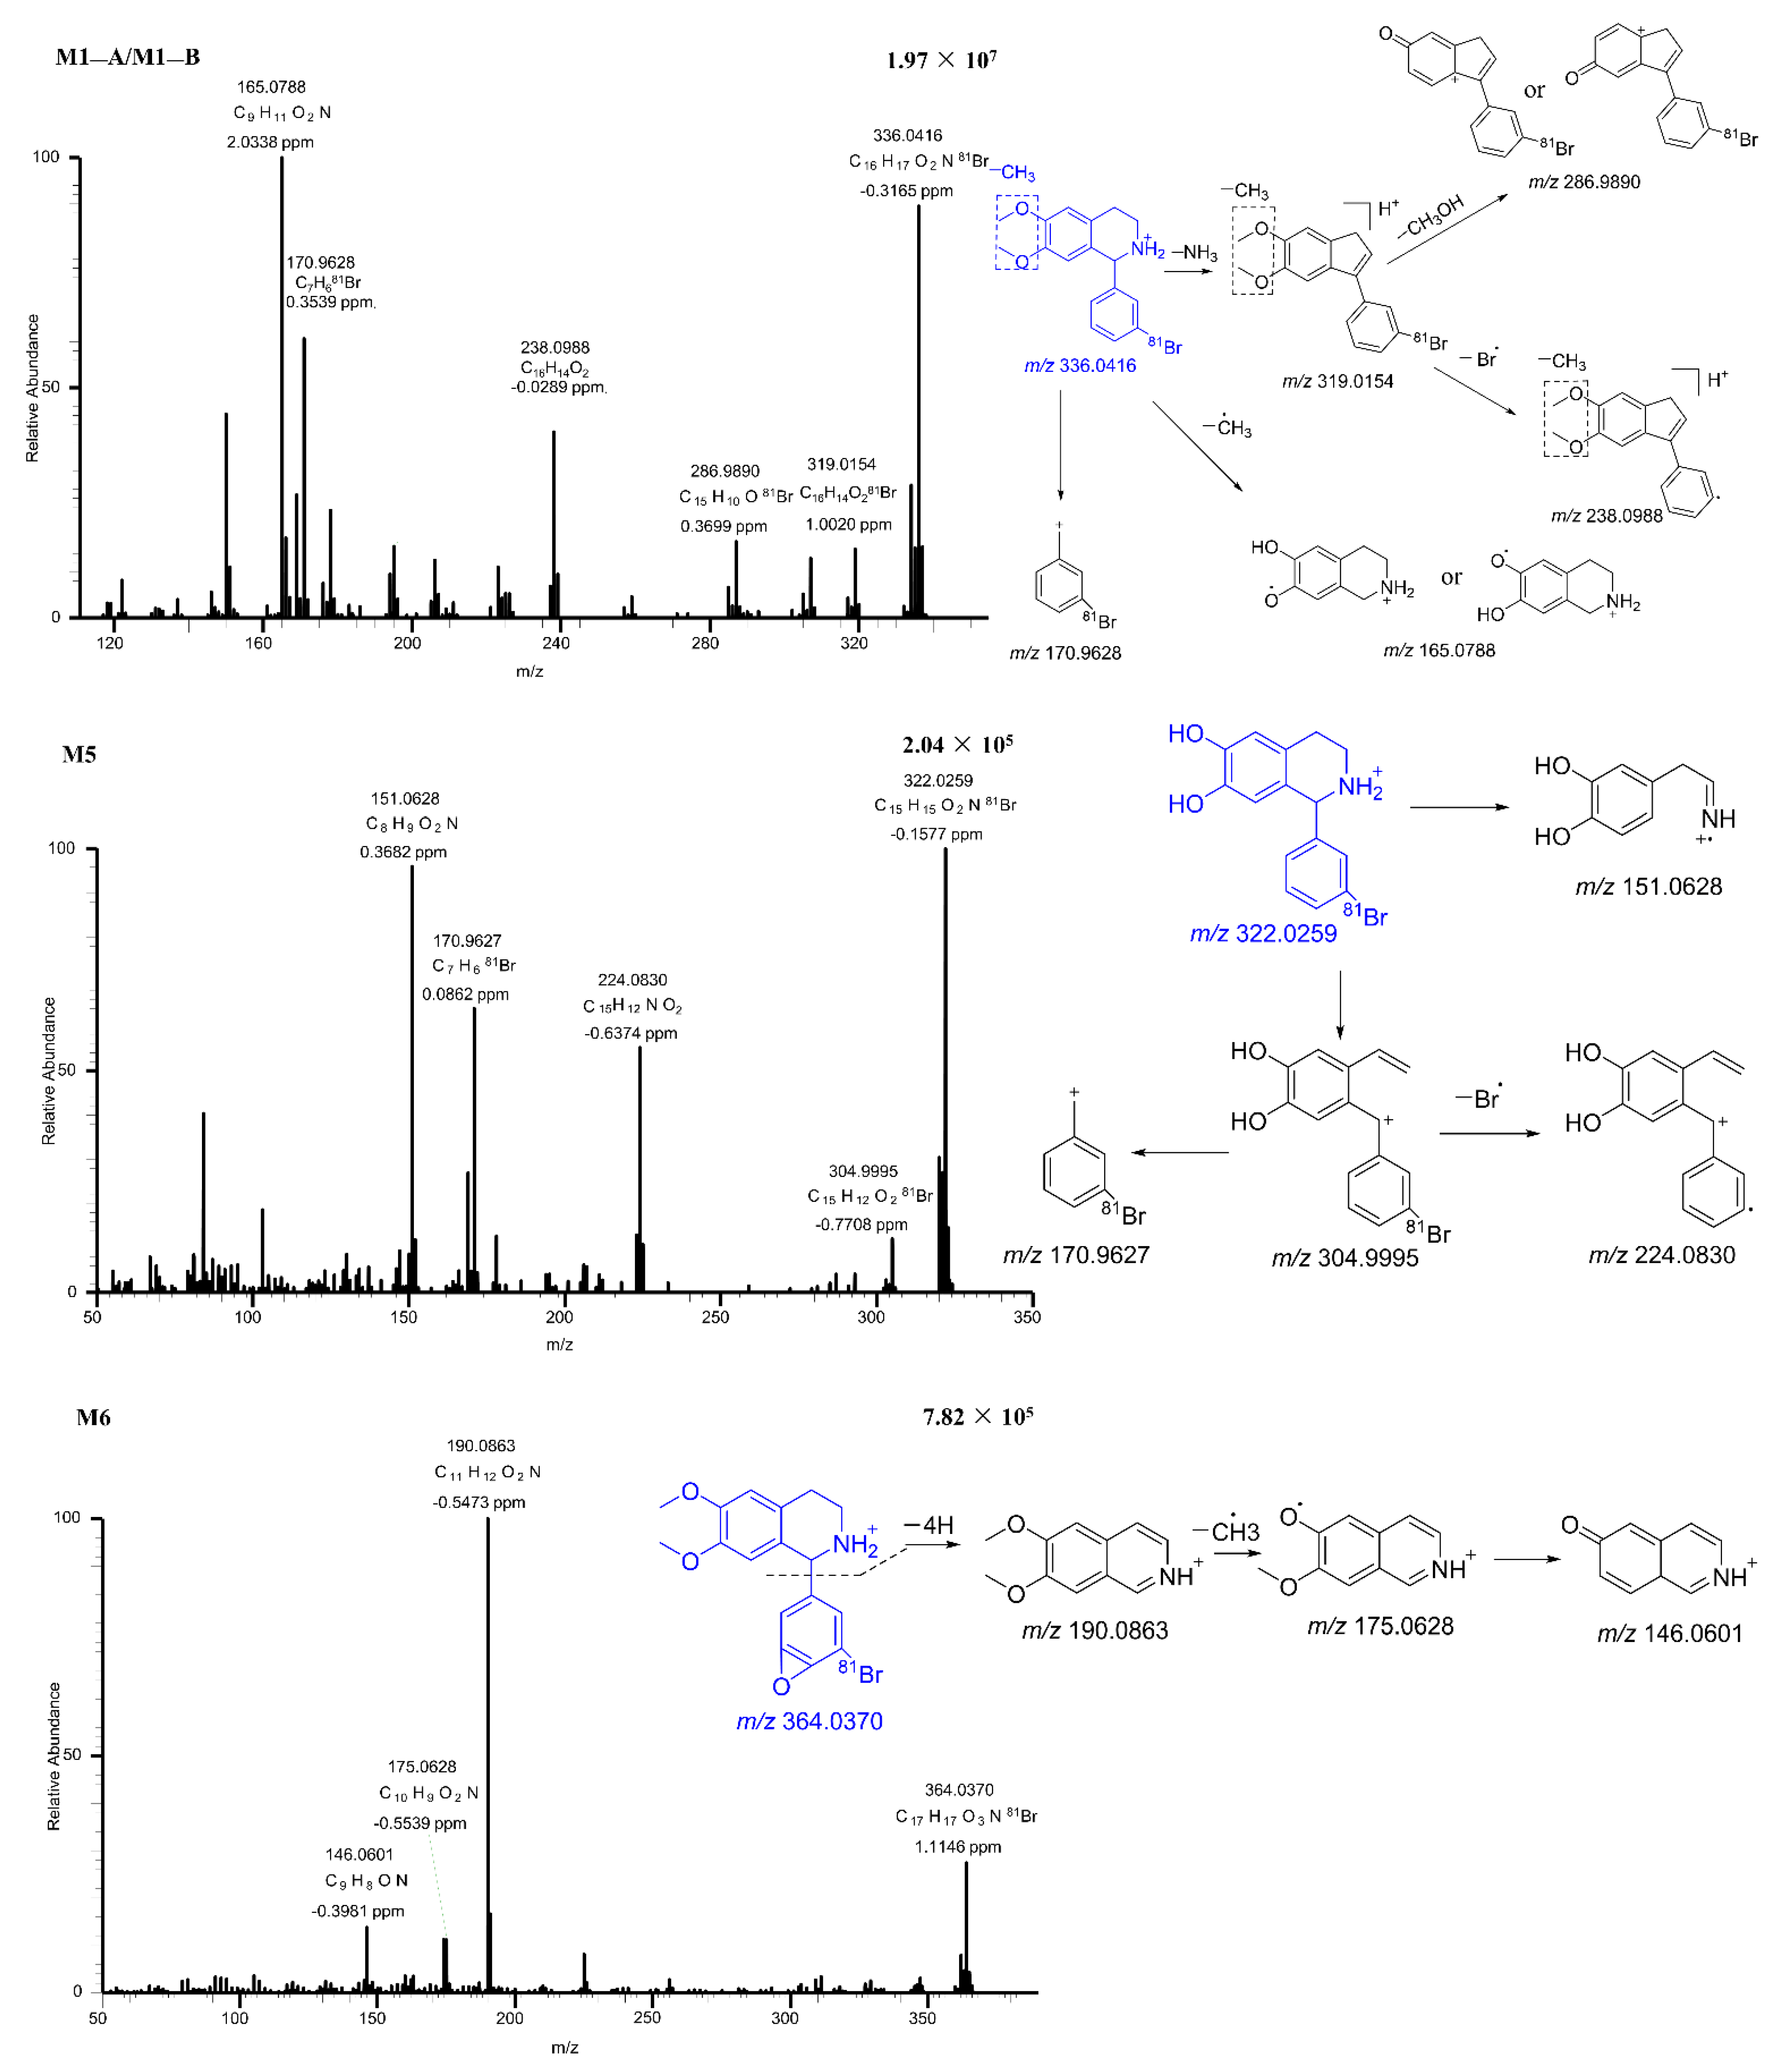
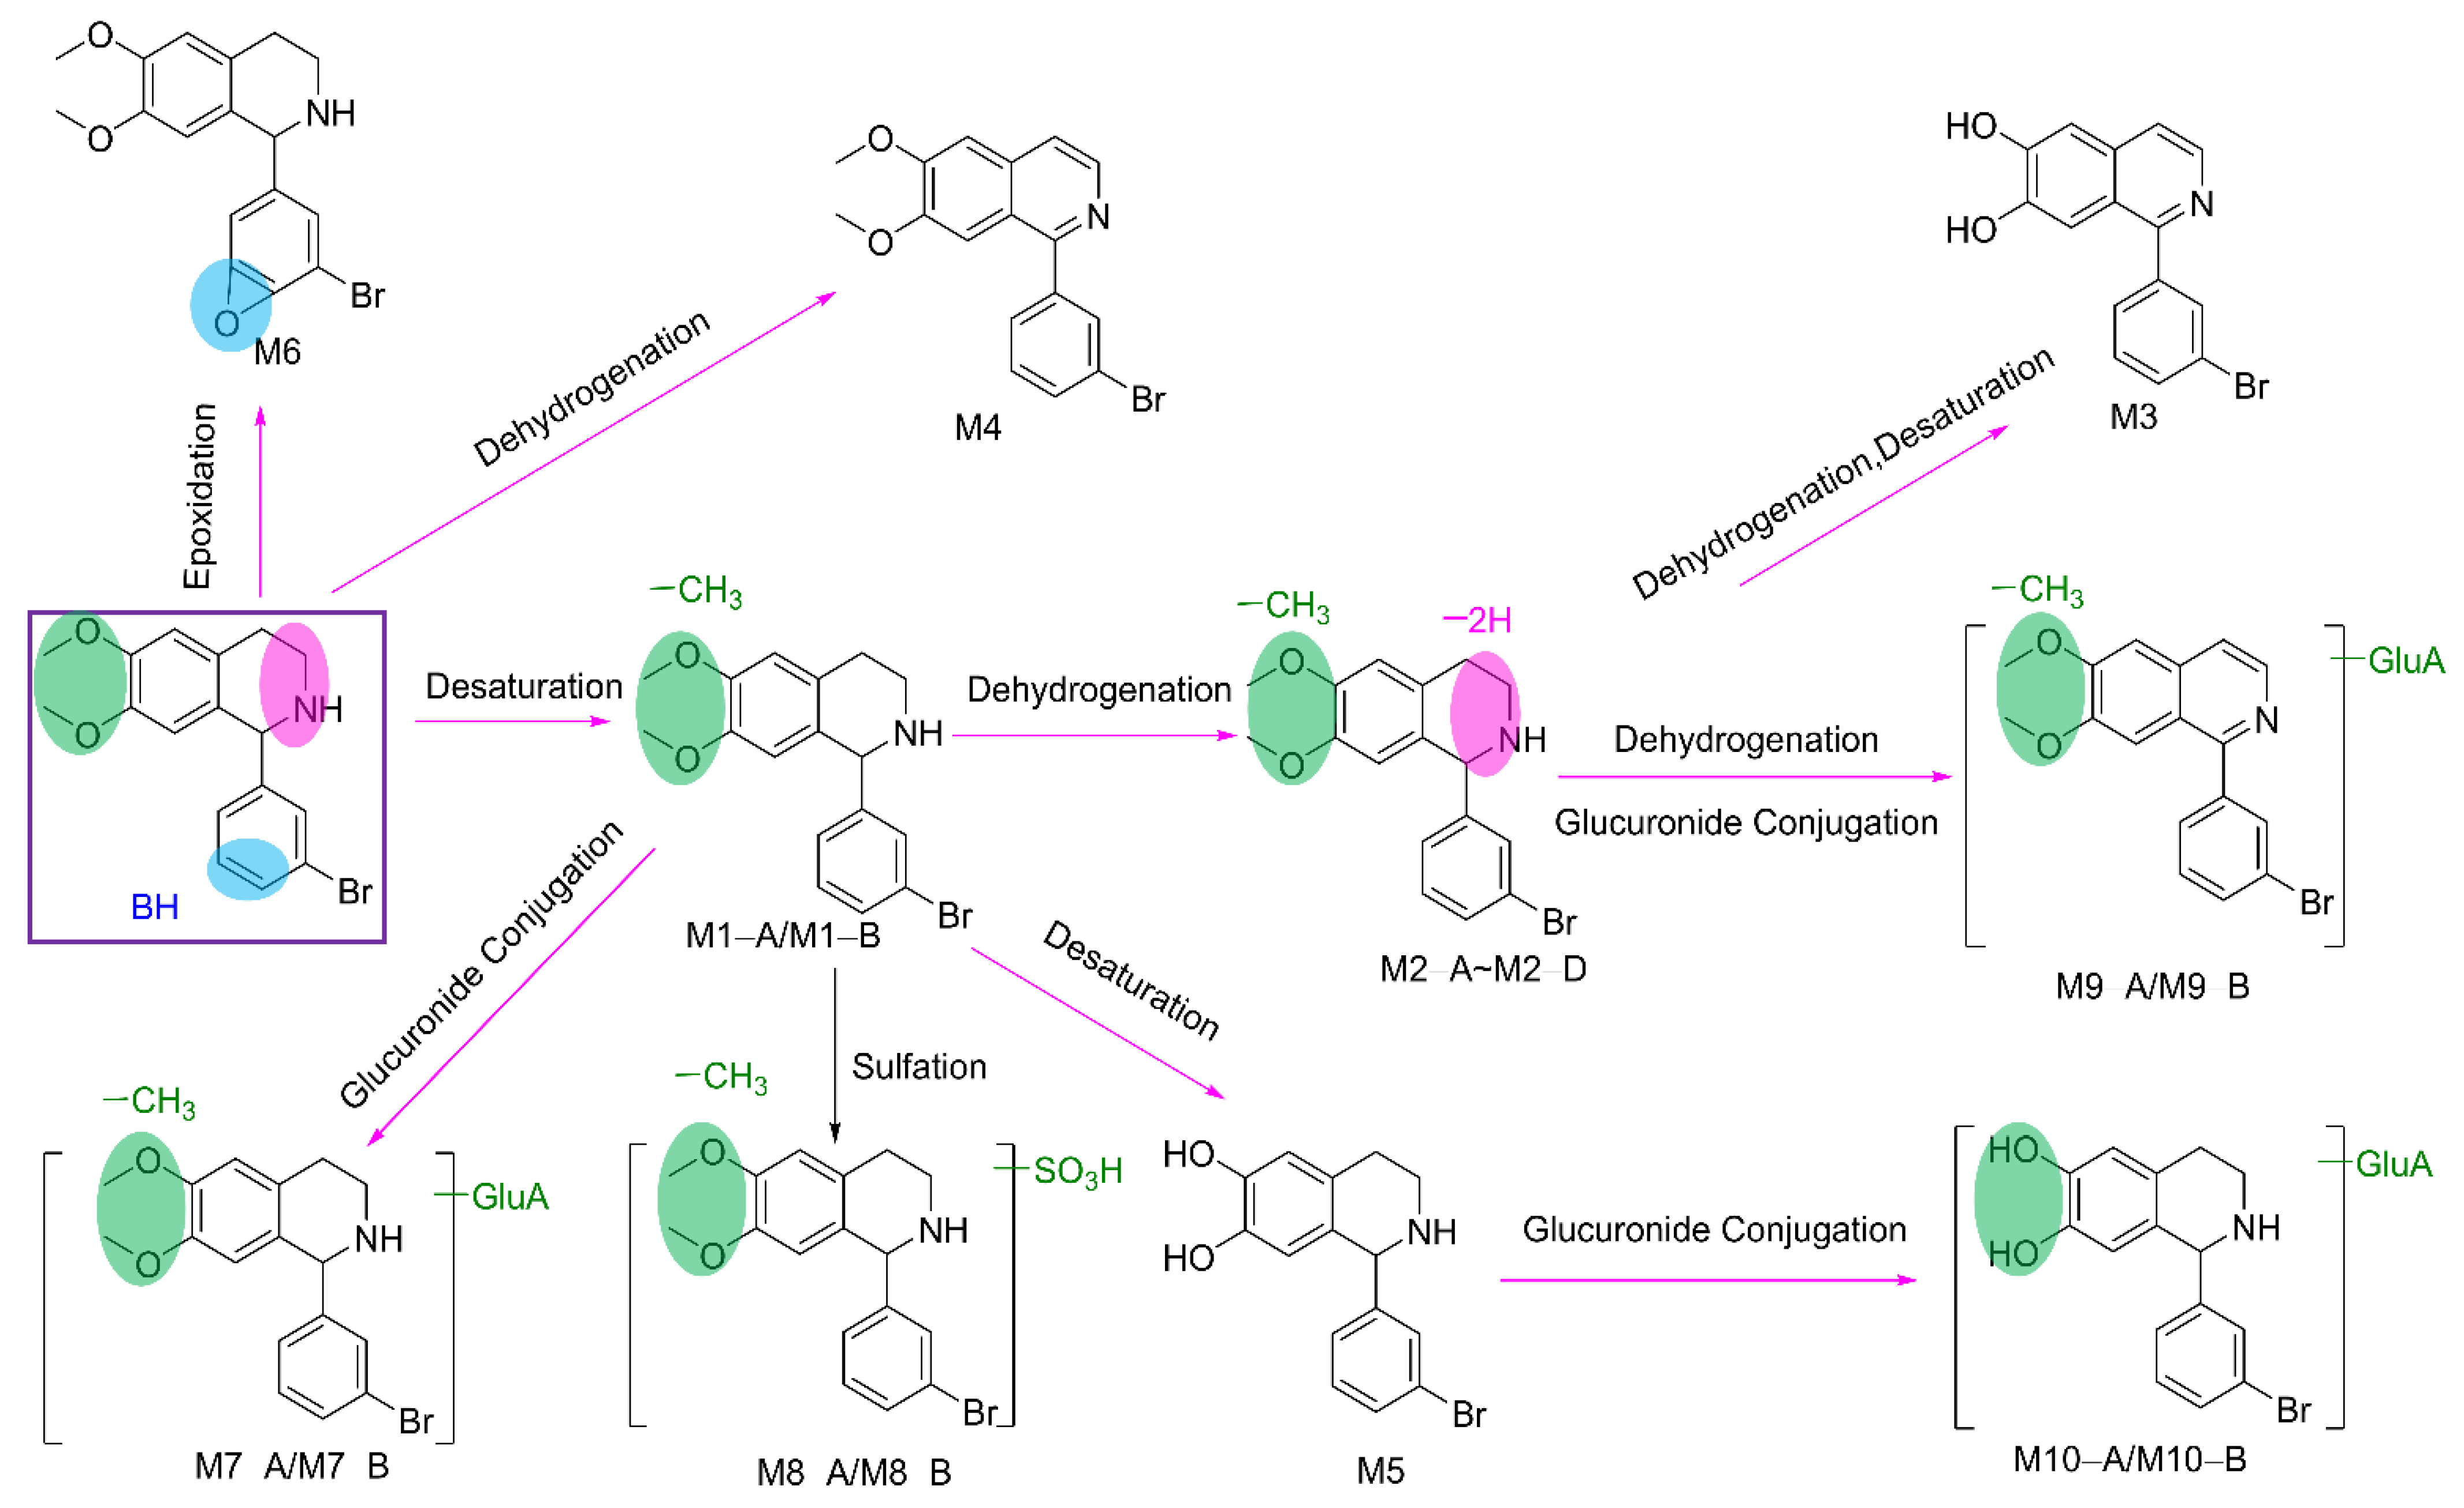
2.2.3. Metabolites of BH
3. Materials and Methods
3.1. Reagents and Chemicals
3.2. Animals and Experiments
3.3. Calibration Standard and Quality Control Samples in Rat Plasma
3.4. Plasma Sample Preparation
3.5. Instruments and UHPLC-MS/MS Conditions
3.6. Method Validation
3.6.1. Specificity
3.6.2. Calibration Curves
3.6.3. Accuracy and Precision
3.6.4. Recovery and Matrix Effect
3.6.5. Stability
3.7. Metabolic Study
3.7.1. In Silico Metabolism Calculation
3.7.2. In Vitro and In Vivo Experiments
4. Conclusions
Supplementary Materials
Author Contributions
Funding
Institutional Review Board Statement
Informed Consent Statement
Data Availability Statement
Conflicts of Interest
References
- Dehghan, M.; Mente, A.; Zhang, X.; Swaminathan, S.; Li, W.; Mohan, V.; Iqbal, R.; Kumar, R.; Wentzel-Viljoen, E.; Rosengren, A.; et al. Associations of fats and carbohydrate intake with cardiovascular disease and mortality in 18 countries from five continents (PURE): A prospective cohort study. Lancet 2017, 390, 2050–2062. [Google Scholar] [CrossRef] [PubMed]
- Report on cardiovascular health and diseases in China 2021: An updated summary. Chin. Health Econ. 2022, 37, 533–578.
- Shi, Y.; Zhang, H.; Huang, S.; Yin, L.; Wang, F.; Luo, P.; Huang, H. Epigenetic regulation in cardiovascular disease: Mechanisms and advances in clinical trials. Signal Transduct. Target. Ther. 2022, 7, 1–28. [Google Scholar] [CrossRef]
- Jacob, V.; Reynolds, J.A.; Chattopadhyay, S.K.; Hopkins, D.P.; Therrien, N.L.; Jones, C.D.; Durthaler, J.M.; Rask, K.J.; Cuellar, A.E.; Clymer, J.M.; et al. Pharmacist interventions for medication adherence: Community guide economic reviews for cardiovascular disease. Am. J. Prev. Med. 2022, 62, E202–E222. [Google Scholar] [CrossRef]
- Roth, G.A.; Mensah, G.A.; Fuster, V. The global burden of cardiovascular diseases and risks. J. Am. Coll. Cardiol. 2020, 76, 2980–2981. [Google Scholar] [CrossRef]
- World Health Organization. World Health Statistics 2022: Monitoring Health for the SDGs, Sustainable Development Goals. Available online: https://www.who.int/publications/i/item/9789240027053 (accessed on 10 October 2022).
- Yi, T.W.; Levin, A. Sex, gender, and cardiovascular disease in chronic kidney disease. Semin. Nephrol. 2022, 42, 197–207. [Google Scholar] [CrossRef] [PubMed]
- Zhang, Y.; Zhai, T.; Chai, P.; Hwang, Y.; Wan, Q. Study on accounting and projection of curative expenditure on cardiovascular and cerebrovascular diseases in China. Chin. Health Econ. 2019, 38, 18–22. [Google Scholar]
- Shaw, L.J.; Goyal, A.; Mehta, C.; Xie, J.; Phillips, L.; Kelkar, A.; Knapper, J.; Berman, D.S.; Nasir, K.; Veledar, E.; et al. 10-Year resource utilization and costs for cardiovascular care. J. Am. Coll. Cardiol. 2018, 71, 1078–1089. [Google Scholar] [CrossRef]
- Hashimoto, K. Arrhythmia models for drug research: Classification of antiarrhythmic drugs. J. Pharmacol. Sci. 2007, 103, 333–346. [Google Scholar] [CrossRef]
- Langenfeld, H.; Weirich, J.; Köhler, C.; Kochsiek, K. Atrioventricular differences in the class I effect of antiarrhythmic drugs (prajmaline,propafenone,quindine). Eur. J. Pharmacol. 1990, 183, 1163. [Google Scholar] [CrossRef]
- Al-Hashimi, M.; Thompson, J.P. Drugs acting on the heart: Anti-arrhythmics. Anaesth. Intensive Care Med. 2012, 13, 374–377. [Google Scholar] [CrossRef][Green Version]
- Dong, H.; Lee, C.M.; Huang, W.L.; Peng, S.X. World Health Organization cardiovascular effects of substituted tetrahydroisoquinolines in rats. Br. J. Pharmacol. 1992, 107, 262–268. [Google Scholar] [CrossRef] [PubMed]
- Dong, H.; Waldron, G.J.; Cole, W.C.; Triggle, C.R. Cardiovascular pharmacology of CPU-23: A novel calcium channel blocker. Cardiovasc. Drug Rev. 1996, 14, 364–379. [Google Scholar] [CrossRef]
- Wu, S.; Yu, X.; Shan, J.; Wong, T.; Chen, C.; Pang, K. Cardiac effects of the extract and active components of radix stephaniae tetrandrae I. Electrically-induced intracellular calcium transient and protein release during the calcium paradox. Life Sci. 2001, 68, 2853–2861. [Google Scholar] [CrossRef] [PubMed]
- Wang, L.-H.; Li, X.-L.; Li, Q.; Fu, Y.; Yu, H.-J.; Sun, Y.-Q.; Zhang, L.; Shan, H.-L. Berberine alleviates ischemic arrhythmias via recovering depressed Ito and ICa currents in diabetic rats. Phytomedicine 2012, 19, 206–210. [Google Scholar] [CrossRef] [PubMed]
- Wang, Y.X.; Zheng, Y.M. Ionic mechanism responsible for prolongation of cardiac action-potential duration by berberine. J. Cardiovasc. Pharmacol. 1997, 30, 214–222. [Google Scholar] [CrossRef]
- Zhu, J.Q.; Zeng, F.D.; Hu, C.J. Prothcive and antiarrhythmic effects of dauricine and verapamil on acute myocardial-infarction in anesthetized dogs. Acta Pharmacol. Sin. 1992, 13, 249–251. [Google Scholar]
- Song, L.-S.; Ren, G.-J.; Chen, Z.-L.; Chen, Z.-H.; Zhou, Z.-N.; Cheng, H. Electrophysiological effects of protopine in cardiac myocytes: Inhibition of multiple cation channel currents. Br. J. Pharmacol. 2000, 129, 893–900. [Google Scholar] [CrossRef] [PubMed]
- Zhurakulov, S.N.; Vinogradova, V.I.; Levkovich, M.G. Synthesis of 1-aryltetrahydroisoquinoline alkaloids and their analogs. Chem. Nat. Compd. 2013, 49, 70–74. [Google Scholar] [CrossRef]
- Jumaev, I.Z.; Jurakulov, S.N.; Usmanov, P.B. The inotropic effect of 1-(4-dimetylaminophenyl)-6,7-dimetoxy-1,2,3,4-tetrahydroisoquinoline (F24). Pharm. J. 2018, 4, 93–97. [Google Scholar]
- Jumayev, I.; Usmanov, P.; Rustamov, S.; Zhurakulov, S. Comparative inotropic effects of the some isoquinoline alkaloids. Biomed. Pharmacother. 2020, 13, 325–333. [Google Scholar] [CrossRef]
- Davies, B.; Morris, T. Physiological-parameters in laboratory-animals and humans. Pharm. Res. 1993, 10, 1093–1095. [Google Scholar] [CrossRef] [PubMed]
- Zaretzki, J.; Matlock, M.; Swamidass, S.J. Xenosite: Accurately predicting CYP-mediated sites of metabolism with neural networks. J. Chem. Inf. Model. 2013, 53, 3373–3383. [Google Scholar] [CrossRef] [PubMed]
- DiMasi, J.A.; Grabowski, H.G.; Hansen, R.W. Innovation in the pharmaceutical industry: New estimates of R&D costs. J. Health Econ. 2016, 47, 20–33. [Google Scholar]
- Paul, S.M.; Mytelka, D.S.; Dunwiddie, C.T.; Persinger, C.C.; Munos, B.H.; Lindborg, S.R.; Schacht, A.L. How to improve R&D productivity: The pharmaceutical industry’s grand challenge. Nat. Rev. Drug Discov. 2010, 9, 203–214. [Google Scholar] [PubMed]
- Kazmi, S.R.; Jun, R.; Yu, M.-S.; Jung, C.; Na, D. In silico approaches and tools for the prediction of drug metabolism and fate: A review. Comput. Biol. Med. 2019, 106, 54–64. [Google Scholar] [CrossRef] [PubMed]
- Hughes, T.B.; Miller, G.P.; Swamidass, S.J. Modeling epoxidation of drug-like molecules with a deep machine learning network. ACS Cent. Sci. 2015, 1, 168–180. [Google Scholar] [CrossRef] [PubMed]
- Dang, N.L.; Hughes, T.B.; Krishnamurthy, V.; Swamidass, S.J. A simple model predicts UGT-mediated metabolism. Bioinformatics 2016, 32, 3183–3189. [Google Scholar] [CrossRef] [PubMed]
- Rydberg, P.; Gloriam, D.E.; Zaretzki, J.; Breneman, C.; Olsen, L. Oxidative medicine and cellular longevity SMARTCyp: A2D method for prediction of cytochrome P450-mediated drug metabolism. ACS Med. Chem. Lett. 2010, 1, 96–100. [Google Scholar] [CrossRef] [PubMed]
- Zaretzki, J.; Rydberg, P.; Bergeron, C.; Bennett, K.P.; Olsen, L.; Breneman, C.M. RS-predictor models augmented with SMARTCyp reactivities: Robust metabolic regioselectivity predictions for nine CYP Isozymes. J. Chem. Inf. Model. 2012, 52, 1637–1659. [Google Scholar] [CrossRef] [PubMed]


| Parameters | Unit | PO (19.2 mg/kg) | IV (1.9 mg/kg) |
|---|---|---|---|
| AUC0–t * | h·(ng/mL) | 1931.81 ± 492.08 | 1810.30 ± 696.02 |
| AUC0–inf * | h·(ng/mL) | 1968.64 ± 479.81 | 1902.34 ± 664.42 |
| MRT0–t * | h | 2.67 ± 0.38 | 1.95 ± 0.62 |
| MRT0–inf * | h | 2.85 ± 0.24 | 2.47 ± 0.86 |
| Tmax * | h | 1.00 ± 0.45 | — |
| T1/2 * | h | 1.62 ± 0.18 | 2.08 ± 1.01 |
| Cmax * | ng/mL | 568.65 ± 122.14 | 905.63 ± 46.99 |
| CL * | mL/h | 1056.47 ± 202.07 | 117.25 ± 43 |
| Vd * | mL | 2484.43 ± 622.32 | 338.12 ± 167.67 |
| F (%) * | 10.6 | ||
| Mouse | Transformations | Fragment Ion | Error (ppm) | Calculated Mass (m/z) | Observed Mass (m/z) | Formula (M+H+) | Retention Time | Metabolites | |||
|---|---|---|---|---|---|---|---|---|---|---|---|
| F * | U * | P * | LM * | ||||||||
| √ | √ | √ | √ | Parent | 333.0304, 252.1145, 179.0943, 170.9628, 164.0706 | 0.2 | 350.0573 | 350.0571 | C17H1981BrNO2 | 28.84 | BH |
| √ | √ | √ | √ | Desaturation | 319.0154, 286.9890, 238.0988, 170.9628, 165.0788 | −0.3 | 336.0417 | 336.0416 | C16H1781BrNO2 | 18.86 | M1−A |
| √ | √ | √ | √ | Desaturation | 319.0156, 286.9886, 238.0987, 170.9627, 165.0787 | 0.1 | 336.0417 | 336.0417 | C16H1781BrNO2 | 20.88 | M1−B |
| √ | √ | √ | √ | Desaturation, Dehydrogenation | 319.0022, 176.0707, 165.0789, 150.0551 | −0.3 | 334.026 | 334.0259 | C16H1581BrNO2 | 15.73 | M2−A |
| √ | √ | √ | √ | Desaturation, Dehydrogenation | 319.0024, 226.0989, 194.0727,176.0707, 161.0473, | −0.7 | 334.026 | 334.0258 | C16H1581BrNO2 | 17.69 | M2−B |
| √ | √ | √ | √ | Desaturation, Dehydrogenation | 319.0023, 301.9997, 238.0859 | −0.3 | 334.026 | 334.0259 | C16H1581BrNO2 | 22.82 | M2−C |
| √ | √ | √ | √ | Desaturation, Dehydrogenation | 319.0024, 301.9998, 238.0858 | −0.3 | 334.026 | 334.0259 | C16H1581BrNO2 | 24.38 | M2−D |
| √ | √ | √ | √ | Desaturation, Desaturation, Dehydrogenation, Dehydrogenation | 236.0706, 160.0394 | −1.0 | 317.9947 | 317.9944 | C15H1181BrNO2 | 31.6 | M3 |
| √ | √ | √ | √ | Dehydrogenation, Dehydrogenation | 329.9948, 301.9987 | 2.1 | 346.026 | 346.0273 | C17H1581BrNO2 | 32.72 | M4 |
| √ | √ | √ | √ | Desaturation, Desaturation | 304.9995, 224.0830, 170.9627, 151.0628 | −0.2 | 322.026 | 322.0259 | C15H1581BrNO2 | 16.52 | M5 |
| √ | √ | √ | √ | Epoxidation | 190.0863, 175.0628, 146.0601 | 1 | 364.0366 | 364.037 | C17H1781BrNO3 | 18.64 | M6 |
| √ | √ | × | √ | Desaturation, Glucuronide Conjugation | 336.0454, 319.0151, 286.9885, 238.0988, 170.9627, 165.0788, | −0.2 | 512.0738 | 512.0737 | C22H2581BrNO8 | 15.14 | M7−A |
| √ | √ | × | √ | Desaturation, Glucuronide Conjugation | 336.0416, 319.0148, 286.9885, 238.0988, 170.9627, 165.0787, | −0.2 | 512.0738 | 512.0742 | C22H2581BrNO8 | 15.64 | M7−B |
| √ | √ | × | × | Desaturation, Sulfation | 336.0416, 319.0148, 286.9890, 238.0987, 170.9627, 165.0787, | 0.4 | 415.9985 | 415.9984 | C16H1781BrNO5S | 18.87 | M8−A |
| √ | √ | × | × | Desaturation, Sulfation | 336.0415, 319.0161, 286.9885, 238.0988, 170.9628, 165.0788, | 0.1 | 415.9985 | 415.9991 | C16H1781BrNO5S | 20.83 | M8−B |
| √ | √ | × | √ | Desaturation, Dehydrogenation, Dehydrogenation, Glucuronide Conjugation | 332.0105, 316.9866 | −1.8 | 508.0421 | 508.0414 | C22H2181BrNO8 | 11.7 | M9−A |
| √ | √ | × | √ | Desaturation, Dehydrogenation, Dehydrogenation, Glucuronide Conjugation | 332.0103, 316.9867 | 1 | 508.0421 | 508.0437 | C22H2181BrNO8 | 18.61 | M9−B |
| × | √ | × | √ | Desaturation, Desaturation, Glucuronide Conjugation | 332.0260, 304.9990, 224.0832, 170.9628, 151.0628 | −1.7 | 498.0581 | 498.0572 | C21H2381BrNO8 | 9.79 | M10−A |
| × | √ | × | √ | Desaturation, Desaturation, Glucuronide Conjugation | 322.0259, 304.9997, 224.0830, 170.9627, 151.0628 | 0.2 | 498.0581 | 498.0582 | C21H2381BrNO8 | 12.11 | M10−B |
Publisher’s Note: MDPI stays neutral with regard to jurisdictional claims in published maps and institutional affiliations. |
© 2022 by the authors. Licensee MDPI, Basel, Switzerland. This article is an open access article distributed under the terms and conditions of the Creative Commons Attribution (CC BY) license (https://creativecommons.org/licenses/by/4.0/).
Share and Cite
Xi, R.; Abdulla, R.; Zhang, M.; Sherzod, Z.; Ivanovna, V.V.; Habasi, M.; Liu, Y. Pharmacokinetic Study and Metabolite Identification of 1-(3′-bromophenyl)-heliamine in Rats. Pharmaceuticals 2022, 15, 1483. https://doi.org/10.3390/ph15121483
Xi R, Abdulla R, Zhang M, Sherzod Z, Ivanovna VV, Habasi M, Liu Y. Pharmacokinetic Study and Metabolite Identification of 1-(3′-bromophenyl)-heliamine in Rats. Pharmaceuticals. 2022; 15(12):1483. https://doi.org/10.3390/ph15121483
Chicago/Turabian StyleXi, Ruqi, Rahima Abdulla, Miaomiao Zhang, Zhurakulov Sherzod, Vinogradova Valentina Ivanovna, Maidina Habasi, and Yongqiang Liu. 2022. "Pharmacokinetic Study and Metabolite Identification of 1-(3′-bromophenyl)-heliamine in Rats" Pharmaceuticals 15, no. 12: 1483. https://doi.org/10.3390/ph15121483
APA StyleXi, R., Abdulla, R., Zhang, M., Sherzod, Z., Ivanovna, V. V., Habasi, M., & Liu, Y. (2022). Pharmacokinetic Study and Metabolite Identification of 1-(3′-bromophenyl)-heliamine in Rats. Pharmaceuticals, 15(12), 1483. https://doi.org/10.3390/ph15121483